1
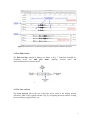
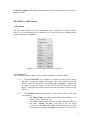
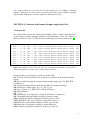
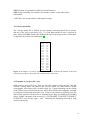
SDX - Seismic Data eXplorer User’s Manual CONTENTS CONTENTS ......................................................................................................................................... 2 INTRODUCTION ............................................................................................................................... 3 SECTION 1: INSTALLATION OF SDX ........................................................................................... 3 SECTION 2: SDX USER GUIDE ....................................................................................................... 4 2.1 INITIATING SDX .......................................................................................................................................... 4 2.2 THE EDIT TOOL BAR ................................................................................................................................... 5 2.3 THE VIEW TOOL BAR .................................................................................................................................. 5 2.4 STARTING A NEW PROJECT AND IMPORTING DATA ............................................................................... 6 2.5 LOADING A SEISMOGRAM ........................................................................................................................... 7 2.6 SELECTING TIME PERIODS ......................................................................................................................... 7 2.7 NAVIGATING BETWEEN STATIONS ........................................................................................................... 7 2.8 ADDING, MODIFYING AND DELETING PICKS ............................................................................................ 8 2.9 SCALING THE TRACE DISPLAY ................................................................................................................... 9 2.10 ASSOCIATION OF PICKS INTO EVENTS ................................................................................................... 9 2.11 LOCATING AND REVISING AN EVENT ..................................................................................................... 9 SECTION 3: SDX MENUS .............................................................................................................. 10 3.1 FILE MENU ................................................................................................................................................ 10 3.1.1 Preferences .......................................................................................................................................... 10 3.1.2 Import .................................................................................................................................................... 11 3.1.3 Export ..................................................................................................................................................... 12 3.1.4 ArcLink .................................................................................................................................................. 12 3.2. EDIT MENU ............................................................................................................................................... 13 3.2.1 Picks ........................................................................................................................................................ 13 3.2.2 Events ..................................................................................................................................................... 14 3.2.3 Map ......................................................................................................................................................... 16 3.2.4 Contents ................................................................................................................................................ 16 3.3 VIEW MENU ............................................................................................................................................... 16 SECTION 4: CONTENTS AND FORMATS OF INPUT AND PROJECT FILES ..................... 17 4.1 STATIONS FILE .......................................................................................................................................... 17 4.2 VELOCITY MODEL FILE ............................................................................................................................ 18 4.3 EXAMPLE OF A PROJECT FILE (.SDX) ..................................................................................................... 18 LIST OF SHORTCUTS .................................................................................................................... 20 QUICK START GUIDE FOR EVENT LOCATION ...................................................................... 21 BIBLIOGRAPHY ............................................................................................................................. 22 2 Introduction SDX (Seismic Data eXplorer) is a data visualization and analysis tool deigned for the examination of seismic waveforms at the University of Liverpool, UK. It is a Qtbased application conceptually split into two parts: - A GUI interface for the control and visualisation of the application. - A processing framework executed by plugins. Besides the visualisation and analysis of seismograms, manual picking of seismic arrivals can be done and earthquake location is performed through the implementation of the hypo71 code (Lee and Lahr, 1972). A great advantage of SDX is that project files are ASCII-based for convenience, therefore these files can be manually edited with any text editor such as vi, KWrite or gedit. SECTION 1: Installation of SDX As Qt-based application, SDX requests several libraries from Qt development package. Currently SDX only supports Linux-based operating system. Two SDX installation methods are provided. First we build SDX executable file with Qt static libraries. This SDX file can be called directly without Qt installation. We build SDX executable file under ubuntu 10.04 32bit operating system, but it also works under ubuntu 10.04 64bit and openSuSE 11.3 32/64bit in addition ubuntu 10.04 32bit after our initial testing. This SDX executable file can be downloaded from http://doree.esc.liv.ac.uk:8080/sdx/bin/SDX. Please note this link is not permanent, it may change later. Although SDX executable file integrates with Qt static libraries, some operating system dynamic libraries are requested. These dynamic libraries cover X Window libraries, dynamic linking libraries, real-time extensions libraries, threads library and c++ libraries. When you run SDX file, if the following libraries are required, please contact with your system administrator to install. The dynamic libraries required by SDX are: libXext, libX11, libdl, librt, libpthread, libstdc++, libm, libgcc_s, libc, libxcb, libXau and libXdmcp. But if you are developer and want to edit SDX source code, then you can download Qt development package and SDX source code package. The SDX source code can be edited under Qt Software Development Environment. But this is out of range of this manual. SDX developer manual may be written and cover this content. 3 SECTION 2: SDX User Guide 2.1 Initiating SDX Once installed, type ‘SDX’ in a terminal window. The Overview Screen of SDX should appear as in Fig. 1. If the Overview Screen does not appear, it can be activated by toggling on in View>Overview Screen. Figure 1. Overview screen also showing the SDX menus, Edit tool bar and View tool bar. The first line of the Overview Screen contains the main menus of SDX: File, Edit, View, Plugins and Help. The second line contains two tool bars: the Edit tool bar and the View tool bar. In order to interact with seismograms, we must activate the Production Screen. This can be done by toggling on in View>Production Screen. The Production Screen contains three panes (Fig. 2): Overview, Station, and Station Zoom. The three different panes basically offer three zoom levels to the data, being the Station Zoom pane the only one where the phase picking can be performed. The relative size of each pane can be modified by dragging upwards/downwards the horizontal separator between panes (Fig. 2). For example, the Station pane can be closed by dragging the horizontal separator between the Station and Station Zoom panes upwards until it meets the next horizontal separator above. The Station pane can be opened again by reversing the same operation. 4 Figure 2. Production screen showing the three different panes and time span box. 2.2 The Edit tool bar The Edit tool bar contains 4 buttons as shown in Fig. 3. Functions included are switching on/off the Add pick mode, aligning selected picks and associate/disassociate selected picks. Figure 3. Buttons in the Edit tool bar 2.3 The View tool bar The View tool bar allows the user to directly access some of the display options offered by SDX. These options include (Fig. 4): navigating between stations, scaling the trace display, applied filters, etc. 5 Figure 4. Buttons in the View tool bar 2.4 Starting a new project and importing data Click on File>New or use the shortcut Ctrl+N to open a new project. In order to load seismic data to the project, import the seismograms by clicking on File>Import and then Miniseed to import individual miniseed files, or Folder of miniseed to import a folder containing the desired miniseed files. It is also possible to import data through an ArcLink server (please see section 3.1.4 for details). In order to import a velocity model, click on File>Import>Velocity model and then browse the velocity model file. To import a list of seismic stations, go to File>Import>Stations and then select the stations file. See the files format section for details on the required format for input files. At the beginning it is also important to set the path to the executable file of hypo71 on the General tab in File>Preferences>General as shown in Fig. 5. Figure 5. Preferences’ General tab highlighting in red the location path of the hypo71 executable file. 6 2.5 Loading a seismogram Currently there are 3 seismogram formats accepted in SDX: mini-seed, Liverpool format and ISF format. Seismic records can be loaded in File>Import and then the correspondent format. In the case of mini-seed files, it is possible to import them as individual files or as a folder containing the files. 2.6 Selecting time periods Selecting a time period in the Overview pane controls the amount of the waveforms shown in the Station pane. Similarly, selecting a time period in the Station pane controls the waveforms shown in the Station Zoon pane. If the Station pane is closed, then changing the time period in the Overview pane directly controls the amount of the waveforms shown in the Station Zoom pane. To select a time period in the Overview or Station panes, use the time span box. This is a rectangular box with green handles that can be resized to control the relevant time period (see Fig. 2). Click inside the time span box to make the green handles appear. Drag either handle to the left or right to alter the total time spanned. If the time span box is selected, the mouse pointer can be positioned inside the box and click-dragged to move the box. Again, if the time span box is selected, small adjustments can be made to its position with the left & right arrow key, and the width of the span can also be adjusted using the keys combinations ‘Shift + <’ and ‘Shift + >’. Pressing the ‘Page Up’ or ‘Page Down’ keys moves the selected time span box by half its width. To alter the span of waveform shown within the Station Zoom pane directly, rightclick the mouse with the pointer inside the Station Zoom pane and drag to create a rectangle. When the mouse button is released, the length and position of the waveform shown in the pane is defined by the selection rectangle. To return to the previous time span press the ESC key. The waveform display in the Station Zoom pane can be moved forward or backward in time in small steps by pressing ‘CTRL + Right Arrow’ or ‘CTRL + Left Arrow’. 2.7 Navigating between stations It is only possible to navigate between stations when the Production screen is toggled on in the View menu. The green arrowhead icons in the View tool bar (Fig. 6) can be used to navigate between consecutive stations in the order the are shown in the Overview pane. The order of the stations can be changed by using the Sort overview option in the View menu (see below). It is also possible to directly access a station by double-clicking on a trace belonging to the required station in the Overview pane (e.g. at the position shown by the blue circle in Fig. 6). The arrowhead icons can then be used as normal. A disabled arrowhead icon indicates that the end (or beginning) of the station list has been reached. 7 Figure 6. Green arrowhead icons in View tool bar (red circles). 2.8 Adding, modifying and deleting picks Picks can be added to a project by left-clicking on a waveform in the Station Zoom pane when SDX is in the Add pick mode. To enter this mode, either toggle the Add pick mode control on in the Edit menu, switch on the Add pick mode button in the Edit tool bar, or use the keyboard shortcut ‘CTRL + K’. To exit the Add pick mode reverse the toggle operation. When a new pick has been added to a trace, the pick is automatically selected. The new pick’s attributes (e.g. onset, polarity, weight, phase name) are automatically set to be the same as those of the last pick to be edited, but can be modified by keyboard shortcuts or the Pick Properties Editor (Fig. 12). One or more picks can be selected by multi-select (‘CTRL + left-click’ on multiple objects) or by left-clicking and dragging the selection rectangle over multiple objects. The position of the pick(s) can be modified by dragging the selected picks in the Station Zoom pane with the left mouse button pressed or by using the left & right arrow keys. As a selected pick moves, the label that normally denotes the pick’s attribute set changes to display the current time position and amplitude of the waveform at this position. To delete one or more picks, select the picks and press the ‘Delete’ key. The attributes of a newly added pick, or a selected pick, can be modified either by using a variety of keyboard shortcuts or the Pick Properties Editor (see section 3.2.1 and Fig. 12). To display the Pick Properties Editor either double click on a pick with the left mouse button or click on the menu Edit>Picks. Picks are displayed in all three panes. New picks can only be added in the Station Zoom pane. Pick properties can also be modified in the Overview pane (but the position cannot). Picks can also be deleted from either of these two panes. TIP: When selecting picks in the Overview pane, it may be necessary to move the time span tool to one side to allow access to the pick objects. TIP: Pick the phase arrivals only in one component per station, for example, in the vertical component. 8 2.9 Scaling the trace display The waveform display can be scaled independently of the time span box in either the Overview pane or the Station Zoom pane. Scaling in the Overview pane is controlled by the two combo-boxes in the View toolbar (Fig. 4). The left combo controls horizontal scale and the right controls vertical scale. Either select a pre-set percentage scale or type a value into the text input part of the combo-box and press ‘Return’. Scaling in the Station Zoom pane is controlled by shortcut keys (see the shortcuts section below). The relevant keys are F1, F2, F3 (horizontal) and F5, F6, F7 (vertical) and the ESC key which resets all scaling in the Station Zoom pane. Scales increase or decrease by a factor of two each time a key is pressed. TIP: If a pick is selected in the Station Zoom pane then its position is used as the origin for the horizontal scaling (i.e. the pick remains stationary and the waveform expands or contracts around it). If no pick is selected then the horizontal scaling has its origin in the centre of the Station Zoom pane. 2.10 Association of picks into events To create a new event, click on Edit>Events. This will open the Event Editor window (Fig. 13) where then you can click on Create new event. Picks selected in the Overview or Station Zoom panes can be used to create a new event or may be associated with an existing event. Picks already associated with an event can be disassociated. The controls for association and disassociation are the ‘+’ and ‘-‘ buttons in the Edit tool bar (see Fig. 3). To associate pick with an event, select one or more picks by rubber-banding (left-mouse click and drag to create a rectangular band). If the picks are not currently associated with an event, the ‘+’ button becomes enabled. Press the ‘+’ button to show the Event Editor window and select one of the two buttons to ‘Create new event (include selected picks)’ or ‘Associate picks with existing event’. When the picks are associated they change colour in the window panes to reflect the colour of the event they belong to. To disassociate picks from an event, rubber-band around already associated picks in the Overview pane and click the ‘-‘ button. 2.11 Locating and revising an event To open the Event Properties window (Fig. 14), double-click on the name of an event in the Event Editor window’s list. If the colour of the event is changed (by clicking the colour button) the new colour is propagated to the picks in the panes. If one or more picks entries are selected in the Event Editor window, and the ‘Remove’ button clicked, these picks are disassociated in the same way as with the ‘-‘ button above, and these picks’ colour revert to the “unassociated” colour. The “unassociated” pick colour can be defined on the ‘Fonts and Colours’ tab on File>Preferences. In order to locate an event, it is necessary to define the path to the hypo71 executable file in Preferences and to have imported a velocity model and a stations list (see Section 3 for format details). Once in the Event Properties window, and given a list of selected picks in the Picks panel (see Fig. 14), click on the ‘Relocate’ button to locate the event. The event’s information will be automatically updated in the Event 9 Properties window, and additional information such as status and notes can also be added manually. SECTION 3: SDX Menus 3.1 File Menu The File menu contains the basic commands such as Preferences, Import, Export, Save File, etc. Following there is a detailed review of the File menu’s commands that might need further explanation. Figure 7. List of commands found in the File menu. 3.1.1 Preferences The Preferences menu contains all the options available to customize SDX. 3.1.1.1 In the General tab, it is possible to set the user name, agency name and time of automatic backup if desirable. Also in the General tab is the field to set the location path for the plugins and the hypo71 executable file. In order to locate an event, we must specify the location path of the Hypo71 executable file in the General tab of the Preferences menu as seen in Fig. 5. 3.1.1.2 The Defaults tab contains options to edit phases names, filters and uncertainties. • The Phase Name correspond to the phase arrival name, i.e. Pwave, S-wave, PKP-wave, etc. • The Filters panel contain all the available frequency filters in the form [ lcf-hfc, ns, zph ] where lcf is the low cutoff frequency in Hz, hcf is the high cutoff frequency in Hz, ns is the number of sections, and zph correspond to Z in case of a 10 • 3.1.1.3 zero phase filter or any other character for a non-zero phase filter. In this pane, new filters can be added or deleted by using the buttons + and – respectively. The Weight/Uncertainty panel shows the weights assigned to the phase picking, understood as the uncertainty in seconds of the picking. Weight are 0, 1, 2, 3 and 4 being 0 the best quality with the lowest uncertainty. In this pane the time uncertainty can be changed to the value desired for each weight. In the Fonts and Colours tab it is possible to configure the fonts and colour of the phase picks, trace, etc. Figure 8. Defaults tab in the Preferences menu showing the Phases, Filters and other customizable options in SDX. 3.1.2 Import The Import command allows to import seismic data, stations information and a velocity model into the current SDX project. The accepted seismic formats in SDX are: miniseed, ISF, and Liverpool(?) format. For example, in order to import a folder containing miniseed files for an event, click on File>Import>Folder of miniseed and then select the desired folder. The command Import also allows to import picks files to the data in the formats SDX and MS Picker, and to import events in the formats Binder and Pha(?). Finally, it is 11 also possible to import a stations file and a velocity model file by using this command (see required formats in the Input Files Format section). 3.1.3 Export This command allows to export picks in the current project to a file in the format SDX and Binder. Also it is possible to export the current event into a Binder event file. 3.1.4 ArcLink ArcLink is a real-time data transfer protocol developed by the Helmholtz-Centre Potsdam, Germany, to transfer seed and miniseed data files. ArcLink is implemented in SDX and can be accessed by clicking on File>ArcLink. Three options are available: Check Inventory, Simple Request and Complex Request. In Check Inventory you can access to the available data list provided by a given server. You need to input the host name (e.g. webdc.eu) and communication port (e.g. 18001) in order to access to the archive. The inventory information includes network code, station code, description and start and end time for each available station. The Simple Request mode is used to import data through ArcLink by using a simple and friendly interface. This mode is directed to the user that is not familiarised with the ArcLink protocol. Only one station per request can be imported. The form is shown in Fig. 9. The user must fill the necessary information in order to download the data. Figure 9. ArcLink Simple Request form. ArcLink-familiarised users are encouraged to import data by using the Complex Request mode. In it the user must enter the correspondent request script describing the desired data. In this mode, more than one station can be downloaded at the same time. An example of the Complex Request mode is shown in Fig. 10. For more information about the ArcLink protocol, please visit the website: http://www.seiscomp3.org/wiki/doc/applications/arclink. 12 Figure 10. ArcLink Complex Request form. 3.2. Edit Menu The Edit menu allows to amend data such as pick properties, event information, velocity model, stations information, visualization of the stations map, etc. Following there is a description of each one of the commands present in the Edit menu. Figure 11. Edit menu commands 3.2.1 Picks Here it is possible to amend the selected pick’s properties such as phase name, polarity, weight, etc. Most of these properties can also be directly set in the Add pick mode (see section 2.8 and shortcuts section). 13 Figure 12. Pick properties editor window. 3.2.2 Events The Event Editor allows to create, delete or amend an event given a selection of travel-time picks. Here is where the location of the event is performed. Figure 13. Event Editor window. 14 In the Event Editor window (Fig. 13) it is possible to set a Vp/Vs ratio as well as the p-to-p time… (?). Here you can create an event and associate/disassociate picks to it. In order to amend and/or locate a created event, you must double-click on the event name (highlighted in blue in Fig. 13) to open the Event Properties window (Fig. 14). Once in the Event Properties window you can edit manually event’s data such as name, status, location, origin time, etc. You can also enable/disable or even remove individual picks from the list of event’s associated picks. Provided that you have the hypo71 executable file and you have set its location path in File>Preferences>General tab, you can relocate your event in the lower part of the Event Properties window. In order to do this, you must first set the Starting Depth (km), Depth Step (km), and Number of Steps for the hypocentral location search, and additionally the closest (X near) and farthest (X Far) station allowed for the location process (Fig. 14). Optionally you can chose weather you want to create synthetics picks or not, which can later be seen in the Production Screen. After done the relocation, the new event’s location parameters will be updated and you can also review the hypo71 files by clicking the corresponding button (see Fig. 14). Figure 14. Event Properties window. In this window you can manually amend event data, enable/disable associated picks, and most important, perform the relocation of the event by using the hypo71 algorithm. 15 3.2.3 Map In this window you can see the distribution of stations (depicted by triangles) and the event (depicted by a star) in case this has been located. 3.2.4 Contents Here you can manually edit contents such as: waveforms data, picks, events, stations and velocity model. For example, if you have previously imported a Stations data file, in the Contents editor you can review this information and amend any necessary data regarding the stations information. 3.3 View Menu In the View menu it is possible to access to the different screen modes as well as to configure several display options. Figure 15. View menu options with Sort Overview choices displayed. As depicted in Fig. 15, in the View menu you can configure the following options: (1) switch on/off the Overview and Production screens (2) navigate between stations (3) switch on/off the display of Absolute or Relative time for the traces (4) sort the stations order alphabetically, by epicentral distance, by hypocentral distance or by back azimuth (5) switch on/off the ‘simplify overview’ option – when it is on, a horizontal line denotes the presence of traces in the Overview pane; when it is off, this pane shows the actual waveforms (6) display only the vertical component in the overview and/or the station zoom panes (7) switch on/off time tips (?) (8) display absolute particle scale (?) (9) switch on/off guide lines in the seismograms every 1, 10 and/or 60 seconds (10) switch on/off the display of toolbars 16 TIP: After located an event, you can sort the stations by, for example, epicentral distance. Therefore you can review your picks from the closest stations (stronger signal) to the furthest ones (weaker signal) in a tidy and clear way. SECTION 4: Contents and formats of input and project files 4.1 Stations file The format of the stations file follows the standards of the so-called “experiment file” on the GIANT software package (Rietbrock and Scherbaum, 1998). An example of this file is shown in Fig. 16. Fields must be separated by at least one blank space ???. #1# #2# #3# #4# #5# #6# #7# #8# #9# #10# #11# #12# #13# #14# #15# #16# 01 AYSN 1 XX 100 4A89 1 LOVE -‐46.1916 -‐72.7976 433 2004.01.01 00:00:00 2006.12.31 24:00:00 AYSN 02 AYSN 1 XX 100 4A82 2 RICA -‐46.1248 -‐72.5562 503 2004.01.01 00:00:00 2006.12.31 24:00:00 AYSN 03 AYSN 1 XX 100 3434 3 ARDI -‐46.1621 -‐72.1862 513 2004.01.01 00:00:00 2006.12.31 24:00:00 AYSN 04 AYSN 1 XX 100 3C14 4 ARDI -‐46.1621 -‐72.1862 513 2004.01.01 00:00:00 2006.12.31 24:00:00 AYSN 05 AYSN 1 XX 100 3433 5 COCH -‐47.3165 -‐72.5695 373 2004.01.01 00:00:00 2006.12.31 24:00:00 AYSN 06 AYSN 1 XX 100 4905 6 CHAC -‐47.1174 -‐72.4858 350 2004.01.01 00:00:00 2006.12.31 24:00:00 AYSN 07 AYSN 1 XX 100 3527 7 TRAN -‐46.6354 -‐72.8395 355 2004.01.01 00:00:00 2006.12.31 24:00:00 AYSN 08 AYSN 1 XX 100 4A96 8 MURT -‐46.4550 -‐72.6800 260 2004.01.01 00:00:00 2006.12.31 24:00:00 AYSN 09 AYSN 1 XX 100 4A91 9 GUAD -‐46.8629 -‐72.6925 421 2004.01.01 00:00:00 2006.12.31 24:00:00 AYSN Figure 16. Example of an station file. The first raw indicates the number of the field for description purposes only (this raw is omitted in the actual file). Following there is a description of each one of the fields: #1# The first field corresponds to the unique device number of the instrument (data logger). #2# The second field contains a string naming the data logger type. E.g. REFTEK, TAURUS, etc. #3# Contains gain information. Basically thought for personal remaining. #4# Format type of data logger. E.g. 16, 14/2, 32, etc. #5# Type of sensor. E.g. TRIL120P, GURALP3ESP, etc. #6# Sensor number. #7# …???... #8# Station name. Corresponds to a string of maximum ??? characters. #9# Geographical decimal latitude in degrees (positive north). #10# Geographical decimal longitude in degrees (positive east). #11# Height above the sea level (positive upwards) in metres. * #12# Start date of registration validity in format yyyy.mm.dd. #13# Start time of registration validity in format hh:mm:ss. #14# End date of registration validity in format yyyy.mm.dd. 17 #15# End time of registration validity in format hh:mm:ss. #16# String containing, for example, the operator’s name or any other useful information. * SDX does not accept stations with negative height. 4.2 Velocity model file The velocity model file is defined by two columns containing and P-wave velocity and top of the layer respectively (Fig. 17). Field #1# contains P-wave velocities in km/s, whilst field #2# contains the depth of the top of each layer in km. Fields must be separated by at least one blank space ???. #1# 4.93 4.94 4.97 5.17 5.57 5.92 6.24 6.38 6.38 6.38 6.38 6.38 6.78 7.31 7.94 7.98 8.85 #2# 0.0 2.0 3.0 4.0 5.0 6.0 7.0 8.0 10.0 14.0 18.0 22.0 26.0 30.0 39.0 45.0 60.0 Figure 17. Example of a velocity model file. The first raw indicates the number of the field for description purposes only (this raw is omitted in the actual file). 4.3 Example of a project file (.sdx) SDX creates a project file every time you save the current working project. This file contains, among others, the path to the velocity model, the used stations, loaded seismograms, travel-time picks, created events, etc. A great advantage on the format of the SDX’s project files is that they are ASCII files which can be manually amended by using any conventional text editor. Fig. 18 shows an example of a SDX project file and its basic structure. Each section is separated by the flags [+NAME] and [-NAME], where ‘NAME’ the name of the section (e.g. STATIONSET, TRACESET, PICKSET, EVENTSET, etc), and the signs + and – indicating the beginning and end of each section respectively. 18 [+VERSIONSET] [-‐VERSIONSET] [+INFOSET] [-‐INFOSET] [+SYNTHETICSSET] 1.77 /home/velmod_aysen 2 2 10 0 9999 [-‐SYNTHETICSSET] [+TRACESET] /home/20050213_1851 MS|2005.044.18.50.00.0000.XJ.PSAN..HHE.D.mseed MS|2005.044.18.50.00.0000.XJ.PSAN..HHN.D.mseed [-‐TRACESET] [+PICKSET] [-‐PICKSET] [+EVENTSET] [-‐EVENTSET] [+ORIGINSET] [-‐ORIGINSET] [+STATIONSET] station LOVE_20040101_000000_20061231_000000 LOVE -‐46.1917 -‐99999 -‐99999 -‐99999 -‐99999 -‐72.7976 -‐99999 -‐99999 -‐99999 -‐99999 433 -‐99999 -‐99999 -‐99999 -‐99999 2004.01.01-‐00:00:00.000 -‐99999 -‐99999 -‐99999 -‐99999 2006.12.31-‐00:00:00.000 -‐99999 -‐99999 -‐99999 -‐99999 <NOT_SET> <NOT_SET> AYSN <NOT_SET> <NOT_SET> <NOT_SET> <NOT_SET> <NOT_SET> 2013.01.11-‐18:18:58.976 <NOT_SET> <NOT_SET> <NOT_SET> <NOT_SET> <NOT_SET> 2013.01.11-‐18:18:58.976 <NOT_SET> [-‐STATIONSET] end Figure 18. Example of a SDX project file. Each section is started and ended by a flag of the type [±NAME]. In this example most of the sections have no information (except SYNTHETICSSET, TRACESET and STATIONSET). 19 List of Shortcuts Shortcut ESC F1 F2 F3 F5 F6 F7 Left Right Ctrl + Left Ctrl + Right Shift + Left Shift + Right E I Q U D P S 0 1 2 3 4 R Backspace Delete Ctrl + O Ctrl + N Ctrl + P Ctrl + S Ctrl + Q Ctrl + K Ctrl + E Description Reset all scaling in station zoom pane Reset horizontal scale in station zoom pane Double horizontal scale in station zoom pane Halve horizontal scale in station zoom pane Reset vertical scale in station zoom pane Double vertical scale in station zoom pane Halve vertical scale in station zoom pane Nudge selected item to left Nudge selected item to right Nudge waveform in station zoom pane to left Nudge waveform in station zoom pane to right Go to previous station Go to next station Selected pick(s) onset set to emergent Selected pick(s) onset set to impulsive Selected pick(s) onset set to questionable Selected pick(s) polarity set to positive (up) Selected pick(s) polarity set to negative (down) Selected pick(s) polarity set to undecidable Selected pick(s) phase set to “P” Selected pick(s) phase set to “S” Selected pick(s) weight set to 0 Selected pick(s) weight set to 1 Selected pick(s) weight set to 2 Selected pick(s) weight set to 3 Selected pick(s) weight set to 4 Flag one selected pick as reference for alignment Delete selected pick Delete selected pick Open new project New project Print main window Save project Quit Toggle picking mode Associate selected picks into event 20 Quick Start Guide for Event Location The following steps are designed to quickly start using SDX in order to process seismic data and perform earthquake locations. For a more detailed guide, please read the full SDX user manual. 1. Before processing any data we must set some basic options. This is done in the menu File>Preferences. In order to locate an event, we must specify the location path of the hypo71 executable file in the General tab of the Preferences menu as seen in Fig. 5). 2. Start a new project (Ctrl + N) and then load the waveforms to be analysed on File>Import>Miniseed or any of the other formats available. 3. Import the stations data file and velocity model file on File>Import and then Stations or Velocity model respectively. 4. Toggle on the Production Screen on View>Production Screen and then open the Add pick mode (Ctrl + K) and manually pick phase arrivals by left-clicking the seismograms on the Station Zoom pane. 5. Once the manual picking is finished, open the Event Editor window on Edit>Events and set the Vp/Vs value (e.g. 1.75). 6. On the same Event Editor window, create a new event by clicking on Create new event. Then, click on Associate all remaining picks with current event. Double-click on the event’s name to enter the Event Properties window. 7. On the Event Properties window, set the location options for Depth start, Depth step, Number of steps, Closest station allowed (X Near) and Farthest station allowed (X Far). For example use the following numbers respectively: 2, 2, 10, 0, 9999. After this, click on Relocate to get the location of the event by using hypo71. 8. If the event was correctly located, the event’s information should have been updated on the Event Properties window. TIP: Do not forget to save a project before starting a new one. For convenience, use the extension .sdx to name the SDX project files. TIP: Any error message can be read on the terminal window where SDX is running. TIP: In order to save time, before start analysing a dataset which includes several events recorded by the same network, create a template of events (project file with extension .sdx) which includes a loaded velocity model and stations files, vp/vs ratio, etc. Save this project file as a template (e.g. ‘template.sdx’)and then each time you need to analyse a new event open the template and load the correspondent waveforms. Then save the file as a new project re-naming it with the name of the event (e.g. ‘event20130124’). Be careful of not giving the same name as the template or you will overwrite on it. 21 Bibliography Lee, W.H.K. and Lhar, J.C. (1972), HYP071: A computer program for determining hypocenter, magnitude, and first motion pattern of local earthquakes (Open File Report), U. S. Geological Survey. Rietbrock, A. and Scherbaum, F. (1998), The GIANT analysis system (graphical interactive aftershock network toolbox), Seism. Res. Lett., 69, 40–45. 22


![Indicateurs (PDF/782Ko) [F]](http://vs1.manualzilla.com/store/data/006364555_1-61d6515c96ce437ed2545f3e53fb26c1-150x150.png)