1
NovaStar 5
Part I
User Manual
A102721-4
HydroLynx Systems, Inc.
NovaStar 5 Part I User Manual
Software license agreement
Your use of the Program(s) contained in this package indicates that you have read and understood these Terms and
Conditions, and acknowledges your acceptance of them. Please read this license agreement carefully.
License
HydroLynx Systems, Inc. agrees to grant you a non-exclusive license to use the enclosed program(s) [the Program(s
)] subject to the terms and conditions of this license.
Copyright
The Program(s), including manual and documentation, are copyrighted and contain trade secrets and proprietary
property of HydroLynx Systems, Inc. They are protected under the copyright laws of the United States, all rights
reserved. Except for making a reasonable number of backup copies, reproduction or transfer of any part of any
Program is forbidden without the expressed written permission of HydroLynx Systems, Inc. In addition to any other
of its rights, HydroLynx Systems, Inc. has the right to terminate this license if the terms of this license are violated.
HydroLynx Systems, Inc. has the right to trace serial numbers at any time and in any reasonable manner.
Restrictions on Use and Transfer
The single-processor version(s) of the Program(s), including the manuals and documentation, are to be used on one
computer only at any one time. You may use the multi-processor version(s) of the Program(s), including the
manuals and documentation, over a network, provided that the number of computers connected to the network
simultaneously does not exceed the number stated in your multi-processor fee agreement. In addition, you must
notify HydroLynx Systems, Inc. of the number of computers you have connected to the network. Transfer of this
license to backup or replacement computer(s) is allowed if the original licensed computer(s) become inoperative.
You may not transfer, assign, or sub-license this license agreement or the Program(s), manuals, or documentation to
a third party without written permission from HydroLynx Systems, Inc. Upgrading software to newer versions of the
Program(s) terminates the license for the old Program(s) and creates a license for the new Programs(s). You may not
use or transfer the old Program(s) in this circumstance.
Term
This license is effective until terminated. You may terminate this license by giving HydroLynx Systems, Inc. 30
days written notice. HydroLynx Systems, Inc. may terminate this license if you fail to comply with the terms and
conditions of this agreement in any way. Upon termination, for whatever reason, you must destroy all copies of the
Program(s), the manuals, and documentation. You must also send written notice to HydroLynx Systems, Inc.
certifying that these tasks have been accomplished.
Expressed and Implied Warranties
All expressed and implied warranties for this product including the warranties of merchantability and fitness for a
particular purpose are limited in duration to a period of one year from the date of purchase. The date of purchase
will be considered the date of invoicing or if no invoicing is done, the date of shipment from HydroLynx Systems,
Inc. The warranty period or the starting date of the warranty period may be extended only by a written contract
between HydroLynx Systems, Inc. and the licensed user. Modification of the licensed Program(s) without expressed
approval of HydroLynx Systems, Inc. voids the warranty.
Limited Warranty for Diskettes
If during a period of 90 days from original purchase of the Program(s) a CD-Rom disk fails in normal use, it will be
replaced, provided that the person or organization applying for replacement is the original registered licensed user.
Limitation of Liability
Neither HydroLynx Systems, Inc. nor anybody connected with HydroLynx Systems, Inc. shall be liable for any
direct, indirect, incidental, or consequential damages, such as, but not limited to, loss of anticipated benefits or
profits, resulting from the use of the Program(s) or arising out of any breach of warranty. The entire risk as to the
results and performance of the Program(s) is assumed by the licensed user.
Page ii
A102721
NovaStar 5 Part I User Manual
HydroLynx Systems, Inc.
Table of Contents
1 Program Description.....................................................................................................................6
1.1 What is new in NovaStar 5 for NovaStar 4X Users?.............................................................6
1.2 How to Use this Manual........................................................................................................7
2 Server Platform Requirements......................................................................................................8
2.1 Linux Operating System........................................................................................................8
2.2 Hardware Requirements.........................................................................................................8
2.3 Local Backup of Data Management System..........................................................................8
2.4 Remote Access.......................................................................................................................8
2.5 Installation..............................................................................................................................8
2.6 System Configuration............................................................................................................9
3 NovaStar 5 Basic Concepts.........................................................................................................10
4 NovaStar 5 on the Web...............................................................................................................11
5 The NovaStar 5 Home Page (User)............................................................................................13
5.1 Log In...................................................................................................................................14
6 Tabular Data................................................................................................................................15
6.1 Tabular Data Request...........................................................................................................15
6.1.1 Select Point...................................................................................................................15
6.1.2 Point Pick Details..........................................................................................................16
6.1.3 Select Display Time and Interval..................................................................................17
6.1.4 Select Data Analysis.....................................................................................................17
6.1.5 Display Options............................................................................................................18
6.2 Tabular Data Display...........................................................................................................18
6.2.1 Tabular Data List Details..............................................................................................19
6.3 Tabular Data Print................................................................................................................21
6.4 Tabular Data Export.............................................................................................................21
7 Report Data.................................................................................................................................23
7.1 Report Data Request............................................................................................................23
7.1.1 Select Report.................................................................................................................24
7.1.2 Report Pick Detail.........................................................................................................24
7.1.3 Report Point List...........................................................................................................25
7.1.4 Select Display Time and Interval..................................................................................28
7.1.5 Select Data Analysis.....................................................................................................29
7.1.6 Display Options............................................................................................................29
7.2 Report Data Display.............................................................................................................30
7.2.1 Report Data List Details................................................................................................31
7.3 Report Data Print.................................................................................................................32
7.4 Report Data Export..............................................................................................................32
8 Plot Data......................................................................................................................................33
8.1 Plot Data Request.................................................................................................................33
8.1.1 Select Plot.....................................................................................................................33
8.1.2 Plot Pick Detail.............................................................................................................34
8.1.3 Plot Point List...............................................................................................................35
8.1.4 Select Display Time and Interval..................................................................................40
8.1.5 Select Data Analysis.....................................................................................................40
8.1.6 Display Options............................................................................................................41
8.1.7 Plot Options..................................................................................................................41
8.2 Plot Data Display.................................................................................................................41
8.2.1 Plot Image Resizing......................................................................................................42
8.2.2 Plot Data Tooltip...........................................................................................................42
8.2.3 Plot Data Drill Down....................................................................................................43
A102721
Page 3
HydroLynx Systems, Inc.
NovaStar 5 Part I User Manual
8.2.4 Plot Data List................................................................................................................43
8.2.5 Plot Data List Details....................................................................................................44
8.3 Plot Data Print......................................................................................................................45
9 Map Data.....................................................................................................................................46
9.1 Map Data Request................................................................................................................46
9.1.1 Select Map....................................................................................................................46
9.1.2 Map Pick Detail............................................................................................................47
9.1.3 Select Display Time and Interval..................................................................................48
9.1.4 Select Data Analysis.....................................................................................................48
9.1.5 Display Options............................................................................................................48
9.2 Map Data Display................................................................................................................49
9.2.1 Map Data Tooltip..........................................................................................................51
9.2.2 Map Data Drill Down...................................................................................................51
9.2.3 Map Data Popup Menu.................................................................................................51
9.2.4 Map Data List...............................................................................................................52
9.2.5 Map Data List Details...................................................................................................53
9.3 Map Data Print.....................................................................................................................55
10 About NovaStar 5.....................................................................................................................56
10.1 Documentation Links.........................................................................................................56
10.1.1 Change log..................................................................................................................56
10.1.2 User manual................................................................................................................56
10.1.3 Operator manual..........................................................................................................56
11 Contact HydroLynx..................................................................................................................57
12 Change Profile..........................................................................................................................58
A) Data Analysis............................................................................................................................60
List of Tables
Table 6.1. Data List Details...........................................................................................................21
Table A.1.1. Data Analysis............................................................................................................60
List of Figures
Figure 5.1. NovaStar 5 Web Home Page.......................................................................................13
Figure 5.2. Log In..........................................................................................................................14
Figure 6.1. Tabular Data Request..................................................................................................15
Figure 6.2. Point Pick Details........................................................................................................16
Figure 6.3. Tabular Data Display Interval Data.............................................................................18
Figure 6.4 Tabular Data Display Show Reports............................................................................19
Figure 6.5. Tabular Data List Details.............................................................................................20
Figure 6.6. Tabular Data Print.......................................................................................................22
Figure 6.7. Tabular Data Export....................................................................................................22
Figure 7.1. Report Data Request....................................................................................................23
Figure 7.2. Report Pick Details......................................................................................................24
Figure 7.3. Report Point List..........................................................................................................25
Figure 7.4. Report Point List Details.............................................................................................26
Figure 7.5. Report Point Add Panel...............................................................................................26
Figure 7.6. Report Point Edit Panel...............................................................................................27
Figure 7.7. Report Data Display....................................................................................................30
Figure 7.8. Report Data List Details..............................................................................................31
Figure 7.9. Report Data Print.........................................................................................................32
Figure 8.1. Plot Data Request........................................................................................................33
Page 4
A102721
NovaStar 5 Part I User Manual
HydroLynx Systems, Inc.
Figure 8.2. Plot Pick Details..........................................................................................................34
Figure 8.3. Plot Point List..............................................................................................................35
Figure 8.4. Plot Point List Details..................................................................................................36
Figure 8.5. Plot Point Add Panel...................................................................................................37
Figure 8.6. Plot Point Edit Panel....................................................................................................38
Figure 8.7. Plot Data Display.........................................................................................................42
Figure 8.8. Plot Data DisplayTooltip.............................................................................................43
Figure 8.9. Plot Data List...............................................................................................................43
Figure 8.10. Plot Data List Details.................................................................................................44
Figure 8.11. Plot Data Print...........................................................................................................45
Figure 9.1. Map Data Request.......................................................................................................46
Figure 9.2. Map Pick Details.........................................................................................................47
Figure 9.3. Map Data Display........................................................................................................50
Figure 9.4. Map Data Popup Menu................................................................................................51
Figure 9.5. Map Data List..............................................................................................................52
Figure 9.6. Map Data List Details..................................................................................................53
Figure 9.7. Map Data Print............................................................................................................55
Figure 10. About NovaStar 5 Page................................................................................................56
Figure 11. HydroLynx Contact Information..................................................................................57
Figure 12. Change Profile..............................................................................................................58
A102721
Page 5
HydroLynx Systems, Inc.
NovaStar 5 Part I User Manual
1 Program Description
NovaStar 5 is a data collection and management software system designed to receive real-time
hydro-meteorological data from ALERT radio transmissions and to solicit data from two-way
radio systems and other external sources. Transmission of data may be initiated by the remote
station, either on a set schedule or when a defined event occurs; for example at each tip of a rain
gage. NovaStar 5 can also poll an external source for data on a configured schedule, like a
remote station equipped with a model 50386 data collection unit or the USGS National Water
Information Server (NWIS) Web. NovaStar 5 can ingest USGS stream gage data and process
data formats including text files in the Standard Hydrologic Exchange Format (SHEF files),
commercial satellite, and GOES satellite data.
NovaStar 5 is designed to act as a client-server application. The NovaStar 5 central data server
runs under a Linux operating system and receives data broadcast on specified radio frequencies
through serial or USB ports on the dedicated server computer. A web browser allows clients to
log-on to the server from any computer with internet capabilities. Clients include one or more
system administrators and any number of users. Users are not given access to the s that would
allow them to alter the data structures defined by the administrator.
To make data useful for analysis and decision-making, the software administrator configures
NovaStar 5 to perform error checking on the incoming data, and to convert sensor output into
appropriate engineering units that are correctly associated with their geographic location and the
time of the measurement. The system administrator can also configure NovaStar 5 to provide
automatic warning to any number of users via screen alarms, audible alarms, emails, pager
alarms, and phone/voice auto-dialed alarms if specific conditions are met. All users including the
administrator are able to respond to alarms, customize map displays, view, analyze and plot data
and generate data reports.
NovaStar 5 stores data in an ODBC compliant Postgresql database that can be accessed for
analysis and display of time series point data by the administrator and users, either with
NovaStar 5’s internal mapping and reporting tools, or with compatible applications supporting
SQL queries, like ArcGIS, Microsoft Excel, Microsoft Access, etc. The database is editable and
includes post-event and historical data processing functions including statistical and time interval
data analyses, time-based rating tables, and daily and monthly rainfall and streamflow reporting.
Rainfall, water level and streamflow data can be summarized on varying time steps (daily,
monthly, yearly).
1.1 What is new in NovaStar 5 for NovaStar 4X Users?
NovaStar 5 is a completely new application rather than an upgraded or a revised NovaStar 4X.
While previous NovaStar applications ran under the QNX operating system, NovaStar 5 was
developed with a Linux operating system and uses an open, ODBC-compliant relational database
called Postgresql. However, users familiar with NovaStar 4X will find many familiar features in
NovaStar 5. Differences include:
NovaStar 5 provides a program that is map-based and accessible from any computer with
Internet access.
Stations are located on the map using their geo-reference of latitude and longitude rather
than a coordinate mapping reference.
In NovaStar 4X, it was not necessary to define stations. Only sensor definitions were
needed to store sensor data reports in the database. NovaStar 5 has a hierarchical
structure of stations and points. A station has a physical location and reports sensor
Page 6
A102721
NovaStar 5 Part I User Manual
HydroLynx Systems, Inc.
readings in data reports. The data reports may contain data readings for one or more
sensors. Each sensor reading is stored as a separate point in the database.
In NovaStar 4X, raw data reports were stored in the database. Scaled data was computed
when the database was queried by a report display program. NovaStar 5 computes and
stores the scaled data so it can be pulled directly from the database.
In NovaStar 4X, rating table computation of streamflow was done when the database was
queried by a report display program. NovaStar 5 computes streamflow when a data report
is filed and stores the streamflow data in a separate table so it can be pulled directly from
the database.
In NovaStar 4X, digital status readings were stored in one data report. The line number
was used to pull the desired status bit from the data report value. NovaStar5
automatically extracts the digital status bit value and assigns the value to a point.
In NovaStar 4X, ALERT wind run and direction readings were stored in one data report.
When the database was queried by a report display program, wind run was separated
from direction and wind speed computed. NovaStar 5 automatically extracts the wind run
and direction, computes wind speed and stores wind speed and direction in separate
points.
In NovaStar 4X, real-time equations were executed when the database was queried by a
report display program. A real-time equation computes a new data value from one or
more sensor data reports. For example, Dewpoint Temperature could be computed from
Air Temperature and Relative Humidity. NovaStar 5 automatically computes the
equation data when the data reports are received and stores the computed data report in a
separate point in the database.
Alarm Groups are built around points in NovaStar 5. Groups were optional in 4X, but
they are mandatory in NovaStar 5. A group can contain one or more points. Setting up
alarms for many points with similar alarm criteria are expedited by forming a group.
For data validation procedures comparing the change in value between a new data report
and previous data reports, NovaStar 5 compares calibrated data reports and the Change
value should therefore also be entered using calibrated units. In NovaStar 4X, change
values used raw value units.
1.2 How to Use this Manual
The manual is intended to assist first-time users, and especially new administrators, by
describing in sequence the steps required to create a data visualization and management system
that truly informs decision-making processes by providing accurate, meaningful and timely data
for both emergency response and post-event analysis. Part I of this manual describes the menu
commands that allow any user to view, analyze and plot data using the Tabular Data, Report
Data, Plot Data and Map Data commands. Part II describes the system configuration process
for system administrators, but also includes information, particularly at the beginning of each
section, that can be useful for users who are able to view (but not edit) the structures that have
been created by the system administrator to organize and map data and configure alarms. Each
chapter includes information relating the program to likely goals of its use and describes issues
that impact the program’s implementation for typical applications.
Each chapter also relates specifically to each of the available program “pages” that allow users to
with the program. Working through the manual sequentially is likely to be unnecessary for those
users familiar with previous NovaStar base station applications, but questions about how to
proceed with any page you find on your screen should be easy to find in the section of this
manual named after the page in question.
A102721
Page 7
HydroLynx Systems, Inc.
NovaStar 5 Part I User Manual
2 Server Platform Requirements
NovaStar 5 is installed on a dedicated or virtual server computer running the Linux operating
system. The recommended minimum requirements for hardware are provided.
2.1 Linux Operating System
The recommended operating system is Debian Linux stable or testing release. The testing
distribution contains packages that haven't been accepted into a stable release yet, but they are in
the queue for that. The main advantage of using this distribution is that it has more recent
versions of software.
2.2 Hardware Requirements
The server should be configured with the following:
•
•
•
•
•
•
•
•
•
Intel Dual Core CPU
4 GB RAM storage
Dual 500 GB SATA 7200 hard disk drives
DVD-RW
SVGA video card
Minimum 19-inch LED monitor
Gigabit NIC
USB ports for keyboard, mouse, serial adapters
Speakers
2.3 Local Backup of Data Management System
Backup of data and system configuration information is accomplished using the dual 500 GB
SATA 7200 hard drives and RAID1 backup software.
2.4 Remote Access
Remote access to the server computer is provided through the web page interface or ssh
command line connections.
2.5 Installation
The NovaStar 5 application is available from the HydroLynx distribution site (hyrdolynx.com).
The installation package can be downloaded with an authorized user name and password using
secure shell file transfer protocol (ssh). Once access to the site is established, the following files
are required in order to install the NovaStar 5 application:
•
novastar5install.exe
The application can be installed by a user with sudo privileges using the command:
sudo ./novastar5install.exe
The computer must be rebooted after installation of the application is complete.
Software updates are also available from the same web site. The installation of software updates
will not erase an existing database; however, it is good practice to backup any existing databases
before installing an update. A backup of the database can be made using the NovaStar 5 database
backup program:
nsdbbackup “filename.backup"
Page 8
A102721
NovaStar 5 Part I User Manual
HydroLynx Systems, Inc.
After installation, NovaStar 5 can be accessed either at the server or by any computer with
Internet access.
2.6 System Configuration
To complete installation of the NovaStar 5 system, a few system configuration items should be
addressed by either the local network administrator or the NovaStar 5 administrator. These
system configuration items are addressed from within the NovaStar 5 application; using the
System menu command on the Administrator Home page. The default administrator login is:
•
•
User name: admin
Password: admin
These System parameters provide options that are useful for local network management and
allow administrators to set certain system defaults.
When you click on the System menu command on the Administrator Home page, the
Configuration List page appears, and the System menu command expands to show all of the
System subcommands, including Configuration List, Data Flag List, Nova Score List,
Scheduler List, Serial Port List, and View Log File. The Configuration List and the Serial
Port List should be addressed as the final step required for completing installation. Refer to Part
II Operator and Administrator Manual, Section 9, on how to configure your data collection
system and complete the installation.
A102721
Page 9
HydroLynx Systems, Inc.
NovaStar 5 Part I User Manual
3 NovaStar 5 Basic Concepts
The operation of NovaStar 5 requires an understanding of some basic concepts and terminology
which are introduced here and used throughout the document.
Station: In a standard ALERT network, each station is uniquely identified by its name,
coordinate location (latitude/longitude), and station ID. Acceptable ALERT station ID numbers
can range from 0 to 8191. NovaStar5 can accept station ID numbers from 0 to 99,999,999.
Station Type: Each station is equipped with a datalogger/data collection unit/transmitter
installed at the station (HydroLynx 5096, Sutron 8210, Handar 555, or HydroLynx 50386). In
NovaStar 5, station types describe attributes of this equipment.
Point: A station may have a number of different sensors installed, and in NovaStar 5 these data
sources associated with a station are referred to as points. Examples of installed sensors at a
station include battery voltage, rain gage, and pressure transducer to monitor water level, wind
speed/direction sensor, air temperature sensor, and relative humidity sensor. Point data may also
be obtained from other external sources, for example when data is obtained via satellite or web.
The data packets provided by most of these stations contain one measurement per remote sensor
identifier. Some exceptions are digital status (multiple digital inputs per data value transmission)
and ALERT wind (wind run and wind direction are combined in one value transmission). When
these compound sensor data reports are received, the data value is parsed to store individual
sensor data values in the points assigned to the remote sensor identifier. A point represents a
single measurement data stream in the database; either a data value received from a remote
sensor or a computed or derived value.
Point Type: A point type characterizes the data values returned from a remote sensor. Sensors
producing data values of a similar nature are grouped into point types to facilitate configuration
of the system, definition of alarm levels, and display of data. Point types specify the data unit
associated with data from a point and can be used to configure data calibration and data checking
for those point types for which point-level data calibration and checking is appropriate. The
creation of point types is left to the administrator.
Calibration: A calibration is a collection of values that are used to convert raw sensor data into
scaled point data in the desired engineering units before storing in the NovaStar 5 database.
Alarm group: Points producing data values that can be evaluated for alarm conditions using the
same criteria are grouped into an alarm group. An alarm group lets you assign the same alarm
threshold criteria and trigger values to multiple points. For example, an alarm group may be
defined containing all batteries. The group is then assigned a low limit voltage alarm level,
typically 11.0 volts. Incoming data for any battery in the group is checked against the alarm level
defined for the group. The alarm group concept facilitates the configuration and display of alarm
conditions for multiple sensors with similar alarm conditions.
Time Series: A time series is a temporally sequential grouping of data that are displayed on a
consistent time step.
Display Interval: The display interval is used to create time series information from uneveninterval data for display purposes. ALERT data reports are received on uneven time intervals and
are stored within the database as such. The display interval can range from 5 minutes to 1 year
and sequentially increments from the starting time to the ending time set by the user. Without
subsequent data analysis, the display interval can be used to create a time series display from
uneven-interval data where the data point displayed at the interval boundary is the last one that
occurred within the interval.
Page 10
A102721
NovaStar 5 Part I User Manual
HydroLynx Systems, Inc.
4 NovaStar 5 on the Web
NovaStar 5 provides for web-based access to the server using your preferred browser. Therefore,
your toolbar layout may be different than what is shown in this manual. However, the NovaStar
5 application will function as documented. Browser capabilities that refresh the current page or
move from the current page to a previous or subsequent page can be used as usual.
The NovaStar 5 home page URL is:
http://myservername:8180/NovaStar5/index.do.
The server domain name or IP address, myservername, must be provided by your local network
administrator. Port number 8180 is the standard NovaStar 5 web page browser port. This may be
changed by the NovaStar 5 system administrator.
Within NovaStar5, buttons are provided to allow you to conveniently move between pages.
•
•
•
•
•
•
•
•
•
•
•
•
•
•
•
•
•
•
•
•
Add opens a page of blank or default fields to add a database record for the list type.
Apply saves changes to the current page and then remains in that page for further input.
Frequently using the Apply button allows a page to differentiate based on user inputs,
allowing NovaStar 5 to adapt the input fields as required.
Assign/Remove opens a pop-up window to let you move items from the unassigned Pick
list to the Assigned list.
Back returns you to the previous page without saving changes to the current page.
Bottom of page jumps to the bottom of the current page. This is useful when you want to
get to the bottom of a long list of information or to the bottom of a long edit page.
Cancel ignores any changes to the current page and returns to the previous page.
Choose details… opens List Details page where you can choose which fields are
displayed, the sort order, and limits are applied to the list of data displayed.
Copy opens a copy page from an edit page. The parameters on the previous edit page are
copied to the new page. When you click OK or Apply on a copy page, a new record is
added to the database.
Delete removes the information displayed on an edit page from the database.
Detach opens another copy of the current page in its own browser window. Your browser
must allow pop-ups for this button to work.
Details opens List Details pop-up window where you can choose which fields are
displayed, the sort order, and limits are applied to the list of data displayed.
Display opens a Data Display page for the request page.
Edit opens an edit page for the database record selected from a list. The parameters
shown in the page can be modified and saved to the database.
List displays a list of database records for the type of information shown next to the
button.
Move Down moves the selected detail down one row.
Move Up moves the selected detail up one row.
OK saves any changes that have been made in the current page. Then you are returned to
the previous page.
Poll opens a Station Poll page for the station. You can poll a remote station from this
page to retrieve data and file in the NovaStar 5 database.
Refresh will reload the current page from the server. This is useful when you think the
database has changed and you want to have the latest information displayed.
Reset will update the page with the default selections.
A102721
Page 11
HydroLynx Systems, Inc.
•
•
•
•
Page 12
NovaStar 5 Part I User Manual
Select All selects all details.
Top of page jumps to the bottom of the current page. This is useful to return to the top of
the page when you have scrolled or jumped to the page bottom.
View displays the view or edit page for the database record selected from a list. The
parameters shown in the page can be modified by an operator or administrator.
Button Icons
Button Action
Move all from (unassigned) pick list to assigned list.
Move from(unassigned) pick list to assigned list.
Decrease display window width.
Move from assigned list to (unassigned) pick list.
Increase display window width.
Move all from assigned list to (unassigned) pick list.
Decrease pick list length.
Decrease display window height.
Increase pick list length.
Increase display window height.
Reset pick list to single select.
Reset display window size to default.
Expand section to show contents.
Expand pick list to multiple select.
Collapse section to hide contents.
Collapse pick list to single select.
Run command; display activity in command display window.
Stop command.
Clear display window.
A102721
NovaStar 5 Part I User Manual
HydroLynx Systems, Inc.
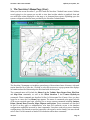
5 The NovaStar 5 Home Page (User)
When you first access NovaStar 5, you will reach the NovaStar 5 default home screen. Without
even logging in to the system you are able to view data in either tabular or graphical form and
see recent data values displayed on the map or in formatted data reports, depending upon the
system configuration that has been provided by the NovaStar 5 administrator.
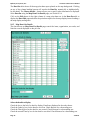
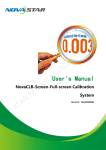
Figure 5.1. NovaStar 5 Web Home Page
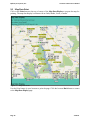
The NovaStar 5 homepage can include a general map of the monitored area of interest, with each
station identified by a green dot. Clicking on a dot allows access to a pop-up menu that displays
information about the station and point associated with the data point.
The command menu will include the Home, Log In, Tabular Data, Report Data, Plot Data
and Map Data commands, as well as the About NovaStar 5 and Contact HydroLynx
commands. These commands are described in Part I of this manual for all users. Once you have
logged in as a user, the User Home Page appears. The menu of commands at the upper left side
of the screen expands upon login, allowing you to access system commands including Stations,
Points, Alarms, Data, Forecast, Maps, Reports and System. These commands are described
in Part II as they apply to administrators, who have full read/write access to the database
configuration capabilities accessed by these commands. Users have read-only access to database
configurations, with limited exceptions (especially with regard to active alarms), but users should
refer to Part II of this manual as needed for information about these commands.
A102721
Page 13
HydroLynx Systems, Inc.
NovaStar 5 Part I User Manual
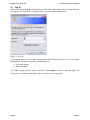
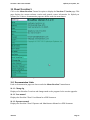
5.1 Log In
When you select the Log In command from the NovaStar 5 Home Page menu, the login dialogue
box appears. The login window prompts you for your user name and password.
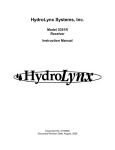
Figure 5.2. Log In
Users should enter the login name and password that has been given to you by the system
administrator. The default login for an administrator is:
•
•
User name: admin
Password: admin
Click OK to login and your session will start. Click Cancel to return to the home page. The
password is not echoed. Invalid passwords will result in an error message.
Page 14
A102721
NovaStar 5 Part I User Manual
HydroLynx Systems, Inc.
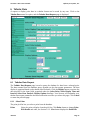
6 Tabular Data
A request to display point data in a tabular format can be made by any user. Click on the
Tabular Data menu list option, and the Tabular Data Request page is displayed.
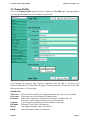
Figure 6.1. Tabular Data Request
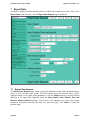
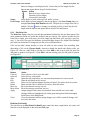
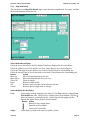
6.1 Tabular Data Request
The Tabular Data Request page is used to query the database for data from a selected point.
The data returned from the database query depends on the data request parameters. The data
display is organized based on the tabular data list details. Click the Display button to retrieve the
data specified in the input fields organized under the Select Point, Select Display Time and
Interval, Select Data Analysis, Display Options headings. Your browser will remember your
tabular data request parameters and restore them the next time you select this page. Click Cancel
to return the previous page.
6.1.1 Select Point
The point pick list lets you select a point from the database.
Point:
A102721
Select the point to display from the pick list. Click Point: button to change Point
Pick Details and order, see Section 6.1.2. View button displays the Point Edit
Page 15
HydroLynx Systems, Inc.
NovaStar 5 Part I User Manual
page for the selected point, see Section 3.1.4 in Part II, Operator and
Administrator Manual.
Figure 6.2. Point Pick Details
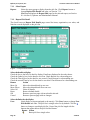
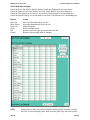
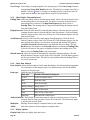
6.1.2 Point Pick Details
The check boxes on Point Pick Details page control the items, organization, sort order, and limit
the records displayed on the pick list.
Select the details to display
Check the box to the left of a detail to display. Details are displayed in the order shown.
Check the Order by box for the detail to sort first. Check Reverse for a descending sort.
Check the Then by box for the detail to sort second. Check Reverse for a descending sort.
Check the second Then by box for the detail to sort third. Check Reverse for a descending sort.
Button
Action
Move Up
Move the selected detail up one row.
Move Down
Move the selected detail down one row.
Select All
Select all details.
Reset
Reset to default details.
OK
Return to previous page with new details selected.
Cancel
Return to prevous page with no changes.
Page 16
A102721
NovaStar 5 Part I User Manual
HydroLynx Systems, Inc.
Select the limits for the display
Station:
Limit display to points assigned to the station(s). Click Station: button to change
Station Pick Details and order. The pick list is a single select list by default.
Click the button to change to a multiple pick list. Control the pick list length
with the buttons that appear below the pick list label button.
Button Action
Reset pick list to single select.
Decrease pick list length.
Increase pick list length.
Point type: Limit display to points assigned to the point type(s). Click Point type: button to
change Point Type Pick Details and order. The pick list is a single select list by
default. Click the button to change to a multiple pick list. Control the pick list
length with the buttons that appear below the pick list label button.
User Group: Limit display to points assigned to the user group(s). Click User Group: button to
change User Group Pick Details and order. The pick list is a single select list by
default. Click the button to change to a multiple pick list. Control the pick list
length with the buttons that appear below the pick list label button.
Out of Service: Limit display to points with out of service state: all ignores out of service, false
only displays points in service, true only displays points out of service.
6.1.3 Select Display Time and Interval
Starting Time: Select the starting time for the data display. Click Reset Time to start of day for
ending time. Note: the starting time must be before the ending time.
Ending Time: Select the ending time for the data display. Select Current in the pick list to set
the ending time to the current time. The Historic selection is shown when a past
ending time is selected.
Display Interval: Select the time interval for the data display. The database query will return
data reports at even time intervals from the starting time to the ending time. Select
Show Data Reports to display all data reports between the starting and ending
time. Click the button to alternate between interval selection from a pick list or
from time interval fields.
Refresh Interval: Select the interval to automatically refresh the data display. Click the Refresh
Interval: button to select from a list of intervals. Click the button again to use the
time interval fields. This field is only available when the Ending Time is set to the
Current time.
6.1.4 Select Data Analysis
These fields are hidden when the display interval is set to Show Data Reports.
Data Analysis: Select the data analysis for the data display. See the data analysis appendix for a
description of the analysis types. Use default analysis will do the default analysis
for the point type.
Analysis Interval: The Rainfall Intensity data analysis requires an analysis interval. Click the
Analysis Interval: button to select from a list of intervals. Click the button again
to use the time interval fields.
Multiplier: Multiply the data analysis computed value by this constant.
Adder:
Add this constant to the data analysis computed value.
A102721
Page 17
HydroLynx Systems, Inc.
NovaStar 5 Part I User Manual
6.1.5 Display Options
Show Ratings: Click the No rating field to expand the pick list. Select one or more ratings
(Rating 1 - Rating 5) to display in this multiple pick list with the [Ctrl] mouse
click combination. Click the No rating field again to collapse the pick list.
Show Rating Flags: Select true to display rating flags as well as the rating data values.
Display Only:Select the display data restrictions:
Display type
Database information displayed
All data
All data, valid or questioned
Valid data
Data reports with a valid flag. A valid flag is automatically
set by the system when data checking criteria is met.
Verified data
Data reports with a verified flag. A verified flag is set by an
operator using the data editor to certify that the data is valid.
Maintenance data Data reports with a maintenance flag. A maintenance flag is
manually set by an operator to indicate test data not used for
public viewing. The maintenance flag is also set when a point
of station is out of service or when the data report received
has the test flag set.
Display digits: Select default to display scaled or analysis data with the number of decimal
digits assigned to the point type. Select a number of decimal digits to override the default.
Raw digits: Select default to display raw data with the number of decimal digits assigned to the
point type. Select a number of decimal digits to override the default.
Display score: Select true to highlight the data display with colored backgrounds when the data
report score is greater than one.
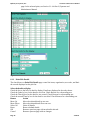
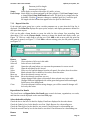
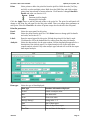
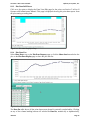
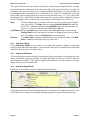
6.2 Tabular Data Display
After the tabular data request parameters are entered, click Display to display the data. The
header above the data table displays the point label for the point and data analysis.
Figure 6.3. Tabular Data Display Interval Data
Page 18
A102721
NovaStar 5 Part I User Manual
Point:
HydroLynx Systems, Inc.
Click on the point label to activate the point pick list. If you select a new point
from the point pick list then its data is immediately displayed. Click Point: button
to change Point Pick Details and order, see Section 6.1.2. View button displays
the Point Edit page for the selected report, see Section 3.1.4 in Part II, Operator
and Administrator Manual.
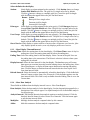
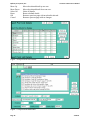
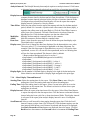
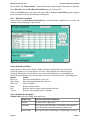
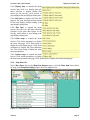
Figure 6.4 Tabular Data Display Show Reports
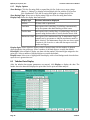
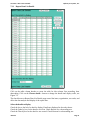
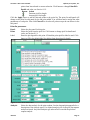
6.2.1 Tabular Data List Details
Click on the table column headers to resort the table for this column; first ascending, then
descending. Click on the Choose details... button to change the details and display order, see
Figure 6.4. Click Edit button to display and modify the point data from the starting to ending
time in the Data Edit page, see Section 5 in Part II Operator and Administrator Manual.
The check boxes on Tabular Data List Details page control the items, organization, sort order,
and affect the data analysis and display of the point data.
Select the details to display
Check the box to the left of a detail to display. Details are displayed in the order shown.
Check the Order by box for the detail to sort first. Check Reverse for a descending sort.
Check the Then by box for the detail to sort second. Check Reverse for a descending sort.
Check the second Then by box for the detail to sort third. Check Reverse for a descending sort.
Button
Move Up
Move Down
Select All
Reset
OK
Cancel
A102721
Action
Move the selected detail up one row.
Move the selected detail down one row.
Select all details.
Reset to default details.
Return to previous page with new details selected.
Return to prevous page with no changes.
Page 19
HydroLynx Systems, Inc.
NovaStar 5 Part I User Manual
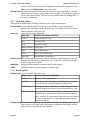
Figure 6.5. Tabular Data List Details
Display Only:Select the display data restrictions:
Display type
Database information displayed
All data
All data, valid or questioned
Valid data
Data reports with a valid flag. A valid flag is automatically
set by the system when data checking criteria is met.
Verified data
Data reports with a verified flag. A verified flag is set by an
operator using the data editor to certify that the data is valid.
Maintenance data Data reports with a maintenance flag. A maintenance flag is
manually set by an operator to indicate test data not used for
public viewing. The maintenance flag is also set when a point
Page 20
A102721
NovaStar 5 Part I User Manual
HydroLynx Systems, Inc.
of station is out of service or when the data report received
has the test flag set.
Table 6.1. Data List Details
Detail
Date and time
Data report
Raw data
Data flags
Data score
Report time
Data Rating 1 - 5
Rating Flags 1 - 5
Point ID
Point name
Point tag
Point type
Station ID
Station name
Station Tag
Station type
Description
Time of the data report when the display interval is Show Data Reports.
Otherwise it is the time of the display time interval.
Scaled data value stored in the database when the display interval is Show
Data Reports. Otherwise it is the value returned by the data analysis.
Raw data value received from the remote sensor.
Flags set for data report, see Section 8.2 in Part II.
Nova score flag, see Section 8.4 in Part II.
Report time of report found by analysis for display interval. For example,
the time of a report returned by a maximum analysis request.
Data rating values for data report. Up to 5 different ratings can be computed
and stored with each data report. For example, discharge may be computed
for a water level sensor. Incremental and seasonal rainfall are computed for
precipitation sensors.
Data rating flags for data report ratings. Data ratings flags can be V for
valid, U for under or below the lowest rating index value, O for over or
above the highest rating index value.
Point numeric ID for selected point.
Point name for selected point.
Point tag for selected point.
Point type name for selected point.
Station numeric ID for selected point.
Station name for selected point.
Station tag for selected point.
Station type name for selected point.
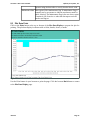
6.3 Tabular Data Print
Click on the Print button at the top or bottom of the Tabular Data Display to prepare the data
display for printing. The data display is redrawn with no links, header, footer, or menu.
Use the Print feature in your browser to print the page. Click the browser Back button to return
to the Tabular Data Display page.
6.4 Tabular Data Export
Click on the Export button at the top or bottom of the Tabular Data Display to prepare the data
display for export. The data display is redrawn with no links, header, footer, or menu in a
comma delimited format.
A102721
Page 21
HydroLynx Systems, Inc.
NovaStar 5 Part I User Manual
Figure 6.6. Tabular Data Print
Figure 6.7. Tabular Data Export
Use the File – Save As feature in your browser to save the page to a file. Click the browser Back
button to return to the Tabular Data Display page.
Page 22
A102721
NovaStar 5 Part I User Manual
HydroLynx Systems, Inc.
7 Report Data
A request to display data from multiple points in a table can be made by any user. Click on the
Report Data menu list option, and the Report Data Request page is displayed.
Figure 7.1. Report Data Request
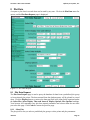
7.1 Report Data Request
The Report Data Request page is used to query the database for data from a predefined report
group or from selected report points. The data returned from the database query will be
organized based on the report group parameters. Click the Display button to retrieve the data
specified in the input fields organized under the Select Report, Select Display Time and
Interval, Display Options headings. Your browser will remember your report data request
parameters and restore them the next time you select this page. Click Cancel to return the
previous page.
A102721
Page 23
HydroLynx Systems, Inc.
NovaStar 5 Part I User Manual
7.1.1 Select Report
Report:
Select the report group to display from the pick list. Click Report: button to
change Report Pick Details and order, see Section 7.1.2.
View button displays the Report Edit page for the selected report, see Section
8.1.4 in Part II, Operator and Administrator Manual.
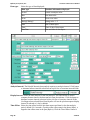
7.1.2 Report Pick Detail
The check boxes on Report Pick Details page control the items, organization, sort order, and
limit the records displayed on the pick list.
Figure 7.2. Report Pick Details
Select the details to display
Check the box to the left of a detail to display. Details are displayed in the order shown.
Check the Order by box for the detail to sort first. Check Reverse for a descending sort.
Check the Then by box for the detail to sort second. Check Reverse for a descending sort.
Check the second Then by box for the detail to sort third. Check Reverse for a descending sort.
Button
Action
Move Up
Move the selected detail up one row.
Move Down
Move the selected detail down one row.
Select All
Select all details.
Reset
Reset to default details.
OK
Return to previous page with new details selected.
Cancel
Return to prevous page with no changes.
Select the limits for the display
User:
Limit display to reports assigned to the user(s). Click User: button to change User
Pick Details and order. The pick list is a single select list by default. Click the
button to change to a multiple pick list. Control the pick list length with the
buttons that appear below the pick list label button.
Button Action
Reset pick list to single select.
Page 24
A102721
NovaStar 5 Part I User Manual
HydroLynx Systems, Inc.
Decrease pick list length.
Increase pick list length.
Scope:
Limit display to reports with scope: all, public, private.
User Group: Limit display to reports assigned to the user group(s). Click User Group: button
to change User Group Pick Details and order. The pick list is a single select list
by default. Click the button to change to a multiple pick list. Control the pick
list length with the buttons that appear below the pick list label button.
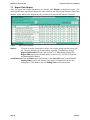
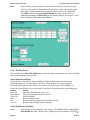
7.1.3 Report Point List
If the selected report group has a point override parameter set to true then the Point list is
displayed. The Point List displays the report point, analysis, and display parameters defined for
this report data request.
Click on the table column headers to resort the table for this column; first ascending, then
descending. Click on the Choose details... button to change the details and display order, see
Figure 7.4. Click on a table field to edit the text. Click Add to add an new point; the point list
add panel is opened, see Figure 7.5. Click Edit to edit an existing point; the edit panel is opened,
see Figure 7.6.
Figure 7.3. Report Point List
Button
Clear all
Select all
Add
Edit
Select
Delete
Move up
Move down
Apply
Close
Action
Clear selection of all rows in this table.
Select all rows in this table.
Opens the edit panel where you can enter the parameters for a new record.
Open the edit panel for this record.
Select row for applied changes from the edit panel; first select, then clear select.
Mark selected rows for deletion; first select, then clear select.
Move the selected rows up one row.
Move the selected rows down one row.
Assign changed field values to this and all other selected rows in the table.
Changed fields are highlighted with a blue-green background while unchanged
fields have a white background.
Close the edit panel without saving changes; you will be warned if changes will
be lost by this action.
ReportPoint List Details
The check boxes on Report Point List Details page control the items, organization, sort order,
and limit the records displayed on the associated List page.
Select the details to display
Check the box to the left of a detail to display. Details are displayed in the order shown.
Check the Order by box for the detail to sort first. Check Reverse for a descending sort.
Check the Then by box for the detail to sort second. Check Reverse for a descending sort.
Check the second Then by box for the detail to sort third. Check Reverse for a descending sort.
Button
A102721
Action
Page 25
HydroLynx Systems, Inc.
Move Up
Move Down
Select All
Reset
OK
Cancel
NovaStar 5 Part I User Manual
Move the selected detail up one row.
Move the selected detail down one row.
Select all details.
Reset to default details.
Return to previous page with new details selected.
Return to prevous page with no changes.
Figure 7.4. Report Point List Details
Figure 7.5. Report Point Add Panel
Page 26
A102721
NovaStar 5 Part I User Manual
HydroLynx Systems, Inc.
Point:
Select points to add to the point list from the pick list. Hold down the [Ctrl] key
and click to select multiple points. Hold down the [Shift] key and click to select
points from last selected to current selection. Click button to change Point Pick
Details and order, see Section 3.1.2.
Button Action
Decrease pick list length.
Increase pick list length.
Click the Apply button to add all selected points to the point list. The point list add panel will
change to the point list edit panel for the last point added. Then you assign other parameters to
each point. First click Clear all to de-select all points except the one shown in the edit panel.
Point list parameters
Panel:
Point:
Label:
Analysis:
Select the report panel for this point.
Select the point from the pick list. Click Point: button to change pick list details
and order, see Section 6.1.2.
Enter the report legend for this point. If blank the point pick list label is used.
Click button to fill in the default label for editing from the point pick details.
Select the data analysis for the point readout. See the data analysis appendix for a
description of the analysis types. Use default analysis will do the report data
request analysis selected. Any other analysis type selected will override the report
data request analysis.
Figure 7.6. Report Point Edit Panel
Data type:
A102721
Select the type of data displayed:
Data type
Database information displayed
Scaled
Scaled or analysis value
Raw
Raw data value
Score
Nova score value
Rating1-Rating5
Rating value 1 - 5
Date
Date of data report
Time
Time of day of data report
DateTime
Date and time of data report
Page 27
HydroLynx Systems, Inc.
NovaStar 5 Part I User Manual
Analysis Interval: The Rainfall Intensity data analysis requires an analysis interval. Click button
to alternate between interval selection from a pick list or from time interval fields.
Display Interval: Select the time interval for the data analysis. The time interval is used to
compute the start time for the data analysis from the end time. Click the button to
alternate between interval selection from a pick list or from time interval fields.
Use Request Interval and Show Data Reports will use the report data request
display interval if selected or 1 day by default
Time Offset: Select the time offset from the report data request end time for the data analysis
period, default if 0.0 seconds. A positive time offset starts in the future (After), a
negative time offset starts in the past (Before). Click the Time Offset: button to
select from a list of intervals. The time offset direction is selected from the
After/Before list. Click the button again to use the time offset fields.
Multiplier: Multiply the data analysis computed value by this constant.
Adder:
Add this constant to the data analysis computed value.
Data class: Select a class from the report style sheet to define the report data display style.
The default style is reportdata.
Display score: Select true to change the data class displayed for the data analysis score value.
The score value (1-5, 0 for missing) is appended to the data class name. For
example if the data class name is reportdata then a score of 1 will use the class
reportdata1, a score of 2 will use the class reportdata2, and so on. Missing data
will use the class reportdata0. This feature is false by default.
/* Report readout background colors for scores */
td.reportdata0 {color:#888888;background-color:#ffffff;}
td.reportdata,
td.reportdata1 {background-color:#ffffff;} /* white */
td.reportdata2 {background-color:#ffff44;} /* yellow */
td.reportdata3 {background-color:#ffaa44;} /* orange */
td.reportdata4 {background-color:#ff8866;} /* pink */
td.reportdata5 {background-color:#ff4444;} /* red */
Display digits: Set the number of decimal digits to display to the right of the decimal point.
Select default to use the number of display digits assigned to the point type.
7.1.4 Select Display Time and Interval
Starting Time: Select the starting time for the report. Click Reset Time to start of day for
ending time. Note: the starting time must be before the ending time.
Ending Time: Select the ending time for the report. Select Current in the pick list to set the
ending time to the current time. The Historic selection is shown when a past
ending time is selected.
Display Interval: Select the report point time interval for the report. Select Show Data Reports
to report data reports at the data report time. Click the button to alternate between
interval selection from a pick list or from time interval fields. This display interval
is only used if the report point analysis display interval is set to Use Request
Interval.
Scroll Interval: Select a scroll interval for time paging through report data. Click the Scroll
Interval: button to select from a list of intervals. Click the button again to use the
time interval fields.When a scroll interval is selected and the report is displayed,
then Back, Forward and Now buttons are displayed above the report. Click the
Back button to decrement or the Forward button to increment the Ending Time
Page 28
A102721
NovaStar 5 Part I User Manual
HydroLynx Systems, Inc.
by the Scroll Interval; the report is re-displayed with the new ending time. Click
Now to reset the Ending Time to the current time.
Refresh Interval: Select the interval to automatically refresh the report data display. Click the
Refresh Interval: button to select from a list of intervals. Click the button again to
use the time interval fields. This field is only available when the Ending Time is
set to the Current time.
7.1.5 Select Data Analysis
These fields are hidden when the display interval is set to Show Data Reports.
Data Analysis: Select the data analysis for the report data display. See the data analysis
appendix for a description of the analysis types. Use default analysis will do the
default analysis for the point type.
Data type:
Select the type of data displayed:
Data type
Database information displayed
Scaled
Scaled or analysis value
Raw
Raw data value
Score
Nova score value
Rating1-Rating5 Rating value 1 - 5
Date
Date of data report
Time
Time of day of data report
DateTime
Date and time of data report
Analysis Interval: The Rainfall Intensity data analysis requires an analysis interval. Click the
Analysis Interval: button to select from a list of intervals. Click the button again
to use the time interval fields.
Multiplier: Multiply the data analysis computed value by this constant.
Adder:
Add this constant to the data analysis computed value.
7.1.6 Display Options
Display Only:Select the display data restrictions:
Display type
Database information displayed
All data
All data, valid or questioned
Valid data
Data reports with a valid flag. A valid flag is automatically
set by the system when data checking criteria is met.
Verified data
Data reports with a verified flag. A verified flag is set by an
operator using the data editor to certify that the data is valid.
Maintenance data Data reports with a maintenance flag. A maintenance flag is
manually set by an operator to indicate test data not used for
public viewing. The maintenance flag is also set when a point
of station is out of service or when the data report received
has the test flag set.
Display Header: Select true to display the report header above the report display panel. The
report header is the report name, data analysis, ending time and display interval.
Select false to prevent the data table display.
A102721
Page 29
HydroLynx Systems, Inc.
NovaStar 5 Part I User Manual
7.2 Report Data Display
After the report data request parameters are entered, click Display to display the report. The
report header above the report displays the report label for the report group selected, report data
analysis, report ending time, display interval, and the scroll interval and buttons if selected.
Figure 7.7. Report Data Display
Report:
Click on the report group label to select a new report group from the report pick
list. The new report group is immediately reportted. Click button to change
Report Pick Details and order, see Section 7.1.2. View button displays the
Report Edit page for the selected report, see Section 8.1.4 in Part II, Operator
and Administrator Manual.
Scroll Interval: Click the Back button to decrement or the Forward button to increment the
Ending Time by the Scroll Interval; the report is re-displayed with the new
ending time. Click Now to reset the Ending Time to the current time.
Page 30
A102721
NovaStar 5 Part I User Manual
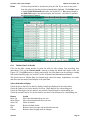
7.2.1
HydroLynx Systems, Inc.
Report Data List Details
Figure 7.8. Report Data List Details
Click on the table column headers to resort the table for this column; first ascending, then
descending. Click on the Choose details... button to change the details and display order, see
Figure 7.8.
The check boxes on Report Data List Details page control the items, organization, sort order, and
affect the data analysis and display of the report data.
Select the details to display
Check the box to the left of a detail to display. Details are displayed in the order shown.
Check the Order by box for the detail to sort first. Check Reverse for a descending sort.
Check the Then by box for the detail to sort second. Check Reverse for a descending sort.
A102721
Page 31
HydroLynx Systems, Inc.
NovaStar 5 Part I User Manual
Check the second Then by box for the detail to sort third. Check Reverse for a descending sort.
Button
Move Up
Move Down
Select All
Reset
OK
Cancel
Action
Move the selected detail up one row.
Move the selected detail down one row.
Select all details.
Reset to default details.
Return to previous page with new details selected.
Return to prevous page with no changes.
Display Only:Select the display data restrictions:
Display type
Database information displayed
All data
All data, valid or questioned
Valid data
Data reports with a valid flag. A valid flag is automatically
set by the system when data checking criteria is met.
Verified data
Data reports with a verified flag. A verified flag is set by an
operator using the data editor to certify that the data is valid.
Maintenance data Data reports with a maintenance flag. A maintenance flag is
manually set by an operator to indicate test data not used for
public viewing. The maintenance flag is also set when a point
of station is out of service or when the data report received
has the test flag set.
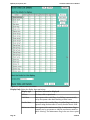
7.3 Report Data Print
Click on the Print button at the top or bottom of the Report Data Display to prepare the report
for printing. The report data display is redrawn with no links and no NovaStar 5 header or menu.
Figure 7.9. Report Data Print
Use the Print feature in your browser to print the page. Click the browser Back button to return
to the Report Data Display page.
7.4 Report Data Export
Click on the Export button at the top or bottom of the Report Data Display to prepare the data
display for export. The data display is redrawn with no links, header, footer, or menu in a
comma delimited format.
Page 32
A102721
NovaStar 5 Part I User Manual
HydroLynx Systems, Inc.
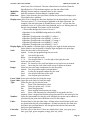
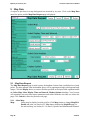
8 Plot Data
A request to plot data in a trend chart can be made by any user. Click on the Plot Data menu list
option, and the Plot Data Request page is displayed.
Figure 8.1. Plot Data Request
8.1 Plot Data Request
The Plot Data Request page is used to query the database for data from a predefined plot group
or from selected plot points. The data returned from the database query will be plotted in a trend
chart. Click the Display button to retrieve the data specified in the input fields organized under
the Select Plot, Select Display Time and Interval, Display Options, Plot Options headings.
Your browser will remember your plot data request parameters and restore them the next time
you select this page. Click Cancel to return the previous page.
8.1.1 Select Plot
The plot pick list lets you select a predefined plot group or select points and plot parameters.
A102721
Page 33
HydroLynx Systems, Inc.
Plot:
NovaStar 5 Part I User Manual
Select the plot group to display from the pick list. Select the first choice in the
pick list, Select point, to display Point list, see below. If the selected plot group
has a point override parameter set to true then the Point list is also displayed.
Click Plot: button to change Plot Pick Details and order, see Section 8.1.2.
View button displays the Plot Edit page for the selected plot, see Section 7.1.4 in
Part II, Operator and Administrator Manual.
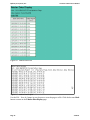
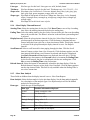
Figure 8.2. Plot Pick Details
8.1.2 Plot Pick Detail
The check boxes on Plot Pick Details page control the items, organization, sort order, and limit
the records displayed on the pick list.
Select the details to display
Check the box to the left of a detail to display. Details are displayed in the order shown.
Check the Order by box for the detail to sort first. Check Reverse for a descending sort.
Check the Then by box for the detail to sort second. Check Reverse for a descending sort.
Check the second Then by box for the detail to sort third. Check Reverse for a descending sort.
Button
Action
Move Up
Move the selected detail up one row.
Move Down
Move the selected detail down one row.
Select All
Select all details.
Reset
Reset to default details.
OK
Return to previous page with new details selected.
Cancel
Return to prevous page with no changes.
Select the limits for the display
User:
Limit display to plots assigned to the user(s). Click User: button to change User
Pick Details and order. The pick list is a single select list by default. Click the
Page 34
A102721
NovaStar 5 Part I User Manual
HydroLynx Systems, Inc.
button to change to a multiple pick list. Control the pick list length with the
buttons that appear below the pick list label button.
Button Action
Reset pick list to single select.
Decrease pick list length.
Increase pick list length.
Scope:
Limit display to plots with scope: all, public, private.
User Group: Limit display to plots assigned to the user group(s). Click User Group: button to
change User Group Pick Details and order. The pick list is a single select list by
default. Click the button to change to a multiple pick list. Control the pick list
length with the buttons that appear below the pick list label button.
8.1.3 Plot Point List
The Point List displays the plot point and plot parameters defined for this plot data request. Plot
point parameters define the point data analysis and plot options. Plot options include the plot
scale (left or right), plot scale invert, plot scale range type and limits, plot type (line, area, bar,
step, ...), line color, line type, line thickness, point point shape, shape color, shape filled. Multiple
plot levels can be defined to change the plot line color at different limits.
Click on the table column headers to resort the table for this column; first ascending, then
descending. Click on the Choose details... button to change the details and display order, see
Figure 8.4. Click on a table field to edit the text. Click Add to add an new point; the point list
add panel is opened, see Figure 8.5. Click Edit to edit an existing point; the edit panel is opened,
see Figure 8.6.
Figure 8.3. Plot Point List
Button
Clear all
Select all
Add
Edit
Select
Delete
Move up
Move down
Apply
Close
Action
Clear selection of all rows in this table.
Select all rows in this table.
Opens the edit panel where you can enter the parameters for a new record.
Open the edit panel for this record.
Select row for applied changes from the edit panel; first select, then clear select.
Mark selected rows for deletion; first select, then clear select.
Move the selected rows up one row.
Move the selected rows down one row.
Assign changed field values to this and all other selected rows in the table.
Changed fields are highlighted with a blue-green background while unchanged
fields have a white background.
Close the edit panel without saving changes; you will be warned if changes will
be lost by this action.
PlotPoint List Details
The check boxes on Plot Point List Details page control the items, organization, sort order, and
limit the records displayed on the associated List page.
A102721
Page 35
HydroLynx Systems, Inc.
NovaStar 5 Part I User Manual
Select the details to display
Check the box to the left of a detail to display. Details are displayed in the order shown.
Check the Order by box for the detail to sort first. Check Reverse for a descending sort.
Check the Then by box for the detail to sort second. Check Reverse for a descending sort.
Check the second Then by box for the detail to sort third. Check Reverse for a descending sort.
Button
Move Up
Move Down
Select All
Reset
OK
Cancel
Action
Move the selected detail up one row.
Move the selected detail down one row.
Select all details.
Reset to default details.
Return to previous page with new details selected.
Return to prevous page with no changes.
Figure 8.4. Plot Point List Details
Point:
Page 36
Select points to add to the point list from the pick list. Hold down the [Ctrl] key
and click to select multiple points. Hold down the [Shift] key and click to select
A102721
NovaStar 5 Part I User Manual
HydroLynx Systems, Inc.
points from last selected to current selection. Click button to change Point Pick
Details and order, see Section 3.1.2.
Button Action
Decrease pick list length.
Increase pick list length.
Click the Apply button to add all selected points to the point list. The point list add panel will
change to the point list edit panel for the last point added. You will then need to assign the other
parameters to each point. First click Clear all to de-select all points except the one shown in the
edit panel.
Point list parameters
Panel:
Point:
Label:
Select the plot panel for this point.
Select the point from the pick list. Click button to change pick list details and
order, see Section 6.1.2.
Enter the plot legend for this point. If blank the point pick list label is used. Click
button to fill in the default label for editing from the point pick details.
Figure 8.5. Plot Point Add Panel
Analysis:
A102721
Select the data analysis for the point readout. See the data analysis appendix for a
description of the analysis types. Use default analysis will do the plot data request
analysis selected. Any other analysis type selected will override the plot data
request analysis.
Page 37
HydroLynx Systems, Inc.
Data type:
NovaStar 5 Part I User Manual
Select the type of data displayed:
Data type
Database information displayed
Scaled
Scaled or analysis value
Raw
Raw data value
Score
Nova score value
Rating1-Rating5
Rating value 1 - 5
Date
Date of data report
Time
Time of day of data report
DateTime
Date and time of data report
Figure 8.6. Plot Point Edit Panel
Analysis Interval: The Rainfall Intensity data analysis requires an analysis interval. Click button
to alternate between interval selection from a pick list or from time interval fields.
Display Interval: Select the time interval for the data analysis. The time interval is used to
compute the start time for the data analysis from the end time. Click the button to
alternate between interval selection from a pick list or from time interval fields.
Use Request Interval and Show Data Reports will use the plot data request display
interval if selected or 1 day by default
Time Offset: Select the time offset from the plot data request end time for the data analysis
period, default if 0.0 seconds. A positive time offset starts in the future (After), a
negative time offset starts in the past (Before). Click the Time Offset: button to
Page 38
A102721
NovaStar 5 Part I User Manual
HydroLynx Systems, Inc.
select from a list of intervals. The time offset direction is selected from the
After/Before list. Click the button again to use the time offset fields.
Multiplier: Multiply the data analysis computed value by this constant.
Adder:
Add this constant to the data analysis computed value.
Data class: Select a class from the plot style sheet to define the plot data list display style.
The default style is plotdata.
Display score: Select true to change the data class displayed for the data analysis score value.
The score value (1-5, 0 for missing) is appended to the data class name. For
example if the data class name is plotdata then a score of 1 will use the class
plotdata1, a score of 2 will use the class plotdata2, and so on. Missing data will
use the class plotdata0. This feature is false by default.
/* Plot readout background colors for scores */
td.plotdata0 {color:#888888;background-color:#ffffff;}
td.plotdata,
td.plotdata1 {background-color:#ffffff;} /* white */
td.plotdata2 {background-color:#ffff44;} /* yellow */
td.plotdata3 {background-color:#ffaa44;} /* orange */
td.plotdata4 {background-color:#ff8866;} /* pink */
td.plotdata5 {background-color:#ff4444;} /* red */
Display digits: Set the number of decimal digits to display to the right of the decimal point.
Select default to use the number of display digits assigned to the point type.
Scale:
Select the plot scale for this plot point:
default: Let the plot program assign the plot scale.
Left:
Use the left plot scale.
Right:
Use the right plot scale.
3 – 9:
Use the plot scales 3 – 9 to the right of the right plot scale.
Invert:
Select the plot scale invert:
normal: No inversion. Plot scale has highest on top and lowest on bottom.
invert:
Invert the plot scale from lowest on top to highest on bottom.
Range:
Select the plot scale range computation for this plot point:
default: Use the plot data request scale parameter.
auto:
Let the plot program compute the plot scale.
fixed:
Use the plot scale limit to the right.
point:
Use the point plot scale limits.
Lower Limit: Lower plot scale limit for fixed plot range.
Upper Limit: Upper plot scale limit for fixed plot range.
Type:
Select the plot type for this plot point:
line:
Draw a line between plot points.
point:
Draw plot points only – no line.
bar:
Draw histogram bars.
step:
Draw stepped lines between plot points.
area:
Draw a line between plot points and fill in area under plot line.
steparea: Draw a stepped line between plot points and fill in area under plot line.
Number:
Select the limit number for this plot point. Multiple plot points can be added to a
plot that will plot point data in different colors for data ranges.
Limit:
Plot data limit for this plot data range. All data values from this limit to the next
are plotted with this plot point parameters. All data less than the first limit uses
that limit's plot point parameters. All data greater than the last limit uses that
limit's plot point parameters.
Line color: Plot line color for this level. Colors are: default, black, blue, cyan, gray, gray
dark, gray light, green, magenta, orange, pink, red, yellow.
A102721
Page 39
HydroLynx Systems, Inc.
NovaStar 5 Part I User Manual
Line type:
Plot line type for this level. Line types are: solid, dashed, dotted.
Thickness: Plot line thickness in pixels for this level. Thicknesses are: 1.0,1.5,2.0,2.5,...,5.0.
Shape color: Plot shape color for this level. Colors are: default, black, blue, cyan, gray, gray
dark, gray light, green, magenta, orange, pink, red, yellow.
Shape type: Plot shape at data points for this level. Shapes are: none, box, circle, diamond,
ellipse, rectangle down, rectangle up, triangle up, triangle down, triangle left,
triangle right.
Fill:
Plot shape fill for this level: true or false.
8.1.4 Select Display Time and Interval
Starting Time: Select the starting time for the plot. Click Reset Time to start of day for ending
time. Note: the starting time must be before the ending time.
Ending Time: Select the ending time for the plot. Select Current in the pick list to set the ending
time to the current time. The Historic selection is shown when a past ending time
is selected.
Display Interval: Select the plot point time interval for the plot. Select Show Data Reports to
plot data reports at the data report time. Click the button to alternate between
interval selection from a pick list or from time interval fields. This display interval
is only used if the plot point analysis display interval is set to Use Request
Interval.
Scroll Interval: Select a scroll interval for time paging through plot data. Click the Scroll
Interval: button to select from a list of intervals. Click the button again to use the
time interval fields.When a scroll interval is selected and the plot is displayed,
then Back, Forward and Now buttons are displayed above the plot. Click the
Back button to decrement or the Forward button to increment the Ending Time
by the Scroll Interval; the plot is re-displayed with the new ending time. Click
Now to reset the Ending Time to the current time.
Refresh Interval: Select the interval to automatically refresh the plot data display. Click the
Refresh Interval: button to select from a list of intervals. Click the button again to
use the time interval fields. This field is only available when the Ending Time is
set to the Current time.
8.1.5 Select Data Analysis
These fields are hidden when the display interval is set to Show Data Reports.
Data Analysis: Select the data analysis for the plot data display. See the data analysis appendix
for a description of the analysis types. Use default analysis will do the default
analysis for the point type.
Data type:
Select the type of data displayed:
Data type
Database information displayed
Scaled
Scaled or analysis value
Raw
Raw data value
Score
Nova score value
Rating1-Rating5 Rating value 1 - 5
Page 40
Date
Date of data report
Time
Time of day of data report
DateTime
Date and time of data report
A102721
NovaStar 5 Part I User Manual
HydroLynx Systems, Inc.
Analysis Interval: The Rainfall Intensity data analysis requires an analysis interval. Click the
Analysis Interval: button to select from a list of intervals. Click the button again
to use the time interval fields.
Multiplier: Multiply the data analysis computed value by this constant.
Adder:
Add this constant to the data analysis computed value.
8.1.6 Display Options
Display Only:Select the display data restrictions:
Display type
Database information displayed
Show Data:
All data
All data, valid or questioned
Valid data
Data reports with a valid flag. A valid flag is automatically
set by the system when data checking criteria is met.
Verified data
Data reports with a verified flag. A verified flag is set by an
operator using the data editor to certify that the data is valid.
Maintenance data Data reports with a maintenance flag. A maintenance flag is
manually set by an operator to indicate test data not used for
public viewing. The maintenance flag is also set when a point
of station is out of service or when the data report received
has the test flag set.
Select true to display the plot data reports in a table below the plot data display.
Select false to prevent the data table display.
8.1.7 Plot Options
Plot style:
Plot headings and data lists are drawn with the default styles for the NovaStar5
server. Select a custom plot style from Plot style list. The style files are
Cascading Style Sheets and are stored in the folder: /tomcat/local/styles.
Orientation: Select the multiple plot panel orientation: Vertical or Horizontal.
Legend:
Select true to display the plot legend at the bottom of the plot, false for no legend.
Plot time:
Select Absolute to display the plot time scale as date and time. Select Relative to
display the plot time scale as relative time from right to left.
Time interval: Select the plot time scale tick interval, default will automatically select an
interval. Click the TimeInterval: button to select from a list of intervals. Click the
button again to use the time interval fields.
Plot width: Enter the plot image width in pixels.
Plot height: Enter the plot image height in pixels. Click Reset to set the default width (500)
and default height (300).
8.2 Plot Data Display
After the plot data request parameters are entered, click Display to display the plot. The plot
header above the plot image displays the plot label for the plot group selected, point labels if
points were selected on the plot request page, plot ending time, display interval unless Show
Data Reports selected, and the scroll interval and buttons if selected.
Plot:
Point:
A102721
Click on the plot group label to select a new plot group from the plot pick list. The
new plot group is immediately plotted. Click button to change Plot Pick Details
and order, see Section 8.1.2. View button displays the Plot Edit page for the
selected plot, see Section 7.1.4 in Part II, Operator and Administrator Manual.
Click on the plot point label to select a new plot point from the point pick list.
Click button to change Point Pick Details and order, see Section 6.1.2. View
Page 41
HydroLynx Systems, Inc.
NovaStar 5 Part I User Manual
button displays the Point Edit page for the selected plot, see Section 3.1.4 in Part
II, Operator and Administrator Manual. After changing plot points, click the
Display button to display the plot data display with the newly selected points.
Scroll Interval: Click the Back button to decrement or the Forward button to increment the
Ending Time by the Scroll Interval; the plot is re-displayed with the new ending
time. Click Now to reset the Ending Time to the current time.
Data List:
Click Show Data to display the data reports table. Click Hide Data to eliminate
the data report table, see Section 8.2.3.
Figure 8.7. Plot Data Display
8.2.1 Plot Image Resizing
Icons on the left side of the plot can used to resize the plot.
Button
Action
Reset plot size to default.
Decrease plot height.
Increase plot height.
Decrease plot width.
Increase plot width.
8.2.2 Plot Data Tooltip
On the Plot Data Display you can mouse over a plot point to display a tooltip that shows the
point label, plot point time and data value. The point label is the point pick details or the point
label defined for the plot point.
Page 42
A102721
NovaStar 5 Part I User Manual
HydroLynx Systems, Inc.
8.2.3 Plot Data Drill Down
Click on a plot point to display the Data View/Edit page for the point, see Section 5 in Part II
Operator and Administrator Manual. This page is displayed showing the point data reports from
the plot starting to ending time.
Figure 8.8. Plot Data DisplayTooltip
8.2.4 Plot Data List
Select Show Data: true on the Plot Data Request page or click the Show data button below the
plot on the Plot Data Display page to show the plot data list.
Figure 8.9. Plot Data List
The Data list table shows all the point data reports plotted in vertically stacked tables. Clicking
on any of the column heading buttons will reorder the Data list, numerically or alphabetically,
A102721
Page 43
HydroLynx Systems, Inc.
NovaStar 5 Part I User Manual
by that detail. The Choose details… button allows you to specify what information is displayed
in the Data list using the Plot Data List Details page, see Section 8.2.5.
Click on the Edit button to the right of the point lable to display the Data Edit page showing the
point data reports from the plot starting to ending time.
8.2.5 Plot Data List Details
The check boxes on Plot Data List Details page control the items, organization, sort order, and
limit the records displayed on the data list.
Figure 8.10. Plot Data List Details
Select the details to display
Check the box to the left of a detail to display. Details are displayed in the order shown.
Check the Order by box for the detail to sort first. Check Reverse for a descending sort.
Check the Then by box for the detail to sort second. Check Reverse for a descending sort.
Check the second Then by box for the detail to sort third. Check Reverse for a descending sort.
Button
Action
Move Up
Move the selected detail up one row.
Move Down
Move the selected detail down one row.
Select All
Select all details.
Reset
Reset to default details.
OK
Return to previous page with new details selected.
Cancel
Return to prevous page with no changes.
Select the limits for the display
Display Only:Select the display data restrictions:
Display type
Database information displayed
Page 44
All data
All data, valid or questioned
Valid data
Data reports with a valid flag. A valid flag is automatically
set by the system when data checking criteria is met.
Verified data
Data reports with a verified flag. A verified flag is set by an
A102721
NovaStar 5 Part I User Manual
HydroLynx Systems, Inc.
operator using the data editor to certify that the data is valid.
Maintenance data Data reports with a maintenance flag. A maintenance flag is
manually set by an operator to indicate test data not used for
public viewing. The maintenance flag is also set when a point
of station is out of service or when the data report received
has the test flag set.
8.3 Plot Data Print
Click on the Print button at the top or bottom of the Plot Data Display to prepare the plot for
printing. The plot data display is redrawn with no links, header, footer, or menu.
Figure 8.11. Plot Data Print
Use the Print feature in your browser to print the page. Click the browser Back button to return
to the Plot Data Display page.
A102721
Page 45
HydroLynx Systems, Inc.
NovaStar 5 Part I User Manual
9 Map Data
A request to plot data on a map background can be made by any user. Click on the Map Data
menu list option, and the Map Data Request page is displayed.
Figure 9.1. Map Data Request
9.1 Map Data Request
The Map Data Request page is used to query the database for data from a predefined set of map
points. The data returned from the database query will be superimposed upon a background map
image. Click the Display button to retrieve the data specified in the input fields organized under
the Select Map, Select Display Time and Interval, Display Options headings. Your browser
will remember your map data request parameters and restore them the next time you select this
page. Click Cancel to return the previous web page.
9.1.1 Select Map
Map:
Select map for display from the pick list. Click Map: button to change Map Pick
Details and order, see Section 9.2. View button displays the MapEdit page for
the selected map, see Section 6.1.2 in Part II, Operator and Administrator Manual.
Page 46
A102721
NovaStar 5 Part I User Manual
HydroLynx Systems, Inc.
9.1.2 Map Pick Detail
The check boxes on Map Pick Details page control the items, organization, sort order, and limit
the records displayed on the pick list.
Figure 9.2. Map Pick Details
Select the details to display
Check the box to the left of a detail to display. Details are displayed in the order shown.
Check the Order by box for the detail to sort first. Check Reverse for a descending sort.
Check the Then by box for the detail to sort second. Check Reverse for a descending sort.
Check the second Then by box for the detail to sort third. Check Reverse for a descending sort.
Button
Action
Move Up
Move the selected detail up one row.
Move Down
Move the selected detail down one row.
Select All
Select all details.
Reset
Reset to default details.
OK
Return to previous page with new details selected.
Cancel
Return to prevous page with no changes.
Select the limits for the display
User:
Limit display to maps assigned to the user(s). Click User: button to change User
Pick Details and order. The pick list is a single select list by default. Click the
button to change to a multiple pick list. Control the pick list length with the
buttons that appear below the pick list label button.
Button Action
Reset pick list to single select.
Decrease pick list length.
Increase pick list length.
Scope:
Limit display to maps with scope: all, public, private.
A102721
Page 47
HydroLynx Systems, Inc.
NovaStar 5 Part I User Manual
User Group: Limit display to maps assigned to the user group(s). Click User Group: button to
change User Group Pick Details and order. The pick list is a single select list by
default. Click the button to change to a multiple pick list. Control the pick list
length with the buttons that appear below the pick list label button.
9.1.3 Select Display Time and Interval
Ending Time: Select the ending time for the data report search. Select Current in the pick list to
set the ending time to the current time. The Historic selection is shown when a
past ending time is selected. The Map Data Request page does not use a
Starting Time. The starting time is computed by subtracting the display interval
from the Ending Time.
Display Interval: Select the time interval for the map data analysis. The time interval is used to
compute the start time for the data analysis from the end time. Click the Display
Interval: button to select from a list of intervals. Click the button again to use the
time interval fields.
Scroll Interval: Select a scroll interval for time paging through map data. Click the Scroll
Interval: button to select from a list of intervals. Click the button again to use the
time interval fields.When a scroll interval is selected and the map is displayed,
then Back, Forward and Now buttons are displayed above the map. Click the
Back button to decrement or the Forward button to increment the Ending Time
by the Scroll Interval; the map is re-displayed with the new ending time. Click
Now to reset the Ending Time to the current time.
Refresh Interval: Select the interval to automatically refresh the map data display. Click the
Refresh Interval: button to select from a list of intervals. Click the button again to
use the time interval fields. This field is only available when the Ending Time is
set to the Current time.
9.1.4 Select Data Analysis
Data Analysis: Select the data analysis for the map data display. See the data analysis appendix
for a description of the analysis types. Use default analysis will do the default
analysis for the point type.
Data type:
Select the type of data displayed:
Data type
Database information displayed
Scaled
Scaled or analysis value
Raw
Raw data value
Score
Nova score value
Rating1-Rating5 Rating value 1 - 5
Date
Date of data report
Time
Time of day of data report
DateTime
Date and time of data report
Analysis Interval: The Rainfall Intensity data analysis requires an analysis interval. Click the
Analysis Interval: button to select from a list of intervals. Click the button again
to use the time interval fields.
Multiplier: Multiply the data analysis computed value by this constant.
Adder:
Add this constant to the data analysis computed value.
9.1.5 Display Options
Display Only:Select the display data restrictions:
Page 48
A102721
NovaStar 5 Part I User Manual
Show Data:
HydroLynx Systems, Inc.
Display type
Database information displayed
All data
All data, valid or questioned
Valid data
Data reports with a valid flag. A valid flag is automatically
set by the system when data checking criteria is met.
Verified data
Data reports with a verified flag. A verified flag is set by an
operator using the data editor to certify that the data is valid.
Maintenance data Data reports with a maintenance flag. A maintenance flag is
manually set by an operator to indicate test data not used for
public viewing. The maintenance flag is also set when a point
of station is out of service or when the data report received
has the test flag set.
Select true to display the map data reports in a table below the map data display.
Select false to prevent the data table display.
9.2 Map Data Display
After the map data request parameters are entered, a request for mapped data can be executed by
clicking Display. An example of the mapped display is shown below.
Figure 9.3. Map Data Display
A102721
Page 49
HydroLynx Systems, Inc.
NovaStar 5 Part I User Manual
The name of the map, the data analysis, ending time, and interval are displayed above the map.
Point data readouts are displayed on the map to the right of the green site marker. If no data was
available for the point, the string “N/A” is displayed and the site marker is red. Data readouts can
be highlighted with background colors for differenct nova scores. The background color gets
hotter (white yellow,orange,pink,red) as the nova score increases from 1 to 5. Use of the scored
background color is selected by the map owner when the map point readout is defined. A pop-up
tool-tip will appear when you mouse over a point readout or site marker, see Section 9.4.
Map:
Click on the map name to activate a selection list. Select another map for display
from the pick list. Click Map: button to change Map Pick Details and order, see
Section 9.1.1. View button displays the MapEdit page for the selected map, see
Section 6.1.2 in Part II, Operator and Administrator Manual.
Scroll Interval: Click the Back button to decrement or the Forward button to increment the
Ending Time by the Scroll Interval; the map is re-displayed with the new ending
time. Click Now to reset the Ending Time to the current time.
Data list:
Click Show data to display the map data reports in the data list table. Click Hide
data to eliminate the data list table, see Section 9.2.3.
9.2.1 Map Data Tooltip
On the Map Data Display you can mouse over a point data readout to display a tooltip that
shows the point label and data analysis. The point label is the point pick details or the point label
defined for the map point by the map owner.
9.2.2 Map Data Drill Down
Click on a point data readout to display the map point link page assigned to the point by the map
owner. The default map point link page is the Data Edit page, see Section 5 in Part II Operator
and Administrator Manual. This page is displayed showing the point data reports in the map
display interval up to the ending time.
9.2.3 Map Data Popup Menu
Right click on a point data readout to display the map point menu.
Figure 9.4. Map Data Popup Menu
The popup menu header is the tooltip displayed when you mouse over a map point readout. Click
on this menu item to display the map point link page assigned to the point by the map owner.
Page 50
A102721
NovaStar 5 Part I User Manual
HydroLynx Systems, Inc.
Click Display data to expand the menu
section, then click on a display data submenu selection to display tabular data
reports for the last day, week, month, or
year ending at the map display ending time.
Click Edit data to display the Data Edit
page for the point showing the data reports
for the map display interval ending a the
map display ending time.
Click Plot data to expand the menu
section, then click on a plot data sub-menu
selection to plot point data reports for the
last day, week, month, or year ending at the
map display ending time.
Click Point setup to expand the menu
section. Click Point parameters to display
the point edit page. Click Point alarm to
display the point alarm groups. Click Point
calibration to display the point calibration
list. Click Point rating to display the point
rating assignments.
Click Station setup to expand the menu
section. Click Station parameters to display
the point's assign station edit page. Click Station poll to display the station polling page.
9.2.4 Map Data List
Select Show Data: true on the Map Data Request page or click the Show data button below
the map on the Map Data Display page to show the map data list.
Figure 9.5. Map Data List
A102721
Page 51
HydroLynx Systems, Inc.
NovaStar 5 Part I User Manual
The Data list table shows all the map point data report plotted on the map background. Clicking
on any of the column heading buttons will reorder the Data list, numerically or alphabetically,
by that detail. The Choose details… button allows you to specify what information is displayed
in the Data list using the Map Data List Details page, see Section 9.2.4.
Click on the Edit button in the right column of a map point data row in the Data list table to
display the Data Edit page and show the point data reports for the map display interval ending a
the map display ending time.
9.2.5 Map Data List Details
The check boxes on Map Data List Details page control the items, organization, sort order, and
limit the records displayed on the pick list.
Figure 9.6. Map Data List Details
Select the details to display
Check the box to the left of a detail to display. Details are displayed in the order shown.
Check the Order by box for the detail to sort first. Check Reverse for a descending sort.
Check the Then by box for the detail to sort second. Check Reverse for a descending sort.
Check the second Then by box for the detail to sort third. Check Reverse for a descending sort.
Page 52
A102721
NovaStar 5 Part I User Manual
Button
Move Up
Move Down
Select All
Reset
OK
Cancel
HydroLynx Systems, Inc.
Action
Move the selected detail up one row.
Move the selected detail down one row.
Select all details.
Reset to default details.
Return to previous page with new details selected.
Return to prevous page with no changes.
Select the limits for the display
Display Only:Select the display data restrictions:
Display type
Database information displayed
All data
All data, valid or questioned
Valid data
Data reports with a valid flag. A valid flag is automatically
set by the system when data checking criteria is met.
Verified data
Data reports with a verified flag. A verified flag is set by an
operator using the data editor to certify that the data is valid.
Maintenance data Data reports with a maintenance flag. A maintenance flag is
manually set by an operator to indicate test data not used for
public viewing. The maintenance flag is also set when a point
of station is out of service or when the data report received
has the test flag set.
A102721
Page 53
HydroLynx Systems, Inc.
NovaStar 5 Part I User Manual
9.3 Map Data Print
Click on the Print button at the top or bottom of the Map Data Display to prepare the msp for
printing. The map data display is redrawn with no links, header, footer, or menu.
Figure 9.7. Map Data Print
Use the Print feature in your browser to print the page. Click the browser Back button to return
to the Map Data Display page.
Page 54
A102721
NovaStar 5 Part I User Manual
HydroLynx Systems, Inc.
10 About NovaStar 5
Click on the About NovaStar 5 menu list option to display the NovaStar 5 Version page. This
page displays the current software version and general contact information for HydroLynx
Systems, Inc. Links to documentation pages are shown under the menu button.
Figure 10. About NovaStar 5 Page
10.1 Documentation Links
Links to documentation pages are shown under the About NovaStar 5 menu button.
10.1.1 Change log
Displays a list NovaStar 5 versions and changes made to the program for the version upgrades.
10.1.2 User manual
Displays the NovaStar 5 Part I User Manual as a PDF document.
10.1.3 Operator manual
Displays the NovaStar 5 Part II Operator and Administrator Manual as a PDF document.
A102721
Page 55
HydroLynx Systems, Inc.
NovaStar 5 Part I User Manual
11 Contact HydroLynx
Click on the Contact HydroLynx menu list option to display the HydroLynx Contact
Information page. This page displays specific contact information for HydroLynx Systems, Inc.
staff working in customer support, sales, and general information.
Figure 11. HydroLynx Contact Information
Page 56
A102721
NovaStar 5 Part I User Manual
HydroLynx Systems, Inc.
12 Change Profile
Click on the Change Profile menu list option to display the User Edit page. This page displays
your login profile and allows you to change your password.
Figure 12. Change Profile
If you change your password then it must be confirmed. Press the Enter or Tab key on the
Password field and the Confirm field will appear. Enter the password a second time in this field
and press the Enter or Tab key again.
Identification
Table row: Field can not be modified; it is assigned automatically when a record is added.
User name: Login name can only be changed by administrator.
Password:
Password for login name. The password characters are hidden. Max: 50
characters. If you change the password, you will be asked to
Confirm:
If you change the password, you must confirm it on this line.
Full name: Full name of user. Max: 100 characters.
Phone:
User telephone number. Max: 50 characters.
Email:
User email address. Max: 100 characters.
A102721
Page 57
HydroLynx Systems, Inc.
Role:
NovaStar 5 Part I User Manual
Role defines the data access and security level of the user. The role can only be
changed by the administrator. Click Role: button to change User Role Pick
Details and order, see Section 10.2.2 in Part II, Operator and Administrator
Manual.
Role
Access
administrator
Read/write system access
guest
Read only access
operator
Read/write data access
supervisor
Read/write group access
User groups
The User groups table shows the user groups currently assigned to the user. Clicking on any of
the column heading buttons will reorder the user groups in the User groups list, numerically or
alphabetically, by that detail. Click the Details: button to change the User Group List details and
display order, see Section 10.3.1in Part II, Operator and Administrator Manual.
Click the Apply button to save the user parameters and stay on this page. Click OK to return to
the previous page.
Page 58
A102721
NovaStar 5 Part I User Manual
HydroLynx Systems, Inc.
A) Data Analysis
A number of statistical processing options available from the Data Analysis drop-down list can
create processed information that will be displayed for a point on a data display page when the
Display Interval is not Show Data Reports.
Table A.1.1. Data Analysis
Data Analysis
Use default
analysis
Description
The default analysis used to process data depends on the point type and
rating assignment.
Points that are assigned ratings to compute incremental rainfall use the
Period Rainfall analysis.
Counter class point types use the Difference in Report Values analysis.
Total class point types use the Sum of Report Values analysis.
All other point types use the Nearest Report to Interval analysis.
Nearest Report to
Find the data report nearest to the end of the Display interval boundary.
Interval
The report may occur before or after the interval boundary.
Last Report in
Find the last data report in the Display interval boundary without going
Interval
past the boundary.
Number of Reports Count the total number of reports in the Display interval.
Period Rainfall
Sum the incremental rainfall in the Display interval. The point must be
assigned an incremental rainfall rating.
Storm Rainfall
Find the last data report storm rainfall rating value in the Display interval.
Season Rainfall
Rainfall Intensity
Difference in
Report Values
Sum of Report
Values
Maximum
Minimum
Mean
Variance
A102721
The storm rainfall rating sums the incremental rainfall until the
incremental rainfall is 0. A time gap in the incremental rainfall of more
then the storm rainfall rating computation interval will restart the storm
rainfall accumulation.
Find the last data report season rainfall rating value in the Display
interval.
The season rainfall rating sums the incremental rainfall from the season
rainfall starting date. The season rainfall starting date is set in the season
rainfall rating effective time.
Find the maximum period rainfall for the Analysis interval over the
Display interval.
For example, find the maximum period rainfall for a 5 minute Analysis
interval over a one month Display interval.
Compute the difference between the last report in the Display interval and
the last report from the prior Display interval.
Compute the sum of report values within the Display interval.
Find the maximum value for the Display interval.
Find the minimum value for the Display interval.
Find the time-weighted average of the report values within the Display
interval.
Compute the variance of the time-weighted values within the Display
Page 59
HydroLynx Systems, Inc.
NovaStar 5 Part I User Manual
interval.
Standard Deviation Compute the standard deviation of the time-weighted values within the
Display interval.
Skew
Compute the skew of the time-weighted values within the Display
interval.
Coefficient of
Compute the coefficient of skew of the time-weighted values within the
Skew
Display interval.
Cooling Hours
Compute cooling hours from a base temperature that is defined as the
Adder under Data Analysis.
Heating Hours
Compute heating hours from a base temperature that is defined as the
Adder under Data Analysis.
Rate of Change in Compute the rate of change for the last report in the Display interval
Units per Second,
relative to the prior report in the Display interval. You can request rate of
Minute, Hour, or
change units as per day even if the Display interval is one hour. The
Day
analysis result displayed will be multiplied by 24 (e.g. a change of 1 unit
per hour = 24 units per day). You may wish to do this because some
SCADA applications expect data to be provided in gallons per day.
Runtime in
Runtime is the amount of time a digital status value is not zero. The
Seconds, Minutes, concept can also be applied to any other data type. The runtime is
Hours, Days
computed to determine values that answer questions like "How long was
the pump running on this day?" The time units (seconds, minutes, hours,
days) define the output value. For example, 55 seconds, 35 minutes, 2.5
hours, or .5 days.
Volume in Units
Integrates a volumetric flow rate over time to determine total volume. In
per Second,
NovaStar5, discharge is computed from stage using a rating table or
Minute, Hour, or
equation. Discharge data are stored in a rated data table. An optional
Day
check box is available in the User Interface to display rated data. The
volume computation units are the beginning data units integrated over
time. So if the data is stored in cubic feet per second or the rating table
output is cubic feet per second, then the volume units are cubic feet. To
convert cubic feet to acre feet, a multiplier is used and is selected from a
pick list in the advanced options to simplify the multiplier value entry.
Wind Speed
Compute the wind speed in units per hour from an incrementing
anemometer wind sensor (a non-ALERT wind point type) for the last
report in the Display interval.
Page 60
A102721