1
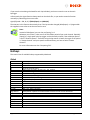
Table of Contents
Table of Contents
General
2
11
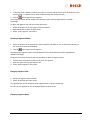
System Requirements ............................................................................................................................. 11
Symbols ................................................................................................................................................... 12
Copyright / License Agreement............................................................................................................... 14
Liability .................................................................................................................................................... 14
Glossary ................................................................................................................................................... 15
Supported Devices in WinDarab ............................................................................................................. 17
Driver Display Units (DDUs) ................................................................................................................ 17
Data Logger ......................................................................................................................................... 17
Program Start
18
Important Tips......................................................................................................................................... 19
Changing the Style .................................................................................................................................. 20
License..................................................................................................................................................... 20
Darab Ribbon
21
Start ......................................................................................................................................................... 21
Desktop ............................................................................................................................................... 21
Settings................................................................................................................................................ 23
Tools ........................................................................................................................................................ 23
Mathematics ....................................................................................................................................... 24
Settings................................................................................................................................................ 24
Flashcard ............................................................................................................................................. 24
Windows ................................................................................................................................................. 25
Dockable Window ............................................................................................................................... 25
Racetrack......................................................................................................................................... 25
Channels .......................................................................................................................................... 27
Colors .............................................................................................................................................. 28
Control Bars......................................................................................................................................... 28
Outing Bar ....................................................................................................................................... 28
Worksheet ........................................................................................................................................... 29
Worksheet controls............................................................................................................................. 29
All controls .......................................................................................................................................... 30
Current control.................................................................................................................................... 30
Desktop layout .................................................................................................................................... 31
Table of Contents
Page 2 of 282
File Explorer Window
32
Overlay .................................................................................................................................................... 35
Overlay Context Menu ........................................................................................................................ 35
Adding an overlay ............................................................................................................................... 36
Delete an overlay ................................................................................................................................ 37
Assign Overlay to File/Lap ................................................................................................................... 37
Drag and Drop ......................................................................................................................................... 37
File System Monitoring ........................................................................................................................... 38
File Explorer
39
Open File ................................................................................................................................................. 39
File Inform ........................................................................................................................................... 42
Locations ................................................................................................................................................. 43
Add folder to locations........................................................................................................................ 43
Racetracks
45
Creating a Racetrack ............................................................................................................................... 46
Deleting a Racetrack ............................................................................................................................... 47
Renaming a Racetrack ............................................................................................................................. 47
Editing a Racetrack .................................................................................................................................. 47
Selecting a Racetrack Segmentation ....................................................................................................... 48
Racetrack Dialog...................................................................................................................................... 48
Racetracks edit modes ............................................................................................................................ 49
Generate track based on recorded data ............................................................................................. 49
Speed and transversal acceleration ................................................................................................ 50
GPS: With left/right track boundary ............................................................................................... 52
GPS: Single lap with fixed track width............................................................................................. 54
Edit track by hand ............................................................................................................................... 55
Determine Segmentation.................................................................................................................... 58
Calculation Method “Transversal Acceleration” ............................................................................. 58
Calculation Method “Free definable” ............................................................................................. 59
How WinDarab Calculates a Segmentation .................................................................................... 61
Edit Segmentation ............................................................................................................................... 61
Adding a new Segment Marker....................................................................................................... 62
Deleting a Segment Marker ............................................................................................................ 63
Changing Segment Color ................................................................................................................. 63
Changing Segment Name ................................................................................................................ 63
Create segmentation....................................................................................................................... 64
Remove segmentation .................................................................................................................... 64
Rename segmentation .................................................................................................................... 64
ASCII Export ............................................................................................................................................. 64
Logged Data Files
68
Opening a Logged Data File .................................................................................................................... 68
Closing a Logged Data File....................................................................................................................... 70
Creating a Logged Data File..................................................................................................................... 71
Create a Logged Data File from an ASCII file................................................................................... 71
Reading Logged Data .............................................................................................................................. 72
Using the data logger import dialog ....................................................................................................... 72
Settings-Tab ........................................................................................................................................ 72
Table of Contents
Page 3 of 282
Source Settings................................................................................................................................ 74
Burst settings .................................................................................................................................. 75
Advanced Settings ........................................................................................................................... 76
Comment Fields .............................................................................................................................. 76
Current import-Tab ............................................................................................................................. 77
Reimport files…. .............................................................................................................................. 79
Recent import-Tab .............................................................................................................................. 79
Import Process .................................................................................................................................... 81
Tips for setting the paths ................................................................................................................ 81
Importing Longterm Data ....................................................................................................................... 81
Settings-Tab ........................................................................................................................................ 82
File Password Protection......................................................................................................................... 83
Change File Password ......................................................................................................................... 83
Open Password-protected Files .......................................................................................................... 84
Creating a Password-protected File .................................................................................................... 84
Data Protection and Downward Compatibility ....................................................................................... 85
Using Wildcards in Sub-Folders and File Names ..................................................................................... 85
Desktop
87
Loading a Desktop ............................................................................................................................... 88
Saving a Desktop ................................................................................................................................. 89
Oscilloscope
90
Areas ....................................................................................................................................................... 91
Creating an Area.................................................................................................................................. 91
Changing the Size of an Area .............................................................................................................. 92
Deleting an Area.................................................................................................................................. 92
Modes ................................................................................................................................................. 93
Channels .................................................................................................................................................. 93
Selecting and Adding Channels ........................................................................................................... 93
Adding Channels ................................................................................................................................. 97
Removing Channels ............................................................................................................................. 98
Additional Functions ........................................................................................................................... 99
Axes ....................................................................................................................................................... 104
Adding a new Axis ............................................................................................................................. 104
Customizing Axes .............................................................................................................................. 104
Size ................................................................................................................................................ 104
Value ............................................................................................................................................. 105
Configurations ....................................................................................................................................... 106
Saving a Configuration ...................................................................................................................... 107
Add Settings ...................................................................................................................................... 108
Load Settings ..................................................................................................................................... 109
Replace Settings ................................................................................................................................ 110
Select oscilloscope configuration Dialog Box .................................................................................... 110
Working with Oscilloscopes .................................................................................................................. 111
Crosshairs .......................................................................................................................................... 111
Tag ..................................................................................................................................................... 112
Marked range (Selection).................................................................................................................. 113
Mouse Functions ............................................................................................................................... 114
Keyboard Functions .......................................................................................................................... 115
Zooming and Comparing ....................................................................................................................... 116
Table of Contents
Page 4 of 282
Adding a File ...................................................................................................................................... 117
Adding a Lap ...................................................................................................................................... 119
Change Color ..................................................................................................................................... 120
Deleting a File.................................................................................................................................... 120
Replacing a File.................................................................................................................................. 121
Replacing file settings ....................................................................................................................... 122
Selecting Laps .................................................................................................................................... 122
Lining Up Axes ................................................................................................................................... 123
Manual Lap Trigger ............................................................................................................................... 124
Insert Lap Trigger .............................................................................................................................. 125
Deleting a Lap Trigger ....................................................................................................................... 125
Laptrigger Manager........................................................................................................................... 126
Defining an In-/Outlap .................................................................................................................. 127
Deleting a Laptrigger ..................................................................................................................... 127
Split Lap ......................................................................................................................................... 127
Generate Laptrigger ...................................................................................................................... 128
Display Options ..................................................................................................................................... 130
X-Axes................................................................................................................................................ 130
Lap Trigger......................................................................................................................................... 130
Racetrack Segments .......................................................................................................................... 131
Segment borders ............................................................................................................................... 131
Grid.................................................................................................................................................... 131
Replay offline files ................................................................................................................................. 132
Additional Windows
133
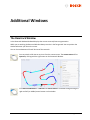
The Racetrack Window ......................................................................................................................... 133
3D overview .................................................................................................................................. 135
3D drivers view.............................................................................................................................. 135
The Vehicle Position .......................................................................................................................... 136
Multi Segmentations ..................................................................................................................... 137
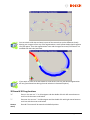
3D Zoom & 3D Drag functions .......................................................................................................... 138
Zooming a Segment .......................................................................................................................... 139
Context Menu ................................................................................................................................... 139
The Inform Window .............................................................................................................................. 139
Open .................................................................................................................................................. 140
Start/ Inform page/ Show page .................................................................................................... 141
Start/ Edit/ Comments .................................................................................................................. 141
Comment fields tab ....................................................................................................................... 142
Text field tab ................................................................................................................................. 143
Special Channels
144
Internal Channels .................................................................................................................................. 144
Special channels settings ...................................................................................................................... 145
Defining a special channels list ......................................................................................................... 145
Mathematical Channels (and Filters) .................................................................................................... 147
Working with Functions .................................................................................................................... 147
Defining a Function ........................................................................................................................... 148
Expression Tab .............................................................................................................................. 149
Format Tab .................................................................................................................................... 151
Computing Tab .............................................................................................................................. 151
Filter Functions.................................................................................................................................. 153
Table of Contents
Page 5 of 282
Bandpass, Lowpass, Highpass, and Stopband Functions .............................................................. 154
Filter Function ............................................................................................................................... 155
BandpassFIR, LowpassFIR and HighpassFIR Functions.................................................................. 156
Lookup Tables ................................................................................................................................... 156
Defining a Lookup Table................................................................................................................ 156
Lookup Table dialog ...................................................................................................................... 157
Using the lookup table .................................................................................................................. 158
Lookup table example ................................................................................................................... 159
Math-Inspector ................................................................................................................................. 159
Conditions ............................................................................................................................................. 160
Defining a Condition ......................................................................................................................... 161
Deleting a Condition ......................................................................................................................... 161
Temporary Conditions ...................................................................................................................... 162
Visualizing the Condition................................................................................................................... 162
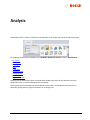
Analysis
163
Settings in Analysis Windows ................................................................................................................ 164
Load Settings ..................................................................................................................................... 164
Save Settings ..................................................................................................................................... 165
Common Overlays Settings ............................................................................................................... 166
ASCII Export ....................................................................................................................................... 166
(x, y)-Plot ............................................................................................................................................... 166
(x, y)-Plot Settings ............................................................................................................................. 167
Overlays Tab .................................................................................................................................. 168
Axes Tab ........................................................................................................................................ 168
Option Tab .................................................................................................................................... 169
Colors Tab ..................................................................................................................................... 169
Working with the (x, y)-Plot Window................................................................................................ 170
Basic .............................................................................................................................................. 170
Drag & Drop .................................................................................................................................. 173
Distribution ........................................................................................................................................... 173
Distribution Settings ......................................................................................................................... 174
Overlays Tab .................................................................................................................................. 175
Axes Tab ........................................................................................................................................ 175
Surface Tab.................................................................................................................................... 176
Colors Tab ..................................................................................................................................... 177
Working with the Distribution Window ............................................................................................ 178
Drag & Drop .................................................................................................................................. 180
Copy to clipboard .......................................................................................................................... 180
Histogram .............................................................................................................................................. 180
Histogram Settings ............................................................................................................................ 182
Overlays Tab .................................................................................................................................. 182
Axes Tab ........................................................................................................................................ 183
Option Tab .................................................................................................................................... 184
Colors Tab ..................................................................................................................................... 184
Working with the Histogram Window .............................................................................................. 185
2D view as bars ............................................................................................................................. 185
2D view as lines ............................................................................................................................. 185
3D view.......................................................................................................................................... 186
2D Zooming ................................................................................................................................... 186
Zoom functions ............................................................................................................................. 187
Table of Contents
Page 6 of 282
Multi-channel mode...................................................................................................................... 187
Selecting/Unselecting Bars ........................................................................................................... 188
Drag & Drop .................................................................................................................................. 188
FFT ......................................................................................................................................................... 188
FFT Settings ....................................................................................................................................... 190
Input Tab ....................................................................................................................................... 191
Diagram configuration Tab ........................................................................................................... 192
Working with the FFT Window ......................................................................................................... 193
2D view as bars ............................................................................................................................. 193
2D view as lines ............................................................................................................................. 193
3D view as bars ............................................................................................................................. 193
FFT 2D Zooming............................................................................................................................. 194
FFT 3D Zooming............................................................................................................................. 194
Flowchart .............................................................................................................................................. 195
Flowchart Settings............................................................................................................................. 196
Setup Dialog Box ........................................................................................................................... 196
Flowchart Pages ................................................................................................................................ 197
Elements of Output Page .................................................................................................................. 197
Output Table ................................................................................................................................. 197
Output Value ................................................................................................................................. 199
Output Racetrack .......................................................................................................................... 199
Elements of Design page ................................................................................................................... 200
Start ............................................................................................................................................... 201
Compare ........................................................................................................................................ 201
Condition ....................................................................................................................................... 202
Container....................................................................................................................................... 202
Exit................................................................................................................................................. 204
Formula ......................................................................................................................................... 204
Join ................................................................................................................................................ 205
Next sample .................................................................................................................................. 205
Range ............................................................................................................................................ 205
Select case ..................................................................................................................................... 206
Print in table .................................................................................................................................. 207
Print in value ................................................................................................................................. 207
Segmentation in racetrack ............................................................................................................ 208
Links .............................................................................................................................................. 209
Working with the Flowchart Window ............................................................................................... 209
Bases ............................................................................................................................................. 209
Inserting, deleting objects............................................................................................................. 210
Moving, copying, pasting .............................................................................................................. 210
Resizing objects ............................................................................................................................. 211
Connectors of an object ................................................................................................................ 211
Connecting objects with links in design pages.............................................................................. 211
Editing links ................................................................................................................................... 211
Executing the flows ....................................................................................................................... 212
Errors ............................................................................................................................................. 213
Table Min/Max ...................................................................................................................................... 214
Min/Max Table Settings .................................................................................................................... 215
Overlays Tab .................................................................................................................................. 215
Add Channels Tab.......................................................................................................................... 216
Results Window ................................................................................................................................ 217
Outing Report........................................................................................................................................ 217
Table of Contents
Page 7 of 282
Outing Report Window ..................................................................................................................... 218
Working with the Results Table .................................................................................................... 218
Settings.............................................................................................................................................. 219
Columns Tab.................................................................................................................................. 219
Segments Tab ................................................................................................................................ 220
Options Tab ................................................................................................................................... 221
Colors Tab ..................................................................................................................................... 222
Start/ Overlay ................................................................................................................................ 223
Lap Analysis ........................................................................................................................................... 223
Analysis Rules .................................................................................................................................... 223
Channel Names ............................................................................................................................. 223
Functions ....................................................................................................................................... 224
Course Segment ............................................................................................................................ 224
Style Attributes ............................................................................................................................. 224
The Lap Analysis Window ................................................................................................................. 225
Working with the Lap Analysis Window ....................................................................................... 225
Delete Result ................................................................................................................................. 225
Insert Result of Position Rules ...................................................................................................... 226
Recalculate all ............................................................................................................................... 226
Show file Legend ........................................................................................................................... 226
Lap Analysis Settings ......................................................................................................................... 226
Overlays Tab .................................................................................................................................. 227
Rules Tab ....................................................................................................................................... 228
Calculate Segmentation Tab ......................................................................................................... 229
Style and Display ........................................................................................................................... 230
Telemetry
232
Instrument panel................................................................................................................................... 233
Value display ..................................................................................................................................... 234
Common Tab ................................................................................................................................. 234
Alerts Tab ...................................................................................................................................... 235
Bar display ......................................................................................................................................... 235
Common Tab ................................................................................................................................. 236
Bar Tab .......................................................................................................................................... 236
Alerts Tab ...................................................................................................................................... 237
Round scale display ........................................................................................................................... 237
Common Tab ................................................................................................................................. 238
Style Tab ........................................................................................................................................ 238
Alerts Tab ...................................................................................................................................... 239
Bit panel ............................................................................................................................................ 239
Common Tab ................................................................................................................................. 240
Alerts Tab ...................................................................................................................................... 240
Current lap time ................................................................................................................................ 241
Common Tab ................................................................................................................................. 241
Previous lap time .............................................................................................................................. 241
Common Tab ................................................................................................................................. 241
Settings.............................................................................................................................................. 242
Load Settings ................................................................................................................................. 242
Save Settings ................................................................................................................................. 242
Add Settings .................................................................................................................................. 242
Wrong Settings .............................................................................................................................. 242
Table of Contents
Page 8 of 282
Events .................................................................................................................................................... 243
Settings
244
Color Tab ............................................................................................................................................... 244
SET Path Tab.......................................................................................................................................... 245
DCP Tab ................................................................................................................................................. 245
Measurement windows ........................................................................................................................ 246
Drawing Differences...................................................................................................................... 247
Draw Channels .............................................................................................................................. 247
Changing the y-axis view ............................................................................................................... 247
Miscellaneous Tab................................................................................................................................. 247
At program exit ask for a confirmation ......................................................................................... 248
Decimal comma for ASCII-Export .................................................................................................. 248
Comments Tab ...................................................................................................................................... 248
Adding a Comment Field ................................................................................................................... 249
Deleting a Comment Field................................................................................................................. 249
Determining the Sequence of Comment Fields ................................................................................ 249
Setting Default Values ....................................................................................................................... 249
Physical Units Tab ................................................................................................................................. 250
Rules-Page ......................................................................................................................................... 251
Details-Page ...................................................................................................................................... 252
Telemetry .............................................................................................................................................. 253
Import default ....................................................................................................................................... 254
Channel Settings
255
Making Channel Settings....................................................................................................................... 255
Importing Descriptions.......................................................................................................................... 258
Channel Colors ...................................................................................................................................... 258
Miscellaneous
260
Extracting Logged Data ......................................................................................................................... 260
Extracting a File Section .................................................................................................................... 260
ASCII Extract (Logged Data)............................................................................................................... 261
ASCII-Extract (Analysis Window) ....................................................................................................... 262
Printing .................................................................................................................................................. 262
Print Options ..................................................................................................................................... 262
Print Preview ..................................................................................................................................... 263
Print ................................................................................................................................................... 264
Command line ................................................................................................................................... 264
Historical cars
265
Creating a Logged Data File from DOS Format ..................................................................................... 265
Reader / CanCard Support .................................................................................................................... 266
Reading Data From a Reader ............................................................................................................ 266
Waiting Status ............................................................................................................................... 266
Reading Reader Data..................................................................................................................... 267
Appendix
268
Mathematical Expressions .................................................................................................................... 268
Constants: ......................................................................................................................................... 268
Table of Contents
Page 9 of 282
Arithm operators: ............................................................................................................................. 268
Comparisons: .................................................................................................................................... 268
Logical operators ............................................................................................................................... 269
General functions .............................................................................................................................. 269
Math. Functions ................................................................................................................................ 269
Trace functions.................................................................................................................................. 270
IIR Filter Functions ............................................................................................................................ 270
Lookup Function................................................................................................................................ 272
Examples ........................................................................................................................................... 273
Example with sigma and dt: Integration over time....................................................................... 273
Example with delta and dt: Derivation of a channel..................................................................... 273
Example with HOLD: Filtering measurement errors ..................................................................... 273
Example with sigma, dt, delta, and HOLD: Calculating “highspeed”-duration for each lap ......... 273
Hotkeys ................................................................................................................................................. 274
Global ................................................................................................................................................ 274
File Explorer Pane ............................................................................................................................. 275
Channels pane ................................................................................................................................... 275
Oscilloscope ...................................................................................................................................... 275
Inform window .................................................................................................................................. 276
Racetrack........................................................................................................................................... 276
XY-Plot ............................................................................................................................................... 276
Histogram .......................................................................................................................................... 276
Distribution ....................................................................................................................................... 277
Fast Fourier Transformation ............................................................................................................. 277
Flow Chart ......................................................................................................................................... 277
OutingReport..................................................................................................................................... 277
Lap analysis ....................................................................................................................................... 277
Instrument Panel............................................................................................................................... 277
ASCII Import File Format ....................................................................................................................... 278
ASCII Extract File Format ....................................................................................................................... 279
Miscellaneous Settings.......................................................................................................................... 279
Deleting Folders and Files ................................................................................................................. 279
Reading Data ......................................................................................................................................... 280
Auto resolving of supplicated channel names ...................................................................................... 280
Table of Contents
Page 10 of 282
General
WinDarab enables you to analyse and display logged data recorded by BOSCH Motronic®.
System Requirements
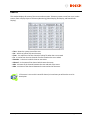
Hardware
Minimum
Pentium 800 MHz processor
128 MB RAM
800 x 600, 256 colors video
resolution
Video card with 3D hardware
General
Recommended
Pentium 1 GHz processor
over 256 MB RAM
1024 x 768, 24-Bit color
video resolution
Video card with 3D
hardware accelerator
Page 11 of 282
accelerator support for
OpenGL
Mouse
support for OpenGL
3-Button Mouse
Operating System and
Software
MS Windows XP, Vista, 7
Known hardware problems
During development of the 3D functions we got several problems with
certain graphic chips. Our developers tried to work solve these
problems but still, we have known problems concerning certain chip
sets and their drivers:
Chipset S3 Savage IX/VX
The Windows XP drivers are very slow if the mouse cursor is inside of
a 3D drawing area.
Additionally the driver causes sometimes blue screens.
Our developers made best experience with graphic chips like ATI
Radeon or Nvidia.
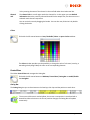
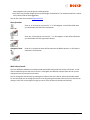
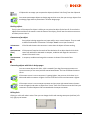
Symbols
The user manual employs the following symbols:
This symbol means that an action with the right mouse button should be performed at
this time. The action itself is highlighted in bold and italicized. The object is highlighted
in bold font.
This symbol means that an action with the left mouse button should be performed at
this time. The action itself is highlighted in bold and italicized. The object is highlighted
in bold font.
This symbol means that an action with the left and right mouse (or middle) button
should be performed at this time. The action itself is highlighted in bold and italicized.
The object is highlighted in bold font.
This symbol means that input should be provided with the keyboard. The action itself is
highlighted in bold and italicized. The object is highlighted in bold font.
General
Page 12 of 282
This symbol means that something special must be noted.
General
Page 13 of 282
Copyright / License Agreement
We thank you for choosing a Bosch Motorsport product. Please remember that it is the user’s
responsibility to comply with all applicable copyright laws.
Bosch Engineering GmbH
Motorsport
Robert-Bosch-Allee 1
74232 Abstatt
Germany
All rights reserved.
No part of this program or this manual may--in any manner whatsoever-- be reproduced, modified,
shared, translated into another language (including computer languages), or stored electronically
without the prior written consent of Robert Bosch GmbH.
Any unauthorized transmission of the program and/or manual will be prosecuted under criminal law.
The License Agreement entitles you to work with this software. You may not, however, run this
software concurrently on different computers.
Liability
In no event will Robert Bosch GmbH, or any person involved in the development, production, or
distribution of this software be liable to you for any consequential, incidental, or indirect damages
including damages for loss of business profits or diminished cost savings.
General
Page 14 of 282
Glossary
Area
Refers to the horizontal division of a Oscilloscope in which channel signals
are displayed.
Base Directory
A Base Directory represents a link to a particular folder on the hard drive
(--> network). WinDarab saves data in sub-folders within a specified base
directory.
Base Directory for
Calculating Differences
Logged Data Directory that provides channel values (for the second channel)
for calculating a difference.
Bit Area
See Area
CAN
Controller Area Network
CanCard
Most commonly used hardware for data recording. A more recent device is
CardMemory.
Channels
Separate data signals within a recording.
Conditions
A condition is a linked set of mathematical criteria that must be met in a
specific sample in order for that data sample to be included in an evaluation.
Configuration
A particular arrangement of channels, which can be loaded and displayed in
a Oscilloscope.
Darab Explorer
Darab Explorer is used in WinDarab to manage Racetrack and Logged Data
Files.
Data Logger
Data Logging Device for Measurement Channels
Differences
The Differences Channel is a special channel that calculates values for the
difference resulting from a comparison of the same channel in two different
Logged Data Files.
DLS
Data Logging System (consists of C55 Data Logger and MSI Devices)
DOS Format
DOS Darab, WinDarab’s precursor, uses a data format that cannot be
directly processed by WinDarab.
ECU
Engine Control Unit
Grid
Grid lines which can be displayed in a Oscilloscope.
General
Page 15 of 282
Logged Data File
A Logged Data File contains all data recorded in a vehicle.
Racetrack or Racecourse
A Racetrack or Racecourse is the location where vehicle data recording has
taken place. WinDarab assumes that the selected racetrack corresponds to
the racetrack where data was actually recorded.
Reader
See CanCard
General
Page 16 of 282
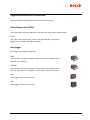
Supported Devices in WinDarab
WinDarab supports the following devices from Bosch Motorsport.
Driver Display Units (DDUs)
The display types from Bosch Motorsport are referred to as DDU (Driver Display Unit).
DDU8
(TFT high contrast color display, up to 12 user-defined pages, internal data
logging, sensor interface and CAN In-/Output)
Data Logger
Data Loggers supported by WinDarab:
C 40
(Used for data recording and storage of data transferred via CAN-bus from
ECUs MS 3.x and MS 4.x)
C 40 Plus
(Used for data recording and storage of data transferred via CAN-bus from
ECUs MS 3.x and MS 4.x. In addition, up to 15 sensors can be connected)
C 55
(Data Logger with Firewire interface)
C 60
(Data Logger with Ethernet interface)
General
Page 17 of 282
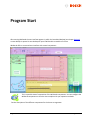
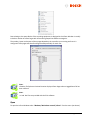
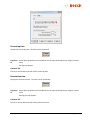
Program Start
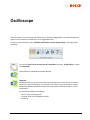
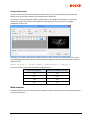
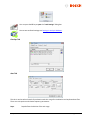
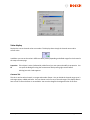
After starting WinDarab the user interface appears in which the last edited desktop (see chapter Desktop)
or new desktop is opened. A new desktop will open if WinDarab is started the first time.
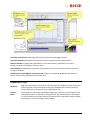
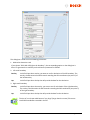
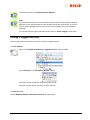
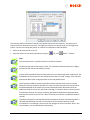
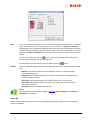
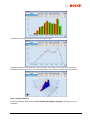
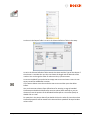
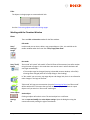
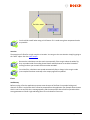
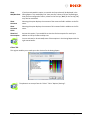
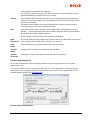
WinDarab offers a structured user interface with several components:
This is a possible view of composition of the WinDarab components. You can configure the
WinDarab components so that the view complies with your operation methods.
Further description of the different components for the shown arrangement:
Program Start
Page 18 of 282
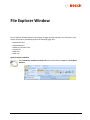
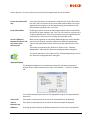
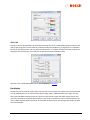
File Explorer window displayed upper left contains the list of opened logger data files.
Racetrack window placed bottom left shows the current racetrack and course segmentation.
Channels window arranged upper right displays a list of measurement, mathematical, internal or
temporary channels according to the users’ choice.
Color window arranged bottom right allows you to pick a color for an element (for instance a channel in
an analysis window).
Oscilloscope, Analysis Window, Instrument Panel resides in the middle of WinDarab and represents
data or results of the calculations that are performed.
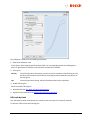
Important Tips
Keyboard
Context
Menu
Program Start
Right next to some menu items you will also see keystroke combinations that allow you to
perform functions from your keyboard. Using your keyboard rather than the mouse to
execute frequently used functions saves a great deal of time.
The context menu of an element (window, channel etc.) contains a list of frequently used
and useful functions. It is opened by clicking with the right mouse button on the element.
In case the element has a zoom function, the context menu is opened by using the middle
mouse button, or the left and right mouse buttons.
Page 19 of 282
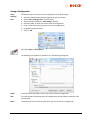
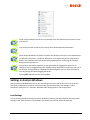
Changing the Style
You can change the style of your WinDarab7 by clicking on Style in the top right of the
window and then chose a style from the dropdown-box.
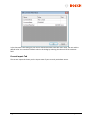
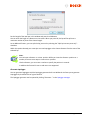
License
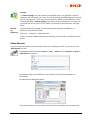
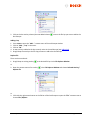
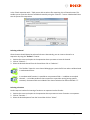
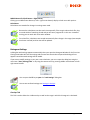
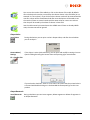
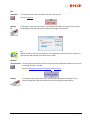
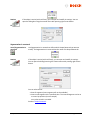
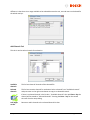
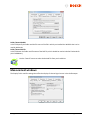
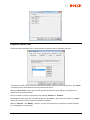
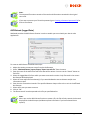
If you want to update your WinDarab7-License, you can do this by clicking on WinDarab-Button/ Tools/
Update license ...
From here on just follow the instructions. There are two ways to install a new WinDarab7 license.
1. You can insert a license file (.lic)
2. You can insert a license number. For this option you have to be connected to the internet
To check your license information, just click on WinDarab-Button/ Tools/ Show license information
Program Start
Page 20 of 282
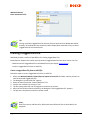
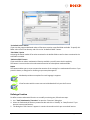
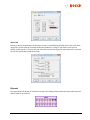
Darab Ribbon
WinDarab menu and toolbars are organized in a Ribbon. The Ribbon is designed to help you quickly find
commands and perform tasks. The commands are grouped logical together and placed in a tab. Darab
Ribbon consists at least the following tabs:
Start
The tool tabs on the Start tab depend on which analysis window is currently active. If no analysis window is
opened the Start tab contains the following tool tabs (see chapter Analysis and Oscilloscope)
Desktop
Settings
When at least one analysis window is opened the analysis window specific tool tabs will be displayed right
of the Settings tool tab.
For example here are the tool tabs of the oscilloscope:
Desktop
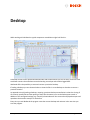
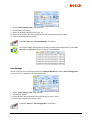
The tool tab Desktop provides tools for creating, loading and storing a desktop.
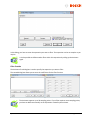
Start/Desktop/ New
Darab Ribbon
This item will destroy all worksheets and create a worksheet with a single
oscilloscope.
Page 21 of 282
See chapter Desktop for a detailed description.
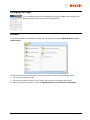
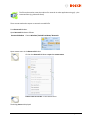
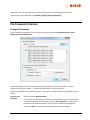
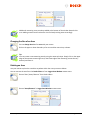
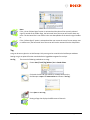
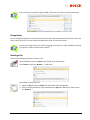
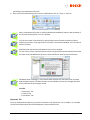
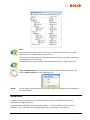
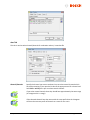
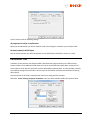
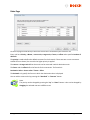
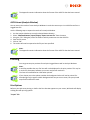
Start/Desktop/ Load Open the Load desktop dialog box and select the desktop you want to load.
Select the Desktop file
Click on the Open button
Start/ Desktop/
Load (Dropdown)
You can also open a recently opened desktop by clicking on the dropdown-button
right to the Load-button and chose a Desktop-file from the list.
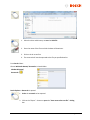
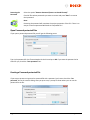
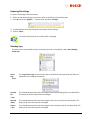
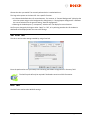
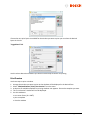
Start/Desktop/ Save
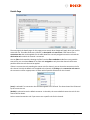
Open the Save desktop dialog box to save the current desktop.
Darab Ribbon
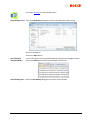
Page 22 of 282
1. Navigate to the folder you want to store the current desktop
2. Enter the desktop name in the text field Filename
3. Click on the Save button
Settings
The tool tab Settings provides tools for editing, loading and storing of Analysis windows and oscilloscopes
settings.
The Settings tools:
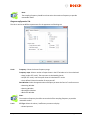
Start/ Settings/ Edit – edit settings of an analysis window or oscilloscope
Start/ Settings/ Load - load settings of an analysis window, oscilloscope or instrument panel
Start/ Settings/ Save - save settings of an analysis window, oscilloscope or instrument panel
They are described in the chapters Oscilloscope, Analysis, Telemetry.
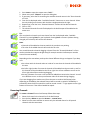
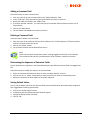
Tools
The Tools tab contains:
Mathematics
Settings
Flashcard
Darab Ribbon
Page 23 of 282
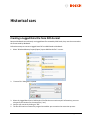
Mathematics
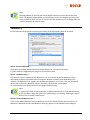
The tool tab Mathematics provides tools for managing mathematical functions and conditions. This will
help you to solve a series of mathematical and analytical problems.
The Mathematics tools:
Tools/ Mathematics/ Functions – allow you to define filters, lookup tables and
mathematical functions
Tools/ Mathematics/ Conditions – allow you to define conditions to exclude certain data
from consideration during data analysis
They are described in detail in the chapters Mathematical Channels and Conditions.
Settings
The tool tab Settings provides the possibilities to manage channel settings, channel colors and general
WinDarab settings.
The Settings tools
Tools/ Settings/ Channels– allow you to define basic settings for each channel in WinDarab
Tools/ Settings/ Channel Colors – allow you to define the color of each channel in each
overlay
Tools/ Settings/ Program – allow you to make basic WinDarab settings
They are described in detail in the chapters Channel Settings and Settings.
Flashcard
The tool tab Flashcard provides tools for flashcard initializing and launching.
Tools/ FlashCard/ FlashCardTool Use this item to launch the flashcard utility tools.
Tools/ FlashCard/ Initialize
Darab Ribbon
Opens a dialog to initialize the flashcard.
Page 24 of 282
Windows
The Windows tab contains the following tool tabs
Dockable windows
Worksheet
Worksheet controls
All controls
Current control
Desktop layout
Dockable Window
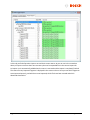
WinDarab manages the following dockable window:
Files – see chapter File Explorer Window
Channels
Colors
Racetrack – see chapter Racetrack
Events – see chapter Events
The tool tab Dockable Windows allows you to open or close a dockable window.
Files
Click with the left mouse button on Windows/ Dockable/ Files to open the File Explorer
window.
Events
Click with the left mouse button on Windows/ Dockable/ Events to open an Events window.
Racetrack
Click with the left mouse button on Windows/ Dockable/ Racetrack to open a Racetrack
window.
Darab Ribbon
Page 25 of 282
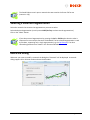
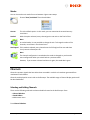
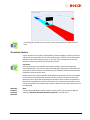
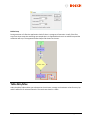
The Racetrack window has three different display states. You can selecte one by clicking on the RacetrackDrop down button and select an item.
Dockable
window
Dockable window is the standard option. In this state, your Racetrack window is
docked wherever you chose and can be handled like explained in The Racetrack
Window.
Transparent
window
The transparent window is activated when you click on it or when you drag the
docking racetrack window and drop it somewhere without docking it.
As soon as the window loses the focus, its background disappears and all you see is
the racetrack.
You can move the racetrack by STRG-Key + left click on it and drag it to another
location.
Alternatively, you can move your cursor over the racetrack and stay there for one
second to display the background again. Then the racetrack can be moved by draging
the window.
Hidden
The last option is to hide the Racetrack window completely.
You can quickly switch through all the states by clicking on Windows/ Dockable
windows/ Racetrack.
Further Racetrack information can be found at The Racetrack Window.
Darab Ribbon
Page 26 of 282
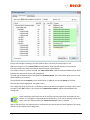
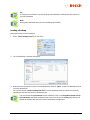
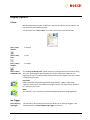
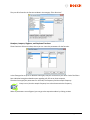
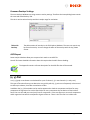
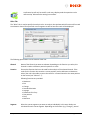
Channels
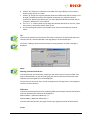
Press F3 key to open the Channels Window.
Click with the left mouse button on Windows/ Dockable/ Channels to open the Channels
window.
The Channels window displays a list of WinDarab channels. WinDarab channels are divided
into four channel lists:
Measurements channels
Math channels
Internal channels
Temporary channels
The Channels window toolbar allows you to select which channel list should be currently
displayed.
The Channels window provides you the possibility to drag & drop a channel to an
oscilloscope, analysis window or instrument panel.
The channel list offers also a channel search function. You can find a channel in the channel
Darab Ribbon
Page 27 of 282
list by entering the name of the channel in the text field under the window tool bar.
Channel
Info
The channel info is a small region under the channel list. In this region you see detailed
information about the currently selected channel like the sample rate, the data source or a
selected math channel’s expression.
You can resize the area by dragging the border. You can also max-/minimize it by double
clicking the border.
Colors
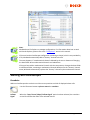
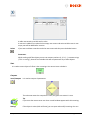
Click with the left mouse button on Start/ Dockable/ Colors to open a Colors window.
The Colors window provides you the possibility to change the color of a channel, overlay, or
something else by drag & drop the color to the corresponding element.
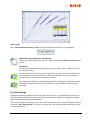
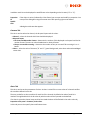
Control Bars
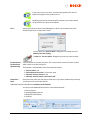
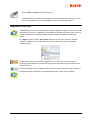
The ribbon Controll Bars tab manages the Outing Bar
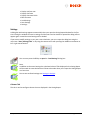
Click with the left mouse button on Windows/ Control Bars/ Outing Bar to enable/disable
the Outing Bar.
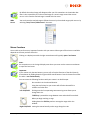
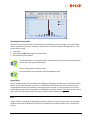
Outing Bar
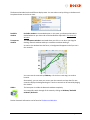
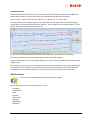
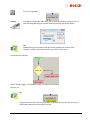
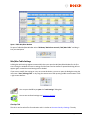
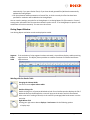
The Outing Bar gives you an Overview over the Overlays, their laps and the position to each other.
The current visible area is marked yellow; the current cursorposition is visualized with a
dotted line. When the Area or the Cursor-position changes, the Outing Bar will update
automaticly.
Darab Ribbon
Page 28 of 282
Click with the left mouse button on a lap outside the visible area, to set the visible area and
cursor-position to the exact position in the lap where it was in the previous selected lap.
Click and drag the visible area in the Outing Bar to move the visible area in the Oscilloscope.
The cursor-position moves with the visible area.
Click and drag the border of the visible area in the Outing Bar to increase or decrease the
Size of the visible area (zoom out / zoom in).
A doubleclick on a Lap moves the visible area to the size and the position of the selected
Lap.
Worksheet
The ribbon Worksheet tab allows you to
Insert a new worksheet
Delete a worksheet
Rename the worksheet label
Change the color of the worksheet tab
Click with the left mouse button on Windows/ Worksheet/ Insert to create a new
worksheet.
Click with the left mouse button on Windows/ Worksheet/ Delete to delete the active
worksheet.
Click with the left mouse button on Windows/ Worksheet/ Rename to rename the label of
the active worksheet.
Click with the left mouse button on Windows/ Worksheet/ Color to change the color of the
active worksheet tab.
Worksheet controls
WinDarab manages the following worksheet controls (windows):
Darab Ribbon
Page 29 of 282
Oscilloscope – see chapter Oscilloscope
Inform – see chapter Inform
x/y-Plot – see chapter x/y-Plot
Histogram – see chapter Histogram
Distribution – see chapter Distribution
FFT – see chapter FFT
Flow Chart – see chapter Flow Chart
Min/Max-Table – see Table Min/Max
Outings report - see Outings report
Lap Analysis – see chapter Lap Analysis
Instrument Panel - see chapter Instrument Panel
The tool tab Worksheet controls allows you to open one or more worksheet controls.
A worksheet control could be an oscilloscope, analysis window, inform window or
instrument panel.
Click and drag a symbol with the left mouse button onto your workspace to open the
corresponding worksheet control.
All controls
With the All controls tab, you can change the caption for all your worksheet controls.
Click with the left mouse button on Windows/ Worksheet controls/ Show captions to
show/hide the caption for all your worksheet controls.
When you hide the caption of a single window while your other windows still have the
caption shown, the Show captions button will be unchecked. You can click on the Show
captions button now to show all captions again or press the button two times to hide all
captions.
Current control
The Current control tab allows you to adjust the current active control
Click with the left mouse button on Windows/ Current control/ Show caption to change the
visibility of your current active control.
Darab Ribbon
Page 30 of 282
Click with the left mouse button on Windows/ Current control/ Maximize to toggle
between the normal size and the maximum size of your current active control.
Click with the left mouse button on Windows/ Current control/ Close to close your current
active control.
These functions can also be used by right-clicking on a windows caption-bar and selecting
the item from the context-menu.
Desktop layout
Click with the left mouse button on Windows/ Desktop layout/ Toggle to toggle between 2
different desktop layouts.
When you click on Toggle for the first time, the docks won’t be visible. You can now adjust
your workspace. Both workspaces will be saved when you close WinDarab 7, so they are still
the same after the next start.
Darab Ribbon
Page 31 of 282
File Explorer Window
The File Explorer Window displays and manages all logger data files opened in the File Explorer (see
chapter File Explorer). WinDarab supports the following logger files:
WinDarabv7 Files
WinDarabv6 Files
WDServer Telemetry Files
Linked Files
MDF Files
MSX Files
Open File Explorer Window
Select Windows/ Dockable windows/ Files from Darab Ribbon to open the File Explorer
Window.
File Explorer Window
Page 32 of 282
The File Explorer Window is a dockable window. It contains a toolbar and a WinDarab file list window.
File Explorer Window Toolbar
Opens the File Explorer (see File Explorer)
Close the selected file.
Create an overlay to compare files/laps (see Overlay). Each overlay
is displayed in a different color.
Zoom and compare fastest laps of each overlay.
Change the color of the selected overlay
Reduce the lap list. The „outing #“- line under the file name in the
file list will not be displayed.
File Explorer Window
Page 33 of 282
File Explorer Window File List
The file list contains a list of all opened files in the File Explorer.
Under the file name the outing number is displayed. The laps are listed under the outing number. Each lap
is indicated with a lap number and a lap time. The fastest lap is marked with the label
. If an overlay is
assigned to a lap it is displayed by a colored point before the lap number.
If the menu point „Reduce lap list” is selected the line „Outing#“ will be hidden.
File Explorer Window Context Menu
After right-click on an object (file, lap) in the File Explorer window a context menu
opens. The context menu contains the following options:
File Explorer Window
Page 34 of 282
Open
Opens a new file.
Explore Folder
Opens the data file location in the windows explorer.
Laptriggers…
Opens the Laptrigger Manager Dialog.
Replace
With this menu-item, you can replace the file by another file. After clicking on the
item, the open-file-dialog opens, where you can select the file replacing the file in
the file-explorer.
Close
You can use the close menu item to close this file.
Fastest laps
Zoom and compare fastest laps of each overlay.
Reduce lap list
Reduce the lap list. The „outing #“- line under the file name in the file list will not be
displayed.
When the context-menu belongs to a lap, two options appear to mark the lap as inlap or outlap.
Overlay
Overlay provides the possibility to compare laps/files and to add a lap/file to an oscilloscope (see chapter
Oscilloscope). Overlays are displayed as points in different colors.
By default at least one overlay exists in the File Explorer Window. If you open a file in the File Explorer
(see chapter File Explorer) the overlay is assigned to the fastest lap of the file.
Overlay Context Menu
Click with the right mouse button on one overlay point or the overlay row to open the
overlay context menu.
File Explorer Window
Page 35 of 282
Add
Add an overlay in the overlay list under the File Explorer window toolbar. If at least one
file is opened in the File Explorer window the overlay is assigned to the next longer lasting
lap without overlay in the first file of the list. If each lap has an assigned overlay already all
subsequent overlays will be assigned to the longest lap in the first file.
Replace file
Replace the file of the selected overlay. The File Explorer is opened and allows you to
select the new file.
Detach file
Detach the file from the overlay. After this, the overlay has no file.
Change color
A color palette is opened that allows you to select the color of the selected overlay.
Delete
Select this menu point to delete the overlay.
Use as x-axis
overlay
Select this option to use this overlay as base-overlay for the x-axis.
Use as base
for
differences
Select this option to use this overlay as the base-overlay for difference-channels.
Adding an overlay
There are the following methods to add an overlay:
1. From overlay context menu (see above)
2. From Add context menu in an Oscilloscope (see chapter Oscilloscope)
3. From File Explorer Window toolbar:
Select Overlay/ Add from File Explorer Window.
File Explorer Window
Page 36 of 282
Delete an overlay
There are the following methods to delete an overlay:
1. From overlay context menu (see above)
2. From File Explorer Window toolbar:
Select Overlay/ Delete from File Explorer Window.
Assign Overlay to File/Lap
There are the following methods to assign an overlay to a file/lap:
Click on the desired overlay-field of the lap, you want the overlay being assigned to. There
will be a marker on this field to indicate, that this overlay is now assigned to this lap.
An overlay can only be drawn vertically.
Open the context menu of an overlay
in the File Explorer Window and select Selected
Overlay/ Replace file. The File Explorer will be opened and you can select the file.
Select Overlay/ Replace file from File Explorer Window toolbar. The File Explorer will be
displayed and you can select the file.
Drag and Drop
Files can be opened by dragging them from your windows file system into the WinDarab FileExplorer.
Depending on the location where you drop the file, the file can be added to the file-list, replace an other
file or replace an overlay.
Adding a file
You can add a file to the file-list by dropping it anywhere on the list but an existing
filename or overhead-column. Your files will be added to the list. If you add more than
one file to the list, as default, they will be added as one file. To open more files as
single files, press Ctrl while dropping the files.
Adding a file to
You can add one or more files to a filegroup by dropping them over an existing file.
File Explorer Window
Page 37 of 282
a Filegroup
When you drag the files over an existing file, the target is highlighted to show that you
can add the files.
Replacing a file
You can replace one or more files by dropping a file over an existing file while pressing
the Shift-key. When you drag the files over an existing file, the target is highlighted to
show that it can be replaced.
Replacing an
overlay
Dropping a file on an overlay-column adds the file to the file-list and assigns the
columns overlay-color to the new added file. If this removes the last overlay from a
file, this file will be removed.
File System Monitoring
When a file is opened in the file explorer, the containing folder as well as all of his sub folders are
monitored for new darab files. When a new darab file is created in a monitored folder, darab shows a
balloon tip to let the user know that a new file was created.
In addition to this balloon tip, a region on the bottom side of the file explorer is created where all new
files are listet.
You can open these files by dragging them into the file explorer (see Drag and Drop) or by using the
contextmenu.
The separator between the new files and the file explorer can be dragged to reduce the
size of the region. You also can minimize/maximize the region with a doubleclick on the
separator.
File Explorer Window
Page 38 of 282
File Explorer
The usability of WinDarab’s File Explorer is much the same way as Windows’ Windows Explorer.
File Explorer is used to manage all WinDarab supported files:
WinDarabv7 files
WinDarabv6 files
WDServer Telemetry files
Linked files
MDF Files
MSX files
In addition to access files on existing disk drives you access them through locations. A
location in fact represents the affiliation of files with a specific drive and folder. Using
locations simplifies access and management of files. See chapter Locations
Open File
Open File Explorer
To open File Explorer there are the following methods:
From File Explorer Window
1. Open File Explorer Window if not opened.
2. Choose “Windows/ Dockable Windows/ Files” or press “F3” to open the File Explorer Window.
3. Choose Open file in the File Explorer Window toolbar.
File Explorer
Page 39 of 282
From Darab Ribbon
Choose WinDarab-Button/ Open measurement file in Darab ribbon
File Explorer
Page 40 of 282
File Explorer
The File Explorer window is divided into:
1. Open File dialog box
2. File Inform window
The Open File dialog box allows you to browse through drives, folders, locations and select the file you
want to open.
This area displays sub-folders and files contained in the selected folder.
To select an item you can either use your keyboard or your mouse. Whenever possible a preview of the
selected file will be displayed.
If the selected file has a password protection act as shown in Open Password-protected Files.
To select and activate an item click with the mouse on the item. Press Enter on the
keyboard or double click with the mouse to open the item. Your subsequent steps
depend on the type of the file you have selected.
You can select more than one file by using the Ctrl- or Shift-key. Whatever action you
have chosen (e.g. open or delete) will be performed for each file and in the selection
order.
File Explorer
Page 41 of 282
The combo box “Show Inform” allows you to choose whether the File Inform window to
should be shown or not.
Folders can be created, renamed and deleted in the Open File dialog box in the same way
as regular windows folders in the Windows Explorer.
Open the selected file(s) by pressing the “Open”-button.
If there is more than one file selected, the files are opened as one file. You can also select “Open as
single files” in the “Open”-button’s dropdown list to open all selected files as single files.
If you use the Shift-key while pressing the “Open” button, the “open linked files”-dialog
appears. In this dialog you can change the order of the linked files, delete single files from
the list or save the list as a predefined filegroup in the same folder as the used files are
saved in. After that, you can open this exact filegroup by opening the generated
filegroup-file.
File Inform
File Info is divided to 3 groups:
1. Comments
2. Statusblock labels
3. CardMemory Info
To select one item navigate with the arrows.
These enables you to view the following file information:
File Explorer
Page 42 of 282
Comments
Statusblock
label
Configuration
Tools
Display configuration tool information stored in the WinDarab file.
Comment field
Display the vehicle settings.
Comment
Display the logger data specific comments.
Statusblock label
Display the available status block label
CardMemory Logbook
Info
Measinfo
Sections
Display memory card log book
Display memory card measurement info
Display memory card sections
Locations
You can save data in any folder and on any disk drive you choose. In addition it is
possible to create locations. WinDarab defines the special folder Data file location as
container for all locations. A location actually is a link to a specific folder which
enables you to save files in, or open files from, different locations quickly – without
having to navigate the entire drive and folder structure.
Add folder to locations
Follow the steps below to add a folder to the Data file locations folder:
Open the File Explorer
Choose the folder you want to define as location.
Click on the button
A link to the selected folder is generated and added to the Data file locations folder.
File Explorer
Page 43 of 282
A location can be deleted or renamed in the same way as regular windows link to a folder
in the Windows Explorer.
File Explorer
Page 44 of 282
Racetracks
Racetracks are managed by Darab Explorer – Racetrack.
Following processing items are provided by the Darab Explorer – Racetrack and described in detail in the
next sections:
Creating a Racetrack
Deleting a Racetrack
Renaming a Racetrack
Editing a Racetrack
Selecting Racetrack's Segmentations
To open the Darab Explorer – Racetrack there are the following methods:
From Racetrack Window:
Open Racetrack Window if not opened.
Racetrack Window
Choose “Windows/ Dockable windows/ Racetrack”.
Open context menu in the Racetrack Window.
Click on the Racetrack Window to open the context menu.
Racetracks
Page 45 of 282
Choose Load racetrack in the context menu.
From Darab ribbon:
Choose WinDarab-Button/ Racetracks in Darab ribbon
WinDarab-Button/
Racetracks
Darab Explorer Racetrack
In addition to a course layout Racetrack files contain information about the length of the
course as well as its breakdown into course segments. Segmented racetracks are used by a
number of analytic functions in WinDarab.
Single racetrack files can contain multiple segmentations. Because of this Darab shows
racetrack files as folders and the different segmentations as files.
Creating a Racetrack
To create a new racetrack, follow these steps:
1.
2.
3.
4.
Open Darab Explorer - Racetrack
Click on the New button.
Select Racetrack from the menu.
The Racetrack dialog box will appear. You are now able to create a new racetrack by accessing the
desired functions for racetrack layout (see chapter Racetracks edit modes).
Racetracks
Page 46 of 282
5. When you are satisfied with the results click on Save As.
6. In the dialog box Save Racetrack select the folder in which you want to save the racetrack. Then
enter a name for the racetrack.
7. Click on Save.
8. Now you can create course segmentation by accessing the desired functions for segmentations (see
Determine Segmentation).
9. Press Close when finished
Chapter “Racetrack Dialog” describes the “Racetrack” dialog box and chapter “Racetracks
edit mode” specifies in detail the methods to create or modify a racetrack.
Deleting a Racetrack
Open Darab Explorer – Racetrack.
Select the racetrack you want to delete.
Click on the Delete button.
Confirm your deletion by answering “Yes”.
Important:
As a safety measure Darab Explorer prohibits the deletion of racetracks unless you have
specifically enabled this function in your configuration.
Renaming a Racetrack
Open Darab Explorer - Racetrack
Select the racetrack you want to rename.
Click on the Rename button.
Change the name of the racetrack and confirm the new name by pressing Enter on the keyboard
Editing a Racetrack
Open Darab Explorer - Racetrack
Select the racetrack you want to edit.
Click on the Modify… button.
The dialog box Racetrack will appear (see chapter Racetrack Dialog).
Now you can make the desired changes to the racetrack (see chapter Racetracks edit modes).
When you are finished with your changes click on Close.
Racetracks
Page 47 of 282
The Darab Explorer won't open a racetrack that was saved in the former file format
(extension .lap).
Selecting a Racetrack Segmentation
Select the racetrack that contains the segmentations you want to select
Select the desired segmentation (or with pressed Shift/Ctrl key to select several segmentations)
Click on the "Select" button.
If you select several segmentations by pressing the Ctrl or Shift key the selection order is
important for some analytic functions of WinDarab. The last selected segmentation is used
by windows, supporting only a single segmentation (e.g. the Oscilloscope). The other
selected segmentations are shown in the “Racetrack Window”
Racetrack Dialog
Whenever you create or modify a racetrack the dialog box “Racetrack“ will be displayed. A racetrack
dialog supports 2D or 3D view modes and several edit modes.
Racetracks
Page 48 of 282
Racetracks edit modes
To generate a racetrack the following edit modes are provided (see above):
Generate track based on recorded data.
In this mode you can calculate the course using measured data like speed and transversal
acceleration, GPS track boundaries and GPS laps with fixed track width.
Edit track by hand (Draw racetrack).
Here you can draw a racetrack using lines.
The following edit modes are provided for modification of an existing racetrack:
Determine segmentation based on recorded data.
This mode is useful to determine racetrack segmentation based on measured data.
Edit segmentation by hand.
Use this mode if you want to define manually the segments on the racetrack using the lap
position.
The edit modes are available from the Racetrack Dialog.
Generate track based on recorded data
Use the Generate track based on recorded data edit mode to calculate the course of a racetrack from
logged data.
To open the Generate track based on recorded data dialog box:
Open Darab Explorer – Racetrack
Click on the New... or Modify... button
Select Generate track based on recorded data option and click on the Next button.
Racetracks
Page 49 of 282
The dialog box offers three methods to generate the racetrack:
Speed and transversal acceleration
This method transforms logged speed and transversal acceleration signals to metric coordinates and
shows the real racetrack.
Racetracks
Page 50 of 282
This dialog box is used to set the following parameters:
1. Method to determine track
If you choose “Speed and transversal acceleration”, the corresponding option on the
dialog box is ticked. To generate the racetrack you should set the parameter as follows.
2. Select overlay and lap
Overlay In this field you select the overlay you want to use for the calculation.
Lap
In this field you select the lap that will provide the data for the
calculation. Signal quality from the transversal acceleration sensors as
well as the occurrences of vehicle drift and wheel slip/spin during the
selected lap will greatly affect the results.
3. Select Speed channel
Select the channel used for recording speed from the list.
4. Select Transversal Acceleration channel
Channel
In this field you select the channel used to record transversal
acceleration. The unit of the transversal acceleration channel can be
overridden.
Offset
Enter the offset correction for the transversal acceleration in this
field. Ideally, the value entered should be zero although this is not a
typically case (the course is uneven, sensors are not precisely
installed, etc.).
Gain
Enter the gain for the transversal acceleration in this field. Ideally,
Racetracks
Page 51 of 282
the value entered here should be one.
When you activate the “Find Gain” option, WinDarab will
automatically set gain value to 1.0.
5. Optional track parameters
Length
Enter the precise length of the racetrack. If you activate the
“Calculate Length” button WinDarab will automatically calculate the
course length.
Rotation Here you can enter a rotational angle for the course. The course will
be rotated according to the angle you specify.
Flip
Track
Click on this button to flip the track. Its tip always points in the
direction of travel. The racetrack is flipped by reversing the traversal
acceleration channel.
Close
Track
Choose this option to close to a circular track. The track will
consequently either be stretched out or shortened so that start and
finish coincide.
De-selecting this option allows you to assess the quality of your
logged data: The closer the start to the finish lies, the more
accurately your data reflects the circular course.
GPS: With left/right track boundary
The method transforms logged GPS coordinates to metric coordinates and shows the real racetrack.
To generate the racetrack you need logger data file(s) containing the GPS coordinates (i.e. the GPS
channels used for recording longitude, latitude and height (see point 5)) of the left -, right track
boundary and optional the racing line. The logger data files can be different or identical.
Racetracks
Page 52 of 282
This dialog box is used to set the following parameters:
1. Method to determine track
If you choose “GPS: With left/right track boundary”, the corresponding option on the dialog box is
ticked. To generate the racetrack you should set the parameter as follows.
2. Left track boundary
Overlay
In this field you select overlay you want to use for calculation of the left boundary. The
overlay should contain the GPS channels recording the GPS coordinates (see point 5) of
the left boundary.
Lap
In this field you select the lap that will provide the data for the calculation.
3. Right track boundary
Overlay
In this field you select the overlay you want to use for calculation of the right boundary.
The overlay should contain the GPS channels recording the GPS coordinates (see point 5)
of the right boundary.
Lap
In this field you select the lap that will provide the data for the calculation.
The size of a car shape could become "very large" (larger than the screen) if there are
invalid GPS coordinates recorded in the file.
Racetracks
Page 53 of 282
4. With racing line (optional)
Overlay
In this field you select the overlay you want to use for calculation of the racing line.
The overlay should contain the GPS channels recording the GPS coordinates (see point
5) of the racing line.
Lap
In this field you select the lap that will provide the data for the calculation.
5. GPS Channels (Info)
Longitude
Select the channel used for recording the longitude of the GPS-coordinates.
Latitude
Select the channel used for recording the latitude of the GPS-coordinates.
Height
Select the channel used for recording the height of the GPS-coordinates.
6. Optional track parameters (see Speed and transversal acceleration)
If special channels for “GPS Longitude”, “GPS Latitude” and or “GPS Height” are defined the
corresponding text field will contain a special channels list and the user can select the
channel to be used (see Special Channel).
GPS: Single lap with fixed track width
The method transforms logged GPS coordinates to metric coordinates and shows the real racetrack.
To generate the racetrack you need a logger data file containing the GPS coordinates (i.e. the GPS
channels used for recording longitude, latitude and height (see point 5)) of the driving line. Further you
need to provide the width of the driving line.
Racetracks
Page 54 of 282
This dialog box is used to set the following parameters:
1. Method to determine track
If you choose “GPS: Single lap with fixed track width” the corresponding option on the dialog box is
ticked. To generate the racetrack you should set the parameter as follows.
2. Driving line
Overlay
In this field you select the overlay you want to use for calculation of the driving line. The
overlay should contain the GPS channels recording the GPS coordinates (see point 5) of
the driving line.
Lap
In this field you select the lap, that will provide the data for the calculation.
3. Width of driving line
Select the width of driving line.
4. GPS Channels (see GPS: With left/right track boundary)
5. Optional track parameters (see Speed and transversal acceleration)
Edit track by hand
The “Edit track by hand“ mode allows you to draw or alter the layout of a racetrack manually.
To open the “Edit track by hand“ dialog box:
Racetracks
Page 55 of 282
Open Darab Explorer – Racetrack
Click on the New... or Modify... button
Select Edit track by hand option and click on the Next button.
The layout of a racetrack is displayed right from the options control as a series of dots which are
connected by lines. In order to change a course layout you can move, delete, or add individual dots.
“Edit track by hand” control gives you the information for the racetrack and possibility to change it.
Right from edit outlines control is the racetrack's view as dots:
There is a quick menu available on every point of the right view. The content of the menu
depends on clicked element. If a point is hit then the menu offers to delete the point, if a
line is hit then the menu offers to insert a point and anywhere else it offers to save or
cancel changes.
Racetracks
Page 56 of 282
Selecting a dot
Select a dot by clicking on it with the left mouse button.
Moving a dot
Use the left mouse button (drag & drop) to move a dot to a new position.
Adding a dot
Clicking onto the racetrack with your right mouse button will add a new dot at the
current mouse position. If the location you have selected is in the immediate vicinity
of the course the new dot will be inserted into the course layout at this point.
Otherwise, the new dot will be placed following the selected dot. The course will
now lead from the selected dot to the dot that has just been added. You can also
accomplish this by clicking on the “Insert Point” button.
Holding down your right mouse button enables you to move the new dot to another
position in one step.
Choosing the “Insert new racetrack point (Key Insert)” button on the screen adds a
new point next to a selected point on the racetrack.
Deleting a dot
Press Delete on your keyboard
Choose the “Delete selected racetrack point” button on screen
Right mouse click on the dot and confirm by clicking on the Remove point button.
Properties of a dot
Every dot has coordinates (height also if available) and position on the racetrack. You can change all of
them manually except the position. The position of the point dependents on the racetrack's length
and if the track is closed or not. If the height is unknown, but neighbour points have height you can set
the height to be auto and then the dot's height will be approximated from nearest neighbours with
known height.
“Assign selected racetrack point Start/Finish point“ Button
This button is used to define a specific point as the start/finish position. This function defines the
initial point of a course layout, coinciding with the “Start” and in the case of a closed circular course
the “Finish” line.
Setting the Course Length
Enter the course length in the “Length” field.
Racetracks
Page 57 of 282
WinDarab uses this value (among other things) to standardise the length of laps during
data analysis.
Rotating the Course
If necessary, use this field to rotate the entire course according to a specified angle.
“Close Course” Option
Activate this option if your course is circular. Choosing this button determines that the first and final
point on the course must occupy the same position.
Determine Segmentation
In the “Determine segmentation based on the recorded data” mode you are able to automatically divide
the course into segments.
To open the “Determine segmentation based on the recorded data“ dialog box:
1. Open Darab Explorer – Racetrack.
2. Click on the New... or Modify... button.
3. Select “Determine segmentation based on the recorded data” option and click on the Next button.
There are two calculation methods to divide the course into segments:
automatic generation of straightaways and curves using transversal acceleration
free definable segmentation based on a set of rules you choose.
Calculation Method “Transversal Acceleration”
This method is a simplification of the underlying set of rules.
To carry out the actual calculation WinDarab generates a suitable set of rules
Racetracks
Page 58 of 282
In the “File/Lap” field choose the file and lap for the course calculation.
Activate the calculation method “Transversal Acceleration”.
Enter a minimum segment length.
A segment will be created only if the transversal acceleration value over this distance exceeds the set
limit (threshold value).
Select the channel in which the transversal acceleration was recorded in the “Transversal Acceleration
Channel”
Enter the value that must be exceeded at the beginning of a curve.
Note:
The curve ends if the g-force is 30% below the set threshold value.
Usually this calculation is carried out automatically. You can view the results immediately
after you have changed a setting. This is not the case when you switch from the method
that allows you to define segments (“User-Defined” button) to the automatically calculated
method (“Transversal Acceleration” button). In that case you must enable the calculation
manually in “Calculate Preview” or change an additional setting.
If you have used this calculation method and then select the “User-Defined” option you will
be able to view and edit the rules that were generated
Calculation Method “Free definable”
This calculation method provides you with a very flexible system for determining course segmentation.
It is based on a set of rules. Each rule occupies a separate line in the table.
Racetracks
Page 59 of 282
Each rule has a start and end condition as well as a color in which the segment will be drawn.
The entry fields are as follows:
Calculation
Method
Activate “Free definable”.
Overlay / Lap
In this filed you select the overlay and lap that will be used for calculating the
course segmentation.
Minimum
Segment Length
Defines the minimum length of a segment. This prevents the creation of segments
caused by signal noise.
“Colors” Column
Select a specific color that will be applied to a segment if it fulfills the rule in this
column.
You need not to select a color (shaded button), in this case the colors you
indicated in “Options/Settings/ Colors” for segments with even/odd segment
numbers will be used.
Color of all other
segments
This allows you to determine a color for those course segments in which no rules
are fulfilled. This line appears only if you have chosen a specific color for at least
one of the rules. In other words it does not appear when all rules use the default
colors.
“Add” Button
Click on this button if you want to add a new rule to the set of rules.
“Remove” Button
Use this button to delete the selected rule from the set of rules.
“Remove all”
Button
Delete all rules.
Racetracks
Page 60 of 282
“Save” Button
Click on this button, to save the set of rules. This is very useful for gaining quick
access to complicated rule sets.
Note:
The racetrack or course segmentation will not be saved.
WinDarab will only save the settings made in this page.
“Load” Button
This button enables you to load a previously saved set of rules.
How WinDarab Calculates a Segmentation
1. WinDarab uses the following steps to calculate segments:
2. WinDarab drives the lap one more time.
3. While driving WinDarab checks the starting conditions for each point on the course — beginning
with the first rule. WinDarab stops checking, when a starting condition applies. The vehicle now
occupies this particular rule (i.e. segment). If WinDarab does not find an applicable rule it repeats its
check at the next point.
4. Every subsequent point is then checked for starting conditions, beginning with the first rule.
However, the check will be terminated once a starting condition is fulfilled or when WinDarab
reaches the segment previously occupied by the vehicle.
5. If WinDarab finds a new rule, it terminates the preceding rule and generates a corresponding
segment. The vehicle now meets the conditions of the current rule. Checking proceeds as in step 3.
6. WinDarab will then check the current rule’s end condition. If this condition is not met (i.e. if the
vehicle remains in this segment), then WinDarab continues checking the next course point, as in step
3. If the end condition is met, WinDarab generates the corresponding segment and checks the next
rule’s starting condition. If it finds a rule that has been fulfilled, WinDarab begins checking the next
rule, if not it continues checking the current rule.
Important:
Remember that the end condition — in a manner of speaking — represents the
opposite of the starting condition.
You should always use a threshold value for starting and end conditions.
Rule sequence is important!
Tip:
Although a rule often uses the same channel for the first and final conditions, it is possible
to vary conditions: you can use brake pressure for approaching a turn, transversal
acceleration for driving curves, and throttle settings for accelerating out of curves.
Edit Segmentation
In addition to the automatic calculation of segmentation you can choose creating course segmentation
manually. You can also adapt a previously calculated course for instance to remove annoying or
unnecessary segments. You need to start "Edit Segmentation by hand" mode to do so.
To open the Edit Segmentation by hand dialog box:
Open Darab Explorer – Racetrack
Click on the New... or Modify... button
Racetracks
Page 61 of 282
Select “Edit Segmentation by hand” option and click on the Next button
Right next to the edit segmentation control is the racetrack's view
In addition to position and color this table also gives you the possibility to set a name for a segment
which later will be used to identify the segment on the racetrack. If there is no name for a segment its
index will be used for displaying.
If you drag the mouse over the racetrack a small window with the current position and
pointer to the racetrack shows up. So you can find a better place for adding a new segment
There is a context menu on the racetrack. To open the menu, click with the right mouse
button on a segment. The quick menu affords the following options:
1. Change the color of the selected segment.
2. Insert a new segment in the current position.
3. Delete the segment (to do this, you must exactly be on the start of the segment)
Adding a new Segment Marker
Racetracks
Page 62 of 282
1. In the entry field, indicate a position (in meters) or use your mouse to click on the desired area in the
preview. (there is a pointer with a small window showing the current position)
2. Click on
button right from the segment.
A new segment marker will be added in the selected location and the segmentation is redrawn
accordingly.
To add a new segment you also can use the quick menu:
1. Select the position of the new segment with the mouse.
2. Right mouse click to open the quick menu.
3. Select “Insert segment” menu point.
Deleting a Segment Marker
1. Select the position of the segment you want to delete in the table or click on the position directly on
the racetrack in the preview window.
2. Click on
button right from the segment.
The appropriate segment marker will be deleted from the selected location and the segmentation
redraws accordingly.
The quick menu also provides the user the possibility to delete a segment marker:
1. Position the mouse pointer exactly on the start of a segment.
2. Open the quick menu by right mouse click.
3. Select “Delete segment” menu point.
Changing Segment Color
1. Choose the segment from the table.
2. Select the desired color from the list.
The segment color will be changed and the segmentation is redrawn accordingly.
The color of the segment can also be changed within the quick menu.
Changing Segment Name
Racetracks
Page 63 of 282
1. Choose the segment from the table.
2. Type the desired name.
The segment name will be changed and the segmentation redraws accordingly.
If the segments name is empty then the segment index will be used to identify it on the racetrack. By
default the segments don't have names.
Create segmentation
Clicking on
segment.
button will show you a dialog in which you should write the name of the new
Remove segmentation
Clicking on
button right from segmentation deletes current segmentation. Another segmentation will
be selected and displayed if available else a new empty segmentation will be added and will be shown.
Rename segmentation
You can change the name of currently edited segmentation by typing it in the edit box of the
segmentations popup box.
ASCII Export
A racetrack can be export to an ASCII file.
The ASCII file contains the distance (dist) from beginning to each racetrack point and the coordinates (x,
y) of each racetrack point.
The appendix contains a format description for the ASCII file that will be created.
Racetracks
Page 64 of 282
The file can be used to create the outline of a racetrack in other application using x/y – plot
connected lines (e.g. Microsoft Excel).
There are two methods to export a racetrack to an ASCII file.
From Racetrack Window:
Open Racetrack Window as follows.
Racetrack Window
Choose Windows/ Dockable windows/ Racetrack.
Open context menu in the Racetrack Window.
Click on the Racetrack Window to open the context menu.
Choose “Save as text file” in the context menu.
The dialog Save as is displayed:
Racetracks
Page 65 of 282
1. Select the drive and directory to save the ASCII file
2. Enter the name of the file on which the data will be written.
3. Click on the ok to confirm.
4. The racetrack will now be exported to the file you specified earlier.
From Darab ribbon:
Choose WinDarab-Button/ Racetracks in Darab ribbon
WinDarab-Button/
Racetracks
Darab Explorer – Racetrack is opened.
1. Select the racetrack to be exported
2. Click on the “Export” – button to open the “Save racetrack as text file” – dialog
box
Racetracks
Page 66 of 282
3. Select the drive and directory to save the ASCII file.
4. Enter the name of the file to which the data will be written.
5. Click on the Save– button.
Racetracks
Page 67 of 282
Logged Data Files
After data recording has been completed (usually after each outing) data will be read to WinDarab and
converted to the Logged Data File format.
Logged Data Files contain all data and information pertaining to a particular set of recorded data, such as
signal values for individual channels, lap and status reports, and so on.
Logged Data Files are also called Measurement Files.
You may open more than one file and more than one copy of a file at one time. Once opened, files can
be compared. In order to distinguish files clearly from each other, every file receives a specific color and
index code, both of them are always displayed in conjunction with the file name.
Logged Data Files are managed in the File Explorer (Open, Delete, Import Files from other programs).
The files are closed with a separate button in the File Explorer Windows called “Close File”.
Each Logged Data File contains a default comment field in which you can enter any text comment you
like. You can, however, also define additional comment fields which WinDarab provides with every
Logged Data File. A distinction is made between text, numeric, and date fields.
Comment fields may also be used in mathematical channels to include settings that are specific to a
particular outing (i.e. outing-specific constants).
Opening a Logged Data File
Before you can access the data and channels contained in WinDarab, you must first open a Logged Data
File in the File Explorer.
Logged Data Files
Page 68 of 282
Chapter “File Explorer” describes how to open the File Explore.
Follow these steps to open a Logged Data File:
1. Open File Explorer.
2. Select the Logged Data File(s) you want to open.
3. Click on the Open button.
4. The Logged Data File(s) you have chosen will now be opened.
5. If the Oscilloscope you are currently using is empty, you can now load a configuration.
If the window already contains a file, the same channels as those already displayed in
the Oscilloscope will now be added to the window for the file(s) you have opened
More than one file may be open at one time in WinDarab.
Logged Data Files
Page 69 of 282
Oscilloscopes are also called Measured Data Window.
Note:
Each opened file receives a color and numerical index code. In the File Explorer Window
display the color code precedes the index number and the file name follows. In this way,
files are clearly distinguishable from each other. A colored dot serves as an additional
identifier.
You can determine the allocation sequence for colors in “Tools/ Program“ in the menu.
Closing a Logged Data File
There are two methods to export a racetrack to closing a Logged Data File.
From File Explorer:
Select in the File Explorer Window the Logged Data File you want to close.
Choose Close File in the File Explorer Window Toolbar.
The file will now be closed and removed from the file list.
If desired, you can close several files, one after another.
From Darab ribbon:
Choose WinDarab-Button/ Close measurement file in Darab ribbon
Logged Data Files
Page 70 of 282
WinDarab-Button/
Close measurement file
Tip:
Closing a particular Logged Data File removes all active channels from WinDarab windows.
Similarly, all windows that are exclusively used to display data contained in the just closed
Logged Data File will also be closed.
Creating a Logged Data File
WinDarab provides a number of possibilities for creating Logged Data Files.
Darab Explorer supports the transfer and conversion of Logged Data Files from other sources. You can:
Read and convert Logged Data File in DOS Darab format (see chapter Historical Cars)
Create a Logged Data File from an ASCII file.
Create a Logged Data File from an ASCII file
Follow the steps to create a Logged Data File from an ASCII file.
1. Select with WinDarab-Button/ Import/Export/ Import from text file the folder in which you want to
save the imported Logged Data File.
2. The dialog box “Convert ASCII file” appears.
3. Select the ASCII file and the “Channel Definition” file.
4. Confirm your selection by clicking on “OK”.
5. The file is being imported, now. A progress bar monitors the process.
6. After the file has been copied successfully, the dialog box “Save Logged Data File” appears.
7. The process is complete once the file has been saved.
Note:
Both file structure and format for ASCII and channel definition files are described in the
Appendix.
Logged Data Files
Page 71 of 282
Reading Logged Data
Various systems are available to record Bosch Motronic® vehicle data. WinDarab supports the following:
Data Logger C55/C60/DDU8
CardMemory C40/C5 (Windows 95 only with OmniDrive or SoftDrive; supported directly in Windows
98/Me/2000/XP/7/8)
Others
MP 1.8
DDU8 Longterm Memory
CANLogger C45
4 MB Reader / CanCard (PlugnPlay version) (see chapter Historical Cars)
Using the data logger import dialog
The data logger import dialog is a tool to import data from various sources such as burst, device,
flashcards or USB-sticks.
WinDarabButton/
Import/Export/ Import
from data logging
device
To transfer data from the hardware you must call up the menu item
“WinDarab-Button/ Import/Export/ Import from data logging device”. The
data logger import dialog will appear.
It is possible to minimize the import-dialog. It will then only accessible
through the tray icon in your taskbar. However, the process can still be
observed as the balloon-notification pop up whenever download is starting, a
source has connected or a file was merged.
The dialog contains of three tabs to control the settings and the status of the importing.
Settings-Tab
The settings tab helps you customizing the import-procedure.
Logged Data Files
Page 72 of 282
Import
sources
Select the sources that you want to monitor. Available are FlashCard/USB-Stick, Device
and Burst.
If the FlashCard/USB-Stick checkbox is checked, an inserted flashcard or USB-stick will be
recognized and shown in the current import-tab.
Device and Burst enables the monitoring of the IP-Addresses, that are chosen in the burst
or device-settings visible in the lower half of the dialog.
Note: Device and Burst can’t be selected at the same time. If you enable one of them while
the other one is enabled, the other one will be disabled.
Common
options
Here, the password for the resulting files can be set. You can select a previously set
password or create a new password with a click on the “New”-Button. If the “Force
password…” option is disabled, no password is set when it is not explicitly set by the
reading configuration.
The “Delete ARP cache…” option deletes the ARP-entry for the host-IP if a ping failed. Use
this option if you can’t reach the host even if you know it is reachable.
Logged Data Files
Page 73 of 282
Note: The settings that you change need to be committed before they are applied to the
import. Do this by clicking the “Apply changes”-button.
Source Settings
The individual settings for the sources are on the bottom half of the dialog.
Note: The individual settings are only shown when the corresponding import sources are
enabled. For the Device/Flash settings to be shown, at least one of these sources has to be
enabled. Accordingly, burst has to be enabled to show its settings.
IP / Device
In the IP/Device-field, you can chose from a set of pre-defined IP-addresses or
insert your own IP-address. This has no effect for Flashcards or USB-Sticks as they
have to be inserted into the PC where WinDarab is running.
Export file
The export file-selection defines which fragments should be combined to one
single file. "One file" merges every imported fragment into one big file. The
option "as stored on the device" doesn't merge any fragments and results in one
file for each fragment. The two other options merge every fragment of the same
lap or the same outing into one output-File.
Save files in
This field specifies the folder, where the resulting files are stored in.
Subfolder template/
Filename template
The subfolder- and filename-template specify the filename that is given to the
resulting file(s). This field also contains a dropdown menu with the 5 most
recently used templates for the subfolder- or the filename-template. There are a
lot of placeholders for the template which can be inserted manually or chosen by
the template-button right to the combo-box.
The following wildcards may be used:
[year]
Year*
[mon]
Month*
[day]
Day*
[hour]
Hour* (24 hour format)
[min]
Minute*
[sec]
Second*
Logged Data Files
Page 74 of 282
[cardinfo]
CardInfo entry (configurable through RaceCon Recording name)
[lap]
Number of first lap
[outing]
Number of outing (of the first lap)
[fragment]
Number of file fragment
[n]
Consecutive numbering
(allowed in file names only)
With the exception of this wildcard all wildcards will be included in the file
name. The system then searches a folder for files with the same name. The new
file will receive the numerical value +1 of the file with the highest number in use
so far.
[fastlap]
Fastest lap (allowed in file names only)
[fastouting]
Outing containing the fastest lap (allowed in file names only)
[fastlaptime
Laptime of the fastest lap (allowed in file names only)
[RecDateYear]
Year of the recording
[RecDateMon]
Month of the recording
[RecDateDay]
Day of the recording
[RecStart]
Time the recording was started
[RecEnd]
Time the recording ended
* of data reading
Note: If you use a finer template than the merge-option, it will be replaced by ‘-1’. So if for
example all fragments of an outing are merged and you are using the [lap] template, it will
be replaced by ‘-1’, even if there is only one lap in the outing.
Note: You can also specify a format for the following templates: [outing], [lap], [fragment],
[fastlap] and [fastouting].
Add a number between the template name and the closing bracket to specify the shown
digits.
For example: if [fastouting] results in 12, [fastouting03] results in 012.
In the top right corner there are two more checkboxes.
Import all
on connect
This option has to be checked in order to import all new files directly - once a
source is found. For example, the flashcard-data is imported right after the card
has been inserted into the computer. If this option is not enabled, you have to
manually import the files in the current import tab. Additionally you can chose
exactly the fragments you want to import.
Delete transferred
files
With this option enabled, the source files on the device are deleted after they
have been successfully imported.
Burst settings
The burst-settings-page is almost the same as the Flash/Device settings page. The difference is that there
are some missing settings.
Logged Data Files
Page 75 of 282
You can’t chose the export file or select “import all on connect” or “delete transferred files” in the burst
settings. If you import burst data, you always create one file per fragment, the import is always started
right after the connection and the files are always deleted after a successful transfer.
Advanced Settings
Further settings can be found by clicking on the “Advanced…”-button.
In the advanced settings, you can configure paths for your downloads and your work-path. For more
information about the import-process see Import Process.
You can also change the visibility of the “Reimport files…”-button. For more information about the
“Reimport files…”-button see Current import-Tab.
Comment Fields
You can view and edit the default values of the comment fields by clicking on the “Comment Fields” –
button.
Logged Data Files
Page 76 of 282
In the Comment Fields dialog you see all user defined Comment fields with their name, the unit and the
default value. You can edit the default value in this dialog by selecting the value cell of the comment
field.
Current import-Tab
The current import-tab shows you the import-state of your currently active data-source.
Logged Data Files
Page 77 of 282
The top row changes according to the fact weather there is currently an active import or not.
Without an import-run, the source-field shows information about possible actions you could do like
inserting a flashcard or status-information like searching for a burst-device.
If an import is active or a source is found, the “Data source-field” shows the connected data-source. Also it
indicates the status of the import with colored bars.
The field right to the data source field shows the download-speed. This is only shown when you are in the
download-phase of an import.
The last field shows the network you are connected to. In addition you see the latency to this host.
The main part of this page shows the import status.
At the beginning of the import run, it is possible to select or deselect any fragment you want or don’t want
to import in the “Get”-column. This requires the “Import all on connect”-option to be disabled in the
settings-tab.
Note: Initially the check marks are set for the files that have never been imported from this
source. So if a fragment is imported but not deleted once, it will not be checked initially (and
thus it won’t be imported when the “import on connect” option is enabled.
With a click on Import, the import-process is started. Now you see the status of each fragment, lap, outing
and so on as the import-process progresses.
Logged Data Files
Page 78 of 282
First the data is downloaded from the device and converted into a temporary file. After the conversion, the
files are merged together as selected in the settings-tab. If the import was successful, the items are marked
with a green background.
You can cancel the importing by clicking on “Cancel” while the importer is running.
The dialog automatically selects the current active fragment. You can disable this feature by using the
scrollbar or disable the auto-scroll-option at the bottom of the page.
When the import is finished, the Progress-column shows the success of the import-process.
Reimport files….
You can import already downloaded raw measurement files by clicking on “Reimport files…” and selecting
the files from the work-folder. This is especially useful when you have to import raw data again but don’t
have access to the source device.
Note: If there is no “Reimport files…”-button on the Current import-Tab you have to make it
visible by selecting the option in the Advanced settings.
Recent import-Tab
The recent import-tab shows the recent imports and their success.
Logged Data Files
Page 79 of 282
In this tab you find all previous import runs and their success-status. As you can see in the screenshot
above, all import-runs have their own root-entry that can be expanded like in the current import tab.
An import run is automatically added when the source is removed and the import is completely finished.
The status of every imported fragment is displayed in the success-column. Here you see which fragments
were imported correctly, and which were not imported, which files have been created and which
downloads have failed.
Logged Data Files
Page 80 of 282
Import Process
The Importing of a file runs in four steps that can run partial
parallel.
1. The file is downloaded from the device. In this step,
the data is copied from the device to your local hard
drive. You can specify this folder under “Settings ->
Advanced… -> Download folder”
2. The downloaded file is then converted into a
temporary file. This step doesn’t need the file to be
downloaded completely. As soon as there is data
downloaded to your hard drive it is converted. As the
download folder, the work folder can also be specified
in advanced settings.
3. When all parts for the final merging (according to the
“export file”-option in the settings-page) are
converted, they are merged into a single file that can
be used in WinDarab. While the merging is in progress,
a temporary file is written into the “save files”-folder
specified in the device settings.
4. When the file is merged completely, it is moved to its
final folder (“save files”-folder combined with the
specified subfolder) and renamed according to the
template as defined in the device-settings.
After the files have been merged successfully, the temporary files are deleted.
Tips for setting the paths
As you can see, you have many options to control the importing by setting the paths. And there is also
much performance increase that can be gained by setting the paths wisely.
In almost every step, files are read and written to your hard drive(s). So if you want a fast download and
have more than one hard drive installed into your pc, it is advised to select your download folder to be on
another physical hard drive than your other folders. This way the download can use the full transfer rate of
the hard drive.
Also have an eye on the file-sizes. The files on your device are usually compressed.
As the data-import is optimized mainly towards speed, the imported files are uncompressed and can be
significantly larger than the original data. Additionally, there are the downloaded, converted and merged
files saved on your hard drives during the import process, so make sure you have enough free space to
support it.
Importing Longterm Data
You can import the longterm data from a device by using the longterm importer.
Logged Data Files
Page 81 of 282
WinDarabButton/
Import/Export/ Import
from data logging
device
To transfer data from the hardware you must call up the menu item
“WinDarab-Button/ Import/Export/ Import from data logging device”. The
data logger import dialog will appear.
As the Current Import- and the Recent Import-pages stay the same, the Settings-page differs from the
usual import dialog.
Settings-Tab
The import sources allow you to choose between FlashCard/USB-Stick and Device. The bursttransmission is not allowed in the longterm data import.
Also there is only one settings-tab for all import source.
There you can set the host to connect to for the device import source and the destination-folder for the
files. The other parameters that you could manage in the usual import dialog are predefined and can’t be
changed.
The files that are imported from a longterm device are not merged. You get one Darab-file for every file
on the device.
Logged Data Files
Page 82 of 282
Additionally, the files are imported on connection and they are not deleted after the transfer.
The filename is also predefined as “[CardInfo] [outing]-[lap]-[fragment] #[n]”.
File Password Protection
Change File Password
You can change the password of your files after the import by selecting WinDarab-button/ Tools/
Change file password/signature.
Chose the files that you want to protect with a new password. You can search for files in a given
directory by clicking on “Search ...” and selecting the directory you want to search.
Check “Scan subfolders for measurement files” if you want to include the directorys subfolders into the
search.
Setting a new
Password
Select the option “New password”.
Check all files that you want to protect with a new password. Insert a password hint
and the new password into the fields and check “Save password” if you want the
password to be saved. Alternatively you can select a predefined password hint.
Now press “Start” to protect the selected files with the new password.
Logged Data Files
Page 83 of 282
Removing the
Password
Select the option “Remove Password (Convert to Darab6 format)”.
Check all files whose passwords you want to remove and press “Start” to remove
their password.
Note:
Removing the password will reactivate the project protection of the ECU. There is no
way to create a unprotected WinDarab v6 compatible file !
Open Password-protected Files
If you open a password-protected file you will get the following promt:
Type in the password for the file associated with the hint and press OK. If you want the password to be
saved for you, check the “Save password” box.
Creating a Password-protected File
If you want to protect an imported or extracted file with a password, you have to check the “Set
password” box at the save file dialog. After you press save, a prompt is shown where you can set the
password for the file.
Logged Data Files
Page 84 of 282
Insert a password hint and the new password into the fields and check “Save password” if you want the
password to be saved. Alternatively you can select a predefined password hint.
Press OK to complete the task.
Data Protection and Downward Compatibility
If WinDarab format is written a password can be set. The Password can also be set in RaceCon. By
reading logged data into WinDarab the password is prompted if the option “Force Password” is set (see
chapter Reading Logged Data)
In WinDarab v7 you must first enter the password before you can open a protected logged data file.
WinDarab v6 can’t open password protected logged data files.
With WinDarab v7 you can also open data written in WinDarab v6 if the license corresponds to the
PCode.
Using Wildcards in Sub-Folders and File Names
You may use wildcards to allocate sub-folder and file names automatically. When you save files the
variables will be replaced with information provided by the file.
The following wildcards may be used:
[year]
Year*
[mon]
Month*
[day]
Day*
[hour]
Hour* (24 hour format)
[hr12]
Hour* (12 hour clock)
[ampm]
Part of day* (12 hour format)
[min]
Minute*
[sec]
Second*
[car]
Car Identifier provided by status block (for CardMemory Measurement (C4x
Logger))
[cardinfo]
CardInfo entry (configurable through RaceCon Recording name)
[fastlap]
Number of fastest lap
[fastlaptime]
Time of fastest lap
[lap]
Number of first lap
[outing]
Number of outing (of the first lap)
Logged Data Files
Page 85 of 282
[fragment]
Number of file fragment
[n]
Consecutive numbering
(allowed in file names only)
With the exception of this wildcard all wildcards will be included in the file
name. The system then searches a folder for files with the same name. The new
file will receive the numerical value +1 of the file with the highest number in use
thus far.
* of data reading
Format directives can be appended to numeric wildcards.
E.g. [lap3] will format the lap number as right aligned text with three characters. [lap03]
will format the lap number with leading zeros instead of spaces.
The same restrictions that apply to the allocation of sub-folder and file names in Windows
apply here. As a result the use of the following characters is not permitted:
Colon ':'
Slash '/'
Backslash '\'
If WinDarab is unable to create a folder or file during saving a message is generated. Please
check the file name for disallowed characters and make the necessary corrections.
Not all wildcards are supports by the different data readers.
Logged Data Files
Page 86 of 282
Desktop
While working with WinDarab a typical component constellation might look like this:
A Desktop consists of the opened dockable window and the worksheets you are currently processed. Each
worksheet contains the worksheet controls whereby you analyse and visualize logged data.
WinDarab offers the possibility to save and retrieve a particular Desktop.
If loading a Desktop you can choose whether to view the files in a new Desktop or whether to restore a
previous situation.
As opposed to simply loading a Desktop, restoring a previous Desktop constellation involves the closing of
all currently opened files and the opening of those files that were in use as the Desktop was saved. In
addition to the configured settings (e.g. channels) the windows will also restore the displayed excerpts and
reproduce the situation exactly as it was before.
Every time you exit WinDarab the program saves the current Desktop and retrieves it the next time you
start the program.
Desktop
Page 87 of 282
Tip:
To suppress the automatic retrieval of the previous Desktop hold down the shift key when
you start WinDarab
Note:
During work WinDarab saves the current Desktop periodically.
Loading a Desktop
Follow these steps to load a Desktop:
1. Select “Start/ Desktop/ Load” from the menu.
2. The “Load desktop” Assistant will appear.
3. Now you have two options to open the selected desktop. Click on “Open” to open the desktop with the
currently opened files
You can also choose “restore desktop with files” from the dropdown menu to replace the currently
opened files with the files stored in the desktop-file.
You can also use the mru-function to open a desktop. Click on the dropdown button next to
the load button and select the desktop you want to use. Press the ctrl-key while doing so to
loaded the desktop with the files stored in the desktop-configuration.
Desktop
Page 88 of 282
Saving a Desktop
Follow these steps to save a Desktop:
1. Select “Start/ Desktop/ Save” from the menu.
2. Save Desktop will appear.
3. Select the folder in which you want to save.
4. Enter a file name for the Desktop and click on Save.
Desktop
Page 89 of 282
Oscilloscope
The Oscilloscope is the most important window for the analysis of logged data. This window displays the
signal curves of channels recorded one or more Logged Data Files.
To open a new Oscilloscope, select “Windows/ Worksheet controls/ Graph display ” and drag it onto a
worksheet.
You can also right-click on an emty part of a worksheet and select “Graph display” to open
an Oscilloscope.
Oscilloscopes are called Measured Data Window.
Important:
WinDarab allows you to open more than one Oscilloscope at the same time one of them is
always the “active Oscilloscope”. For example, even if you have just activated an Analysis
Window WinDarab nonetheless considers the most recently used Oscilloscope as “active
Oscilloscope”.
An Oscilloscope displays the following:
one or more measuring areas
channel values for all displayed channels
used files
Oscilloscope
Page 90 of 282
Tip:
To change the width of the Channel Values display area move your mouse across the area’s
left-hand boundary until the mouse pointer changes. You can now drag the boundary to the
right or left.
Areas
An Oscilloscope window can be divided into areas to organize your channels.
Creating an Area
There are the following methods to create an area.
From Darab ribbon:
Choose Start/ Areas/ Insert from the menu.
Start/ Areas/ Insert An Oscilloscope always contains at least one area.
From Oscilloscope context menu:
An area can be created using the Oscilloscope local menu also.
Click with the left and right mouse (or middle) button on the Oscilloscope to open the context
menu and choose Area/ Create Area
Oscilloscope
Page 91 of 282
Additional measuring areas are always added at the bottom of the window above the bit
area. Adding a new area will reduce the size of already existing areas accordingly.
Changing the Size of an Area
You can change the size of an area with your mouse.
Click on the upper or lower boundary of an area and then move it up or down.
Tip:
You can create a new measuring area by using the same technique. Simply click on the upper
edge of the topmost measuring area (or the lower edge of the measuring area at the very
bottom) and move it.
Deleting an Area
Use your mouse to place the crosshairs anywhere within the area you want to delete.
You can remove the area from the Darab ribbon or from Logger Data Window context menu.
Choose “Start/ Areas/ Remove” from Darab ribbon.
Choose “Areas/Remove” in Logger Data Window context menu.
Oscilloscope
Page 92 of 282
Modes
You can choose the axis mode of an area between 3 given axes-setups.
Choose “Start/ Axis Mode” from Darab ribbon.
Custom
This is the default option. In this mode, you can customize the area without any
restrictions.
Stacked
With this option selected, every channel gets its own axis on the first left slot.
Note:
In stacked mode, it is not possible to change the axis. To change the order of the
channels, move them in the channel-area.
Overlapped If this mode is selected, every channel uses the full height of the area and there
is only one axis allowed per slot.
Note:
The channel-configuration is saved when the mode is changed, so you have the
same configuration when you switch back to a previous mode.
However, if you remove a channel and insert it again, the saved data is gone.
Channels
Channels represent signals that have either been recorded in a vehicle or have been generated from
mathematical calculations.
Channels are displayed in areas inside an Oscilloscope. The available range of channel display options will
be described below.
Selecting and Adding Channels
There are the following methods to select and add a channel to the Oscilloscope. From
Channel Window
Darab Ribbon
Add context menu
From Channel Window:
Oscilloscope
Page 93 of 282
To view a channel in the Oscilloscope select the channel from Channel Window and drag &
drop it to the Oscilloscope.
From Darab Ribbon:
Start/
Settings/
Edit
To access channel selection choose “Start/ Settings/ Edit” from the menu. The dialog box
that subsequently appears enables you to configure display options for the entire
Oscilloscope.
To open the Select Channel dialog box you can even press F5 key.
Select Channel dialog box:
This dialog box contains a list of all currently selected channels. An empty row for the
addition of another channel is always provided at the bottom of the list.
Below this list you will find a series of buttons for a number of helpful functions.
Adding a
Channel
Oscilloscope
Follow these steps to add an additional channel to an Oscilloscope:
1. Place the cursor in the empty row at the end of the list.
Click on the “New trace” button to do this very quickly.
2. In the “Overlay” column select the overlay containing the channel you want to display.
3. Select the channel from the adjacent column. From this point on, the channel will be
displayed in the Oscilloscope.
4. Now choose the area in which you want to display the channel.
5. Next choose the color in which you want to render the channel.
Page 94 of 282
6. Column “W” allows you to determine the width of the signal display. You are able to
choose a value from 1 to 5 pixels.
7. Column “D” allows you to specify whether absolute or differential channel values are to
be used. (The difference will be calculated by comparison to a reference channel
contained in “Base File for Differences”) For more detailed information please refer to
“Channels—Differences” in this manual.
8. The “le” or “ri” columns allow you to assign the selected channel to an axis-slot, create
new y-axes or remove the channel from an axis.
9. In the remaining two columns you are able to set minimum and maximum channel
values.
Tip:
If you want to add the same channel to all the files contained in an Oscilloscope select the
channel from the “Channels Window” and drag & drop it to the Oscilloscope.
If the user is adding a channel and the channel is empty (contains no data) a message is
displayed.
Notes:
Selecting a Channel from the List
To find a particular channel quickly, simply type the channel name in the entry field. A list
pops up automatically. As you continue typing the channel name that matches the letter
sequence you have typed so far will be displayed.
You can even use the cursor keys to scroll through the list. Pressing Enter on the keyboard
confirms an items selection.
Differences
If you have selected the function for calculating differences between channels the fields for
minimum and maximum values will be changed to:
MinimumNew = -(Maximum-Minimum) / 2
MaximumNew = (Maximum-Minimum) / 2
If you de-select this function, the range of values you originally entered will be restored.
Y-axes
Oscilloscope
Page 95 of 282
An area can only display one y-axis, either on the right- or left-hand side. If you have
selected the right (or left) axis location for a number of channels in the same area WinDarab
adjusts the measurement scale on the y-axis so that these channels will have the same
minimum as well as the same maximum values. A subsequent change of a channels
minimum value (for instance), will then produce a simultaneous change in the minimum
value for all other channels that have the same name or are have been assigned to the same
y-axis.
New Trace
Use this button to move the cursor to the last, empty row in the table.
Remove
Trace
Using this button removes a channel in the selected row from the channel list as well as the
Oscilloscope.
Tip:
You can quickly and efficiently remove one or several channels with the same name by
selecting the channel, open the context menu with a right mouse click and choosing the
“Remove”- menu point. You can select more than one channel by keeping the Ctrl key
pressed.
Print
This Button can be used to Print out Data from the Oscilloscope. When u click on it, the Print
Layout will open.
Open
Use this button to open additional files.
Insert Area
Clicking on the “Insert Area” button enables you to add a new area to the Oscilloscope. The
selected channel will immediately be transferred to the new area.
More ...
Clicking on this button displays a menu with additional functions.
Remove traces from Area
This button removes all traces contained in the area selected in the current row.
Remove All traces
This button removes all traces from a configuration. Areas will not be deleted.
Close all areas
Removes all channels and areas from a configuration.
Oscilloscope
Page 96 of 282
Example:
In “Channel Settings” the “Rev” channel has the default color “very light blue”. You have
selected a “red” file as well as the “Rev” channel. Accordingly, WinDarab adjusts the channel
color to “very light red”. In the next row you choose the “Speed” channel. Because no color
has been specified in “Channel Settings”, this channel as well is displayed in “very light red”.
If you now switch to a “green” file for “Speed”, the channel will be rendered in “very light
green.”
Base File
for
Differences
This field displays the file used as a referent during the calculation of differences. A
difference is calculated as follows:
Difference = <Value File> - <Value Base File>
In order to specify a different Base File for calculating, you must select a new Base File from
the list.
Adding Channels
If you do not need to specify any particular details when you are adding a channel, you may also use the
”Add channels” function.
Press Insert on the Oscilloscope to open the “Add ...” menu. Choose “Channels” to open the
“Add channels” dialog box.
This function enables you to add one or more channels to all the files contained in an
Oscilloscope.
The Add Channels dialog box appears:
If you want to add one or more channels from each file to an Oscilloscope, use these steps:
Oscilloscope
Page 97 of 282
1. Press Insert to open the context menu “Add...”.
2. Select menu point “Channel” to open the dialog box.
3. If necessary, select the file containing the available channel names in the “Show channels
of” field.
4. From the list displayed under “Available Channels” choose one or more channels. Select
them by clicking on the button with the blue triangle pointed to the right.
5. Repeat step 3 until the list in “Selected Channels” contains all the desired channels.
6. Click on “OK”.
7. The selected channels for each file displayed in the Oscilloscope will be added to the
active area.
Tip:
You can select the channels you have chosen from the list displayed under “Available
Channels” by pressing Enter on your keyboard. Pressing Enter once more (without having
changed your selection) will confirm the selection.
Note:
Channels will be added to the area to which the crosshairs are pointing.
The color of the added channels will match the file color.
You can add channels also with dragging a channel from the “Channels Windows” or from
another window that supports drag & drop (for example another Oscilloscope or another
area of the same window).
Depending on the area where you drop the channel different things can happen. If you drop
it on:
the column with the channel values or inside of an area then the channel will be added in
this area
the left or right border of an area the channel will be added into the area and a y-axis for
this channel will be also added on the left or right. You will see a different cursor on the
left or right side of the areas during dragging.
the top or bottom of an area a new area will be added that contains the channel. You will
see a different cursor on the top and bottom sides of the areas during dragging.
If you start dragging from another area (from the same or another Oscilloscope) then
depending on the Ctrl key the selected channel will be moved or copied. If the Ctrl key is
pressed the channel will be copied else it will be moved. A small “+” sign appears on the right
bottom of the cursor if the channel would be copied.
Removing Channels
To remove a channel from an Oscilloscope follow these steps:
1. Select the channel in the channel list of the Oscilloscope
2. Press the keys Delete to open the Remove … context menu.
3. Select from the menu whether to remove only the selected channel or all opened
channels with the same name.
Oscilloscope
Page 98 of 282
You can also remove a channel by simple dragging it to the “Channels Window” (the trash
icon will appear over the “Channels Window” to indicate that the channel will be removed).
To delete all channels form Oscilloscope press Delete – a
Note:
You can also remove channels by using the “Add Channels” dialog box. Open the dialog box.
Select the channels in the “Selected Channels” column you want to remove from the
Oscilloscope and click on the button with the blue triangle pointed to the left.
Additional Functions
Additional functions available from channel context menu:
You can activate additional functions for each selected channel:
Show Info
Hiding a Channel
Flashing Channel
Change Color
Change y-area
Set Zero Point
Delete Zero
To select (or de-select) one of these additional functions use your right mouse button to
click on the desired channel in the Oscilloscope. A local menu will appear, listing all
functions available for the selected channel. For changing the color a drag & drop can
also be used.
Oscilloscope
Page 99 of 282
Show Info
Choosing this function opens a small window that displays a number of values for the
selected channel.
If you have not previously set a marker the values for the displayed data segment will be
calculated. If you did set a marker, values for the area delimited by the marker and the
current cursor position will be calculated.
Minimum
Maximum
Average
The following values will be calculated only if a marker has been set:
Gradient
Area
Area delimited by the signal curve and the zero line of a channel
Area 2
Area delimited by the signal curve and the horizontal line running through the
smaller y-value of the marker and cursor position
Change Color
Selecting this entry in the channel local menu displays the color palette from which you
can choose a different channel color.
You can also change the color of a channel by dragging a color from
the colors Window and drop it on the channels name in value column.
Change yRange
Oscilloscope
This function enables you to define the y-range for the selected channel. The function is
also available in the channel local menu.
Page 100 of 282
Enter the new maximum and minimum values.
Click on “OK”.
To restore the previous values click on the “Reset” button.
Press y-key to open the “Adjust y-Range” dialog box.
The y minimum and maximum values can also be inserted into the fields „Max“ and
“Min“ under the menu “Channel/ y - Scale”.
Restore y
Range
To return the y-Range to its previous settings, choose this function from cannel context
menu or “Channel/ y-Scale/ Reset” from menu list.
Auto scale yRange
To scale y-Range automatically, choose this function from cannel local menu or
“Channel/ y-Scale/ Adjust” from menu.
Show zero line
The zero line is shown on the Logger Data window if this option is selected.
Show constant
lines
To show or hide constant lines, choose this function from the cannel context menu.
Set Zero Point
WinDarab allows you to set the zero point for a channel
1. Select (Check) the constant lines you want to display in the graph window.
2. Insert the values for the selected constant lines. (Zero line doesn’t need a value)
3. Click on “OK”.
The zero point is only valid while a file remains opened. If you close the
file the new zero point will not be saved. Setting a permanent zero point
saves them into a Logged Data File and retrieves them when this file is
re-opened.
Oscilloscope
Page 101 of 282
If you want to set a zero point, check the appropriate menu item to
specify what type of zero you want to set.
Replacing a permanent zero point with a temporary zero point causes
the permanent zero point to be deleted.
Zero ...
Selecting this function opens a small dialog box in which you are able to enter the
absolute value that is to equal the 0 value.
You can open the “Set zero offset” dialog box from Darab menu list
Channel/ Set zero/ Dialog ...
To open the “Set zero offset” dialog box you also can press the z-key.
Set Zero Point/
Set Zero Point
(permanently)
Use the function to set your zero point. The cursor used to mark the channels y-value
which serves as the new zero point.
The function is selected either from the channel local menu
Delete Zero
Point
“Set Zero Point” and
“Set Permanent Zero Point” or from the menu
“Channel/ Set zero/ Set zero” and
“Channel/ Set zero/ Set zero and save to file”
Select this menu item from the channel local menu if you want to delete the previously
set zero point for a particular channel.
Additional functions available from Darab menu tab Channel.
You can activate additional functions for each selected channel:
Oscilloscope
Filter a Channel
Showing/Hiding a Channel
Blinking Channel Display
Thickness
Page 102 of 282
Filter a Channel
WinDarab enables you to define a series of mathematical functions (i.e. filters) in order
to reduce interference and channel noise (see chapter Mathematical Channels and
Filters).
To activate a channel filter select the desired filter from the menu bar “Channel/ Filter”.
Selecting the filter again will deactivate the filtering.
Important:
The menu always displays the ten most recently used filters. If more
than ten filters have been defined in WinDarab, an additional menu
item containing a list of all defined filters will be displayed.
When a channel is filtered the filters name is appended to the
channel name. This new, filtered channel will be displayed on all
channel selection lists while it is used in WinDarab.
As a result the filtered channel can be used in all other program
functions such as the Analysis Window, for example.
Showing/Hidin
g a Channel
You can temporarily suppress the display of a channel without actually removing it from
the current configuration.
To suppress a channel select “Channel/ Display/ Hide” in the menu. Selecting this option
again to show the channel.
You can select or de-select this function also by clicking on the
color dot beside the channel name with your left mouse button.
Blinking
Channel
Display
To emphasise a channel you can choose a blinking display. To do this, select “Channel/
Display/ Blink” in the menu. Selecting this option once again will de-activate the flashing
display.
You can also activate (or de-activate) this function by clicking on
the color dot beside the channel name with your right mouse
button.
Important:
A blinking display means that a channel is alternately displayed in
its own and the background color. This may cause problems with
the display of other channels.
Thickness
This feature allows setting the thickness of a channel curve in the Oscilloscope. The
thickness of a channel can be specified in “Channel/ Display/ Thickness”.
1. Select the channel in the Oscilloscope
2. Select a thickness from 1 to 5 in “Channel/ Display/ Thickness” menu.
If not specified the channel curve gets the standard thickness of 1.
Oscilloscope
Page 103 of 282
Axes
Axes can be assigned to multible channels to display their value-range in the Measured Data Window.
Adding a new Axis
There are many ways to add an Axis to a Measured Data Window.
Drag and
drop
Drag one more channels to the left or right border of the Area until the NewAxis-Icon appears. Release the Mousebutton to clip the new Axis to the
left/right border of the Area.
If there is more than one channel selected, all channels are bound to the same
axis.
There is more information in the section “Customizing Axes”
Note:
If you drag Channels from a different Area, these Channels will be moved to
the new Area.
Channel
Contextmenu
Rightclick on one or more selected channels to open the contextmenu. In the
display-submenu you can choose to bind the selected channels to an existing
axis or to create a new one.
Note:
If the selected channels are from different areas, the option to bind the
channels to an existing axis is not given. If you choose to create a new axis, a
new axis will be created in every area with a selected channel.
Ribbon
In the Ribbon under “Channel/ y-Scale/ Y-Axis”, you can add or remove the
axes of the selected channels.
Note:
If the ribbon-button is marked as checked, all selected channels lose their axis.
If it isn’t checked, all selected channels are bound to the same new axis.
If the selected channels are from different areas, a new axis will be created in
every area with a selected channel.
Customizing Axes
Axes can be customized regarding their design, size and values
Size
Axes, usually use the entire height of the area. But you can resize them for example to have two individual
axes in the same axis slot.
Oscilloscope
Page 104 of 282
Note:
Resizing theaxes only works in Custom mode. You can find more about Areamodes in the
Section “Areas/Modes”
Drag and
drop
Click on the top border of an axis and drag it to resize the axis.
Note:
You can’t overlap axes. If you want to maximize an axis height, doubleclick on
the top or the bottoms border.
You can devide an existing axis into two equal parts by dropping a new axis on
the top or bottm third of the axis. The new axis will take exactely the half of
the targeted axis which will be resized to the other half.
Dropping a new axis on the left or right side of an existing axis, the new axis is
created right next to the targeted axis with the same size and position.
Dropping a new Axis onto free space over or under an existing axis, the new
axis will fill out the maximum space without overlapping with an other axis.
Every drop-zone will be displayed by a blue region, to let you know which dropzone is currently selected.
Value
Axes show the channels value-range by default. In the contextmenu you can config it otherwise.
Oscilloscope
Page 105 of 282
Proportional
values
This option changes the value-range to axis-percentage. The values go from 0 to 100%.
Note:
When the axis is in proportional value mode, the channels on one axis are not linked
anymore. You can scale one channel, without the others being scaled as well.
Absolute
values
This option is the default-setting. The axis has a minimum and maximum value to which all
the attached channels are scaled.
Display
factor
The Display factor can help you to show exceptional big/small values in a better readable
way. If the factor is different to 1, it is shown with the axis unit.
Note:
The Display factor can only be modified in absolute value mode.
Also, the Display factor can not be modified in Darab-v6-mode.
Show exact
values
If this option is not checked, the displayed values are rounded to the next natural number.
Every drop-zone will be displayed by a blue region, to let you know which drop-zone is
currently selected.
Configurations
A configuration/setting contains the particular composition of an Oscilloscope. You can save a window
configuration and retrieve it any time.
A configuration contains the following information:
Number and size of areas
Number of files used ( not the file names of opened files)
Active File
Base File for calculating differences
Channels and their colors as well as Min/Max values
Y-axes
Active x-axis
Oscilloscope
Page 106 of 282
Saving a Configuration
Start/
Settings/
Save
Follow these steps to save the current configuration for an Oscilloscope:
1.
2.
3.
4.
5.
6.
7.
Activate the Oscilloscope whose configuration you want to save.
Select “Start/ Settings/ Save” from the menu.
The File Explorer dialog box “Save settings” appears.
Select the folder in which you want to save the configuration.
Enter a name under which you want to save the configuration.
Complete the optional fields.
Click on “OK”.
Press F7 to open the File Explorer
The following entry fields are available in the “Save Settings” dialog box:
Folder
In this field select the folder in which you want to save the configuration.
Files
This area provides information about all configurations and sub-folders contained in the
current folder.
Name
In this field you enter the name under which you want to save the configuration.
Oscilloscope
Page 107 of 282
Note:
WinDarab uses File Explorer to manage configurations. For information about how to work
with File Explorer, please refer to the “File Explorer” chapter in this manual.
Add Settings
The “Add Settings” function loads an additional configuration for all displayed files.
If an Oscilloscope does not yet contain a file, choosing this menu item performs the “Load Settings”
function (see below).
Follow these steps to load an additional configuration into an Oscilloscope:
Click with the left mouse button to activate the Oscilloscope to which you want to
load the new configuration.
Press Insert to open the “Add ...” context menu and select “Settings”.
The dialog box “Select oscilloscope configuration” will appear.
Select the configuration you want to add to the Oscilloscope and click on “Open”.
The configuration will now be loaded into the Oscilloscope.
Oscilloscope
Page 108 of 282
Load Settings
The “Load Settings” function removes all channels from the Oscilloscope and loads a new configuration for
the selected file only.
Follow these steps to load a new configuration to an Oscilloscope:
Click with the left mouse button to activate the Oscilloscope to which you want to load the
new configuration.
Select “Start/ Settings/ Load” from the menu.
The dialog box “Select oscilloscope configuration” will appear.
Select the configuration you want to load and click on “Open”.
The configuration will now be loaded into the Oscilloscope.
If a file has no Logged Data File assigned the channels in that file will not be loaded.
Oscilloscope
Page 109 of 282
If you load a new configuration but use the same set of Logged Data Files the current logged
data segment will be retained.
If you have not yet opened any Logged Data Files when you begin loading a new
configuration, File Explorer will open.
Replace Settings
The “Replace Settings” function loads a different configuration for all displayed files.
Follow these steps to replace a configuration
Click with the left mouse button to activate the Oscilloscope to which you want to load the
new configuration.
Press R to open the “Replace ...” local menu and select “Settings”
The dialog box “Select oscilloscope configuration” will appear. Select the configuration you
want to load.
Click on “Open”.
The configuration will now be loaded into the Oscilloscope.
If a file has no Logged Data File assigned, the channels in that file will not be loaded.
If you load a new configuration but use the same Logged Data Files the current logged data
segment will be retained.
Select oscilloscope configuration Dialog Box
The “Select oscilloscope configuration” Dialog Box allows you to browse through drives, folders, locations
and select the configuration file.
Oscilloscope
Page 110 of 282
Note:
WinDarab uses File Explorer to manage configurations. For information about how to work
with Darab Explorer, please refer to the “File Explorer” section in this manual.
If the user loads an Oscilloscope configuration containing a channel, which is not provided by
a file, WinDarab automatically adds a “dummy” channel to the file.
The same happens, if a mathematical channel is deleted by the user or because of changing
the base folder where mathematical channels are loaded from.
If the user later adds a mathematical channel with the same name or changes the base folder
to a different folder, containing a mathematical channel definition for the “dummy” channel
name, WinDarab automatically replaces the “dummy” channel by the mathematical channel.
Working with Oscilloscopes
Crosshairs
Within an Oscilloscope the crosshairs mark the current position to which all displayed values refer.
Use the left mouse button to place or move the crosshairs.
Follows
Signal
Oscilloscope
When the “Start/ Cursor/ Shape/ Follows Signal” option has been selected, the crosshairs
vertical line follows the value of the selected channel.
Page 111 of 282
Note:
If the „Cursor Follows Signal“ option is activated and the value of the currently selected
signal is outside of the visible range, the horizontal line of the cursor will not be drawn any
more. The horizontal line is not visible in the area above/below of the area the signal resides
in.
If the „Follows Signal“ option is activated and the user moves the cursor from an empty area
to another area, the horizontal line of the cursor will not be removed from the old position.
Tag
A tag can be set any place in an Oscilloscope. Only one tag can be set within the Oscilloscope windows.
Setting a tag is an optional function used to delimit a logged data segment for analysis.
Set Tag
There are the following methods to set a tag:
Choose Start/ Tools/Tag/ Marker/ Set in Darab ribbon
Click with the left and right mouse (or middle) button on the
Oscilloscope to open the context menu and choose “Set Tag”.
Press Space to set a tag.
Setting of tags also display the differences of channels
Oscilloscope
Page 112 of 282
Note:
All Oscilloscope windows have the same tag. Therefore, a tag set in one Oscilloscope is also
set in every other Oscilloscope.
Remove
Tag
There are the following methods to remove a tag:
Choose Start/ Tools/ Tag/ Marker/ Remove in Darab ribbon
Click with the left and right mouse (or middle) button on the
Oscilloscope to open the context menu and choose “Remove Tag”.
Press Space twice to remove a tag.
You can also delete a tag by setting a tag in the same location in
which you have already set one.
Marked range (Selection)
If you select a range of data this is called marked range or selection. Only some functions of the windows
can use the marked range.
You can mark range with the mouse, with the keys or from the quick menu (which is opened
with the key W).
Oscilloscope
Page 113 of 282
By default the marked range will disappear after you click somewhere in the window. But
there is also a possibility to fix the marked range to a certain range around the current
cursor. In this case the marked range is moved with the cursor.
Wide
Cursor
You can choose the marked range to follow the cursor by the marked range quick menu or by
selecting “Start/ Cursor/ Wide Cursor” the menu.
Mouse Functions
You are able to perform every important function with your mouse. What types of functions are available
depends on the area you have clicked on.
Clicking on a display item with the right mouse button will typically open a local menu.
Note:
An exception occurs in the signal display area where you must use the centre mouse button
to open the local menu.
Important:
If your mouse only has two buttons, you can still call up the functions of the third (centre)
mouse button by holding down the right and left mouse buttons. Press the buttons one after
the other - not simultaneously.
You can access the following functions with your mouse in an Oscilloscope:
Sets crosshairs in the selected location.
Using the scroll wheel on your mouse will shift the selected file in
relation to all other files.
Left-click/Hold
Clicking onto the line separating two measuring areas allows you to
change their size.
If Shift key is pressed the range between start and end will be marked.
When you begin marking a range
holding down the Shift key marks a rectangular range within the
window.
Right-click/Hold moving the mouse laterally marks range along the x-axis.
Oscilloscope
Page 114 of 282
moving the mouse vertically marks a range along the y-axis of the
selected channel.
Releasing the mouse button allows you to zoom in on the marked
range. Using this function on the y-axis will zoom in on the marked
channel only.
Zooms 2x
Double-click left
Undo zoom 2x
Double-click
right
Displays local menu with a selection of menu commands.
Click centre
mouse button
Mouse wheel
Move crosshair in the corresponding direction. The movement is faster
when you increase the distance between the mouse and the crosshair.
Keyboard Functions
The following (important) keys are defined within Oscilloscope:
Left/ Right/ Top/
Bottom
Move crosshairs in the corresponding direction
Ctrl+Left
Scroll logged data display to the left by one-half the display width
Ctrl+Right
Scroll logged data display to the right by one-half the display width
+
Zoom 2x
If Shift key is pressed then marked range around the cursor will increase.
-
Undo zoom 2x
If Shift key is pressed then marked range around the cursor will decrease.
A
Zoom All
L
Zoom Lap
M
Zoom the marked range
W
Opens a menu which contains functions connected with the marked range.
Oscilloscope
Page 115 of 282
For example you can select the size of the marked range around the cursor
position.
S
Zoom Segment
T
Zoom Tag
Ctrl+Z
Undo Zoom
Space Bar
Set Tag (pressing twice: delete tag)
B
Turn on/off flashing channel display
C
Change color of the selected channel
H
Display/ Suppress display of the selected channel
I
Activate “Show Info” for the selected channel
Y
Restore default values for the y-range of the selected channel
Ctrl -Y
Set the y-range for the selected channel
Z
Set zero for the selected channel
ctrl+L
Select Laps
F4
Activates / de-activates “Shift File” mode
F5
Select Channels
F6
Load Settings
F7
Save Settings
F9
Load desktop
Insert
Opens local “Add ...” menu
Delete
Opens local “Remove ...” menu
R
Opens local “Replace ...” menu
Zooming and Comparing
There are a variety of options to enlarge or reduce the size of data segments when you want to evaluate
the recorded data.
The following zoom functions can be called up from the “Start/ Display” menu:
“+”
“-”
M
L
S
Oscilloscope
Zoom 2x
Doubles the zoom factor.
Zoom out 2x
Reduces the zoom factor by one half.
Zoom Marked Range
The currently marked range will be enlarged.
Zoom Lap
The lap in the crosshairs will be enlarged.
Zoom Segment
The course segment in the crosshairs will be enlarged.
Page 116 of 282
T
A
Ctrl+Z
Zoom Tag
The range delimited by the tag position and crosshairs will be
enlarged.
Zoom All
Displays all data in the Oscilloscope.
Zoom Undo
Undoes the previous zoom functions.
Adding a File
Additional Files can be added to an Oscilloscope with the local menu “Add ... / File”. The file will be first
added to the File Explorer Window.
Follow these steps to add an additional file to an Oscilloscope:
1.
2.
3.
4.
5.
Select the file you want to use as a template for the addition.
Press Insert to open the “Add ...” context menu or
Click on “File” in the menu.
Select the files you want to add to the Oscilloscope in File Explorer.
Click on “Open”.
The file is added and displayed in the File Explorer Window. To add the file lap to the Oscilloscope an
overlay has to be assigned to it.
There are the following methods to assign an overlay to a file lap.
Create an overlay
1. Create an overlay in the File Explorer Window (see File Explorer Window)
or
Oscilloscope
Page 117 of 282
2. Click on the the overlay-column (the new added column
Oscilloscope
) next to the file lap you want to add to the
Adding a lap
1.
2.
3.
4.
5.
Press Insert to open the “Add ...” context menu of the oscilloscope window
Click on “Add .../ Lap” in the menu.
Click on “OK”.
A new overlay is added to the lap currently active in the oscilloscope (see Adding lap)
Drag & drop the overlay to the file lap you want to add to the Oscilloscope
Replace file
There are three methods:
1. Drag & drop an existing overlay
to the desired file lap in the File Explorer Window
or
2. Open the context menu of an overlay
Replace file
in the File Explorer Window and choose Selected Overlay/
or
3. Click with the right mouse button on the file bar of the Oscilloscope to open the ”File” context menu an
choose File:/ Replace
Oscilloscope
Page 118 of 282
1. The File Explorer is opened
2. Choose the file and click on “Open”
3. The overlay is assigned to the file lap
A file can also be added to the File Explorer as follows.
1.
2.
3.
4.
Click with the right mouse button on the file bar of the Oscilloscope to open the ”File” context menu
Click on “File .../ Add / File” in the menu.
Select the files you want to add to the Oscilloscope in Darab-Explorer.
Click on “Open”.
Adding a Lap
The function “Add .../ Lap” an overlay to the currently active lap. Adding an overlay to the same file allows
you to make lap comparisons. Each overlay has its own color to enable you to differentiate one copy from
another.
Follow these steps to add an additional lap (or copy of a file):
Press Insert to open the “Add ...” local menu
Click on “Add .../ Lap” in the menu.
Click on “OK”.
Oscilloscope
Page 119 of 282
A lap can also be inserted by using the “File” local menu on the file bar of the Oscilloscope.
Change Color
You can change the file color at any time from local menu (Click right mouse button) on the files name. This
menu is only for this file. You can see the file name and its color as a title of the menu.
You can also change the color of a file by dragging a color from the “Colors Window“ and drop
it on the file's name in channel values column.
Deleting a File
There are the following methods to remove a file:
Select the file you want to remove in the file bar of the Oscilloscope.
Press Delete to open the “Remove ...” local menu.
Select “File” to remove the file
1. Select the file you want to delete from the file bar of the Oscilloscope.
2. Click on the file tab with the right mouse button to open the “File” menu and then click
on “Remove ...”.
Oscilloscope
Page 120 of 282
Tip:
Deleting a file from an Oscilloscope does not automatically close this file. The menu item
“Tools/ Settings/ Program/ Miscellaneous” is used to determine whether Win Darab closes
files automatically when they are no longer needed, or not. If you did not select this option
you have to close the file manually using the “Close File” function in the File Explorer Window
or “WinDarab-Button/ Close measurement file” in menu.
Replacing a File
To replace a file within an Oscilloscope with another file follow these steps:
1. Select the file you want to replace in the file bar of the Oscilloscopes.
2. Press R to open the “Replace ...” context menu and select “File”
or
Click with the right mouse button on the file tab to open the “File” local menu and choose “Replace”
3. In File Explorer open the file with which you want to replace the selected file in the Oscilloscope.
4. Click on “Open”.
Note:
The file you have selected will only be replaced in the active Oscilloscope. In all other
windows the selected file remains open.
Tip:
You can also replace a file by dragging the new one from the files/channels/colors toolbar or
from another window (for example another Oscilloscope) into its file name area. If the new
file is from another window then the file can be copied (default) or moved (Shift). A small “+”
sign appears on the right bottom of the cursor if the file will be copied.
Oscilloscope
Page 121 of 282
Replacing file settings
To replace file settings follow these steps:
1. Select the file whose settings you want to replace in the file bar of the Oscilloscope.
2. Press R to open the “Replace ...” context menu and select “Settings”.
3. In Darab Explorer open the settings that will replace the file settings.
4. Click on “Open”.
File colors and all channel colors will remain unchanged.
Selecting Laps
Several functions are available to select a particular lap in the current display. Select Start/ Display/
Select Laps
Select
Laps
Ctrl+L
The “Start/ Select Laps” function allows you to conveniently select particular laps from the
loaded files for immediate comparison.
Previous
lap
This selection displays the same course segment from the preceding lap for the selected file.
The display of all other data remains unchanged.
P Key
Next lap
N Key
This selection displays the same course segment from the next lap for the selected file. The
display of all other data remains unchanged.
Fastest
F Key
This selection displays the same course segment from the fastest lap for the selected file. The
display of all other data remains unchanged.
Oscilloscope
Page 122 of 282
Zoom
fastest
Ctrl +F
This selection displays the same course segment from the fastest lap in all displayed files. If
several laps within the same file are displayed, then the fastest and the second fastest lap will
be shown.
The “File” context menu on the file bar of the Oscilloscope contains also the “Select lap/
Previous, Next and Fastest” entries.
To open the “File” context menu click with the right mouse button on the file bar of the
Oscilloscopes.
Tip:
Use the “Select Fastest Laps” button if you want to find the fastest laps in the files you have
selected.
If you have opened a file more than once (in order to make lap comparisons within a single
file) the “Select Fastest Laps” function will find the next slower lap for each additional
instance the file has been opened.
Lining Up Axes
While comparing two files, it is very unlikely that the particular sections you want to
compare will be aligned over top of one another. You will have to move the files so that the
sections of interest line up.
WinDarab automatically makes this adjustment when comparing laps. You can find more
information about this function in the section called “Selecting Laps”.
If you want to compare particular areas, you have to line up the corresponding files yourself.
WinDarab provides the “File Shifting” function that enable you to accomplish this.
File
Shifting
In the “File Shifting” mode some keyboard and mouse functions are different. You activate
and de-activate this function by selecting “Start/ Cursor/File Shifting” from the menu.
Once you have activated this mode the following keyboard and mouse functions will be
Oscilloscope
Page 123 of 282
altered:
Left / Right
The selected file will be moved exactly one pixel to the right or to the left.
ctrl+Left
ctrl+Right
The selected file will be moved exactly five pixels to the right or to the left.
File movement will correspond to your mouse movements.
'<' or '>'
The selected file will be moved exactly one pixel to the right or to the left.
Ctrl + '<' or
ctrl + '>'
The selected file will be moved exactly five pixels to the right or left.
Ctrl + left mouse button
File movement will correspond to your mouse movements.
left mouse
button and
Scroll
Wheel
Holding down the left mouse button enables you to move a file using the
scroll wheel. It is possible to control the scrolling speed: the greater the
distance separating the mouse pointer from the crosshairs the faster a file will
be scrolled.
The “File Shifting” option can be activate from the Logger Data Window context menu. Click
the left and right mouse button on the window to open the local menu and select “Shift
active file”
.
To open the context menu click with the right mouse button on the Oscilloscope.
Manual Lap Trigger
In cases where lap trigger signals could not be received by the vehicle due to a malfunction, you are able to
add them manually in WinDarab.
When you add a lap trigger manually a lap is divided in two sections and lap times are adjusted accordingly.
Because lap numbering remains unaffected by the addition you will find a duplicate lap number in the lap
display. The added lap will be differentiated by the letter “m” beside the lap time.
Oscilloscope
Page 124 of 282
Only lap triggers that have been set manually can be removed. Lap triggers recorded by the hardware can
neither be changed nor removed.
Note:
Manually added lap triggers will be permanently saved in the Logged Data File.
Insert Lap Trigger
Follow these steps to add a manual lap trigger:
1. Open an Oscilloscope and add some channels.
2. Place the crosshairs where you want to add a lap trigger.
3. Select “Start/ Tools/ Laptrigger/ Insert” from the menu.
A lap trigger can be inserted by choosing “Laptrigger” in the “Add ...” context menu of the
Oscilloscope.
Press Insert key to open the “Add ...” context menu.
Deleting a Lap Trigger
Follow these steps to delete a manual lap trigger:
1. Open an Oscilloscope and add some channels
2. Place the crosshairs in the lap you generated by adding the manual lap trigger. A lap that
has been manually generated is differentiated by the letter “m” beside the lap time.
3. Select “Start/ Tools/ Laptrigger/ Delete” from the menu.
Oscilloscope
Page 125 of 282
A lap trigger can be deleted by choosing “Laptrigger” in the “Remove ...” context menu of
the Oscilloscope.
Press Delete key to open the “Remove ...” context menu.
Laptrigger Manager
The Laptrigger-dialog helps you manage your Laptriggers for a specific File. It lists all your Laptriggers for
this file with the distance- and time-position as well as the length of the resulting lap. You can delete
your manual Laptriggers or add new Laptriggers to a position of your choice.
Start/ Tools/
Laptrigger/
Laptriggers ...
Oscilloscope
The Laptrigger Manager can be accessed by clicking on “Start/ Tools/ Laptrigger/
Laptriggers ...”. The Laptrigger Manager will display current selected File.
Page 126 of 282
You can also access the Laptrigger Manager by rightclicking on a file in the Fileexplorer
followed by a click on “Laptriggers …”. In this case the displayed Laptriggers will be chosen
from the selected file.
Defining an In-/Outlap
A lap can be marked/un-marked as an in-/outlap by clicking on the In or Out-Symbols of the
chosen lap
Deleting a Laptrigger
A lap trigger can be deleted by selecting a manual Laptrigger from the List and then pressing
the Delete-Button.
Note:
You can only delete manual Laptriggers. The manual Laptriggers are marked by a gray “Man”Symbol.
Split Lap
You can Insert a Laptrigger by splitting an existing Lap into two or more parts.
First, you have to select the Lap you want to split. Then press the Split-Button. A new window appears.
Oscilloscope
Page 127 of 282
Put the length of the new laps in this window and press the OK-Button.
You can enter the length as a distance or time-value. When you press OK, the lap will be split into a
maximum number of parts of the chosen length.
As an additional feature, you can split the lap just once by selecting the "Split lap into two parts only" checkbox.
Whith this option selected, you create just one new laptrigger at the chosen distance from the start of the
selected lap.
Note:
You can input a distance- or a time- position. While you insert the distance- position as a
number, there are more ways to insert a time- position.
Like the distance, you can enter a number to specify the position in seconds.
In addition the formats hh:mm:ss and mm:ss are supported.
Generate Laptrigger
You can generate lapgriggers with the laptrigger generator built into WinDarab. It allows you to generate
Laptriggers by characteristics of a given channel.
The laptrigger generator can be opened by clicking “Generate…” in the laptrigger manager.
Oscilloscope
Page 128 of 282
Channel
Insert the base-channel for calculating the laptriggers. This channel can be a
mathchannel too.
Filter
The combobox includes a few pre-defined filters, which can be applied to the Channel
to smooth the values.
Laptrigger
detection
Select the detection-rules. You can choose between crossing the upper threshold,
crossing the lower threshold or crossing both either threshold (first three options). The
last three options are basically the same with the difference, that not the crossing of
the threshold marks the laptrigger-position but the following extremum.
Thresholds
The thresholds are defined by absolute values for the upper or the lower threshold
(Manual Threshold) or by a percentage-value (Auto Threshold). The upper threshold
will be the maximum value minusthe percentage of the difference between the
maximum and the minimum value.
The lower threshold will be the minimum value plus the percentage of the value
range.
Retrigger
locktime
This option defines the time after a laptrigger in which no other laptrigger can appear.
Minimum trigger
duration
The Minimum trigger duration is much like the Retrigger locktime, but instead of
blocking the next laptrigger if its within the time range, the laptrigger is not set if the
next laptrigger is in the time-range of the minimum trigger duration.
Oscilloscope
Page 129 of 282
Display Options
X-Axes
Win Darab provides a number of different x-axes for your display. At the moment you
can choose from the following x-axes:
Use the menu item “Start/ x-Axis” to set the axis for the current Oscilloscope.
Star/ x-Axis/
Distance
distance
Start/x-Axis/
Time
time
Start/ x-Axis/
Samples
samples
Start/ x-Axis/
Lap based scale
The “x-Axis/ Lap based scale” option allows you to change the units of measure along
the x-axis. Activating this option displays the relative values with respect to the
beginning of a lap. If it is de-activated, absolute values with respect to the start of data
recording will be shown.
Important:
Please remember that displaying the difference between “lapdist” channels (or
“laptime” channels) will not produce meaningful results if you have chosen “distance”
(or “time”) for your x-axis.
Note:
The “Samples” x-axis is primarily used for troubleshooting and running diagnostics.
Lap Trigger
Start/ Display/
Lap trigger
Oscilloscope
You activate or de-activate the function that allows you to show lap triggers in the
Oscilloscope in the “Start/ Display/ Lap Trigger” menu item.
Page 130 of 282
Racetrack Segments
You can display the lap segmentation near the top edge of the Oscilloscope.
Start/ Display/ Use the menu item “Start/ Display/ Lap segments” to activate or de-activate the display.
Racetrack
segments
Segment borders
Start/ Display/
Segment boarders
The menu item “Start/ Display/ Segment borders” enables you to activate or deactivate the display of individual segment markers.
Grid
Start/
Display/ Grid
Oscilloscope
To display gridlines within an Oscilloscope use the “Start/ Display/ Grid” the menu item.
Page 131 of 282
You can show the grid by pressing G – key also.
Selecting this function draws a line through each main calibration point along the x- and yaxes. If a range has two y-axes a grid based on the left y-axis will be displayed.
Replay offline files
In WinDarab you can replay recorded data in real time. When playing such a file then only the
data left from the cursor is supposed to be available for the tools and functions you are using
to watch the data (e.g. Racetrack Window, Analysis windows, Telemetry windows and
others).
The “Replay” option in menu “Start/ Tools” allows you to select one from both possible
modes for simulation. Click on the option to activate or de-activate the corresponding
simulation mode.
Follow (offline data). In this mode the logged data cursor will move to the next data of
currently selected offline file and channel. The speed of movement is synchronized with the
files time channel.
Pause (offline data). This is the default mode. The cursor of the Oscilloscope will not follow it.
Oscilloscope will be switched to pause mode automatically if you scroll the window.
Oscilloscope
Page 132 of 282
Additional Windows
The Racetrack Window
In the Racetrack Window WinDarab displays the current racetrack/course segmentation.
While you are working the Racetrack Window always remains in the foreground. You can position the
window wherever you like on the screen.
You can choose between a 2D and 3D view of the racetrack.
You can switch to 3D view at any time from the context menu. The context menu will be
opened by clicking with the right mouse on the Racetrack Window.
If the Racetrack Window is in 3D view the context menu is accessible through clicking the
right and left (or middle) mouse button on the window.
Additional Windows
Page 133 of 282
The 3D view has 2 sub views:
Additional Windows
Page 134 of 282
3D overview
3D overview is the default view when you switch to 3D. You can switch to this
view from the local menu.
Context Menu/ View/
Segmentations
3D drivers view
Local
Menu/View
/Drivers View
Additional Windows
You can switch to 3D drivers view only if you are in 3D view. You can use the context
menu.
Page 135 of 282
In the both 3D sub views you can zoom in, zoom out and rotate for better point of
view.
The Vehicle Position
Vehicle positions on the track are indicated by colored triangles (or spheres). Their tips
indicate the current position of each vehicle. Moving the crosshairs in the Oscilloscope
repositions the vehicles along the track. In this way you are always able to view the
position a vehicle occupied at a particular point in time.
Important:
Each vehicle position corresponds to the vehicle position of the current lap of the
current Oscilloscope. The cursor in the Oscilloscope gives the position of the vehicle for
active file. All other vehicles in the window may be shifted by some distance and so the
lap position must not be the same.
Because of this the racetrack window shows different lap positions for the each vehicle
on the course reflect the position marked with the crosshairs. Because the active file
determines the x-axis of the Oscilloscope the position of the crosshairs corresponds to
the position occupied by the vehicle of the active file. All other vehicle positions on the
course correspond to the position they occupy in relation to their own x-axes (which are
not displayed).
Windows/
Dockable
windows/
Racetrack
Additional Windows
Note:
If the Racetrack Window has been closed, for some reason, you can open it again by
choosing ”Windows/ Dockable windows/ Racetrack” from the menu.
Page 136 of 282
Clicking on any point on the racetrack moves the crosshairs in the Oscilloscope to that
point on the course.
This action moves also the vehicle in the active file to the same position.
Note:
The vehicle in the active file always remains in the active lap. For example, if a vehicle is
located in front of the Start/Finish line and you click on a position behind the Start/Finish
line the vehicle will return to the Start position in that same lap.
Note:
The size of vehicle cannot exceed a certain size. This could happen if the length of the
racetrack is very small (< 2000m).
Multi Segmentations
If you have selected several segmentations within the racetrack explorer you can see them in
the Racetrack Window (in 2D view and 3D overview, but not in 3D drivers view). In this view
you can compare several segmentations.
The first segmentation is shown as most inner segmentation and the segmentation are going
in direction outside, so the last (it is the default and it is marked with * in Racetrack Windows
title) segmentation is the most outer (for the order of segmentations see Selecting Racetracks
Segmentation). Only for the first and the last segmentation the segments will be shown.
If in the current Oscilloscope are two files opened then the Racetrack Window will show the
different cars in different segmentations. (First car on first segmentation and so on…).
Additional Windows
Page 137 of 282
You can switch to 3D view and zoom in parts of the racetrack to see the difference closely.
Moving over a segment from any of the segmentations a small yellow window (quick segment
info) will appear. There the segmentations name and the segments name (if the name is not
available then the index) are listed.
If you switch to some of the edit modes or to 3D drivers view only the default segmentation
will stay (last selected one during the multi selection in Racetrack Explorer).
3D Zoom & 3D Drag functions
"+"
Zoom in. You can use “+” on 3D navigator and also double click with left mouse button or
scroll in with the mouse scroll wheel.
"-"
Zoom out. You can use “-“on 3D navigator and also double click with right mouse button or
scroll out with the mouse scroll wheel.
Context
menu/
Show All. The scene will be moved to the default position.
Additional Windows
Page 138 of 282
Show All
Context
menu/
Zoom undo
Zoom undo. The previous zoom state will be returned.
If you drag the scene with the left mouse button the scene will be rotated. If you drag the
scene with the right mouse button then the scene will be translated.
Zooming a Segment
Double-clicking on a course segment causes the current Oscilloscope display to zoom in on the selected
segment. At the same time the crosshairs (and hence the vehicle in the active file) will move to the position
you have double-clicked.
Context Menu
In the Racetrack Window a local menu is available. In 2D view the menu is opened by clicking with the right
mouse button on the Racetrack Window, in 3D view by clicking with the middle mouse button or by clicking
with the left and right mouse button simultaneously. There you will find various functions: changing the
view, save, load a racetrack, changing the car shape, e.g. If you are in edit mode the local menu gives you
possibilities to save or cancel changes and other function depending on the hit of current mouse position.
Context
menu/
Load
Racetrack
You can select a segmentation/segmentations from Racetrack Window with "Context
menu/Load Racetrack" the other windows will be informed for the new selected
segmentation (for example the Oscilloscopes will show the new selected segmentation).
In the menu you will find a submenu for the car shape. You can select the size and the shape
of the car.
The Inform Window
Drag “Windows/ Worksheet controls/ Inform” from the menu into your workspace to open the Inform
Window.
The Inform window can also be opened by selecting “Inform” in Darab context menu.
Additional Windows
Page 139 of 282
Data relating to the status blocks of the recording equipment is displayed in the Inform Window. It usually
includes a number of Inform Pages with information grouped into different categories.
The number, layout and content of these pages depend on the controller you are using and how it is
configured. These pages will therefore be generated specifically for each user.
Note:
Likewise, File Explorers Preview Function displays Inform Pages when a Logged Data File has
been selected.
Note:
.ini and .dat Files are provided with the ECU software.
Open
To open the Inform Window select “Windows/ Worksheet controls/ Inform” from the menu (see above).
Additional Windows
Page 140 of 282
Note:
If more than one Logged Data File is opened choose which file should be displayed.
Start/ Inform page/ Show page
If you would like to view another Inform Page choose the desired page from the list in the Ribbon bar.
Alternatively, you can browse backward or forward through the Inform Pages using the buttons to the leftor right-hand side of the list respectively.
Start/ Edit/ Comments
Clicking on this button displays a dialog box for entering comments related to the selected file. You will also
be able to enter information into any previously defined comment fields.
All comments will be saved in the Logged Data File and displayed on the Inform Page called “Comments”.
Additional Windows
Page 141 of 282
Comment fields tab
In this tab, you can assign values to the in the Comments tab in Tools/Settings/Program defined CommentFields.
Fields that are removed from the Comment-Field-List in the Comments tab remain in the File.
The Comments in the Comment-Field-List are always shown first.
Additional Windows
Page 142 of 282
Text field tab
In every File, you have a texfield that you can edit in this tab.
Start/ Overlay
Clicking on an Item in the list displays the chosen file in the Inform Window.
Additional Windows
Page 143 of 282
Special Channels
Internal Channels
In addition to defining recorded channels WinDarab also defines its own, internal channels. Apart from
some exceptions, internal channels are treated like recorded channels.
The following table lists all internal channels and their descriptions:
Channel
Description
laptrig
1 when vehicle is passing lap trigger, otherwise 0
Mux
Row values identifier (Reader/CanCard)
Block number (CardMemory)
samples
Record Number/ Samples
Channel has a special plotting routine, plotting every record as a single dot.
xdist
Distance axis
Logged distance travelled will be standardised to accord with the course length-- if the
difference between the actually logged lap length and specified lap length is less than 5
%.
If the channel has not been recorded directly, it will be calculated using values from
rawdist and laptrig.
xtime
Time axis
lapdist
Distance travelled on the course since last lap trigger.
laptime
Time logged since last lap trigger.
rawdist
Logged distance
dbg_time
Block time stamp
(CardMemory with active debug switch only)
dbg_dist
Block distance stamp
(CardMemory with active debug switch only)
Note:
Some channels may not be available depending on the hardware you use and its
configuration.
Special Channels
Page 144 of 282
Special channels settings
WinDarab provides the user the possibility to define a list of special channels for the following categories:
Category
Description
Distance
Contains cannels or calculation methods WinDarab should use to generate
distance information. Predefined calculation methods are “Calculate using GPS”,
“Calculate using speed” and “Default distance”.
Speed
List of channels, which contain speed information. If a file contains one of the
channels in the list, it will be used in other calculation (e.g. calculation of the
distance information). Predefined channels are “vfz_w”, “vfzg” and “speed”.
GPS Horizontal (meter) List of channels, which contain horizontal GPS-coordinates containing data,
which is transformed into relative meters.
GPS Vertical (meter)
List of channels, which contain vertical GPS-coordinates containing data, which is
transformed into relative meters.
GPS Height
(meter)
List of channels containing GPS-height in meters.
GPS Longitude (Earth)
List of channels, which contain the longitude of the GPS-coordinates. The
channel “gps_long” is predefined.
GPS Latitude (Earth)
List of channels, which contain the latitude of the GPS-coordinates. The channel
“gps_lat” is predefined.
GPS Height
(Earth)
List of channels, which contain the height of the GPS-coordinates. The channel
“gps_alt” is predefined.
The user can selects special channels for each category. WinDarab uses these lists to find channels
containing needed information. If a file contains one of the channels listed it will be use for further
calculations. If a file contains more than one of the channels in the list, the user selects must select one.
Defining a special channels list
To define special channels for the categories listed above or to modify a special channels list, follow these
steps:
1.
2.
3.
4.
Use “Tools/ Settings/ Program” to open the “Options” dialog box.
Select the “Special channels” tab.
Select the category from the “Special channels for” – list.
The “Special channels” tab contains two channel lists - list of all channels in the measurement file and
list of special cannels for the selected category. To add a channel to special channels list, select the
channel from the list of all channels and click on the
“add” –button.
To delete a channel from the special channel list, select the channel from the special channel list and
click on the
“delete”-button.
Special Channels
Page 145 of 282
The channels and the calculation methods in the special channel list have a priority. The position of a
channel in the list determines its priority. The higher the position of a channel in the list, the higher the
priority. The user can change the priority of a channel or calculation method as follow:
1. Select the desired channel in the list
2. Place the channel to the desired position by using the
“up” and
“down” – buttons.
Note:
The reserved entries in a special channel list cannot be removed.
For distance generation information is valid - the calculation methods always have a higher
priority than the channels selected by the user.
If the channel provided for distance information was not sampled with each sample block, the
interpolation of the channel for each sample position was not “good” enough, if the channels
quantisation didn’t offer enough precision for the interpolated values.
The channels provided for distance generation shall be monotonically strictly increased.
Except the first two samples of the channel. In this very special case the first sample will be
extrapolated based on the values of the second and third sample. WinDarab carries out
additional checks to ensure this and shows a message, if a distance channel cannot be used.
If the distance channel isn’t strictly increasing, WinDarab interpolates the duplicate values
and saves the results to the file. This is done once when the channel is accepted as distance
channel.
If distance information is calculated by GPS (the calculation method “Calculate using GPS” is
selected) and WinDarab runs with a unit converter for the distance channel, the lap
normalization is not working in the case the user changes the current racetrack. Only in this
case the data is not normalized (but as measured!).
Special Channels
Page 146 of 282
Mathematical Channels (and Filters)
In WinDarab it is possible to define filters or new channels with the help of mathematical functions.
Win Darab provides functions and filters that will help you to solve a great number of mathematical and
analytical problems.
In a mathematical function it is possible to use comment fields — in addition to recorded
channels — to include conditions that are specific to a particular outing (outing-specific
constants). Comment fields are included in the channel selection list and marked with “C”.
Mathematical Channels
A mathematical channel calculates values based on other channels in a file. Which channels will be used is
determined by the mathematical function.
If a mathematical channel has been defined, it will be listed in the channel display area in a Logged Data
File. Much like internal channels, mathematical channels can be used (in nearly all instances) as if they
were logged data.
If new a mathematical channel is added, but another mathematical channel with the same
name already exists, the existing mathematical channel is replaced by the new one. In case of
a manual creation of the new math channel (Extras/Functions/New) a message box appears,
informing the user about the duplicated math channel name.
Mathematical Filters
Unlike a mathematical channel a filter does not require the definition of a new channel. Instead, it only
requires the definition of a mathematical function, which can be used in conjunction with any channel you
wish.
In order to define the values within a function those are to be replaced by values of a filtered channels, add
the channel “Default” as a wildcard.
The section “Additional Channel Functions” describes how to assign a filter to a channel.
A mathematical filter does not need to filter a channel necessarily. A filter can also be used to
calculate derivations and integrals.
Working with Functions
Mathematical functions can be saved in a folder in the File Explorer.
In addition to the selected folder and its contents, the lower area of this window shows a summary of the
most important information pertaining to a mathematical function.
Special Channels
Page 147 of 282
“As Default Folder“ Button
If you start the program WinDarab makes all functions saved to a specified folder available. To specify this
folder select it from the directory and click on the “As Default Folder” button.
“Sub-Folder“ Option
Activating this button makes all formulae contained in the default folder as well as those contained in the
sub-folders available.
“Make Available” Button
If you would like to make a mathematical function available you will have to do this explicitly.
This button is not active when the mathematical function has already been made available.
Report
This button enables you to create a report that contains all the settings for a mathematical function. If you
press this button, a dialog box for choosing a report template appears.
WinDarab provides one template for each language it supports.
If two functions with the same name exist WinDarab will only use the first one.
Defining a Function
To define a new mathematical function or to modify an existing one, follow these steps:
3. Use “Tools/ Mathematics/ Functions” to open the “Functions” dialog box.
4. Select the mathematical function you want to edit and click on “Modify” or “New/Function” if you
want to create a new function.
5. The dialog box “Edit Function” appears. It contains three tabs in which you can make all entries
Special Channels
Page 148 of 282
pertaining to the mathematical formula.
6. Once you have finished making your entries or modifications, click on “Save“ or “Save as”.
When a mathematical function is modified, WinDarab immediately makes a new calculation if
this function is displayed or in use in a window.
You can also create a new function by right-clicking into the Channels window and select
Math function/ New. If you right-click on a function in the Channels window, you can chose to
edit this function.
Math formulas and channels with identical name are not allowed.
If a user tries to save a math formula but at least one opened file contains a data channel with
the same name, WinDarab asks the user to select a different name for the math formula.
WinDarab shows a message, if a file contains data channels with the same name as already
defined math formulas. The data channels are not available until the user changes the name
of the math formula and reopens the file.
See also:
“Expression” Tab
“Format” Tab
“Calculation” Tab
Expression Tab
Enter the mathematical expression you want to calculate in the “Expression“ tab. In addition, it is possible
to enter a brief description that will be displayed in channel selection lists.
Special Channels
Page 149 of 282
In the “Check expression with…“ field you are able to select a file containing a list of channel names. This
enables you to access the choice of available channels by using the “Channel…“ button. WinDarab will then
test the syntax of the expression.
Selecting a Channel
Channel names should always be enclosed in braces. Alternatively, you can insert a channel in an
expression by using the “Channel…“ button:
1. Position the cursor at the point in the expression where you want to insert the channel.
2. Click on “Channel…“.
3. Select the desired channel from the list and then click on ”Selection“.
The “Default“ channel is not a channel belonging to a particular file but rather a wildcard used
in mathematical filters.
In a mathematical function it is possible to use comment fields — in addition to recorded
channels — to include conditions that are specific to a particular outing (outing-specific
constants). Comment fields are included in the channel selection list and marked with “C”.
Selecting a Function
Similar steps are involved in inserting a function or an operator into the formula:
1. Position the cursor at the point in the expression where you want to insert a function or an operator.
2. Click on “Function …”
3. Select the desired operator from the list and then click on “Select”.
Special Channels
Page 150 of 282
All functions and operators are organised in groups. You are able to limit the elements contained in the list
of functions by pre-selecting a group of functions.
If you select a function from the list, a brief description will be shown in the lower area of the window.
For further information see Appendix / Mathematical Expressions.
Format Tab
All the settings pertaining to the display of a mathematical channel are made in the “Format” tab.
Numerical Format
Make the settings for the numeric display of the channel values. You are able to choose either a “decimal”,
“hexadecimal” or “binary” format. If you choose the decimal format, you are able to specify the width of
the entry field as well as the number of decimal places.
Range of Values
Use this area to set the range of values (from - to) and the unit of measure to be used in the default
channel display.
Computing Tab
This tab is used to determine the sampling rate for calculating a mathematical function.
Special Channels
Page 151 of 282
Depending on the configuration for recording data, data is sampled at varying intervals. As a result, the
number of samples per unit of time may vary.
Depending on the meaning of the variables in a mathematical calculation, it may be necessary to vary the
sampling rate. This setting determines the quality and speed of processing.
Compute function …for every <x> th measured Sample
This setting calculates the function independent of the samples that were recorded and which belong to
channels included in the formula. Calculations are instead carried out for each <x>th sample recorded in
the file.
Compute function …for every <x> th sample of the slowest channel recorded
Before WinDarab begins the calculation, it searches for the channel with the lowest sampling rate. The
calculation is then only carried out for every <x>th sample record in this channel.
Compute function …for every <x>th sample of the fastest channel recorded
Before WinDarab begins the calculation, it searches for the channel with the highest sampling rate. The
calculation is then carried out for every <x>th sample record in this channel.
If WinDarab searches for the fastest channel it ignores standard channels such as xtime or
xdist because they are included in every block and thus would always be the fastest channels.
If you would indeed like to make a calculation for these samples, you must select the first
option (i.e. “for each <x>th sample recorded“).
Compute function with a period of <x> ms
WinDarab calculates the function at a specified minimum time interval.
WinDarab is able to perform a calculation only if sample positions are valid. As a result,
WinDarab always searches for the sample separated from the previous sample by at least the
specified value. It is therefore possible that the intervals vary – but they are always at least as
big as the specified value.
Special Channels
Page 152 of 282
Computing Example:
Assume there are two channels (v_wheel_rb and v_wheel_rf) with different sampling rates (100ms and
130ms) and you want to create a math-channel to calculate the average of these channels.
You can create a math-channel with the expression “({v_wheel_rb} + {v_wheel_rf})/2”.
The Image below shows the two channels in the upper area and the math-channel with the computingconfigurations “every sample from the fastest channel”, “every sample from the slowest channel”, “every
150ms” (from top to bottom in the bottom area).
As you can see, the blue math-channel has the same sample-points as the blue channel (fastest).
The red math-channel has the same sample-points as the red channel (slowest).
The green math-channel has its own sample-points that are not in any way linked to the included channels
sample-points.
The sample-points that are not on the channels-points are interpolated by the surrounding sample-points
of the channel. As an example, the blue math-channel uses the exact values from the blue channel and
interpolates (where the sample-points are not at the same point by a coincident) the red channel.
Filter Functions
For this section, mathematical foundations of filters are required.
WinDarab provides a lot of mathematical filters, such as:
bandpass
bandpassFIR
filter
lowpass
lowpassFIR
highpass
highpassFIR
stopband
Special Channels
Page 153 of 282
They can all be found in the function window in the category “filter functions”.
Bandpass, Lowpass, Highpass, and Stopband Functions
These Functions all have an editor, where you can insert the parameters for the function.
In the filtertype-list are up to six different filtertypes, that you can chose for your filter. Each of the filters
have individual strengths and weaknesses regarding roll-off rate or phase response
The other lists supply the parameters for the order, the frequency and the sample frequency.
Keep in mind, that the sample frequency has to be at least twice the frequency.
When all parameters are configured, you can go to the expression editor by clicking on Next.
Special Channels
Page 154 of 282
In this dialog, you have to enter the expression you want to filter. The expression can be as complex as you
require.
It is also possible to define another filter within this expression by calling up the Assistant
again.
Filter Function
The Assistants first dialog box is used to specify the expression you want to filter.
The second dialog box allows you to enter the coeffizients for the filter function.
The Assistant supports up to 20 sampling points. If your filter requires more sampling points,
you have to add these manually to the expression created by the assistant.
Special Channels
Page 155 of 282
BandpassFIR, LowpassFIR and HighpassFIR Functions
These functions don’t require an assistant. They all require as parameters the order of the filter, the
channel to filter and at least one cut-off frequency (bandpass requires two).
All other parameters like the frequency are calculated.
Lookup Tables
WinDarab allows you to define tables to map input values to a specified output-value.
Defining a Lookup Table
To define a new lookup table or to modify an existing one, follow these steps:
1. Use “Tools/ Mathematics/ Functions” to open the “Functions” dialog box.
2. Select the lookup table you want to edit and click on “Modify” or “New/Lookup Table” if you want to
create a new lookup table.
3. The lookup table dialog box appears.
4. Once you have finished making your entries or modifications, click on “Save“ or “Save as” to save the
lookup table.
Special Channels
Page 156 of 282
Lookup Table dialog
On the top of the dialog, there is the configuration-area. It allows you to set the formats of the axes and
values as well as setting the interpolation for the axes.
The interpolation property controls the behavior of the table when facing input parameters that are
between two axis values. If the interpolation is turned off, the input parameter is handled as the nearest
axis value. With interpolation turned on, the result value is calculated by interpolating over the surrounding
values.
Example:
Lets take the Table in the Picture above as an example and use the input parameters X = 0.9 and Y = 0.9;
If there was no interpolation, the return value would be 4.00, because the input parameters are
handled as X = 1.0 and Y = 1.0.
If only X were Interpolated, the return value would be 3.9, because the y parameter is handled as 1.0
and the return value is interpolated between the values 3.0 and 4.0.
If only Y were Interpolated, the return value would be 3.8, because the x parameter is handled as 1.0
and the return value is interpolated between the values 2.0 and 4.0.
If both axes were interpolated the return value would be 3.7. There is a pane built out of three
surrounding points to calculate the interpolated value.
Note:
There are 2 possible triangles – that include the target point - which can be chosen for the
interpolation pane.
On the bottom of the dialog, the description of the lookup table can be placed.
Special Channels
Page 157 of 282
On the left is the most important part of the dialog. There you can edit the values and axes of your lookup
table. You can add new rows/columns by rightclicking on an existing row/column and press add Insert
before/Insert behind. Removing a row/column works the same just by clicking remove in the appearing
context menu.
You can add as many rows/columns as you like. Note, that after removing a row/column
there has to be at least one row and two columns to work.
You can change the values of the table and the axes freely as long as they are valid decimal numbers.
The axis-values have to be strictly increasing. While editing the values, wrong numbers will be
marked red and have to be changed before the table can be saved.
On the right side is a 3D-model of your table. It can be rotated (left mouse button drag), moved (right
mouse button drag) and scaled (mouse wheel).
If there is only one row in the table, the 3D-model shows a 2D-model like in the FFT analysis
window
The 3D-Model always shows the values as if both axes were interpolated.
Note that if the axis is not interpolated, values between two axis values are interpreted as
the nearest axis value.
Using the lookup table
Lookup tables can be accessed in any math function like math channels or math filters by using the
“Lookup” function:
Lookup(<LookupTableName>; <X-Param> [; <Y-Param>])
Because the function only takes the name of the lookup table to be used, WinDarab has to
search for the lookup table in the formula folders.
WinDarab looks for the lookup table in the following sequence:
In the same folder as the math function is saved in.
In the parent folders of the math function.
Any lookup table matching the name.
The parameter count has to match the dimension of the lookup table.
Special Channels
Page 158 of 282
Lookup table example
You have a measurement sensor attached to a ADC pin of your ECU (named ADCPin). But you want to
display the physical values instead of the voltage values in WinDarab.
For this you create a lookup table “ADCPin_Characteristic” containing the characteristic curve of your
sensor. The output values will be interpolated corresponding to the input value and its neighbor
breakpoints on the x-axis.
In addition you create a math channel “ADCPin_Physical”, which converts the voltage input value to the
corresponding physical value. We only need a single input argument, because the lookup table contains a
single row only:
ADCPin_Physical =
Lookup ({ADCPin_Characteristic}; {ADCPin})
The results of the math channel would be something like this:
Input value (ADCPin)
Output value (ADXPin_Physical)
1,0
0,5
1,1
0,62
2,75
3,8
4,9
12
Math-Inspector
The Math-Inspector is a tool to show you the components of your function with their corresponding values
at the current position.
Special Channels
Page 159 of 282
Note:
The Math-Inspector shows when an error occurs. This could be a recoursion, an invalid
channelname or a used mathchannel with an error.
In these cases the valid values will be displayed anyway. Only the errors will be shown by a
warning sign and a error message.
The same channel/ constant/ function will be shown only once as a child of a function.
Open the Math-Inspector by right-clicking on a math-channel in the channels-pane and
selecting Math Inspector from the appearing menu.
Overlay
You can assign a different overlay to the math inspector by selecting it in the combobox on
top of the window.
Conditions
Conditions are used in conjunction with analysis functions in order to exclude certain data from
consideration during data analysis.
A given data point is ignored unless the condition applies — i.e. if its evaluation results in “true”. A
condition is “true” if the formula for the given data results in a value that is not equal to 0.
Special Channels
Page 160 of 282
Defining a Condition
Follow these steps to define a condition:
1. Use “Tools/ Mathematics/ Conditions” to open the “Conditions” dialog box.
2. If desired and available you can choose a condition from the “Name” list. You are able to modify this
condition or else use it as a template.
3. Enter the condition in the “Formula” field. The formula can be as complex as required and may occupy
more than one line.
4. Click on the “Save” button.
5. A small dialog box appears. Enter the name for the condition here.
6. Click on “OK”. If the name you have entered is already in use you will be asked to confirm your entry.
Click on “Cancel” to close the “Conditions” dialog box.
To facilitate the entry of formulae the dialog box contains lists with available channels and operators.
Channels
This area displays all the channels available for the selected file. You select a channel by double-clicking on
it. The channel name will then be inserted in the formula field at the current cursor position.
Below the list you will find a field from which you can choose the file the channels should be selected from.
Operators
WinDarab provides numerous operators and mathematical formulae.
Select an operator from the list with double-click. It will then be inserted into the formula at the current
cursor position.
Please consult the Appendix for more detailed information about operators and mathematical formulae.
Operators are grouped according to type. The list displays all operators belonging to the selected operator
group.
Below the list of operators you can select the operator group.
Deleting a Condition
Follow these steps to delete a condition:
Use “Tools/ Conditions” to open the “Conditions” dialog box.
Select the name of the condition you want to delete from the “Name” list.
Click on the “Delete” button.
Special Channels
Page 161 of 282
Confirm your deletion by clicking on “OK”.
Temporary Conditions
Conditions don’t have to be predefined to be used by WinDarab.
Instead of defining and selecting a condition in the analysis windows setup-dialog, you can simply type in
the condition you want to apply.
You can type in any expression that can be parsed as a condition.
Visualizing the Condition
Like a normal channel or a math channel, a condition can also be added to the oscilloscope. The values are
1 for “condition is true” or 0 for “condition is false”.
Special Channels
Page 162 of 282
Analysis
WinDarab provides a number of functions and algorithms which enable you to present and analyse data.
The following functions are accessible in the “Windows/ Worksheet controls” menu in Darab Ribbon:
(x, y)-Plot
Distribution
Histogram
FFT
Flowchart
Min/Max Table
Outing Report
Lap Analysis
Instrument panel
Selecting one of these options opens a window which displays the results of the calculation that was
performed. There is a separate dialog box for the settings.
The functions are also available from the WinDarab context menu. The WinDarab local menu can be
opened by clicking with the right mouse button on an empty area.
Analysis
Page 163 of 282
Some of these analysis functions are only available if the active Oscilloscope contains at least
one channel.
If an analysis function is opened, the recently active Oscilloscope will provide data.
Some Analysis Windows only reflect a situation at a particular moment in time. Modifications
(re-definition of functions, conditions, differences, or file alignments) will be reflected only
when a new calculation has been performed. Re-opening and re-confirming the “Settings”
dialog box accomplishes this.
You can move the Analysis Windows on your workspace by dragging the caption-bar or
change the size by dragging the borders. Double-clicking the borders increases the size until it
hits another Analysis Window. If windows are docked together you can move all borders at
once by pressing shift while dragging the border.
Pressing Shift + F4 will close the active window.
Settings in Analysis Windows
Nearly all Analysis Windows allow you to save the settings you have made for future use. Let us denote
with [Analysis Window] the name of a analysis window you are interested in (for example x-y Plot,
Distribution, Histogram, FFT, Flowchart, Min/Max Table/ Outing report or Lap analysis) then:
Load Settings
You can access pre-defined settings for analysis window by selecting “[Analysis Window] and select Start/
Settings/ Load” from the menu. It is available in the context menu of the Analysis Window too.
Analysis
Page 164 of 282
1.
2.
3.
4.
5.
Select “Start/ Settings/ Load” from the menu.
Darab Explorer will appear.
Select the desired setting from the “Files” list.
Select the desired file with settings and confirm your selection by choosing “Open”.
Your saved settings will be restored.
Press F6 to open the “Load configuration” File Explorer
You can also load a configuration by chosing a recently used configuration from the MRU
(Most Recently Used) dropdown list right to the Load-Button.
Save Settings
You can save your current settings by selecting the Analysis Window and select “Start/ Settings/ Save”
from the menu. It is available in the context menu too.
1.
2.
3.
4.
Select “Start/ Settings/ Save” from the menu.
File Explorer appears.
Select the file in which you want to save the settings or enter a name.
Confirm your selection by choosing “Save”.
Press F7 to open the “Save configuration” File Explorer
Analysis
Page 165 of 282
Common Overlays Settings
The most Analysis Windows are using common overlay settings. Therefore their setup dialog boxes contain
the same tab called Overlays Tab.
This tab is used to select Overlays and their sample range for evaluation.
Table with
Overlays
The table contains all overlays in the File Explorer Windows. The rows can contain any
lap from the overlay. You can change the order of the overlays with the Up / Down
arrows.
ASCII Export
Some Analysis Windows allow you to export their results to an ASCII file.
You will find more detailed information about this topic under the ASCII Extract heading.
The Appendix contains a format description for the ASCII file that will be created.
(x, y)-Plot
In a (x, y) graph co-ordinates are calculated for a pair of values (x, y) in two channels (x- and y-axis).
This type of function allows you to determine very quickly which (x, y) pairs occur frequently as these tend
to show up as a dense, cloud-like accumulation of dots.
In addition the (x, y)-Plot window can be used to separate the clouds in components and then for every
component the regression line can be found. Also for every component the correlation of dots inside is
found. You can also add your own (user) lines for comparison. In the next figure you can see 6 components
and 6 regression lines which correspond to 6 gears of the car. There is also one user line in blue color.
Analysis
Page 166 of 282
Open x/y plot
Drag “Start/ Worksheet controls/ x/y-Plot” into your workspace to open the (x, y)-Plot Window.
Middle Mouse Click (Left Button + Right Button)
Clicking your middle mouse button (or left + right mouse buttons) displays a local menu with
options.
Calculations
Calculations are started after changes in the settings are made, or after “Update View” from
the menu was clicked.
Because calculations can take much time especially if the range is above the whole file, they
are made inside of another thread and you will see a progress bar in this case. Instead of
waiting for them you can work in some other windows.
For online files calculations are started automatically after changing the range (new samples
have been received) and the view will be updated too. The cross will be moved to the last
drawn dot.
(x, y)-Plot Settings
A dialog box with settings appears automatically when you open the (x, y)-Plot Window for the first time.
Closing the window will save the settings. The next time the window is opened this dialog will not appear
again. Instead the saved settings will be loaded.
If you want to modify these settings or carry out a new calculation you can re-open the dialog box using the
menu item “Start/ Settings/ Edit” or by using the context menu with pressing middle mouse button or left
+ right mouse buttons.
Analysis
Page 167 of 282
You can press the F5 key to open the “Load Settings” dialog box.
How to save and load settings see: Settings in Analysis Windows.
Overlays Tab
This tab is identical to Common Overlay Settings.
Axes Tab
This tab is used to select channels for evaluation and their range for visualization and set/unset data filter.
Analysis
Page 168 of 282
Sample Condition If desired, you can activate this option and select a condition from the list. Only the
data samples that fulfil the selected condition will be used to calculate the (x, y)-Plot.
Option Tab
This tab is used to choose displayed elements and elements for calculating.
Lines or points
The dots appear on screen in some order you can see this using lines.
Calculate and show Select what you want to be calculated and shown. If you do not need lines and
components uncheck them. This will make the calculations much faster.
Colors Tab
This tab is used to select color of text, selected line/component, user lines and background of the window.
Analysis
Page 169 of 282
Working with the (x, y)-Plot Window
Basic
The results are shown as dots. Clicking on the window will show you a cross and the values of the selected
dot can be seen in the two axes.
You can zoom in an area of the window and see more details.
Zoom functions:
Press right mouse button and drag down or up. The marked area will be all x-values
and only the y-values between the y-start drag and y-end drag values.
Press right mouse button and drag left or right. The marked area will be all y-values
and only the x-values between the x-start drag and x-end drag values.
Press Shift-key and then drag a box with pressed right mouse button. The marked
area will be x-values and y-values inside of the dragged box.
Start/ Display/
Zoom in
Analysis
Zoom in. The picture will be zoomed in by a factor 2 so the cross dot will stay
unmoved.
Page 170 of 282
Context Menu/
Zoom in
Double Click left
Start/ Display/
Zoom out
Context Menu/
Zoom out
Zoom out. The picture will be zoomed out by a factor 2 so the cross dot will stay
unmoved.
Double Click right
Start/Display/
Show All
Context Menu/
Show All
All dots will be shown.
A – Key
Additional elements
There are components, regression lines, user lines and a box with the information
about the files and lines (let us call it InfoBox). They are additional to the base
picture. Additional elements can be hidden and shown from the menu or the toolbar.
Start/ Display/
ShowInfo
Context Menu/
ShowInfo
InfoBox contains information about files and user lines. Information for every file
consists from files ranges, correlation of the range and file regression lines.
Information about file lines can be shown or hidden by using +/- in front of the file
name. Every line has offset, gain and correlation.
F11
Start/ Display/
Components
Context Menu/
Components
Analysis
Components are continuous regions with approximately the same dense of dots.
Page 171 of 282
Ctrl+Space
Start/ Display
/Regression lines
Context Menu/
Regression Line
Regression lines are calculated and they depend on calculated components. For
every regression line there is a correlation.
Space
Start/ User Lines/
Insert
Context Menu/
Insert line
Adding a new user line is done by pressing Insert-key or “Insert line” from the menu.
Lines
If the mouse cursor is near a line then the equation of the line will be shown in a
small window. The information about the lines can be seen also in the InfoBox. You
can select a line by clicking near to the line or by clicking in the InfoBox on some row
with line information. If the line belongs to the component the component will be
selected too.
Start/ User Lines/
Remove (User line)
Context Menu/
Remove line
You can delete the selected line and component by pressing Del-key or “Remove”
from the menu.
Del
The inserted line is going through the (0, 0) and the cross point. A user line can be
dragged using two small rectangles on the line.
Axes
Analysis
The axes of (x, y)-Plot have their own context menus. Using it you can:
change the position of channel names or units
hide or show the channel names or units
hide or show the current values
change the style of the numbers in axis: all numbers have the same style
Page 172 of 282
Drag & Drop
You can change settings of the (x, y)-Plot by drag & drop an object from the file/channel/color toolbar. You
can drag a channel over the x or y axis. Dropping it then the corresponded channel will be replaced. If you
drag a file you can even drop it on the (x, y)-Plot then the file will be added to files for evaluations (just like
added it manually from the Overlays Tab).
Distribution
A Distributions Table displays frequency distributions of pairs of values (x, y) in (‰) for two channels (xand y-axis) or else the average value for a third channel.
In addition the Distribution window can show the results as 3D surface where z is the cell value from the
Distributions Table. The surface can be rotated, zoomed in and out.
The surface can be divided into slices with user defined planes.
Analysis
Page 173 of 282
Open a Distribution Window
Use “Start/ Worksheet Distribution” to open a Distribution Window.
Middle Mouse Click (Left Button + Right Button)
Clicking your middle mouse button (or left + right mouse buttons) displays a local menu with
options.
Calculations
Calculations are started after changes in settings or after “Local Menu/ Update View” from the menu.
Because the calculations can take much time especially if the whole file should be calculated, they are
made inside of a working thread. You will see a progress bar then. Instead of waiting you can work with
other windows.
For online files, calculations are started automatically after changing the range (new samples has been
received) and the view will be updated too.
Distribution Settings
A dialog box with settings appears automatically when you open the Distribution Window for the first time.
Closing the window will save its settings. The next time the window is opened the dialog will not appear
again, instead the saved settings will be loaded.
If you want to modify settings or carry out a new calculation, you can re-open the dialog box using the
menu item “Start/ Settings/ Edit” or by using the context menu with pressing middle mouse button or left
+ right mouse buttons.
Analysis
Page 174 of 282
You can press the F5 key to open the “Load Settings” dialog box.
How to save and load settings see: Settings in Analysis Windows.
Overlays Tab
Axes Tab
This tab is used to select channels for evaluation and their range for visualization and set/unset data filter.
There are z axis options and relative frequency parameters.
Steps
Analysis
Steps defines the division of the axis range.
Page 175 of 282
There are two possibilities to specify the division:
Count: Specify the number of steps into which you want to sub-divide the value range of
the channel.
Width: Specify the width of the individual bars. The stepcount is calculated according to
the width.
Note:
In case the range can’t be divided without a remainder. The range is extended to a range
that can be divided by the width without a remainder
Z-axis
For the Z-axis you can chose between two alternatives
Channel:
For every (x,y) – pair, the z-value of the distribution is the average of the selected channels
values fitting the (x,y) – pair.
Relative Frequency:
For every of values (x,y), the z-value of the distribution is the portion of values (in ‰)
fitting the (x,y) - pair in relation to all values in the selected range (see Files Tab).
Boundaries
If check box Auto Max is checked then the maximal z value will be equal to the maximal
value from Distribution Table else the value is written into the edit box right to it. It will be
taken as maximal z value.
If check box Auto Min is checked then the minimal z value will be equal to the minimal
value from Distribution Table else the value is written into the edit box right to it. It will be
taken as minimal z value.
Sample
Condition
If desired, you can activate this option and select a condition from the list. Only the data
samples that fulfill the selected condition will be used to calculate the distribution.
Note:
Changing relative frequency or channel will change calculated Min and Max values so it is
good to check the Surface Tab-Slices again to see if the limits are the expected ones.
Surface Tab
This tab is used to define the slices and the appearance of the surface.
Analysis
Page 176 of 282
Slices
A slice is a row with color and limit and it is the part of a surface between planes z = PrevLimit
and z = Limit. PrevLimit is the Limit of previous row or minimum. If relative to maximum is
checked then limits are displayed in percent and the last row has the limit 100 and cannot be
changed. 100% corresponds to the defined Z-axis maximum and 0% corresponds to the Z-axis
minimum. If relative to maximum is not checked then the limits are supposed to be absolute
values.
You can insert a new slice with the
button. A new row will appear above the pressed
button with limit between the two neighbor limits.
You can delete a row with making it current and then pressing
Options
button.
You can change the appearance of the surface (you can do this by using the menu or tool bar
too):
3D-Grid: the surface is made from 3D quadrangles and you can see their borders
switching this option on.
Height lines: switching this option on you will see the intersection lines between the
surface and planes of slices.
Solid slices: switching this option on you will see every slice in only one color.
3D-vertices: switching this option on you will see the dots that correspond to the
Distribution Table cells.
Perspective: switches to perspective 3d view.
Notes:
Do not forget to check limits after changes in Axes Tab relative frequency and relative to
maximum is not checked.
Colors Tab
This tab is used to choose the colors of axes-grid, background, grid-points, height lines, selected point,
surface-grid and text.
Analysis
Page 177 of 282
Working with the Distribution Window
The results are shown in Distribution Table in 2D view or as a surface in 3D
view where Z is the cell value from the Distributions Table.
Start/ Display/ 2D View
Ctrl+2
Start/ Display/ 3D View
2D view
In Distribution Table in 2D view every row has at the right side the sum of all
cells in the according row and every column has at bottom the sum of all cells
in the according column.
3D view
In 3D view you can rotate the 3D surface using the keys: Left, Up, Right, Down
Ctrl+3
Moving the mouse wheel with/without SHIFT key will rotate the 3D surface
horizontally/vertically. You can rotate the 3D surface with just dragging the
mouse cursor over the window in different directions.
Start/ Display/ 3D
Navigator
3D view contains 3D navigator. You can use it for rotation too by pressing on
arrows. Using the menu 3D navigator can be shown, hidden or shown only
when the window is active.
By pressing on the button instead of selecting an item from the list, you
change the perspective to a 30 degree perspective.
Analysis
Page 178 of 282
Start/ Display/ Birds view
Pressing this buttons changes the perspective of the 3D-View to a top-down
perspective.
When changing to the Birds view, the perspective view is disabled
automatically.
Zoom functions
Use menu, toolbar, “+” on 3D navigator or double click with left mouse button
to zoom in.
Ctrl+Up
Use menu, toolbar, “-“ on 3D navigator or double click with right mouse
button to zoom out.
Ctrl+Down
Distribution/ Show All
Surface will be moved to its default position by Show All.
A
Additional functions
Context Menu/ Update At any time you can recreate 3D surface using Update View.
View
Start/ Display/3D
vertices
You can see the table cells as 3D-vertices.
Ctrl+V
Start/ Display/ Solid
slices
Surface can be shown in slices (different solid colors between the height lines).
Ctrl+S
Analysis
Page 179 of 282
Start/ Display/ Grid
The 3D-grid on the surface can be shown or hidden.
Ctrl + G
Start/ Display/ Grid
Height lines are the intersection between the user-defined planes and the
surface and you can show or hide them.
Ctrl + G
Start/ Display/
Perspective
If you desire you can switch to perspective 3D view.
Ctrl + P
Drag & Drop
You can change settings of the Distribution by drag & drop an object from the channel toolbar. You can
drag a channel over the x or y axis (in both 2D and 3D axes) and if you drop it then the corresponded
channel will be replaced.
Copy to clipboard
Select Context Menu/ Copy to copy the Distribution to clipboard. Plain text and rich text formats are
supported.
Press Ctrl + C to copy the Distribution to clipboard. Plain text and rich text formats are
supported.
Histogram
A histogram shows the relative frequency distributions of channel values in percentages. Because
histograms can use a channel from a number of different files, they enable you to make direct
comparisons.
Analysis
Page 180 of 282
In addition the Histogram window can show the results as lines.
Histogram window can also show the results as 3D bars. The 3D Bars can be rotated, zoomed in and
zoomed out. 2D bars and 3D bars can be selected and you can see the percentage of the selected bars.
Open a Histogram Window
To open a Histogram Window select “Start/ Windows/ Worksheet/ Histogram” and drag it into your
workspace.
Analysis
Page 181 of 282
Middle Mouse Click (Left Button + Right Button)
Clicking your middle mouse button (or left + right mouse button) displays a local menu with options.
Calculations
Calculations are started after changes in settings were made.
Because the calculations can take much time especially if the range is above whole file, they
are made inside of a working thread and you will see a progress bar in this case. Instead of
waiting you can work with some other window.
For online files, calculations are started automatically after change in the range (new samples
have been received) and the view will be updated.
Histogram Settings
A dialog box with settings appears automatically when you open the Histogram Window for the first time.
Closing the window will save the settings and the next time the window is opened the dialog will not
appear instead the saved settings will be loaded.
If you want to modify settings or carry out a new calculation, you can re-open the dialog box using the
menu item “Start/ Settings/ Edit” or by using the context menu by pressing middle mouse button or left +
right mouse buttons.
You can press the F5 key to open the “Load Settings” dialog box.
How to save and load settings see: Settings in Analysis.
Overlays Tab
This Tab is used to Select the visible overlays as well as the range in which the histogram is calculated.
Analysis
Page 182 of 282
Axes Tab
This tab is used to select channel/channels for evaluation and set / unset data file
Channel/Channels
Specify the channel you want to evaluate. You can select several channels which
has similar meaning. If you open the list box of the popup control of a channel and
hold shift or ctrl key then you can select several channels.
If you select several channels then they should have approximately the same range
(in histogram this is x-range).
If the selected channels have the names with the same prefix then the histogram
will show the common prefix of channels as a name for the x-axis.
Analysis
Page 183 of 282
Steps
Steps defines the division of the histogram range.
There are two possibilities to specify the division:
Count: Specify the number of steps into which you want to sub-divide the value
range of the channel.
Width: Specify the width of the individual bars. The Stepcount is calculated
according to the width.
Note:
In case the range can’t be divided without a remainder. The range is extended to a
range that can be divided by the width without a remainder
Include upper value
in last step
The histogram usually calculates the steps with
lower boundary <= values < upper boundary
This option includes the upper boundary in the last step of the histogram.
Use centered steps
Use this option when you don’t want specific boundaries, but specific values to
analyze.
Use this option for example for a gear analysis or if you want to analyze the
revolution speed around defined values.
Note:
If you select centered steps, the value-range is extended automatically so that the
minimum x value is the center of the first step. Also the last step is extended by a
half step (if you are using steps) or until the range can be divided by the width
without a remainder (if you are using width).
Weighted by
Choose how the samples should be weighted.
Samples: values count once
Time: weighting according to the time intervals between samples
Distance: weighting according to the distance covered between samples
Sample Condition
If desired, you can activate this option and select a condition from the list. Only the
data samples that fulfill the selected condition will be used to calculate the
histogram.
Axis Y
Specify the visible range for the y axis. The default value for minimum y is 0. The
default (automatically calculated) value for maximum y is the maximum value of a
bar.
Option Tab
This tab is used to select or not the perspective geometry. This option can be changed from the menu and
tool bar.
Colors Tab
This tab is used to choose the colors of axes-grid, background and text.
Analysis
Page 184 of 282
Working with the Histogram Window
Results can be shown in different views: 2d view as bars, 2d view as lines and 3d view. It is possible to zoom
inside of all views and it is possible to select bars or lines.
2D view as bars
Start/ Display/2D
view as bars
The feature of 2D view as bars is the possibility of multi-selection of bars and
showing their sum for different files (% column in table above the bars).
Ctrl+2
How to select/unselect bars see Selecting/Unselecting Bars.
You can zoom in to see more details from the results. See also: 2D Zooming.
2D view as lines
Start/ Display/2D
view as lines
Clicking on 2D view as lines will show you a cross in the same x-position as the
mouse position, but the y-position will depend on the value in this x-position.
Ctrl+L
You can zoom in to see more details from the results. See also: 2D Zooming.
In 2D lines view you have one selected line. In the beginning it is the line of the first file. You can select a
new current line by clicking near it.
Analysis
Page 185 of 282
If you drag with the mouse on the screen (or just click) then a cross appear which follows the mouse with
its vertical line and follows the current line y-value with its horizontal line.
If you move the mouse near a line then a small yellow window with the value of the line in this point
appears.
3D view
Start/ Display/3D view
In 3D view you can rotate the 3D bars using the keys: Left, Up, Right, Down.
Ctrl+3
Moving the mouse wheel with/without SHIFT key will rotate the 3D bars
horizontally/vertically. You can rotate the 3D bars with just dragging the
mouse cursor over the window in different directions.
Start/ Display/ 3D
Navigator
3D view contains 3D navigator. You can use it for rotation too by pressing on
arrows. Using the menu 3D navigator can be shown, hidden or shown only
when the window is active.
By pressing on the button instead of selecting an item from the list, you
change the perspective to a 30 degree perspective.
Start/ Display/ Birds view
Pressing this buttons changes the perspective of the 3D-View to a top-down
perspective.
When changing to the Birds view, the perspective view is disabled
automatically.
Start/ Display/
Perspective
If you desire you can switch to perspective 3D view.
Ctrl + P
You can also zoom the view with Zoom functions.
2D Zooming
You can zoom an area of the window to see more details.
Press right mouse button and drag down or up. The marked area will be all x-values and only the yvalues between the y-start drag and y-end drag values.
Press right mouse button and drag left or right. The marked area will be all y-values and only the x-
Analysis
Page 186 of 282
values between the x-start drag and x-end drag values.
Press SHIFT-key and then drag a box with pressed right mouse button. The marked area will be x-values
and y-values inside of the dragged box.
You can also zoom the view with Zoom functions.
Zoom functions
Ctrl + Up
Ctrl + Down
Histogram/ Show
All
Zoom in. In 3D view you can use also “+” on 3D navigator. In both 2D and 3D views
you can double click with left mouse button.
Zoom out. In 3D view you can use also “-“ on 3D navigator. In both 2D and 3D views
you can double click with right mouse button.
Show All. In 3d view the scene will be moved to the default position. In 2D view the
whole bars will be shown.
A
Multi-channel mode
The main difference between one-channel mode and multichannel mode is the colors of the bars. In onechannel mode the bar has the color of its file. To distinguish the different channels from one file you can
change the color of bars from one channel.
You can change the color directly by opening the context-menu over a bar for 2d bars and 3d bars mode.
For the line mode you can change the color of a line by opening the context-menu near a line. You also can
change a color from a color legend in right up corner of the 2d views (as 2d bars and 2d lines).
Analysis
Page 187 of 282
Selecting/Unselecting Bars
Press on a bar and you will select it. If you already have selected bars then pressing on a bar will unselect
others. Hold CTRL-key if you do not want to unselect others selected bars when selecting new one. If you
want to select a range:
1. select a bar
2. press and hold Shift- key and press on another bar
3. bars between will be selected
The last selected bar is remembered and if you hold SHIFT-key and press on another bar then
you will select the range between them.
Click on empty space to unselect all bars.
The selected bars are not cleared if you switch between views.
Drag & Drop
You can change settings of the Distribution by dragging and dropping an object from the file/channel/color
toolbar. You can drag a channel over the x or y axis (in both 2D and 3D axes) and if you drop it then the
corresponded channel will be replaced. If you drag a file you can drop it on the Distribution then the file
will be added to these files for evaluations (just like added it manually from the Files Tab), but if you drop it
over a row in the files table then the file in the row will be replaced with the dragged one.
FFT
Use this function if you want to approximate a channel’s signal curve using a Fourier Series. The resulting
coefficient values will be displayed in a diagram. This diagram can show the results as lines, 2D-bars and
3D-bars.
Analysis
Page 188 of 282
The line-view shows all selected channels as lines in the diagram.
The 2D-bar-view shows the channels values for every step. For every step, the bars of the selected channels
are shown next to each other.
The 3D-bar-view shows all selected channels as different layers in the 3D-bar-diagram.
Analysis
Page 189 of 282
The 3D-view can be rotated, zoomed in and out.
Open the “Fast Fourier Transform” Window
Drag the menu item “Start/ Windows/ Worksheet controls/ Fourier transformation” into your workspace
to open the “Fast Fourier Transform” Window.
Middle Mouse Click (Left Button + Right Button)
Clicking your middle mouse button (or left + right mouse buttons) displays a local menu with options.
For online files, calculations are started automatically after change in range (new samples
have been received) and the view will be updated.
FFT Settings
A dialog box with settings appears automatically when you open the FFT Window for the first time. Closing
the window will save its settings and the next time the window is opened the dialog will not appear instead
the saved settings will be loaded.
If you want to modify settings or carry out a new calculation, you can re-open the dialog box using the
menu item “Start/ Settings/ Edit” or by using the context menu with pressing middle mouse button or left
+ right mouse buttons.
Analysis
Page 190 of 282
You can press the F5 key to open the “Load Settings” dialog box.
How to save and load settings see: Settings in Analysis.
Input Tab
This Tab is used to select the input variables for the Fast Fourier Transformation.
Overlays &
Channels to
evaluate
Use the “Add” and “Remove” Button to manage the channels that are calculated. In the
table, you can alter the overlay, the channel and the color in which the channel is
displayed.
Data source
You can configure the fft input parameters in this section. Chose an input range between
a time interval, the current lap, the whole file, a segment, and the marked, tagged and
visible range. You can also add a condition to filter the values used in the fft.
FFT options
In this section, you can select the data sampling frequency and the window type.
Data sampling frequency: Frequency which is used for calculation of FFT.
FFT window type: Select the approximation technique you want the Fourier Transform to
use:
Analysis
Hamming Window
Hanning Window
Rectangular Window
Blackman Window
Page 191 of 282
Note:
The sampling frequency should be at least twice the maximum frequency to provide
reasonable results.
Diagram configuration Tab
This tab is used to set different parameters for the appearance of the diagram.
X-axis
Frequency: Chose the shown frequency range.
Frequency steps: Select a number of steps shown in the FFT window or let it be calculated
Auto (reduce FFT result): The step-count is calculated by Darab
All (full FFT result): Use this option show all calculated FFT results
User defined: Chose the number of steps yourself
Data Window: Select the approximation technique you want the Fourier Transform to use:
Hamming Window
Hanning Window
Rectangular Window
Blackman Window
Note:
The maximum frequency should be at most be half the sampling frequency to provide
reasonable results.
Y-axis
FFT Type: Select the values / coefficients you want to display:
Power Spectrum
Analysis
Page 192 of 282
Phase
Amplitude
Scale: Set the desired Min and Max values or set them to Auto Max/Min. With that option
set, the Min or Max will be calculated.
Working with the FFT Window
Start/ Display / 2D view
as bars
2D view as bars
The feature of 2D view as bars has the possibility of multi-selection of bars
and showing their sum for different files (% column in table above the bars).
Ctrl + B
Press on a bar and you will select it. If you already have selected bars then
pressing on the bar will unselect others. Hold CTRL-key if you do not want to
unselect others selected bars when selecting new one. If you want to select a
range:
1. select a bar
2. press and hold Shift- key and press on another bar
3. bars between will be selected
Click on empty space to unselect all bars.
You can zoom in this window to see more details from the results (see FFT 2D
Zooming).
If you have more than one channel shown in the window, the bars are
alternated.
Start/ Display/2D view as
lines
2D view as lines
Clicking on 2D view as lines will show you a cross in the same x-position as the
mouse position, but the y-position will depend on the value in this x-position.
Ctrl+2
You can zoom this window to see more details from the results (see FFT 2D
Zooming).
If you drag with the mouse on the screen (or just click) then a cross appear
which follows the mouse with its vertical line and follows the line y-value with
its horizontal line.
If you move the mouse near a line then a small yellow window with the value
of the line at this point will appear.
Start/ Display/3D view
3D view as bars
In 3D view you can rotate the bars using the keys: Left, Up, Right, Down.
Analysis
Page 193 of 282
Ctrl+3
Moving the mouse wheel with/without Shift- key will rotate the 3D surface
horizontally/vertically. You can rotate the 3D surface with just dragging the
mouse cursor over the window in different directions.
Start/ Display/ 3D
Navigator
3D view contains 3D navigator. You can use it for rotation too by pressing on
arrows. Using the menu 3D navigator can be shown, hidden or shown only
when the window is active.
By pressing on the button instead of selecting an item from the list, you
change the perspective to a 30 degree perspective.
Start/ Display/ Birds view
Pressing this buttons changes the perspective of the 3D-View to a top-down
perspective.
When changing to the Birds view, the perspective view is disabled
automatically.
Start/ Display /
Perspective
If you desire you can switch to perspective 3D view.
Ctrl + P
FFT 2D Zooming
You can zoom an area of the window and see more details. Zoom functions:
Press right mouse button and drag down or up. The marked area will be all x-values and only the yvalues between the y-start drag and y-end drag values.
Press right mouse button and drag left or right. The marked area will be all y-values and only the xvalues between the x-start drag and x-end drag values.
Press Shift- key and then drag a box with pressed right mouse button. The marked area will be x-values
and y-values inside of the dragged box.
Double click with the right mouse button to zoom out.
Double click with the left mouse button to zoom in.
FFT 3D Zooming
Zoom in. You can use also “+” on 3D navigator. You can also double click with left
mouse button.
Analysis
Page 194 of 282
Ctrl + Up
Ctrl + Down
Zoom out. You can use also “-“ on 3D navigator. You can also double click with
right mouse button.
Flowchart
A Flowchart is a powerful tool with which you can filter and analyse data. For example you can make left
curves as red segments and right curves as blue segments on a racetrack like below.
In flowcharts you have flow-objects like compare, formula, range, print value in table or value,
insert/delete segment in a racetrack and others. The flow-objects have parameters: constants, user defined
variables or channels. In the picture below the color is a user defined variable which holds the current
segment color, f_ay1 is a channel.
Analysis
Page 195 of 282
Open the Flowchart Window
To open a Flowchart Window select “Windows/ Worksheet controls/ Flowchart” and drag it into your
Workspace.
Flowchart Settings
A dialog box with settings appears automatically when you open the Flowchart Window for the first time.
Closing the window will save the settings. The next time the window is opened the dialog will not appear
instead the saved settings will be loaded.
If you want to modify settings or carry out a new calculation, you can re-open the dialog box using the
menu item “Start/ Settings/ Edit” or by using the context menu with pressing middle mouse button or left
+ right mouse buttons.
You can press the F5 key to open the “Load Settings” dialog box.
Flowchart has flow-objects and most of them have parameters and Setup dialogs. If there is
an active flow-object (it has a red frame) then calling “Setting” will open its Setup dialog. Click
on an empty space on the flow page and then call “Settings”.
How to save and load settings see: Settings in Analysis.
Setup Dialog Box
This dialog box is similar to Common Overlays Settings, but because only one overlay is used instead of a
table with overlays there is a list box to choose only one overlay. There is also a additional edit box to
change the name of current page of the flow register.
Analysis
Page 196 of 282
Flowchart Pages
There is one output page where the results of calculation are shown and one or more design pages. Design
page can represent a flowchart or a part of a flowchart called container. During editing you can:
Start/ Pages/ New flow
add a new Design Page.
Start/ Pages/ Delete
flow
delete current Design Page.
Start/ Pages/ Close
container
If the Design Page represent a container then you cannot delete it, but you
can close it. Closing means the objects from Design Page get invisible.
Elements of Output Page
This page contains analysed or filtered results, calculated during flows run. The result can be a simple
value, multiple values organized as a table or segments in a racetrack.
Output Table
Insert/Table
During calculations you can print different values in cells of the Output table.
Context
Menu/
Settings
F5
If the object is active (with red frame), you can open and modify its settings. You can
open the “Output Table” dialog box using the context menu by pressing right mouse
button.
Analysis
Page 197 of 282
A column in the Output Table is a row in the Column Definition Table in the setup.
A row in the Column Definition Table contains the Name and the Type of the column. If
the column is a number then you also can choose the length and the decimals of the
number. You can change the order of columns with Up / Down arrows.
A new row is added if you make the last empty row current and enter a name. A new
empty row will be added after insertion.
If you want to delete a row then make the row current and then press the delete
button.
You can choose two columns from defined ones for zooming a range in bounded
Oscilloscope on double click defined by two time values (Start and End) or you can
choose to move the position of the bounded Oscilloscope to a time value (Start) on
double click on a row.
For example: in the picture above if you double click on the value of time column then
Oscilloscope position will be moved to this time and there speed will be equal to Max
column value.
Analysis
Page 198 of 282
You can sort the results of the table by a click on the column of the table. By default
after calculations the results are sorted by the column chosen in the field Start (In our
example it is Time column). If you click on other column results will be resorted and the
new sort column will be remembered and after next calculations will be used to sort
the results. If there are several results with the same value for current sort column
then they will be sorted by the values of column in Start field.
Into the table cannot be inserted more than 10000 rows. If there are already 10000
rows, the new rows will be ignored.
Output Value
Insert/Value
During calculations you can print a value in Output Value, and after the calculation
you can analyse it.
Context Menu/
Settings
F5 or Double Click
If, the object is active (with red frame), you can open and modify its settings. You can
open the dialog box using the context menu with pressing right mouse button.
If you select the check box “Value is a time value” this means that the printed value is
a time and with double clicking on it the bounded Oscilloscope will go on this time
position.
Output Racetrack
Insert/Racetrack
Analysis
During calculations you can insert segment, delete segments or delete all segments in
an Output Racetrack.
Page 199 of 282
Local Menu/
Settings
If, the object is active (with red frame), you can open and modify its settings. You can
open the dialog box using the context menu with pressing right mouse button.
F5
The setup of Output Racetrack contains only the name of the object and number of
segmentations of the racetrack. See also: Racetrack Dialog.Racetrack Dialog
Elements of Design page
Flow objects
There are compare, condition, container, exit, formula, join, next sample, range select case, print in table,
print in value and segmentation in racetrack.
Variables
You need variables to store values, for example the flow-object formula needs variable to store the
calculated result.
Variables From most setups of flow object it is possible to open the table with all user defined variables.
Analysis
Page 200 of 282
A table row contains a variable and its value.
A new row is added if you make the last empty row current and write variable name. A new
empty row will be added after insertion.
Delete
If you want to delete a row then make the row current and then press the delete button.
Parameters
While working with flow-object you can use constant-numbers (1, 2, 5.6 …), constant-strings
(“This is a string”), channels and variables. We will call parameter any of these objects.
Start
It is used as a start object of a flow. It has no settings. You cannot insert or delete it.
Compare
Insert/Compare It is used to compare 2 parameters.
The red arrow means the comparison is false; the green one means it is true.
Tip:
If you move the mouse cursor over them a small window appears with their meaning.
Settings
Analysis
If the object is active (with red frame), you can open and modify its settings. You can
Page 201 of 282
open the dialog box using the context menu with pressing right mouse button.
F5
Condition
Insert/Condition You can use any earlier created condition.
The red arrow means the comparison is false; the green one means it is true.
Tip:
If you move the mouse cursor over them a small window appears with their meaning.
Settings
If the object is active (with red frame), you can open and modify its settings. You can
open the dialog box using the context menu with pressing right mouse button.
F5
You can build the condition using a dialog with the available functions and a dialog with
the available channels (buttons Function… and Channel…). See also: Defining a
Condition.
Container
Insert/Container If you want to use a block of objects several times you can create a container and then
Analysis
Page 202 of 282
use it as a single object.
Settings
If the object is active (with red frame), you can open and modify its settings. You can
open the dialog box using the context menu with pressing right mouse button.
F5
Tip:
Double clicking on the container will open a new page with the content of the
container. To open setup of the container press F5 or use the menu
An example of a container:
Where “Speed is bigger “ and “Speed is smaller“ are exits of the container.
See also: Exit.
Tip:
The green arrows of the container are the exits, if you move the mouse cursor over them a
small window appears with the name of the exit.
Analysis
Page 203 of 282
Exit
Insert/Exit
It is used to exit the current container and return to its parent.
See also: Container.
Settings
F5
If the object is active (with red frame), you can open and modify its settings. You can open
the dialog box using the context menu with pressing right mouse button.
Tip:
Double clicking on the container will open a new page with the content of the container. To
open setup of the container press F5 or use the menu
Formula
Insert/Formula You can calculate a formula for the current sample like mathematical functions; the result
is remembered into a variable.
See also: Mathematical Channels and Filters and Container
Settings
If the object is active (with red frame), you can open and modify its settings. You can
open the dialog box using the context menu with pressing right mouse button.
F5
Analysis
Page 204 of 282
Or you can calculate the Ave, Min, Max, Sum of a formula for every sample in a range by
selecting Ave, Min, Max or Sum from "Calculate formula for:". The range is between two
parameters ("from", "to").
You can build the formula using a dialog with the available functions and a dialog with
the available channels (buttons Function… and Channel…). See also: Defining a Function.
Join
Insert/Join Join has no settings. It is used to collect several links and from it can start several links too.
Next sample
Insert/Next sample Next sample has no settings. It will increase the current sample.
Range
Insert/Range
Range is used to check if a parameter is between two limits. A limit can be constant or a
variable.
The red arrow means out of range, the green one means it is inside.
Analysis
Page 205 of 282
Tip:
If you move the mouse cursor over them a small info window appears.
Settings
F5
If the object is active (with red frame), you can open and modify its settings. You can open
the dialog box using the context menu by pressing right mouse button.
Select case
Insert/Select
case
The select case allows selection among multiple comparisons, depending on the select
parameter.
Settings
If the object is active (with red frame), you can open and modify its settings. You can open
the dialog box using the context menu with pressing right mouse button.
F5
A table row contains a case. You can change the order of cases with Up / Down arrows.
Checking of cases starts from the first one and continues down until some comparison
succeeds.
A new row is added if you click the last empty row and select an operator or enter a
Analysis
Page 206 of 282
value. A new empty row will be added after insertion.
Delete
If you want to delete a row then select the desired row and press the delete button.
Print in table
Insert/Print
in table
Use Print in table to define in which Output Table and which cell of the table you want to
print. The Print in table has the name of its Output Table.
Settings
F5
If the object is active (with red frame), you can open and modify its settings. You can open
the dialog box using the context menu with pressing right mouse button.
A setup-table row contains a column from Output table and the value you want to print
there. You can change the order of rows with Up / Down arrows.
A new row is added if you select the last empty row and then select a column name and
parameter. A new empty row will be added after insertion.
Delete
Select the desired row you want to delete and then press the delete button.
"Output row" is used to find the row in which to print. If "New row" is checked then a new
row is inserted into the Output Table. If you want you can save the row in some variable
for later use.
If you check "Existing row" the row is the value from a variable specified below. See also:
Output Table.
Print in value
Insert/Print in
value
Use Print in value to define in which Output Value you want to print. The Print in value
has the name of its Output Value.
See also: Output Value.
Analysis
Page 207 of 282
Settings
If the object is active (with red frame), you can open and modify its settings. You can
open the dialog box using the context menu with pressing right mouse button.
F5
Segmentation in racetrack
Insert/Segmentation in
racetrack
Use Segmentation in racetrack to define which Output Racetrack you want to
modify. The Segmentation in racetrack has the name of its Output Racetrack.
Settings
If the object is active (with red frame), you can open and modify its settings.
You can open the dialog box using the context menu with pressing right mouse
button.
F5
You can select action:
clear all segments (Insert segment will not be available)
Insert a new segment with a specified color. The inserted segment can be at
current lap position (current sample).
any value saved in a variable.
See also: Output Racetrack.
Analysis
Page 208 of 282
Links
The objects in design pages are connected with links.
See also: Connecting objects with links in design pages.
Working with the Flowchart Window
Bases
There are Edit and Auto Run modes for the flow window.
Edit mode
Start/
Settings/
Design
In edit mode you can insert, delete, copy, paste objects or links. It is available at the
toolbar window under the menu item "Start/ Pages/New Flow".
Run mode
Start/ Tools/
Replay
"Run mode" will switch "edit mode" off and all flows will be executed; one after another
using the order of pages. In this mode there are several cases in which calculation will
start again automatically:
The sample range has changed (moving in bounded measure window, online files).
Settings have changed (after OK of setup dialog or after loading).
In "Run mode" you can move, rearrange objects and change links, but it is not allowed to
make changes in the logic of the flow.
"Edit mode" will stop current execution (see also Executing the flows) and "Run mode"
will be switched off. This means that you will not have any updated results in output
objects until you switch on "Run mode" mode again.
Active object
Active object
Clicking on object will make it active. The active object has a red frame.
Settings
F5
Analysis
You can open and modify the active object settings. Open the dialog box using the
context menu with pressing the right mouse button.
Page 209 of 282
Only one object can be active at one time but you can mark several objects.
Selected
objects
Selected objects
Hold Ctrl- key down and click on objects you want to mark. The last clicked object will be
also active object. You can mark objects also by dragging a rectangle on the page with left
mouse button. All objects that are inside the rectangle will be selected. The selected
objects have a blue frame.
If two objects from a design page are selected then the links between them are also
highlighted.
Inserting, deleting objects
Flow objects- Design page
Insert
You can insert an object in Output or Design page using the menu
Start/Flow objects. Drag an Item into your Flow chart to use it. The context
menu is opened with the right mouse click. From the menu select the item
“Insert” and then select an object.
The toolbars are only available in edit mode.
Delete
Delete marked objects
The marked objects (all with blue frame) will be deleted. The links between
marked objects will be deleted too.
If you press a button with flow object on the toolbar you enter the insert
mode for the object. In insert mode every click on the page will be inserting
an object. Only if the click is not associated with other actions with bigger
priority (move, resize, connect-click on connectors of an object).
Switch off insert object
mode
Press the arrow on the toolbar to switch off the insert mode.
Moving, copying, pasting
If there are marked objects you can move them. Moving one of the marked objects will move
all others too. The relative arrangement between them will stay. Only the links which connect
marked object with not marked one will be changed during the movement. You can use the
keys Up, Down, Right, Left to move the selected objects also.
Copy
Analysis
Will copy all marked objects (and their links if any) to clipboard.
Page 210 of 282
Paste
If clipboard is not empty you can paste the objects (and their links if any) from the clipboard.
You cannot paste output objects to design page and vice versa, but you can copy objects from
one design page and then paste them in another design page.
Resizing objects
If only a part of the name of an object is visible you can resize the object for the best fit. First make the
object active and then if the mouse is near the frame of the object, you will see the resize mouse cursor
and then you can resize it.
Connectors of an object
Every object in design pages has one input and/or one or several outputs. They are used
to define the direction of execution. The object "Start" has no input connector.
In-Connector
If the link which enters the connector is active then the object will start working.
Out Connector
(True)
If this output is found as the results of the calculation of an object then the link which
starts from with will be activated. In compare, condition and range this connector is
chosen if the result is true.
Out-Connector
(False)
In compare, condition and range this connector is chosen if the result is false.
Connecting objects with links in design pages
You can connect objects with links. A link is created if you drag from output connector to
input connector (or vice versa) with left mouse button down. The line will follow the mouse
cursor.
If the mouse cursor is over a connector it’s getting lighter. You can start a link when it is in
edit mode and the connector is lighter. You can finish the link if the end connector is lighter.
If the mouse cursor is over an output connector and you press right mouse button (content
menu will appear) and select an object from "Insert" item of the content menu then the input
connector of inserted object will be connected with the output connector.
Editing links
Clicking on a link will make it active. Then you can change the link with moving some parts (sub lines) of it
left, right, top or bottom.
Analysis
Page 211 of 282
Executing the flows
State of a flow
The state of the flow is defined by current sample and working object or active link.
Working
In any time of execution there is only one working object or active link. The working object can use the
current sample with some channel and/or information saved in variables and can save result in a variable
or print it in output object. Depending on the result the working object will select an active link. The task of
active link is to select next working object and so on.
If the working object cannot select a new active link then the current sample will be increased
automatically and the last active link will be activated.
For example you have a compare object with an input link, output link if comparison is true and no link if
the comparison is false.
Then the input link will make the object working and suppose that the MaxValue >= speed for current
sample. Then there is no link right to continue and then the current sample will be increased automatically
and the input link will be activated again. The result of this is: the output link will be reached when a
sample for which the speed is bigger as the MaxValue appears.
The equivalent scheme is
Analysis
Page 212 of 282
You should be careful when using no link feature. If it is used wrong then unexpected results
are possible.
Iteration
The execution of a flow for a single sample is a iteration. You can go to the next iteration simply by going to
the "NEXT" object. See also: Next sample.
Because the calculations can take much time especially if the range is about the whole file,
they are made inside of a working thread. Pause and Stop button are enabled. Instead of
waiting for them you can work with some other windows.
For online files, calculations are started automatically after a change in the range is made
(new samples have been received) or the output page will be updated.
Errors
Invalid entry
Before running a flow the application prepares some elements of the flow. For example locking used
channels. If there is an element which cannot be prepared from the application (for example channel name
which is not in current file) then a message appears and the setup of the element will be opened and the
wrong parameter will have a light red background. The calculation will not start.
Analysis
Page 213 of 282
Endless loop
During execution of a flow the application checks if there is a progress of execution. Usually if the flow
stays more than some time executing one sample then it is supposed that there is an endless loop and the
calculation will stop. The supposed endless loop will be shown to the user.
Table Min/Max
A Min/Ave/Max Table enables you to determine the minimum, average and maximum values for every lap
and the whole file for selected channels. The results are shown in a table.
Analysis
Page 214 of 282
Open a Table Min/Max Window
To open a Table Min/Max Window select “Windows/ Worksheet controls / Min/Max-Table” and drag it
into your workspace.
Min/Max Table Settings
A dialog box with settings appears automatically when you open the Min/Ave/Max Window for the first
time. Closing the window will save its settings and the next time the window is opened the dialog will not
appear again. Instead the saved settings will be loaded.
If you want to modify the settings or carry out a new calculation, you can re-open the dialog box using the
menu item “Start/ Settings/ Edit” or by using the context menu with pressing middle mouse button or left
+ right mouse buttons.
You can press the F5 key to open the “Load Settings” dialog box.
How to save and load settings see: Settings in Analysis.
Overlays Tab
This tab is used to select files for evaluation and it is similar to Common Overlays Settings. The only
Analysis
Page 215 of 282
difference is that there is no range available to be selected because the min, ave and max are calculated for
the whole overlays.
Add Channels Tab
This tab is used to select channels for evaluation.
Available
channels
This list box shows all channels of the selected file.
Selected
channels
This list box contains channels for evaluation. Select a channel from "Available channels"
and press enter or the right arrow button to copy it to selected channels.
If there is a selected channel in the list box - "Available channels" then with Enter –key the
channel will be moved to "Selected channels". Pressing the Enter – key for the second
time will close the setup dialog.
Left/ Right
arrows
Analysis
Remove or add a channel to the selected channels list box.
Page 216 of 282
Up/ Down
arrows
If wish you can reorder the selected channels.
Results Window
This window displays the results of all min/ave/max calculations carried out for the selected file in the
Oscilloscope.
When you carry out a new calculation for a new channel, the results for the other channels remain
unchanged.
Emphasized (yellow background and bold font) values are absolute values (Min/Ave/Max) for channels.
Because the calculations can take much time they are made inside of a working thread. You
will see "…" in uncalculated cells and a flashing channel name for currently calculating
channels. Instead of waiting for them you can work with some other windows or look over
the already calculated once.
For online files, calculations are started automatically after changing the range (new lap have
been received) or update the view.
The number of channels displayed horizontally depends on the size of the window and the
size of the columns.
You can copy the result in the clipboard. The plain text and rich text formats are supported.
Outing Report
The Outing Report provides a quick overview of an individual outing. Values for individual laps or lap
segments, from any number of different channels are brought together and displayed in an organised
fashion.
In addition, an outing report enables you to quickly access points of interest in an Oscilloscope.
Open an Outing Report Window
Drag the menu item “Windows/ Worksheet controls/ Outing report” into your workspace to open an
Outing Report Window. The window that appears will display the results that were calculated based on the
most recent settings.
Outing Reports are typically used to for the performance of two different tasks:
For the evaluation of files in the Oscilloscope, so that the results for all opened files will be displayed
Analysis
Page 217 of 282
automatically. If you open further files (or if you close already opened files) WinDarab automatically
updates the Outing Report.
For the evaluation and documentation of certain files, in which case only the files that have been
specified for evaluation will be added to the Outing Report.
You can save the settings you make for an Outing Report in an Outing Report File (file extension *.bmsor).
Among other information this file saves the evaluation results so that - if an Outing Report is opened - new
calculations will not be necessarily. This can save a lot of time
Outing Report Window
In an Outing Report evaluation results are displayed as a table.
Segment
Times
Table
If the evaluation of a lap segment has been activated, it is possible to display a table containing
segment times. This display format provides an excellent overview of individual and fastest
segment times.
Working with the Results Table
Changing the Column Width
Use the mouse to adjust column width.
Double-clicking Cells
Double-clicking on a cell prompts WinDarab to look for an Oscilloscope that displays the file. If
WinDarab find one Oscilloscope the cursor will jump to the location at which the selected
value occurred. If nothing is found (as is the case for lap averages) Win Darab zooms in on the
entire lap.
Right Mouse Click
Clicking your right mouse button displays a local menu with the following options:
Display Laps
Analysis
Page 218 of 282
Display min/max row
Display Comment
Display Comment Fields
Edit Comment
Load Settings
Save Settings
Settings…
Settings
A dialog box with settings appears automatically when you open the Outing Report Window for the first
time. Closing the window will save its settings and the next time the window is opened the dialog will not
appear again. Instead the saved settings will be loaded.
If you want to modify settings or carry out a new calculation, you can re-open the dialog box using the
menu item “Start/ Settings/ Edit” or by using the context menu with pressing the middle mouse button or
left + right mouse buttons.
You can even press the F5 key to open the “Load Settings” dialog box.
Note:
In addition to the actual settings the calculated values of files displayed in the Outing Report
will be saved. No new calculations will have to be made when you re-open the Outing Report
at a later time.
How to save and load settings see: Settings in Analysis.
Columns Tab
This tab is used to configure columns that are displayed in the Outing Report.
Analysis
Page 219 of 282
Show
Channels
from
Use this field to select the file that will provide the list of available channels. It is also
possible to enter the channel names you want in the channel fields. However, selecting a file
name saves time and eliminates the possibility of making typos when entering the channel
names.
Outing
Report
Table
Each row in this table represents a column in an Outing Report. Use the first two fields,
“Channel” and “Function” to specify which value has to be calculated for the selected
channel.
Use the “Out” and “In” option buttons to specify whether you want to consider the first lap
(“Out”) or the last lap (“In”) of an outing for the calculation of the “most extreme” value
(which will be displayed in the min/max row of the Outing Report).
Finally, in the “Value of Channel” field specify the value you want to display in the Outing
Report. If you do not make an entry in this field, the value for the specified channel will be
displayed. But you also have the option of displaying the value for another channel, at the
moment the specified condition pertains.
Add
Use this button to add a new row to the table.
Remove
Use this button to remove the current row from the table.
Remove All
All rows will be removed from the table.
Up / Down
Arrows
Clicking on the arrows will move the current row up or down. This determines the column
sequence in the outing report.
Segments Tab
Activate the evaluation of course segments in the “Segments” tab.
You have the option of defining segments with segment triggers for which you need hardware
(i.e. segment triggers) whose signals have to be recorded in the vehicle.
Another option is the use of a racetrack with a course segmentation of your choice.
Analysis
Page 220 of 282
Note:
The segmentation in the Outing Report is separated from the selection in the Racetrack
Window. Therefore if you switch racetracks using ”File / Racetracks …“ the selected racetrack
in the Outing Report will not be changed.
Options Tab
In this tab, you can select display options that determine the appearance of the Outing
Report.
You can activate (or de-activated) most of these options within the Outing Report with
your right mouse button.
Show Laps
When you have activated this option, a row containing the respective values for each lap
will be displayed in the Outing Report.
Show
Segments
Activating this option enables you to turn on or off the display of individual segment
results for each lap by clicking on the “+” or “-“ button. If this option has not been
activated, segment results will not be displayed.
Analysis
Page 221 of 282
Show
Min/Max Row
If you have activated this option, a row with min/max values will be displayed in the
Outing Report. This row displays the “most extreme” values of all laps. Depending on
how you have configured a column, values for the first lap (“Out”) or the last lap (“In”)
may also be considered.
Show
Comment
Selecting this option displays the contents of the comment field in addition to the file
name.
Show
Comment
Fields
Selecting this option displays the contents of all comment fields in addition to the file
name.
Show Fuel
Consumption
Activate this option, if you would like to view the fuel consumption for each lap in
addition to the lap number and lap time.
You can activate (or de-activated) most of these options in the Outing Report with the
right mouse button.
Colors Tab
This register enables you to make your color choices for the Outing Report.
The palette is an excerpt from the “Colors” Tab in “Options/ Settings”.
Analysis
Page 222 of 282
Start/ Overlay
In this Menu, you can chose the Overlay file, that will be shown in the Outing Reportwindow.
Lap Analysis
Lap analysis represents a comprehensive analysis tool for course segmentations, which enables you to
evaluate and display logged data in a racetrack diagram.
Lap Analysis supports the calculation and display of several course segmentations in a single window,
displaying individual segmentations as parallel tracks (something that cannot be done in regular course
segmentation).
The evaluation for individual laps will be carried out according to the course segmentation. You can define
as many evaluation rules as you like. Each evaluation rule describes which function has to be used to
evaluate a channel, which segments have to be examined, and how the results should be displayed in the
diagram.
To learn more about the evaluation algorithm, please refer to “Analysis Rules”.
Open a Lap Analysis Window
Select “Windows/ Worksheet controls / Lap analysis“ from the menu and drag it into your workspace to
open a Lap Analysis Window. The Lap Analysis Window appears and its content indicate which calculations
will be carried out, based on the most recent settings you made.
It is possible to save settings for a particular lap analysis in a Lap Analysis File (file extension *.
bmsla).
Analysis Rules
An individual analysis rule contains the following information:
The name of the channel you want to analyse
The function you want to use to analyse the channel
The specification of the course segment for which the channel will be analysed
The name of the channel whose value should be displayed if a matching course position has been
identified during the analysis of the specified channel.
A combination of style attributes that determine how the results will be displayed.
Channel Names
You are able to choose two channels per rule; the first is the channel you want to analyse. It will be
Analysis
Page 223 of 282
evaluated with the help of a function.
If you want to identify a particular course position (e.g. the maximum value of the channel) the found
maximum value for that channel will be displayed accordingly if you did not select a channel in the “Value
of” field. However, if you did select a channel in that field, the value of this specified channel will be
displayed (for the identified position) and not the value of the channel that is being analysed.
Selecting a channel in the “Value of” field is only possible, if the function you have selected
belongs to the type of function that are able to match a course position to a particular result.
Functions
You need to distinguish between three different types of functions:
1. Functions whose results cannot be matched to a particular position on the course (e.g. average or
standard deviation). Since there is no matching course position for these results, they are always
displayed at the centre of the evaluated course segment.
During a comparison with a reference lap, the value for the reference lap is calculated for the same
course segment.
2. Functions whose results can be matched to a particular position on the course. Depending on the
function, the number of results can range from none to many (e.g., Minimum, Maximum and Change).
Results will be displayed in close proximity to the course position that has been identified. A line
indicates the position on the course.
During a comparison with a reference lap the channel value of the reference lap is extracted at the
same location on the course.
3. The “Course Position” Function. This function does not analyse a channel. Instead, it indicates a
channel value for a vehicles current position on the course. The Lap Display Window enables you to
change the position of the vehicle and to insert additional values at as many points on the course as
you like.
Results will be displayed in close proximity to the course position that has been identified. A line
indicates the position on the course.
During a comparison with a reference lap the channel value of the reference lap is extracted at the
same location on the course.
Course Segment
Rules are evaluated for particular course segments. In the selection list you will find “each segment”,
“entire lap” and the colors for individual course segments as specified in the racetrack segmentation.
If you select “entire lap” the lap will be evaluated independent of the racetrack segmentation. In all other
cases, course segments are evaluated independently.
For example: the “Maximum” function does not identify the maximum channel value for segments with the
same color; rather it finds the maximum channel value for each segment with the selected color.
Style Attributes
Style attributes are used to format the display of results. You will find more detailed descriptions of
individual attributes in the “Style and Display” section.
Analysis
Page 224 of 282
The Lap Analysis Window
This window displays the results of the lap analysis in the racetrack diagram.
Working with the Lap Analysis Window
A Lap Analysis Window works much like a Racetrack Window. The following additional functions are also
available:
Left Mouse Click
Select a result by clicking on it. This will move the corresponding vehicle to the appropriate
position. The selected result will be framed in the same color as the segment in which it
occurred.
Right Mouse Click
Clicking on the window displays a local menu with the following options:
Delete Result
This function deletes the result you have selected from the diagram.
Insert Result from “Point rules”
This function evaluates all rules of the “Course Position” type for the vehicles current
positions on the course and displays the results.
Recalculate all
This function deletes all displayed results from the diagram, carries out a new calculation
and places the new results near the racetrack.
Show file legend
This function displays a list of file names and evaluated laps. You are able to adjust the size
of this list and place it anywhere you like.
Car shape
Select the shape of the car that is displayed.
Load Settings
Save Settings
Settings…
Delete Result
Context Menu/
Analysis
1. Click on the result you want to delete. It will be displayed in a color rectangle.
Page 225 of 282
Delete result
Start/ Results/
Clear
2. Select “Start/ Clear“ from the menu or “Delete result”
Insert Result of Position Rules
Local Menu/
Insert Result
from “Point”
rules
1. Move the vehicle (with a mouse click) to the position on the course for which you
want to evaluate the “Course Position” rules.
2. Select “Insert Result from “Point” rules” from local menu.
3. WinDarab will now calculate the rules for the current vehicle position and display
the results in the diagram.
If you have calculated a number of rules for the same position you will have to arrange
the results in a useful way.
Recalculate all
Context Menu/
Recalculate all
Start/ Results/
Select “Start/ Recalculate” from the menu or “Recalculate all” from the
context menu to delete all results from the display and to carry out a new
calculation.
Recalculate
Show file Legend
Context Menu/ Show
file legend
Start/ Display/
Legend
Select “Start/ Display/ Legend” from menu or “Show file Legend” from local menu
to activate the display of file names and the evaluated laps.
You can change the size and placement of this window.
Lap Analysis Settings
A dialog box with settings appears automatically if you open the Lap Analysis Window for the first time.
Closing the window will save its settings. The next time the window is opened the dialog will not appear
again. Instead the saved settings will be loaded.
If you want to modify settings or carry out a new calculation, you can re-open the dialog box using the
menu item “Start/ Settings/ Edit” or by using the context menu with pressing middle mouse button or left
+ right mouse buttons.
Analysis
Page 226 of 282
You can press the F5 key to open the “Load Settings” dialog box.
How to save and load settings see: Settings in Analysis.
Overlays Tab
Use the “Overlays” tab to specify the overlays or laps for which you want to calculate a lap analysis.
Overlays for
evaluation
This list includes all files and laps for which the rules will be calculated during lap
analysis.
Use the arrow buttons on the right-hand side to change the sequence. This is important
if you want to calculate the course segmentation for a single file, where WinDarab
always uses the first file in the list.
“Select Open
Files” Button
Use this button if you want to analyse the same files and laps that are already opened
in the Oscilloscope. The appropriate entries will then appear in the list.
“Add” Button
Click on this button if you want to add another line to the table.
“Remove“
Button
Click on this button if you want to remove the current row from the table.
The fields will display the file and lap selection that was pre-selected for the current
Oscilloscope.
“Remove All “
Button
Click on this button to empty the table and to add a new row showing the current Base
File and laps for the Oscilloscope.
Reference Lap
Click on this button to select the file and lap you want to use as the reference lap.
Analysis
Page 227 of 282
A reference lap will only be used if a rule uses a display mode that pertains to the
reference lap. Otherwise the setting has no effect.
Rules Tab
The “Rules” tab is used to specify the analysis rules. An analysis rule stipulates which function will be used
to evaluate a channel for a particular course segment as well as how the result will be displayed.
The following specifications can be made for each rule:
Channel
Name of the Channel you want to evaluate. Depending on the function you select, this
channel is used to calculate a particular position or result.
Function
Choose the function that has to be used for the analysis of the selected channel. If the
result for this function also contains a course position (such as Minimum or Maximum
values) the rule is then able to return the result for a second channel at the same position
on the course (see “Value of …“).
Following functions are provided:
Segment
Analysis
Maximum
Exit
Change
Standard deviation
Average
Difference Exit-Entry
Dist position
Entry
Minimum
Select the course segments you want to analyse individually in this area. Results are
calculated for each course segment. Depending on the function (e.g. “Change”), several
Page 228 of 282
results might be calculated for each segment.
The “Entire Lap” option is a special case. When this option is selected segments are not
evaluated individually but rather the lap in its entirety.
Value of …
It is possible to select a second channel here. As a consequence the returned value will
reflect the result for the channel you have specified in this field and not the value for the
channel to be analysed.
This option is only available if you have selected a function whose calculation yields a
course position (e.g., Minimum or Maximum values)
Style
Here you can choose from a number of result display styles, including the option “userdefined …”. Selecting this option will open a separate dialog box called “Style and Display”
that enables you to select individual options.
All other buttons and entry fields in this tab are described below:
Show
Channels for
In this field, select the file you want to use. The channels for the selected file will be shown
in the channel selection fields under “Channel“ and “Value of”.
“Add”
Button
Click on this button if you want to add an empty row to the table.
“Remove”
Button
Use this button to remove the selected row from the table.
“Remove
All” Button
Clicking on the “Remove All” button removes all rules from the table.
Calculate Segmentation Tab
You are able to define rules for the automatic calculation of course segmentation in the “Calculate
Segmentation” tab.
If you choose neither the “for the first selected file only” nor “for all selected files”, then the automatic
calculation of a course segmentation will be de-activated. In this case the course segmentation for the
selected racetrack applies. (See Load Racetracks).
Calculate racetrack Segmentation
Analysis
Page 229 of 282
Use the buttons in this area to determine for which file(s) segmentation will be calculated.
For the first selected file
only
If you select this option the calculation is made only for the first file listed in
the “files” tab. This means that the course will be broken down into a single
segmentation that applies to all files equally during the evaluation of rules
that have been specified in the “rules” tab.
For all selected files
Choosing this option means that course segmentations will be calculated for
all the files you have selected in the “Files” tab. This results in a course with a
number of parallel tracks. Each track represents the course segmentation for
a particular file. Vehicle icons move along their individual tracks.
Use the “difference
between file values” and
the “values of the
reference lap”
When course segments are calculated, WinDarab does not use the absolute
values for each channel; instead it calculates the difference between the
values of the specified file and the reference lap you specified in the “Files”
tab.
This button corresponds to the “Difference” button in the “ Calculate
Segmentation“ tab inside the “Racetrack and Segmentation” dialog box.
This tab corresponds in most respects to the “Calculate Segmentation“ tab in
the “Racetrack and Segmentation” dialog box.
Style and Display
This dialog box enables you to make decisions about the style and presentation of
analysis results. It will be shown when u select “User defined ...” as Style in the RulesTab.
You are able to decide which results will be displayed through in the “Display Results”
options list.
Value in File
If this option is selected, only the result for the evaluated file will be displayed.
Value in
Reference Lap
If this option is selected, only the result for the reference lap will be displayed.
Difference
Choosing this option displays the difference between the result for the evaluated file
Analysis
Page 230 of 282
and the result for the reference lap.
Values from File
and Reference
Lap
Results for the evaluated lap and the reference lap will be displayed. The value for the
reference lap will be displayed in brackets.
Value in File
and Difference
This option displays the result for the evaluated lap and the difference to the reference
lap. The value for the difference is displayed in brackets.
The “Display” options enable you to select a number of style attributes used to modify
the appearance of the results display. Instead of explaining these options in great detail,
we suggest that you view the various possibilities using a sample lap.
The result for the reference lap is calculated in the following way:
If the result for the evaluated lap has been assigned to a specific position on the
course (e.g. Minimum or maximum) the result will be extracted from the reference
lap at exactly this position.
If the result for the evaluated lap has not been assigned to a specific position on the
course (e.g. Average) the result for the reference lap will be calculated for the same
course segment.
Analysis
Page 231 of 282
Telemetry
In WinDarab there are several tools for analysing and monitoring telemetry online data (online files). In
online files the end is unknown and new data can be received at any time and the new samples become
available immediately. Oscilloscope can open online files just as they are normal files and you can work
with them in the same way.
Re-establishing connection after network disconnect
If an active connection to the WDServer is required (e.g. after a network disconnection
because of unplugging the network cable) WinDarab tries to reconnect to the WDServer by
sending server search packets to the WDServer.
Instrument panel is used to show channel values using different display options and shapes. It also allows
tracking the channel values and raising alert events if they exceed user defined ranges.
Open a Instrument Panel Window
Drag “Start/ Worksheet controls / Instrument panel” from the menu into your workspace or select
“Instrument panel” from local menu to open an Instrument Panel Window.
To open an online file use Select File/ Telemetry in the context menu of the Instrument Panel Window.
After the online file is opened you can selected it in an Oscilloscope as a normal file. If the file is online then
in the menu and tool bar of the Oscilloscope become available in two modes:
ON
OFF
Follow (online data). This is the default mode. In this mode the logged data cursor will
move to the new received data of currently selected online file and channel.
Pause (online data). The data will continue to arrive, but the cursor of the Oscilloscope will
not follow it. In this mode you can examine the received data until the present.
Oscilloscope will automatically switch to “Pause mode” if you scroll the window.
Telemetry
Page 232 of 282
Important:
Telemetry connection is only available if you have a licence for this feature.
Instrument panel
Context Menu - Right Mouse Click
Clicking your right mouse button displays a local menu with the following options:
Instrument panel / Select
File/ Telemetry
You can select an online file (car) to monitor.
Instrument panel/ Add
You can add a display object in Instrument Panel Window. Available objects:
Value Display, Bar Display, Round scale, Previous laptime, Current laptime.
Instrument panel/
Remove
Removes the selected display object.
Instrument panel/ Copy
Ctrl + C
You can copy the selected displayed object into the clipboard.
Instrument panel/ Paste
Ctrl + V
You can paste the clipboards displayed object into the window.
Instrument panel/Clone
Ctrl + D
You can make another displayed object (clone) with the same properties like
the selected one.
Instrument panel/ Load
Settings
F6
Load Settings.
Instrument panel/ Add
Settings
Ctrl + F6
Union current settings with settings from a file.
Instrument panel/
Properties
F5
Show properties of the selected display object, if there is selected one.
If a new round scale is added to the instrumented panel by dragging a channel into the
window the round scale will not render correctly until the properties window is
opened/applied or closed/reopened.
If the user assigns a channel to an instrument (Value display, Bar display, Round scale, Bit
Panel) and the channel is empty (contains no data) a message is displayed to notify the user
about this.
Telemetry
Page 233 of 282
Value display
Displays the current channel value as a number. This display shows simply the channel name and its
current value.
In addition you can see the value in different colors (states) depending on defined ranges for the channel in
the setup common page.
Properties If the object is active (indicated by a blue frame) you can open and modify its properties. You
F5
can open the dialog box using the context menu with pressing right mouse button.
A dialog box with 2 tabs appears:
Common Tab
This tab is used to select channel, its ranges and number format. You can divide the channel range up to 3
sub ranges upper, middle and lower. You can choose a color for any of the sub ranges. This display doesn't
have a scale so the scale factor is not available. You can also change the background color of the item.
Telemetry
Page 234 of 282
Alerts Tab
This tab is used to set parameters of the alerts and events. An alert is raised (flashing channel name in the
color of the range) if the current value of a channel satisfies the condition in a range and if it is checked in
this tab. If you check an alert you can specify a hysteresis for it. The alert will stop if the value reaches the
range limit minus hysteresis. In this tab you can also specify alert notifications time.
An Event is also raised and displayed in the Event Window (see Events).
Bar display
Displays the current channel value as a bar. You can see a current value as a number and in the same time
as a bar. Additionally you can select and see whole range, upper, middle and lower sub ranges. You can
also see the Min/Max of the previous lap. There are small arrows at right side which shows the min and
max of the channel for the whole online session. If the arrow is red then this value is measured by the car
else it is black and evaluated from Darab. In the middle of the bar there are two signs that shows the local
min and max peaks.
Telemetry
Page 235 of 282
Properties
F5
Double
Click
If the object is active (indicated by a blue frame) you can open and modify its properties. You
can open the dialog box using the context menu by pressing the right mouse button.
A dialog box with three tabs appears:
Common Tab
This tab is used to select channel, its ranges and number format. You can divide the channel range up to 3
sub ranges upper, middle and lower. You can choose a color for any sub range. Scale factor is used to show
or hide digits from numbers of the scale. You can also select the display value range for the channel.
Bar Tab
This tab is used to show/hide peaks and the shape of the color. If you set a peak you can specify how long
the peak should be held if a new peak does not appear in this time. After this time the peak will be cleared.
Instead of a color you can select the appearance of the bar. The option stacked bar will show the bar in
several colors depending on sub ranges and current value. Solid bar will fill the whole bar in the color of the
current range. If the channel has negative values then the bar can be drawn always starting at the current
value or starting at physical value 0.
Telemetry
Page 236 of 282
Alerts Tab
This tab is used to set parameters of the alerts. An alert is raised (flashing channel name in the color of the
range) if the current value of a channel satisfies the condition in a range. If you check an alert you can
specify a hysteresis for it. The alert will stop if the value reaches the range limit minus hysteresis. In this tab
you can also specify alert notifications time.
Round scale display
Displays the current channel value as a channel-meter. This display shows the data as real life devices. The
display is a circle with arc scale and there is an arrow which shows the current value. You can see the
current value as a number too. You can choose from eight different styles: two different radius for the
circles (big and small) and four scale layouts (270 degree or 90 degree left or right sided).
Here are some examples of round scales:
Telemetry
Page 237 of 282
Properties
F5
Double
Click
If the object is active (indicated by a blue frame) you can open and modify its properties. You
can open the dialog box using the context menu by pressing right mouse button.
A dialog box with two tabs appears:
Common Tab
This tab is used to select channels, its ranges and number format. You can divide the channel range in three
sub ranges upper, middle and lower. You can choose a color for any sub range. Scale factor is used to show
or hide digits from numbers of the scale. You can also select the display range for the channel and the
background color for the item.
Style Tab
This tab is used to select the size and the arc of the meter. You can choose from eight different styles: two
different radiuses for the circles (big and small) and four scale layouts (270 degree or 90 degree, left or
right sided).
Telemetry
Page 238 of 282
Alerts Tab
This tab is used to set parameters of the alerts. An alert is raised (flashing channel name in the color of the
range) if the current value of a channel satisfies the condition in a range. If you check an alert you can
specify a hysteresis for it. The alert will stop if the value reaches the range limit minus hysteresis. In this tab
you can also specify alert notifications times.
Bit panel
A bit panel allows the display of each bit of a channel. This display shows the channel name and the current
value of each bit of a channel.
Telemetry
Page 239 of 282
In addition each bit can be displayed in two different colors depending on the bit state (“0” or “1”).
Properties
F5
Double
Click
If the object is active (indicated by a blue frame) you can open and modify its properties. You
can open the dialog box using the context menu with pressing right mouse button.
A dialog box with two tabs appears:
Common Tab
This tab is used to select the channel, the bit panel layout and the colors.
Channel – select the channel which bits should be displayed
Bit panel layout
Bit Count and Bitnumber-Format – determine the number of bits displayed on the panel und the bit
number format. The user can select hexadecimal or decimal format.
Bits per row and Bit counting – determine the number of bits per row and if bit counting is 0- or 1based
Colors – select the color of bit state (“0” and “1”), panel background, active alert and unacknowledged
recent alert.
Alerts Tab
This tab is used to set the parameters of alerts. An alert is raised if the current value of a channel satisfies
the condition defined in this tab.
The user can define an alert condition for each bit of the channel. By default the value of each bit is
masked. Through double click the bit value by which an alert will be reported can be defined.
If an alert is active the channel name and the bits raised the alert will be flashed in the colors select by
Properties of bit panel - Common / Active alert.
In this tab you can also specify alert notifications times.
Telemetry
Page 240 of 282
Current lap time
Displays the current lap time. The color can be customized.
Properties Active object properties can be modified. You can open the dialog box by using the context
F5
menu.
A dialog box appears:
Common Tab
This tab is used to select the color of the current lap time.
Previous lap time
Displays the previous lap time. The color can be customized.
Properties Active object properties can be modified. You can open the dialog box by using the context
F5
menu.
A dialog box with appears:
Common Tab
This tab is used to select the color of the previous lap time.
Telemetry
Page 241 of 282
Settings
There is no dialog box for telemetry settings. The settings of telemetry monitoring can be adjusted by the
applied displays and their properties.
Load Settings
You can access pre-defined settings by selecting “Start/ Settings/ Load” from the menu, by using the
context menu with right mouse button or by pressing the F6-key.
1. Select “Start/ Settings/ Load” from the menu.
2. File Explorer will appear.
3. Select the desired settings file and confirm your selection by choosing “Open”.
Save Settings
You can save your current settings, by selecting “Start/ Settings/ Save” or by pressing F7-key.
1.
2.
3.
4.
Select “Start/ Settings/ Save” from the menu.
File Explorer appears.
Select the file in which you want to save the settings or enter a name.
Confirm your selection by choosing “Save”.
Add Settings
Instrument panel/ Add
Settings
Ctrl+F6
You can union different settings by adding them one after another. To add
settings select “Add settings” from local menu
Wrong Settings
If for some reason a channel in a display object is unavailable then it will be red-crossed.
You can combine the telemetry window (for example with round scales of speed and
revolution channels) with the racetrack's driver's view.
Telemetry
Page 242 of 282
Events
This window displays all events of the current online session. Telemetry events are set from a car in alert
state or from a display object of Telemetry Monitoring (Value Display, Bar Display, and Round Scale
Display).
Time - shows the system time of the error.
Car – which car (online file) sent the event
From - is a value from the time channel of online file when the error started
To - is a value from the time channel of online file when the error ended.
Duration - is the time in which the error was active.
Channel – is the name of the channel which causes the event.
Min - minimum of the channel between the start and end of the event.
Max - maximum of the channel between the start and end of the event.
If the event is an error bit instead of channel, min and max you will see the error bit
description.
Telemetry
Page 243 of 282
Settings
It is possible to modify the way WinDarab by a number of different settings.
To modify options select “Tools/ Program” from the menu. The “Options” dialog box with the following
tabs will appear:
Colors – Configure color settings for the on-screen display.
SET-Path – Set the path for SET files.
DCP – Configure WinDCP Settings.
Measurement window – Configure settings that affect the display of channel signal curves in the
Oscilloscope.
Miscellaneous – Automate certain WinDarab operations and dialog boxes.
Comments – Define additional comment fields.
Physical Units – Edit free conversation rules to transform the physical values of Bosch to its own units.
Special channels (see Special channels).
Telemetry – Define if WinDarab is activated in case of on alert.
Import defaults – Configure the default settings for importing data.
Color Tab
In the Color Tab you are able to configure color settings for the on-screen display.
The list includes all WinDarab elements for which you can specify a particular display color.
Settings
Page 244 of 282
Choose the color you would. The currently selected color is marked with an x.
The large color square on the lower left has a specific function:
It indicates the default colors for some elements. For instance: in “General: Background“ it displays the
color the system assigns to the background in dialog boxes; in “Outing Report: Background” it indicates
the current selection for the general setting “General: Background”.
Selecting the shaded square (= transparent) “switches off” the display for some elements.
Confirm your changes by clicking on either “Apply” or “OK”, or by selecting another tab. All windows in
WinDarab will be displayed with the new color settings.
SET Path Tab
This tab is used to make settings needed by using a CanCard.
Enter the path used to save your Setup Files containing the Reader configurations in the entry field.
The Set File path will only be required if the Reader contains no DCP information.
DCP Tab
The DCP Tab is used to make WinDCP settings.
Settings
Page 245 of 282
Folder/ Name WinDCP
In this field specify the folder and the file name of the file in which you installed the WinDCP that is to be
used by WinDarab.
Folder/ Name DCP File
In this field enter the folder and file name of the DCP file, which should be used to initialise Flashcards for
your CardMemory.
Use the “Search” button to select the desired file from your hard drive.
Measurement windows
The Display Tab is used for settings that affect the display of channel signal curves in the Oscilloscopes.
Settings
Page 246 of 282
Drawing Differences
Use the scroll bar to modify the level of accuracy and, as a consequence, the speed with which the
difference between two channels will be rendered.
If the slide has been moved to “precise”, the difference values for all sampling points (in both files) will be
calculated and displayed.
The further you move the slide toward “rough”, the more sampling points will be skipped during the
rendering process; as a consequence the display takes proportionately less time to generate but it will also
be less precise.
Draw Channels
If you activate this button WinDarab produces a simplified display of the signal curve.
In a standard display WinDarab determines extreme signal values for each screen pixel along
the x-axis; and if necessary it generates a vertical line in order to make this value range clearly
visible. As a result the display of channels with extreme signal fluctuations (digital channels,
for instance) will produce color areas that obscure other signal curves.
In the simplified display WinDarab determines, by spot sampling a single signal value for each
screen pixel along the x-axis. These signal values are then used to render the signal curve.
Situations may occur where not all anomalies (e.g. outliers or digital triggers) of a signal curve
can be shown in the simplified display.
Changing the y-axis view
Use the Windarab v6 y-axis view
With this option, you can change the new y-axis-view with the name and unit on the side back to the v6design with the name and unit on top/bottom of the axis.
When this option is selected, you can chose globally the position of the name and unit from the dropdownmenu.
Miscellaneous Tab
The Miscellaneous Tab allows you to automate certain WinDarab operations and dialog boxes.
Settings
Page 247 of 282
Use this tab to make the following settings:
At program exit ask for a confirmation
Before you exit WinDarab, you will be asked to confirm the changes or selections you may have made.
Decimal comma for ASCII-Export
You can chose, whether your decimal separator for the ASCII-Export should be a comma or a point.
Comments Tab
In addition to the comment text field provided in WinDarab the program allows you to define further
comment fields. These additional fields allow you to enter structured information about a particular file.
You are able to enter data into the fields you have defined during data analysis. It is also possible, however,
to pre-define settings for these fields in such a way that information will be entered automatically during
data transfer.
Comment fields can be used in mathematical channels as outing-specific constants.
Select the “Tools/ Settings/ Program/ Comments” tab if you want to define additional comment fields.
Settings
Page 248 of 282
Adding a Comment Field
Follow these steps to add a comment field:
1.
2.
3.
4.
Enter the name of the new comment field in the “Fields/ Sequence” field.
In the “Field Type” field, select which type of information you want to save here.
Specify the width of the field in the “Width” field.
If you have selected “Number”, you must also specify the number of decimal places and the unit of
measurement.
5. Click on the “Add” button.
6. The new field will be added to the bottom of the list.
Deleting a Comment Field
Use these steps to delete a comment field:
1. Enter the name of the comment field you want to delete in the “Fields/ Sequence” field. Alternatively
select the comment field from the list.
2. Click on the “Delete” button.
3. The comment field will now be deleted from the list.
Note:
Comments that have already been saved in existing Logged Data Files will not be deleted.
The comment fields you have just deleted will not be included in new files you create.
Determining the Sequence of Comment Fields
You can determine the sequence in which WinDarab displays pre-defined comment fields in a Logged Data
File:
Follow these steps to modify the sequence of comment fields:
1. Select the comment field which you want to move to another position in the list.
2. Click on the “Up” or “Down” arrow button to move the field up or down to the desired position.
3. Repeat this step until the fields appear in the proper sequence.
Setting Default Values
You can set the default values for the comment fields you have defined that will automatically assigned to
each Logged Data File during data transfer:
1.
2.
3.
4.
Click on the “Default Values” button
A dialog box with the defined comment fields will appear.
Change the default values as desired.
Click on “OK”.
Settings
Page 249 of 282
Physical Units Tab
The Physical Units tab allows you to choose/remove or add unit sets to customize your data.
In the box on the left side, you see all of your current possible conversion sets to choose from. The <none>
- conversion set can be selected to have no conversion set active.
With the “Set as active”-button, the currently selected set becomes active and all its conversions are
applied to the according channels.
You can rename or remove a conversion set by pressing “Rename” or “Remove”.
Removing the active conversion set automatically sets the <none> - conversion set as active. The <none> conversion set itself can’t be removed, renamed or modified.
With the “New Set”- and “Modify” – buttons, you can create a new set or modify the currently selected
set. This happens in a new Dialog.
Settings
Page 250 of 282
Rules-Page
On the first page of the wizard you see all the rules that are contained by the conversion set.
Every rule has a Priority, a Name, a source unit, a target unit, a factor, an offset and a specified number of
decimals.
The priority is used to define the default-converter for the channels. If there are two or more converters
suitable for one channel, the one with the higher priority is applied.
The source- and target unit define what units can be converted in which destination units.
The factor and the offset define the formula for the conversion. The formula is:
Destination Value = Source value * factor + offset.
The decimals only specify the format in which the destination value is displayed.
You can add or remove rules by pressing the “New Rule” or “Remove” button.
Note:
The priority can be changed by pressing the “up” or “down” button. It also can be changed by
dragging the selected row onto a different row.
Settings
Page 251 of 282
Details-Page
The next page is the details page. On this page you see exactly what changes will apply when you use this
conversion set. The table shows every channel, its description and source unit. If the channel has a
conversion-rule that can be applied to it the table shows the currently assigned conversion rule and the
destination unit in which the channel is converted.
You can filter the channels by selecting the filter from the filter-combobox. Aside from every possible
source unit, you can select <none> for no filter and <assigned> to only show the channels that have a
possible conversion rule that can be applied.
If there is a conversion rule matching the source-unit of a channel, you can chose the conversion rule for
this channel. Initially the default rule is applied to the channel. By clicking on the conversion-rule name in
the conversion-column a popup menu is shown with all possible selections for this channel.
(none) is selected if no conversion rule should be applied to this channel. The channel won’t be influenced
by this conversion set.
(default) is selected to use the default converter. In the table, the current default conversion rule for this
channel will be shown.
Select a named conversion-rule if you want to use a specific rule for this channel.
Settings
Page 252 of 282
Note:
Selecting (default) or selecting the current default conversion rule has initially the same
result. The difference between the two possibilities is that if you change the priority of the
rules, the default conversion rule for a source unit (for example km/h) can change while the
explicitly assigned rule stays the same.
Telemetry
On the Telemetry tab all options concerning the viewing of online/telemetry data can be found.
Option “Activate WinDarab …”
If this option is enabled, WinDarab will pop into the foreground, if an alert event occurs.
E.g. alert events are triggered by the gauges on an instrument panel.
Option “Use Multicasting …”
This option is active in conjunction with WDServers prior to v2.02.005. By default WDServer uses IPMulticasting to deliver online data to client computers. Because of certain issues depending on the
computers configuration it can happen, that IP-Multicasting doesn’t work. If this is the case, WinDarab
detects and connects to a WDServer instance, but doesn’t show further incoming data.
To resolve the issue, this option can be used to disable IP-Multicasting.
Note:
In common a firewall may be responsible, if telemetry doesn’t work. If a firewall blocks the
traffic the effect is about the same as if IP-Multicasting is not working –disabling this option
doesn’t help to resolve firewall issues!
Options “Network adapters used …”
In this section Network adapters can excluded from the use for telemetry/online data connections to
WDServers. WinDarab will only send WDServer discovery packets on the selected network adapters.
Settings
Page 253 of 282
By default WinDarab uses all connected network adapters. Only in certain cases you should exclude
adapters:
Prevent WinDarab from sending packets on network adapters to reduce the “noice” (e.g. if the
network adapter is connected to the CAR LAN)
Prevent WinDarab from sending packets on other adapters like VPN/RAS adapters – behind these
adapters there shouldn’t be a WDServer located.
Note:
If a new adapter is added to the system, the adapter will be added “Enabled” to the list.
Import default
The import default Tab allows you to configure different default settings for the import from your devices.
Settings
Page 254 of 282
Channel Settings
You are able to make basic settings for each channel in WinDarab.
For each individual channel following settings are provided:
Description
Format (numerical)
View Min
View Max
Signal (signal curve format)
Separate Bits
Making Channel Settings
Select “Tools/ Settings/ Channels” in Darab Ribbon to open the “Channel Settings” dialog box.
Channel Settings
Page 255 of 282
The Channels are divided into four channel list:
Measurements channels
Math channels
Internal channels
Temporary channels
Click on Show measurements button to select and display the Measurements channels
list
Click on Show math channels button to select and display the Math channels list
Click on Show internal channels button to select and display the Internal channels list
Click on Show internal channels button to select and display the Internal channels list
Channel Settings
Page 256 of 282
Click on Show/Hide all channels button to (de-)select and display/hide all channels
For each channel in the lists the following settings can be defined:
A description for the channel can be entered in the text field.
Description
Define the display format of numbers.
Format
The following formats are provided in the Format combo box of each channel:
View Min
View Min
Signal
You can enter the value displayed as minimum for the channel.
You can enter the value displayed as maximum for the channel.
Determine the format for display of the signal curve.
The following formats are provided in the Signal combo box of each channel:
Analoge - values are interpolated.
Digital - sampling points are represented by square wave signals
Dotted - each sampling point is represented by a dot
Channel Settings
Page 257 of 282
Separate Bit
Bits - each channel bit is interpreted as a separate signal and represented by a square
wave signal
With this option selected, single bit channels will be created for each bit of the measured
channel. If selected each single bit will be shown as a channel.
You can now select each one of these bit-channels individually in the channels pane.
Importing Descriptions
WinDarab enables you to import description for channels from a (named) object store.
Follow these steps to import a (named) object store:
1.
2.
3.
4.
5.
Open the “Channel Settings” box by using the “Tools/ Settings/ Channels” menu item.
Click on “Import OSP/A2L”.
Now select the (named) object store that contains the descriptions and click “OK”.
The descriptions will now be imported.
Click on “OK” to close the “Channel Settings” dialog box.
Channel Colors
Select “Tools/ Settings/ Program” to open the Channel Colors Dialog
This dialog allows you to assign different colors for different overlays to specific channels. The number of
overlay-columns in the dialog equals the number of overlays in the File Exlorer.
Channel Settings
Page 258 of 282
The assigned colors will automacally selected when you use this specific channel in the oscilloscope.
Channel Settings
Page 259 of 282
Miscellaneous
Extracting Logged Data
WinDarab provides a number of different functions to extract data from a logged data source file.
Extracting a File Section
Depending on the hardware you are using Logged Data Files can grow to an enormous dimension. For your
work, however, you may only be interested in a certain data segment.
Therefore it is a good idea to extract excerpts of the file. You can then archive your large Logged Data File
using an external data carrier such as a CD-ROM. You might even want to delete the source files altogether.
To extract a file section follow these steps:
1. Adjust the section you want to extract from the Oscilloscope.
2. Select “WinDarab-Button / Import/Export/ Export into new measurement file” from the menu.
3. Select the file from which you want to extract the section. Only files used in the current Oscilloscope
are shown.
4. Select the area you want to extract.
5. Click on “OK”.
6. The extracted section will now be stored in a temporary file.
7. Once that process is complete the dialog box “Save Logged Data File” appears.
8. Saving completes the extraction process.
Miscellaneous
Page 260 of 282
Note:
The extracted file section contains all channels and information contained in the original
source file.
If you want to protect your file with a password, go to Creating a Password-protected File for
further information.
ASCII Extract (Logged Data)
WinDarab provides the ASCII Extract function in order to enable you to work with your data in other
applications.
To create an ASCII Extract file follow these steps:
1. Adjust the section you want to extract from the Oscilloscope.
2. Select “WinDarab-Button/ Import/Export/ Export into text file” from the menu.
3. Enter the name of the ASCII file to which the data will be written. You can use the “Search” button to
find a file.
4. Select the Logged Data File from which you want to extract the section. Only files used in the current
Oscilloscope will be displayed.
5. Select the time and/or distance button(s) if you want WinDarab to extract distance and/or time
information as well.
6. Enter the size of extraction intervals. The specified distance always refers to the x-axis in the affiliated
Oscilloscope.
7. Select which area you want to extract.
8. Click on “OK”.
9. The file extract will now be exported to the file you specified earlier.
Note:
When you use the ASCII Extract function to create a file, the file will only contain the channels
displayed in the Oscilloscope (and distance/time information if you have selected these
options).
Miscellaneous
Page 261 of 282
The Appendix contains information about the format of the ASCII file that has been created.
ASCII-Extract (Analysis Window)
You can extract the results of some Analysis Windows in much the same way as in an ASCII Extract from a
Logged Data File.
Use the following steps to export the results of an Analysis Window:
1.
2.
3.
4.
5.
6.
Use the Analysis Window to set up the desired data evaluation.
Select “WinDarab-Button/ Import/Export/ Export into text file” from the menu.
Using the “File” dialog box, select the folder to which you want to save the ASCII file.
Enter the file name.
Click on “OK”.
The results will now be exported to the file you have specified.
Note:
The Appendix contains information about the format of the ASCII file that has been created.
Printing
You can generate print previews for and print Logged Data as well as Analysis Windows.
Note:
It could be possible that very fine lines will not be displayed in the print preview. This may be
a result of a discrepancy between your screen and printer resolution.
The lines will nonetheless be visible when printed.
If you choose your colors please consider that background colors will not be printed. For
example light colors against a black background are easy to see on screen, but your printed
output will be difficult to read.
Print Options
Before a print job starts printing, or before the Print Preview appears on your screen, WinDarab will display
a dialog box with printing options.
”Layout” Tab
Miscellaneous
Page 262 of 282
If more than one print layout is available for the window you want to print you can select the desired
layout in this tab.
”Logged Data” Tab
Use this tab to determine the details you want an Oscilloscope to contain for printing.
Print Preview
Use these steps to print a window:
1.
2.
3.
4.
5.
Arrange the window you want to print so that the data will be displayed in the desired form.
Select “WinDarab-Button/ Print/ Print Preview” from the menu.
A selection of available templates for printing windows now appears. Choose the template you want.
The “Print Preview” window will now be displayed.
Use this window to
set a zoom factor (10 - 400%)
print a template
close the window
Miscellaneous
Page 263 of 282
Print
Follow these steps to print a window directly:
Arrange the window you want to print so that the data is displayed in the desired form.
Select “WinDarab-Button/ Print/ Print” from the menu.
A selection of available templates may now appear. Choose the template you want.
The Windows “Print” dialog box appears next.
Click on “OK”.
The template you have chosen will now be printed.
Note:
The Windows “Print” dialog box will only permit you to select your printer; all other settings
have no effect.
Command line
Following command line arguments may be passed to WinDarab on start up.
-d <workdesk file>
Opens WinDarab using the given workdesk file. If no additional data files are passed the saved workdesk is
completely restored – including the used files and zoom.
If the argument is not used WinDarab loads the workdesk which was saved by WinDarab
during shutdown of the application.
-f <filename> [-f <filename> …]
Use the –f argument to pass one (or more) data files which are opened instead of the files within the
workdesk.
In front of each file name the argument –f has to be provided!
Note:
Don't forget to put filenames inside of two quotes ("<path/filename>") if the path or filename
contains space characters.
You may use quotes at any time to prevent misinterpreting the command line arguments.
Miscellaneous
Page 264 of 282
Historical cars
Creating a Logged Data File from DOS Format
Because WinDarab cannot directly use Logged Data Files created by DOS Darab, they must be converted to
the format used by WinDarab.
Follow these steps to convert a Logged Data File from DOS Darab to WinDarab:
1. Select “WinDarab-Button/ Import/Export/ Import DOS-Darab-files” in menu.
2. “Convert File” dialog box is opened.
3. Select the Logged Data Files in DOS Darab. If the files do not contain any DCP information, you must
also specify the location for the setup files (*.set).
4. Confirm your entries by clicking on “OK”.
5. The files will now be converted. A progress bar enables you to monitor the conversion process.
Historical cars
Page 265 of 282
6. The dialog box “Save Logged Data File” appears as soon as the conversion is complete.
7. If more than one split is contained in the source file WinDarab will now convert the next split. Step 5 to
7 are repeated for each split
Reader / CanCard Support
If you use this hardware option the reading process will follow these steps:
Vehicle data is read with the Reader.
CanCard is used to connect the Reader to your PC.
WinDarab reads data from the Reader at the approximate rate of 1 Mbit/s.
WinDarab converts the read data to WinDarab format.
Data is available for analysis.
The hardware design limits the volume of recorded data to a maximum of approximately 4-MB per outing.
Reading Data From a Reader
When this dialog box is open WinDarab carries out continuous checks to see if a Reader is connected to the
CanCard.
Waiting Status
As long as no reader is connected you have the opportunity to make data transfer and
conversion settings:
Base Folder
An already existing folder that indicates the Base Folder to which the read data will be
saved.
The use of wildcards is not allowed in a Base Folder.
If you enter information in the Sub-folder field, your file will be saved in the “Base Folder/
Sub-folder” directory.
Sub-folder
This path/folder indicates the location, within the Base Folder, to which the new file will be
saved.
The use of wildcards with the exception of “[n]” is permissible here. If the sub-folder does
not yet exist WinDarab will automatically create one.
File
File name for the new file you want to create. The use of wildcards is permissible here.
Auto Save
The transferred data is automatically saved in the folder “Base Folder/ Sub-folder”, under
the name you have specified. The dialog box “Save Logged Data File” appears only if an
error occurs while saving.
Auto
Replace Split
1
The Logged Data File containing the first split will open automatically and replaces the
Logged Data File last opened (see also Replacing a File Globally).
Auto
Replace Split
2
The Logged Data File containing the second split will open automatically and replaces the
Logged Data File last opened (see also Replacing a File Globally).
Historical cars
Page 266 of 282
Do Not
Close
If this field has been selected the dialog box remain open after data from a reader has been
transferred, converted, and saved.
WinDarab waits until a new Reader has been connected.
Reading Reader Data
1. WinDarab begins to read data from the Reader as soon as a Reader has been connected to the
CanCard.
2. Once the reading process has been completed, WinDarab converts data in the first split area.
3. If you have not activated the “Auto Save” function, the “Save Logged Data File” dialog box appears
after data conversion.
4. If you have selected “Auto Replace” for the current split area, a new file opens automatically, replacing
the file last opened.
5. If there is more than one split area WinDarab converts data in the next split and step 3 or 4 are
repeated.
Important:
Because timing is an extremely critical factor in Reader transfer protocols, you should not run
any other complex programs requiring a lot of memory during a data transfer.
Data transfer may otherwise be extremely slow, produce error messages, or even fail.
WinDarab displays an error message if an error occurs during data transfer. After a few
seconds the message will disappear and the program will retry reading data from the reader.
Historical cars
Page 267 of 282
Appendix
Mathematical Expressions
The following sections list all operators and functions supported in WinDarab.
WinDarab follows conventional mathematical rules for evaluating expressions.
Constants:
e (Eulers’s number)
HOLD
pi
e = (1/0!) + (1/1!) + (1/2!) + (1/3!) + ... = 2.7182...
Returns the value of the latest calculation result. HOLD can be used to
eliminate/replace invalid measurement values.
pi = 3.1415…
Arithm operators:
* (Multiplication)
+ (Addition)
- (Subtraction)
/ (Division)
^ (<x>^<y>)
<X> BitAnd <y>
<X> BitOr <y>
<X> BitXor <y>
Calculates the result of <x> raised to the power of <y>
Calculate the result of the bitwise AND-combination of <x> and <y>.
Calculate the result of the bitwise OR-combination of <x> and <y>.
Calculate the result of the bitwise XOR-combination of <x> and <y>.
Comparisons:
< (Smaller)
<= (Smaller-Equal)
= (Equal)
<> (Unequal)
> (Greater)
>= (Greater-Equal)
Appendix
Page 268 of 282
Logical operators
AND (Logical And-Operator)
NOT (Logical Not-Operator)
OR (Logical Or-Operator)
General functions
If (<Condition> ;
<IfTrue> ; <IfFalse>)
If the first expression is true, the result of the second expression is returned.
Otherwise, the result of third espression is returned.
Math. Functions
Abs(<x>)
arccos(<x>)
ArcCosH(<x>)
ArcSin(<x>)
ArcTan(<x>)
ArcSinH(<x>)
ArcTanH(<x>)
ceil(<x>)
Cos(<x>)
CosH(<x>)
Exp(<x>)
floor(<x>)
frac(<x>)
int(<x>)
lb(<x>)
lg(<x>)
ln(<x>)
round(<x>)
sign(<x>)
Sin(<x>)
SinH(<x>)
sqr(<x>)
sqrt(<x>)
Tan(<x>)
TanH(<x>)
BitInvert(<x>)
Returns the positive absolute value of <x>.
Calculates the radiant angle, the cosine of which equals the parameter <x>.
Calculates the radiant angle, the hyperbolic cosine of which equals the parameter <x>.
Calculates the radiant angle, the sine of which equals the parameter <x>.
Calculates the radiant angle, the tangent of which equals the parameter <x>.
Calculates the radiant angle, the hyperbolic sine of which equals the parameter <x>.
Calculates the radiant angle, the hyperbolic tangent of which equals the parameter <x>.
Calculates the smallest integer greater-equal to <x>.
Calculates the cosine of the radiant <x>.
Calculates the hyperbolic cosine of the radiant <x>.
Calculates the exponential value e^<x>.
Calculates the biggest integer smaller-equal to <x>.
Returns only the decimals from <x>.
Cuts all decimals from <x>.
Calculates the base-2 logarithm of <x>.
Calculates the base-10 logarithm of <x>.
Calculates the natural logarithm of <x>.
Rounds <x> to the nearest integer value.
Returns the sign of <x> (-1 or 1).
Calculates the sinus of the radiant <x>.
Calculates the hyperbolic sine of the radiant<x>.
Calculates the square of <x>.
Calculates the square root of <x>.
Calculates the tangent of the radiant <x>.
Calculates the hyperbolic tangent of the radiant <x>.
Calculates the bitwise Inversion of <x>.
Important:
Due to limitations in precision of math results (because WinDarab is using 32-Bit IEEE-float
values) there are problems, if the resulting value is too big. E.g. the result of BitInvert(128)
is wrong, while the result of BitInvert(255) is correct.
The precision problem occurs only, when saving the math result in memory. While
evaluation the expression, there won’t be any precision issues.
This means that the expression can evaluate a maximum of 32-Bit values, but the final
result should be smaller.
Appendix
Page 269 of 282
Trace functions
Ave
average(<Channel>;>Sampl
es>)
delta(<Channel>)
dn
ds
dt
LapAve(<Channel>)
LapMax(<Channel>)
LapMin(<Channel>)
Lookup(<TableName>;<par
am1>;<param2>;…)
Max(<Channel>)
Min(<Channel>)
sigma(<Channel>)
ValueAtSample(<Channel>;
<Sample>)
Calculates the average value of a channel for x(n) within the range n<Samples> to n+<Samples>.
Calculates the difference between Channel(x(n)) and Channel(x(n-1))
Calculates the difference Samples(x(n)) and Samples(x(n-1)).
Calculates the difference between xDist(x(n)) and xDist(x(n-1)).
Calculates the difference between xTime(x(n)) and xTime(x(n-1)).
Calculates the average value for a channel within the current lap.
Calculates the maximum value of a channel within the current lap.
Calculates the minimum value of a channel within the current lap.
The lookup table is called with the given parameters which specify the
dimensional values.
Calculates the maximum value of a channel.
Calculates the minimum value of a channel.
Calculates the sum of Channel(x(0)) to Channel(x(n)).
Returns the value of the channel at the given sample position.
IIR Filter Functions
WinDarab provides seven filter functions:
bandpass
bandpassFIR
lowpass
lowpassFIR
highpass
highpassFIR
stopband
WinDarab supports a number of different approximation techniques and frequencies for each of these
filters.
Tip:
Using the WinDarab Filter Assistant simplifies the assembly of filter functions considerably.
bandpass
Syntax:
bandpass (<Technique>;<Order>;<Frequency Range>;<Expression>)
Parameters:
<Technique>
Appendix
<Order>
<Frequency Range>
Page 270 of 282
Butterworth
1 / 2 / 3 / 4 / 5 / 50:100 / 50:200 /
6 / 7 / 8 / 9 / 10 / 100:200 / 150:200
11 / 12
bandpassFIR
Syntax:
bandpassFIR(<Order>, <lowerCutoff>, <upperCutoff>, <Channel>)
The channel is filtered using a FIR-bandpass-filter of the given order (>=4th order) and a cutoff frequency
[Hz].
lowpass
Syntax:
lowpass (<Technique>;<Order>;<Frequency>;<Expression>)
Parameters:
<Technique>
<Order>
<Frequency>
Chebyshev-I
4 / 8 / 10 / 12
5 / 10 / 20 / 50 / 100 / 150 / 200
Chebyshev-II
4 / 8 / 10 / 12
5 / 10 / 20 / 50 / 100 / 150 / 200
Elliptic
4 / 8 / 10 / 12
5 / 10 / 20 / 50 / 100 / 150 / 200
Butterworth
1 / 2 / 3 / 4 / 5 / 5 / 10 / 20 / 50 / 100 / 150 / 200
6 / 7 / 8 / 9 / 10 /
11 / 12
FIR-Hamming
40 / 50 / 60
5 / 10 / 20 / 50 / 100
FIR-Remez
60
5 / 10 / 20 / 50 / 100
lowpassFIR
Syntax:
lowpassFIR(<Order>, <CutoffFreq>, <Channel>)
The channel is filtered using a FIR-lowpass-filter of the given order (>=4th order) and cutoff frequency [Hz].
highpass
Syntax:
highpass (<Technique>;<Order>;<Frequency>;<Expression>)
Parameters:
<Technique>
<Order>
<Frequency>
Chebyshev-I
4 / 8 / 10 / 12
5 / 10 / 20 / 50 / 100 / 150 / 200
Chebyshev-II
4 / 8 / 10 / 12
5 / 10 / 20 / 50 / 100 / 150 / 200
Elliptic
4 / 8 / 10 / 12
5 / 10 / 20 / 50 / 100 / 150 / 200
Butterworth
1 / 2 / 3 / 4 / 5 / 5 / 10 / 20 / 50 / 100 / 150 / 200
6 / 7 / 8 / 9 / 10 /
Appendix
Page 271 of 282
11 / 12
FIR-Hamming
40 / 50 / 60
5 / 10 / 20 / 50 / 100
highpassFIR
Syntax:
highpassFIR (<Order>, <CutoffFreq>, <Channel>)
The channel is filtered using a FIR-highpass-filter of the given order (>=4th order) and cutoff frequency [Hz].
stopband
Syntax:
stopband (<Technique>;<Order>;<Frequency Range>;<Expression>)
Parameters:
<Technique>
<Order>
<Frequency Range>*
Chebyshev-I
4 / 8 / 10 / 12
50~100 / 50~200 /
100~200 / 150~200
Chebyshev-II
4 / 8 / 10 / 12
50~100 / 50~200 /
100~200 / 150~200
Elliptic
4 / 8 / 10 / 12
50~100 / 50~200 /
100~200 / 150~200
Butterworth
1 / 2 / 3 / 4 / 5 / 50~100 / 50~200 /
6 / 7 / 8 / 9 / 10 / 100~200 / 150~200
11 / 12
The use of the diacritic mark "~" (tilde) between the upper and the lower frequency is mandatory.
Lookup Function
Syntax:
Lookup(<LookupTable>;<param1>[;<param2>…])
Parameters:
LookupTable: The base table for the lookup-value.
For more information on lookup tables see LookupTables.
param1-x: The input parameters for each dimension of the lookup table
Note:
The number of the dimensional-parameters has to match the dimension of the lookup table.
Appendix
Page 272 of 282
Examples
The following examples use a few channels and functions which are:
speed: The speed of the car in km/h
lapctr: The current lapnumber
HOLD: The last value calculated by this math-channel
dt: Time past since the last calculated sample of this math-channel
sigma: Sums up the expression inside for the whole file up to the current sample
Example with sigma and dt: Integration over time
There is no function for integrating a channel over time. No matter, integration over time is simply the
sum of a channel multiplied with the delta-time:
In this example the speed is integrated over the file. The result is the distance driven (assuming the unit of
speed is km/h, we have to divide by 3.6 to receive the distance in meters)
sigma(speed*dt) / 3.6
Example with delta and dt: Derivation of a channel
To derivate a channel by time, you have to divide the change of the channel by the change of time:
delta(channel)/dt
Example with HOLD: Filtering measurement errors
Assuming the speed of a car is between 0 and 400 km/h. If we want to clean the speed-channel from all
measurement errors (values outside the valid speed-range) we have to find the error values.
If (speed <0 OR speed >400;0;speed)
Now every wrong value is set to 0. Instead of using this static value, you may want to keep the latest
reasonable value. This can be accomplished by inserting the HOLD-function: HOLD returns the previous
result of the math channel.
If(speed < 0 OR speed > 400; HOLD; speed)
Example with sigma, dt, delta, and HOLD: Calculating “highspeed”-duration for each lap
In this example you are shown how to use these functions to generate a math channel that calculates the
duration driven with more than 200km/h for each lap.
First thing to do is to sum up the time, the car is faster than 200km/h.
sigma(if(speed > 200; dt; 0))
The if-function returns the time since the last sample when speed is greater 200 and 0 if not. Sigma sums
up the results of the if-function to get the time past driving faster than 200km/h.
Note:
This current function sums up the time for the whole file.
Appendix
Page 273 of 282
If you want the time being calculated for each lap individual, you have to reset the sum at the each
laptrigger.
Unfortunately the sigma-function always works on the whole file, so you need to reset the function
manually by subtracting the current value.
sigma(if(speed > 200; dt; 0) - if(delta(lapctr) <> 0;HOLD;0))
The new part in this function does exactly that. If the lap number changed (delta(lapctr) <> 0) sigma adds
the negated current value to set the sum back to zero.
Note:
Instead of delta(lapctr) you can also use {laptrig} <> 0.
Whatever your choice is, take care of the calculation period of your math channel. Especially
{laptrig} is a single peak at the lap trigger and can be easily missed, if the calculation period
is set to “Slowest channel”. Therefore using the lap counter is better, but again: If the period
is “slowest channel” and your speed is measured faster, you have to select “fastest
channel”!
For more information see also “Computing Tab”.
Hotkeys
This section lists all available hotkeys supported by WinDarab
Global
F1
Ctrl+F1
F2
F3
Show help
Minimize/maximize ribbon
Create new worksheet
Go to the channels pane
F5
F6
F7
F9
F10
Shows the settings dialog for the window
Loads a configuration for the window
Saves the configuration for the window
Load desktop settings
Save the desktop settings
F12
Toggle desktop layout
Ctrl+E
Ctrl+S
Ctrl+I
Ctrl+R
Open measurement file
Close a measurement file
Open the initialize flashcard dialog
Open the import dialog
Strg+Shift+C
Show/Hide all captions of the worksheets controls on the current worksheet
Ctrl+L
Zoom current lap and align all overlays
Ctrl+F4
Shift+F4
Ctrl+F6
Shift+Ctrl+F6
Close active worksheet
Close active worksheet control
Go to next worksheet
Go to previous worksheet
Appendix
Page 274 of 282
Ctrl+C
Ctrl+Insert
Ctrl+X
Shift+Del
Ctrl+V
Shift+Insert
Copy
Cut
Paste
File Explorer Pane
R
F
Ctrl+F
Replace the active overlay
Go to the fastest lap of the selected overlay
Select and align the fastest laps of all overlays
Channels pane
/
*
Minimize tree (in tree mode only)
Expand tree (in tree mode only)
Oscilloscope
G
P
N
F
Ctrl+F
+
M
L
S
T
A
Ctrl+Shift+A
Ctrl+A
Insert
R
Delete
Ctrl+Delete
Z
Ctrl+Backspace
Ctrl+Z
F4
Space
X
Ctrl+X
Ctrl+Shift+X
Shift+X
H
B
C
Appendix
Show/Hide the grid
Go to the previous lap
Go to the next lap
Go to the fastest lap
Select and align the fastest laps of all the overlays
Zoom in
Zoom out
Zoom the marked range
Zoom the current lap
Zoom the current Segment
Zoom between the current marker position and a set tag
Show all
Select all channels
Select all channels of the current area
Show the insert menu
Show the replace menu
Show the delete menu
Clear the oscilloscope
Set the zero-offset
Undo the last zoom
Enable/Disable overlay shifting
Set/Clear tag
Toggle axis mode
Switch axis mode to custom
Switch axis mode to overlapped
Switch axis mode to stacked
Show/Hide channel
Enable/Disable channel blinking
Show channel color selector
Page 275 of 282
Y
Shift+Y
Ctrl+Y
D
V
W
I
Ctrl+0
Ctrl+9
Show channels y-range dialog
Set the channels y-range to the default values
Set the channels y-range automatically
Shows the channels display options menu
Shows the oscilloscope display menu
Shows the wide cursor menu
Show/Hide quick info of a channel
Show the zero line
Set the constant line
Inform window
Left
Right
PageUp
PageDown
Select
Select
Select
Select
previous overlay
next overlay
next page
previous page
Racetrack
A
Ctrl+2
Ctrl+3
Ctrl+P
F6
F7
Show all
Switch to 2D-view
Switch to 3D-view
Toggle perspective view (3D only)
Load racetrack
Save racetrack
Ctrl+Z
Ctrl+Backspace
Undo the last zoom
XY-Plot
A
I
F11
Ctrl+Space
Space
Insert
Delete
Ctrl+Z
Ctrl+Backspace
Show All
Show Info
Show components
Show regression lines
Insert a user line
Delete a user line
Undo the last zoom
Histogram
A
Ctrl+3
Ctrl+B
Ctrl+L
Ctrl+P
Y
Ctrl+Y
Show all
Switch to 3D view
Switch to 2D bar view
Switch to 2D line view
Toggle perspective view (3D only)
Open the y-axis dialog
Automatically adjust the y-axis settings
Ctrl+Z
Undo the last zoom
Appendix
Page 276 of 282
Ctrl+Backspace
Distribution
A
Ctrl+2
Ctrl+3
Ctrl+G
Ctrl+L
Ctrl+P
Ctrl+S
Ctrl+V
Show all (3D only)
Switch to 2D-view
Switch to 3D-view
Toggle grid (3D only)
Toggle height lines (3D only)
Toggle perspective view (3D only)
Toggle solid slices (3D only)
Toggle 3D vertices (3D only)
Ctrl+Z
Ctrl+Backspace
Undo the last zoom
Fast Fourier Transformation
A
Ctrl+2
Ctrl+3
Ctrl+B
Ctrl+G
Ctrl+L
Ctrl+P
Ctrl+S
Ctrl+V
Show all
Switch to 2D line view
Switch to 3D-view
Switch to 2D bar view
Toggle grid (3D only)
Toggle height lines (3D only)
Toggle perspective view (3D only)
Toggle solid slices (3D only)
Toggle 3D vertices (3D only)
Ctrl+Z
Ctrl+Backspace
Undo the last zoom
Flow Chart
V
Delete
Show/Edit variables
Delete the selected item
OutingReport
F3
F4
Show channel view
Show segment view
Lap analysis
I
Show/hide information
Instrument Panel
Ctrl+D
Ctrl+F6
Insert
Delete
Appendix
Duplicate an item
Add settings
Show the insert item menu
Delete an Element
Page 277 of 282
ASCII Import File Format
WinDarab supports the importing of logged data series with the help of ASCII files. The following passages
contain information about the structure of ASCII files as well as the (optional) Channel Definition File
structure.
Special Channels:
The following channels should be defined and receive the suggested names:
time [s]
dist [m]
Time
Distance
Channel names “time” and “dist” will be used as “xtime” and “dist”, if “xdist” or “xtime” is not available.
Miscellaneous Notes:
A channel name <Channel> may currently contain no more than 7 characters.
An unit of measurement <Unit> may currently not longer than 4 characters.
The character “ ” (space) and “[” can not to be used in label names (channel name <Channel> or unit
<Unit>) . All other characters are allowed.
Use a decimal point when entering numeric values.
The character “.” (dot) and “,” (comma) are interpreted as decimal point. For each value in a file may
be used a different decimal point, but within a single value only one of both can be used.
Any numbers can use a colon (-> ":") instead of a decimal comma/point (-> "." / ",")
Semicolon is used as field separator
No separator is allowed for thousand grouping.
There should be at least one space, or one tab space, between “words” and values.
Channel values are saved as 32-Bit-Float values.
When a value has the prefix “0x” or the suffix “h”, it will be recognized as hex.
ASCII Files may contain
1. as many comment lines as you would like. Each comment line must begin with the number sign (#).
2. one line for the definition of channel columns.
<Name1> [<Unit1>]
<Name2> [<Unit2>] ...
3. one line for channel values per record.
Example
#
# This is a comment
#
xTime [s]
0.0
0.1
0.2
0.4
xDist [m]
0.0
2.0
4.0
10.0
Speed [km/h]
0.0
100.0
200.0
160.0
rev [rpm]
0.0
1000.0
2000.0
2500.0
Channel Definition Files may contain
1. as many comment lines you would like.
Each comment line must begin with the number sign (#).
2. one line per channel: <Name> [<Unit>] <Minimum> <Maximum>
Appendix
Page 278 of 282
Example
#
# This is a comment
#
xTime
xDist
Speed
Rev
a_thr
[s]
[m]
[km/h]
[rpm]
[deg]
0.0
0.0
0.0
0
-26
500.0
10000.0
300
14000
26
ASCII Extract File Format
The format of ASCII extract files corresponds to ASCII import files.
WinDarab writes the following information (in the form of a comment) to the ASCII file:
Date of file creation
Name of Logged Data File
Extracted area
Note:
Channel columns are separated with a tab.
Numbers are displayed with a decimal point.
The following characters are replaced in ASCII format as follows:
“ “ (space) “_” (underline)
“[“ “(“
“]” “)”
Miscellaneous Settings
Some WinDarab settings can only be changed in the configuration file “setting.ini” located in WinDarabs
Configuration directory.
The available options will be discussed below:
Deleting Folders and Files
Initial settings in Darab Explorer have been made to prevent the accidental deletions of folders and files.
The delete function will be de-activated when you receive your software.
It is possible to delete Base Directories because deleting a Base Directory does not actually
delete data, but merely a link to certain files.
Tip:
It is possible to delete folders and files at any time using Windows Explorer.
Appendix
Page 279 of 282
If you would like to activate (or deactivate) the default settings for the delete function yourself, please
make the following entries in your configuration file:
[DarabExplorer]
AllowDeleteLocation=1
AllowDeleteFolder=1
AllowDeleteFile=1
AllowDeleteSelection=1
One „1“ equals “activate”; zero „0“ equals “deactivated”.
Reading Data
Reading Data with
FREE WinDarab
version
Reading Data with
non-FREE WinDarab
version
If a user reads data from FlashCard using the Free-Version of WinDarab, the
Darab file protection will be removed from the file. This means that the file can
be read by any version of WinDarab.
Any version of WinDarab (except FREE-Version) can import any protected data
from FlashCard and save the data as a Darab-Bin-File. But if the file is protected by
project code which is not allowed by licensing, the file still cannot be opened.
Auto resolving of supplicated channel names
If a file contains channels with the same name WinDarab automatically appends the name of
the data source to all channels except the first one.
If no data source information is available WinDarab will append a unique index. Because the first channel is
not changed the second channel will get the index 2.
If a data source starts with ‘-‘, the channel will always be renamed if the data source of the other channel
doesn’t start with a ‘-‘.
If a data source starts with ‘+‘, the channel won’t be renamed if the data source of the other channel
doesn’t start with a ‘+‘.
If the data source name of both channels start with either ‘+’ or ‘-‘, the channel renaming will be handled as
is there is no preferred data source.
If even the appending of the data source name will not result in a unique channel name WinDarab will
append an additional index to the resulting channel name.
Finally all channel names will be unique.
The data source name is always appended to the channel description.
WinDarab assigns the data source “-UserDefinied” to all math channels.
Appendix
Page 280 of 282
Appendix
Page 281 of 282
Appendix
Page 282 of 282