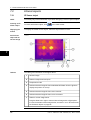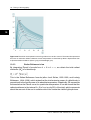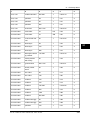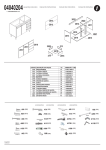
1
nual –
User’s manual
User’s manual –
Benutzerhandbuch – Manual del usuario – Manuel de l’utilisateur –
Manuale dell’utente – Manual
do utilizador – Felhas-
Benutzerhandbuch – Manual del usuario – Manuel de l’utilisateur – Manuale dell’utente – Manual do utilizador – Felhasználói kézikönyv – Käyttäjän opas – Betjeningsználói kézikönyv – Käyttäjän opas –
Betjeningsvejledning – Brukerveiledning – Instrukcja obsługi – Bruksanvisning – Kullanım
dning – Brukerveiledning – Instrukcja obsługi – Bruksanvisning – Kullanım Kılavuzu – Uživatelská příručka – Gebruikershandleiding
Kılavuzu – Uživatelská příručka – Gebruikershandleiding
FLIR Reporter Professional
Professional Edition. Version 8.3
Publ. No.
Revision
Language
Issue date
1558567
a269
English (EN)
March 18, 2008
Notice to user
1
Customer help
2
Installation
3
About ThermaCAM™ Center
4
Searching for files
5
Creating a report
6
Screen elements & how to use them
7
Creating a custom report template
8
Creating Microsoft® Word document properties
9
Creating text comment files
10
Creating emissivity table files
11
Creating formulas
12
Converting radiometric sequence files
13
Software reference section
14
Supported file formats in the IR Viewer object
15
About FLIR Systems
16
Thermographic measurement techniques
17
History of infrared technology
18
Theory of thermography
19
The measurement formula
20
Emissivity tables
21
Glossary
22
Index
23
FLIR Reporter
Professional
User’s manual
Publ. No. 1558567 Rev. a269 – ENGLISH (EN) – March 18, 2008
Legal disclaimer
All products manufactured by FLIR Systems are warranted against defective materials and workmanship for a period of one (1) year from the
delivery date of the original purchase, provided such products have been under normal storage, use and service, and in accordance with
FLIR Systems instruction.
All products not manufactured by FLIR Systems included in systems delivered by FLIR Systems to the original purchaser carry the warranty,
if any, of the particular supplier only and FLIR Systems has no responsibility whatsoever for such products.
The warranty extends only to the original purchaser and is not transferable. It is not applicable to any product which has been subjected to
misuse, neglect, accident or abnormal conditions of operation. Expendable parts are excluded from the warranty.
In the case of a defect in a product covered by this warranty the product must not be further used in order to prevent additional damage. The
purchaser shall promptly report any defect to FLIR Systems or this warranty will not apply.
FLIR Systems will, at its option, repair or replace any such defective product free of charge if, upon inspection, it proves to be defective in
material or workmanship and provided that it is returned to FLIR Systems within the said one-year period.
FLIR Systems has no other obligation or liability for defects than those set forth above.
No other warranty is expressed or implied. FLIR Systems specifically disclaims the implied warranties of merchantability and fitness for a
particular purpose.
FLIR Systems shall not be liable for any direct, indirect, special, incidental or consequential loss or damage, whether based on contract, tort
or any other legal theory.
Copyright
© FLIR Systems, 2008. All rights reserved worldwide. No parts of the software including source code may be reproduced, transmitted, transcribed
or translated into any language or computer language in any form or by any means, electronic, magnetic, optical, manual or otherwise,
without the prior written permission of FLIR Systems.
This manual must not, in whole or part, be copied, photocopied, reproduced, translated or transmitted to any electronic medium or machine
readable form without prior consent, in writing, from FLIR Systems.
Names and marks appearing on the products herein are either registered trademarks or trademarks of FLIR Systems and/or its subsidiaries.
All other trademarks, trade names or company names referenced herein are used for identification only and are the property of their respective
owners.
Quality assurance
The Quality Management System under which these products are developed and manufactured has been certified in accordance with the
ISO 9001 standard.
FLIR Systems is committed to a policy of continuous development; therefore we reserve the right to make changes and improvements on
any of the products described in this manual without prior notice.
Patents
This product is protected by patents, design patents, patents pending, or design patents pending.
viii
Publ. No. 1558567 Rev. a269 – ENGLISH (EN) – March 18, 2008
Table of contents
1
Notice to user ..................................................................................................................................
1
2
Customer help ................................................................................................................................
3
3
Installation .......................................................................................................................................
3.1
System requirements ...........................................................................................................
3.2
Installation of FLIR Reporter Professional ............................................................................
3.2.1
Windows® XP installation ....................................................................................
3.2.2
Windows® Vista installation .................................................................................
3.2.3
Troubleshooting licensing problems ....................................................................
3.3
Removing FLIR Reporter Professional .................................................................................
5
5
6
6
7
8
9
4
About ThermaCAM™ Center ......................................................................................................... 11
5
Searching for files .......................................................................................................................... 13
6
Creating a report .............................................................................................................................
6.1
Creating a report using the Wizard ......................................................................................
6.2
Creating a report using the QuickInsert menu command ...................................................
6.3
Creating a report using the Rapid Report Manager ............................................................
6.4
Creating a report from Windows® Explorer ........................................................................
16
16
21
22
23
7
Screen elements & how to use them ............................................................................................
7.1
Toolbars & toolbar buttons ...................................................................................................
7.1.1
Main toolbar ..........................................................................................................
7.1.2
IR Viewer object toolbar ........................................................................................
7.1.3
IR Profile object toolbar ........................................................................................
7.1.4
IR Histogram object toolbar ..................................................................................
7.1.5
IR Trending object toolbar ....................................................................................
7.2
Infrared objects .....................................................................................................................
7.2.1
IR Viewer object ....................................................................................................
7.2.2
IR Profile object .....................................................................................................
7.2.3
IR Histogram object ..............................................................................................
7.2.4
IR Trending object .................................................................................................
7.2.5
Digital Photo object ..............................................................................................
7.2.6
Result Table object ................................................................................................
7.2.7
Field object ...........................................................................................................
7.2.8
Summary Table object ..........................................................................................
24
24
24
26
28
29
30
32
32
35
36
38
40
41
42
43
8
Creating a custom report template ...............................................................................................
8.1
A note about working in the Microsoft® Word environment ...............................................
8.2
Creating a custom infrared report template .........................................................................
8.2.1
About the front & back covers ..............................................................................
8.2.2
Creating the infrared report template pages ........................................................
8.2.2.1
Inserting IR Viewer objects and Digital Photo objects .....................
8.2.2.2
Inserting IR Histogram objects .........................................................
8.2.2.3
Inserting IR Profile objects ................................................................
8.2.2.4
Inserting IR Trending objects ............................................................
8.2.2.5
Inserting Result Table objects ...........................................................
8.2.2.6
Inserting Summary Table objects .....................................................
8.2.2.7
Inserting Field objects .......................................................................
45
45
46
47
48
49
50
51
52
53
54
55
Publ. No. 1558567 Rev. a269 – ENGLISH (EN) – March 18, 2008
ix
8.2.2.8
Connecting objects ...........................................................................
8.2.2.9
Resizing infrared objects ...................................................................
8.2.2.10
Moving measurement tools ..............................................................
8.2.2.11
Selecting measurement tools ...........................................................
8.2.2.12
Moving between measurement tools ...............................................
8.2.2.13
Cloning measurement tools ..............................................................
8.2.2.14
Deleting measurement tools .............................................................
8.2.2.15
Deleting infrared objects ...................................................................
8.2.2.16
Deleting Result Table objects ............................................................
8.2.2.17
Deleting Summary Table objects ......................................................
8.2.2.18
Deleting Field objects .......................................................................
Creating a custom infrared report template based on an existing template .......................
56
57
58
59
60
61
62
63
64
65
66
67
Creating Microsoft® Word document properties .......................................................................
9.1
Creating & editing Microsoft® Word document properties .................................................
9.2
Creating a Microsoft® Word field and linking the field to a document property ................
9.2.1
In Microsoft® Word XP .........................................................................................
68
68
70
70
8.3
9
10 Creating text comment files .......................................................................................................... 71
10.1 Creating a text comment file ................................................................................................ 71
10.2 Linking a text comment to a Result Table object ................................................................. 72
11 Creating emissivity table files ....................................................................................................... 73
12 Creating formulas ........................................................................................................................... 75
12.1 Creating a simple formula .................................................................................................... 76
12.2 Creating a conditional formula using the if statement ......................................................... 78
13 Converting radiometric sequence files ........................................................................................ 81
14 Software reference section ........................................................................................................... 83
14.1 FLIR Reporter Professional menu ........................................................................................ 84
14.2 Explanation of the QuickInsert dialog box ........................................................................... 86
14.3 Shortcut menu for IR Viewer objects .................................................................................... 87
14.3.1 Settings dialog box ............................................................................................... 89
14.3.1.1
Colors tab .......................................................................................... 89
14.3.1.2
Isotherms tab .................................................................................... 90
14.3.1.3
Annotations tab ................................................................................. 92
14.3.1.4
Object Parameters tab ...................................................................... 93
14.3.1.5
Preferences tab ................................................................................. 95
14.4 Shortcut menu for isotherms and IR scales ......................................................................... 96
14.5 Shortcut menu for measurement tools ................................................................................ 97
14.5.1 Settings dialog box ............................................................................................... 98
14.5.1.1
General tab ........................................................................................ 98
14.5.1.2
Object Parameters tab ...................................................................... 99
14.5.1.3
Size/Position tab ................................................................................ 100
14.6 Shortcut menu for IR Profile objects .................................................................................... 101
14.6.1 Settings dialog box ............................................................................................... 102
14.6.1.1
General tab ........................................................................................ 102
14.6.1.2
Color tab ............................................................................................ 103
14.6.1.3
Lines tab ............................................................................................ 104
14.7 Shortcut menu for IR Histogram objects .............................................................................. 105
14.7.1 Settings dialog box ............................................................................................... 106
14.7.1.1
General tab ........................................................................................ 106
x
Publ. No. 1558567 Rev. a269 – ENGLISH (EN) – March 18, 2008
14.7.1.2
Color tab ............................................................................................ 108
14.7.1.3
Lines tab ............................................................................................ 109
14.8 Shortcut menu for IR Trending objects ................................................................................ 110
14.8.1 Settings dialog box ............................................................................................... 111
14.8.1.1
Connect tab ....................................................................................... 111
14.8.1.2
General tab ........................................................................................ 112
14.8.1.3
Prediction tab .................................................................................... 113
14.8.1.4
Color tab ............................................................................................ 115
14.8.1.5
Line tab .............................................................................................. 116
14.9 Shortcut menu for Digital Photo objects .............................................................................. 117
14.10 Shortcut menu for Result table objects ................................................................................ 118
14.11 Shortcut menu for Field objects ........................................................................................... 119
14.12 Shortcut menu for Summary Table objects ......................................................................... 120
15 Supported file formats in the IR Viewer object ........................................................................... 121
16 About FLIR Systems ....................................................................................................................... 123
16.1 More than just an infrared camera ....................................................................................... 124
16.2 Sharing our knowledge ........................................................................................................ 124
16.3 Supporting our customers ................................................................................................... 124
16.4 A few images from our facilities ........................................................................................... 125
17 Thermographic measurement techniques ................................................................................... 127
17.1 Introduction .......................................................................................................................... 127
17.2 Emissivity .............................................................................................................................. 127
17.2.1 Finding the emissivity of a sample ....................................................................... 128
17.2.1.1
Step 1: Determining reflected apparent temperature ....................... 128
17.2.1.2
Step 2: Determining the emissivity ................................................... 130
17.3 Reflected apparent temperature .......................................................................................... 131
17.4 Distance ................................................................................................................................ 131
17.5 Relative humidity .................................................................................................................. 131
17.6 Other parameters .................................................................................................................. 131
18 History of infrared technology ...................................................................................................... 133
19 Theory of thermography ................................................................................................................ 137
19.1 Introduction ........................................................................................................................... 137
19.2 The electromagnetic spectrum ............................................................................................ 137
19.3 Blackbody radiation .............................................................................................................. 138
19.3.1 Planck’s law .......................................................................................................... 139
19.3.2 Wien’s displacement law ...................................................................................... 140
19.3.3 Stefan-Boltzmann's law ......................................................................................... 142
19.3.4 Non-blackbody emitters ....................................................................................... 143
19.4 Infrared semi-transparent materials ..................................................................................... 145
20 The measurement formula ............................................................................................................. 147
21 Emissivity tables ............................................................................................................................. 153
21.1 References ............................................................................................................................ 153
21.2 Important note about the emissivity tables .......................................................................... 153
21.3 Tables .................................................................................................................................... 153
22 Glossary ........................................................................................................................................... 169
Index ................................................................................................................................................ 173
Publ. No. 1558567 Rev. a269 – ENGLISH (EN) – March 18, 2008
xi
xii
Publ. No. 1558567 Rev. a269 – ENGLISH (EN) – March 18, 2008
1
Notice to user
Typographical
conventions
This manual uses the following typographical conventions:
■
■
■
■
User-to-user
forums
1
Semibold is used for menu names, menu commands and labels, and buttons in
dialog boxes.
Italic is used for important information.
Monospace is used for code samples.
UPPER CASE is used for names on keys and buttons.
Exchange ideas, problems, and infrared solutions with fellow thermographers around
the world in our user-to-user forums. To go to the forums, visit:
http://www.infraredtraining.com/community/boards/
PC software
updates
FLIR Systems regularly issues PC software updates and service releases on the
support pages of the company website:
http://www.flirthermography.com
To find the latest updates and service releases, make that sure you select USA in
the Select country box in the top right corner of the page.
Training
To read about infrared training, visit:
http://www.infraredtraining.com
Additional license
information
This software is sold under a single user license. This license permits the user to install
and use the software on any compatible computer provided the software is used on
only one computer at a time. One (1) back-up copy of the software may also be made
for archive purposes.
Publ. No. 1558567 Rev. a269 – ENGLISH (EN) – March 18, 2008
1
1 – Notice to user
1
INTENTIONALLY LEFT BLANK
2
Publ. No. 1558567 Rev. a269 – ENGLISH (EN) – March 18, 2008
2
Customer help
General
For customer help, visit:
2
http://flir.custhelp.com
To submit a question to the customer help team, you must be a registered user. It
only takes a few minutes to register online. If you only want to search the knowledgebase for existing questions and answers, you do not need to be a registered user.
When you want to submit a question, make sure that you have the following information to hand:
■
■
■
■
■
■
The camera model
The camera serial number
The communication protocol, or method, between the camera and your PC (for
example, Ethernet, USB™, or FireWire™)
Operating system on your PC
Microsoft® Office version
Full name, publication number, and revision number of the manual
On the customer help site you will also be able to download program updates for
your camera.
Figure
This figure shows the welcome page of FLIR Systems customer help site:
10776203;a1
Publ. No. 1558567 Rev. a269 – ENGLISH (EN) – March 18, 2008
3
2 – Customer help
2
INTENTIONALLY LEFT BLANK
4
Publ. No. 1558567 Rev. a269 – ENGLISH (EN) – March 18, 2008
3
Installation
3.1
System requirements
Operating system
■
■
Hardware
Microsoft® Windows® Vista
Microsoft® Windows® XP Pro, with Service Pack 2 (SP2)
3
Microsoft® Windows® XP:
■
■
■
■
■
■
■
Personal computer with an Intel® 800 MHz Pentium processor, or an AMD Opteron,
AMD Athlon 64, or AMD Athlon XP processor
512 MB of RAM, or greater
20 GB of available hard disk space
CD-ROM or DVD-ROM drive
Super VGA (1024 × 768) or higher-resolution monitor
Internet access required for web updates
Keyboard and Microsoft® mouse, or a compatible pointing device
Microsoft® Windows® Vista:
■
■
■
■
■
Personal computer with a 1 GHz 32-bit (x86) processor
1 GB of RAM, or greater
40 GB hard disk, with at least 15 GB available hard disk space
DVD-ROM drive
Support for DirectX 9 graphics with:
■
■
■
■
■
■
■
■
Software
■
■
Related topics
WDDM Driver
128 MB of graphics memory (minimum)
Pixel Shader 2.0 in hardware
32 bits per pixel
Super VGA (1024 × 768) or higher-resolution monitor
Internet access (fees may apply)
Audio output
Keyboard and Microsoft® mouse, or a compatible pointing device
Microsoft® Office® 2003 with Service Pack 3 (SP3)
Microsoft® Office® 2007 with Service Pack 1 (SP1)
For specific information about system requirements for the operating systems mentioned above, please visit: http://www.microsoft.com/windows/
Publ. No. 1558567 Rev. a269 – ENGLISH (EN) – March 18, 2008
5
3 – Installation
3.2
Installation of FLIR Reporter Professional
3.2.1
Windows® XP installation
NOTE
■
3
■
Procedure
If your software license agreement depends on using a security device, insert the
security device in an available USB connector of the computer before you enter
the license number.
The license number is printed on the back of the CD-ROM case.
Follow this procedure to install FLIR Reporter Professional on your computer:
1
Do one of the following:
■
■
If a previous program version of FLIR Reporter Professional is installed
on your computer, remove this version by using the Microsoft® Windows
Add or Remove Programs procedure (Start → Settings → Add or Remove Programs).
If a previous program version of FLIR Reporter Professional is not installed
on your computer, go to Step 2 below.
2
Close down all running programs, including Microsoft® Outlook.
3
Insert the FLIR Reporter Professional CD-ROM into the CD-ROM drive on
the computer. The installation should start automatically.
Should the installation not start automatically, start Windows® Explorer and
double-click SETUP.EXE on the CD-ROM.
4
NOTE
■
■
■
6
Follow the on-screen instructions.
A Neevia docCreator will be added to your computer by this installation procedure.
After installation, make sure the security level for macros in Microsoft® Word is
not set to Very high (Tools → Macros → Security). If it is, set it to High.
When opening a report, you will be asked whether to disable or enable the macros.
Always click Enable Macros.
Publ. No. 1558567 Rev. a269 – ENGLISH (EN) – March 18, 2008
3 – Installation
3.2.2
Windows® Vista installation
NOTE
■
■
Procedure
If your software license agreement depends on using a security device, insert the
security device in an available USB connector of the computer before you enter
the license number.
The license number is printed on the back of the CD-ROM case.
3
Follow this procedure to install FLIR Reporter Professional:
1
Do one of the following:
■
■
If a previous program version of FLIR Reporter Professional is installed
on your computer, remove this version by using the Microsoft® Windows
Add or Remove Programs procedure (Start → Settings → Add or Remove Programs).
If a previous program version of FLIR Reporter Professional is not installed
on your computer, go to Step 2 below.
2
Close down all running programs, including Microsoft® Outlook.
3
Insert the FLIR Reporter Professional CD-ROM into the CD-ROM drive on
the computer. The installation should start automatically.
Should the installation not start automatically, start Windows® Explorer and
double-click SETUP.EXE on the CD-ROM.
NOTE
■
■
■
4
In the Autoplay dialog box, click Run setup.exe (Published by FLIR Systems).
5
In the User Account Control dialog box, confirm that you want to install
FLIR Reporter Professional.
6
Follow the on-screen instructions.
A Neevia docCreator will be added to your computer by this installation procedure.
After installation, make sure the security level for macros in Microsoft® Word is
not set to Very high (Tools → Macros → Security). If it is, set it to High.
When opening a report, you will be asked whether to disable or enable the macros.
Always click Enable Macros.
Publ. No. 1558567 Rev. a269 – ENGLISH (EN) – March 18, 2008
7
3 – Installation
3.2.3
Troubleshooting licensing problems
Procedure
Follow this procedure to troubleshoot licensing problems:
1
When installing programs on Microsoft® Windows® it is advisable to close
other programs. This applies to FLIR Reporter Professional. Remember that
Microsoft® Windows® Update and other automatic installation programs
may be running in the background. Check that the Microsoft® Windows
Update icon is not visible in the System Tray area of the Windows Task Bar
(bottom right of your screen). Stop any other installation programs, or install
FLIR Reporter Professional at a later time when other installation programs
have finished.
2
Make sure that the license key you have entered corresponds to the current
program version.
3
Make sure that the license key you have entered is correct. Note the difference between '1' (digit) and 'l' (letter), '0' (digit) and 'O' (letter), etc.
4
If you have purchased the FLIR Reporter Professional Security Device program, make sure that you insert the USB device before you click Next.
5
When you have verified Steps 1 to 4 above, click Next again. If the problem
remains, please go to http://flir.custhelp.com to get support.
3
8
Publ. No. 1558567 Rev. a269 – ENGLISH (EN) – March 18, 2008
3 – Installation
3.3
Removing FLIR Reporter Professional
Procedure
Follow this procedure to remove FLIR Reporter Professional from your computer:
1
Close down all applications.
2
Insert the FLIR Reporter Professional CD-ROM into the CD-ROM drive on
the computer.
3
3
When the InstallShield Wizard dialog box is displayed, do the following:
1 Click Remove.
2 Click Next.
3 Follow the on-screen instructions.
NOTE
You can also remove FLIR Reporter Professional from your computer by using the
Microsoft® Windows Add or Remove Programs procedure (Start → Settings → Add
or Remove Programs.
Publ. No. 1558567 Rev. a269 – ENGLISH (EN) – March 18, 2008
9
3 – Installation
3
INTENTIONALLY LEFT BLANK
10
Publ. No. 1558567 Rev. a269 – ENGLISH (EN) – March 18, 2008
4
About ThermaCAM™ Center
General
When you install FLIR Reporter Professional, ThermaCAM™ Center will also be installed. ThermaCAM™ Center is a good starting point to begin working with infrared
reports.
Where do I find
ThermaCAM™
Center?
You find ThermaCAM™ Center under Programs on the Start menu (Start → Programs
→ FLIR Systems → ThermaCAM™ Center).
How to use
ThermaCAM™
Center
In ThermaCAM™ Center, you can do one or more of the following:
4
■
■
■
■
Automatically download program updates and news
Get access to the online help files for FLIR Reporter Professional
Find tutorials on how to create reports, report templates, edit text comment files,
and more
Find system information about your computer
Publ. No. 1558567 Rev. a269 – ENGLISH (EN) – March 18, 2008
11
4 – About ThermaCAM™ Center
4
INTENTIONALLY LEFT BLANK
12
Publ. No. 1558567 Rev. a269 – ENGLISH (EN) – March 18, 2008
5
Searching for files
General
After you have installed FLIR Reporter Professional, a task pane will be displayed to
the right in Microsoft® Word. At the top of the task pane, you can search for infrared
images, digital photos and a variety of other files on your hard disk drive. You can
then move these files to your report or report template by using a drag-and-drop
operation.
About search
parameters
The search engine is an exact match search engine and accepts alphabetic characters
(a–z, A–Z) and numerical characters (0–9). However, numerical characters will be
treated as text.
When you enter a search string the search engine searches for this string in any location of a file. This means that a search string such as ‘25’ can, for example, return
the following results:
■
■
■
■
■
About boolean
operators
IR_0025.jpg (‘25’ in the file name)
An image file with a text comment containing ‘25’
An image file with an image description containing ‘25’
An image file with a spotmeter that has a measurement result of +25°C
A Microsoft® Word document with a document property containing the expression
‘25’
You can combine search strings using boolean operators. Example:
■
■
To find an image file that contains both a text comment containing ‘10’ and a
spotmeter that has a measurement result of +25°C, use the AND boolean operator.
To find all files that either contains a text comment containing ‘10’ or a spotmeter
that has a measurement result of +25°C, use the OR boolean operator.
However, you can not use boolean operators in the following two example cases:
■
■
Procedure
To search for IR_0025.jpg (‘25’ in the file name) and a spotmeter that has a measurement result of +25°C
To search for IR_0025.jpg (‘25’ in the file name) or a spotmeter that has a measurement result of +25°C
Follow this procedure to search for the files you have indexed:
1
In the task pane in Microsoft® Word, type a search string.
2
To start the search, click Go.
The search engine will now search through all indexed files on your computer and display thumbnail images in the result table. You can now move
one or several files to the report or report template by using a drag-anddrop operation.
NOTE
For Microsoft® Word documents, only the following information is indexed:
■
■
Document properties
File name
Publ. No. 1558567 Rev. a269 – ENGLISH (EN) – March 18, 2008
13
5
5 – Searching for files
■
Modified date
The task pane will not be displayed if you have one of the following Microsoft® Office
versions:
■
■
Microsoft® Office 2003 Standard
Microsoft® Office 2007
5
14
Publ. No. 1558567 Rev. a269 – ENGLISH (EN) – March 18, 2008
5 – Searching for files
5
INTENTIONALLY LEFT BLANK
Publ. No. 1558567 Rev. a269 – ENGLISH (EN) – March 18, 2008
15
6
Creating a report
6.1
Creating a report using the Wizard
General
Using the Wizard gives you opportunities to fine-tune and adjust your report before
it is created.
In the Wizard you can select different report templates for different pages, move
pages up and down, play back voice comments, read and edit text comments and
Microsoft® Word document properties, and so on.
6
NOTE
Before your create an infrared report, a report template (a Microsoft® Word *.dot file)
must have been previously created. However, FLIR Reporter Professional ships with
several different report templates, which you may find useful.
Different ways to
start the Wizard
You can start the Wizard in three different ways:
■
■
■
16
By going to the Start menu and selecting a task on the program menu (Start →
Programs → FLIR Systems → FLIR Reporter Professional).
By going to the Start menu and selecting a task using ThermaCAM™ Center (Start
→ Programs → FLIR Systems → ThermaCAM™ Center).
By clicking the FLIR button on the main toolbar.
Publ. No. 1558567 Rev. a269 – ENGLISH (EN) – March 18, 2008
6 – Creating a report
6
INTENTIONALLY LEFT BLANK
Publ. No. 1558567 Rev. a269 – ENGLISH (EN) – March 18, 2008
17
6 – Creating a report
Procedure
Follow this procedure to create a report using the Wizard:
1
Start the Wizard.
2
On the Templates tab, select the report template that you want to use. A
preview of each page in the report template will be displayed in the preview
window.
10741803;a2
6
3
On the Images tab, do one of the following:
■
Click
and select the folder with the images that you want to include
in your report.
■
Click
to display a dialog box where you can seach for images on
your hard disk drive using creation date boolean operators, or in ThermaCAM™ Database 99 (if installed). For information about this program
and about database queries, see the user’s manual for ThermaCAM™
Database 99 (Publ. No. 1557403).
You can change the size of the thumbnail images by moving the slider at
the bottom of the middle pane.
For more information about searching, see section 5 – Searching for files
on page 13.
10766603;a1
18
Publ. No. 1558567 Rev. a269 – ENGLISH (EN) – March 18, 2008
6 – Creating a report
4
Select the images you want to include in your report. To add them to your
report, do one of the following:
■
■
5
To further modify your report, do one of the following:
■
■
■
6
Move the images to the right pane using a drag-and-drop operation.
Add the image or images to the right pane by right-clicking an image
and selecting Add All Images or Add Selected Images.
To change the order of pages, click Move page up or Move page down.
To delete pages, click Delete Page or Delete all pages.
To replace an image in the report, move another image to the location
of the image you want to replace.
On the Text Comments tab, do one or more of the following:
■
■
For images with a text comment you can edit the text comment value
by clicking it and then typing a new value.
For images with a voice comment you can play back the voice comment.
If a page contains more than one image with text comments or voice comments, you must select the image to be able to see the text comment or
play back the voice comment.
10742003;a2
7
On the Report Properties tab you can edit values for report properties by
clicking the value and then changing it or typing a new value.
10742103;a2
8
To create the report, click Finish.
Publ. No. 1558567 Rev. a269 – ENGLISH (EN) – March 18, 2008
19
6
6 – Creating a report
NOTE
If you are interrupted when you create the report, you can save the session and close
the Wizard. You can then open the session again and continue where you were before
you were interrupted.
You save and open a session by using the
bottom left corner of the Wizard window.
Related topics
button and the
button at the
Section 8 – Creating a custom report template on page 45
6
20
Publ. No. 1558567 Rev. a269 – ENGLISH (EN) – March 18, 2008
6 – Creating a report
6.2
Creating a report using the QuickInsert menu
command
General
A fast and convenient way to create a report is to use the QuickInsert menu command.
Using this command, you can select a pre-defined page layout, or choose to customize one of the page layout.
Using an existing
page layout
Follow this procedure to use an existing page layout:
Modifying a page
layout
Related topics
1
On the FLIR Reporter Professional menu, select QuickInsert. This will display
a dialog box with thumbnails of pre-defined page layouts.
2
To create a report, double-click the page layout you want to use.
3
In your Microsoft® Word document, finish your report by opening infrared
images and digital photos in the IR Viewer object and Digital Photo object.
6
Follow this procedure to modify an existing page layout:
■
■
1
On the FLIR Reporter Professional menu, select QuickInsert. This will display
a dialog box with thumbnails of pre-defined page layouts.
2
Select the page layout you want to modify.
3
Click Customize QuickInsert.
4
Make the necessary changes and save the page layout under a template
name of your choice. The page will now be modified based on the previous
settings.
Section 7 – Screen elements & how to use them on page 24
Section 14.2 – Explanation of the QuickInsert dialog box on page 86
Publ. No. 1558567 Rev. a269 – ENGLISH (EN) – March 18, 2008
21
6 – Creating a report
6.3
Creating a report using the Rapid Report Manager
General
Using the Rapid Report Manager, you create can one or several Rapid Report
Manager icons on your Desktop, each having different settings and using different
report templates.
When you drag-and-drop infrared or visual images to a Rapid Report Manager icon,
the report is created in the background and will be displayed in Microsoft® Word.
NOTE
Before your create an infrared report, a report template (a Microsoft® Word *.dot file)
must have been previously created. However, FLIR Reporter Professional ships with
several different report templates, which you may find useful.
Valid file format
The valid file format for a Rapid Report Manager file is *.r8r.
Procedure
Follow this procedure to create a report using the Rapid Report Manager:
6
Related topics
■
■
22
1
On the Start menu, click Rapid Report Manager (Start → FLIR Systems →
FLIR Reporter Professional → Rapid Report Manager).
2
On the File menu, select Select Template.
3
To select an existing report template, browse your file system.
4
To save this Rapid Report Manager file to Desktop, click Save As on the
File menu. Based on your requirements, you may want to create different
Rapid Report Manager files corresponding to different report templates.
5
Close the Rapid Report Manager.
6
Move the infrared and visual images to the Rapid Report Manager icon by
dragging the images from their environment, which can be the Desktop, a
folder in Windows® Explorer or from an e-mail containing the images in
Microsoft® Outlook.
7
The Rapid Report Manager will now create an infrared report according to
your report template and the settings in this particular Rapid Report Manager file. A progress indicator will be displayed during creation.
Section 7 – Screen elements & how to use them on page 24
Section 8 – Creating a custom report template on page 45
Publ. No. 1558567 Rev. a269 – ENGLISH (EN) – March 18, 2008
6 – Creating a report
6.4
Creating a report from Windows® Explorer
General
You can create a report directly from Windows® Explorer.
Procedure
Follow this procedure to create a report directly Windows® Explorer:
1
Start Windows® Explorer.
2
Go to the folder or device containing your infrared or visual images.
3
Select one or several infrared images.
4
Right-click the images.
5
On the shortcut menu that is displayed, select Use this template when
creating reports and click the report template you want to use.
The report is now created in the background and will be displayed in Microsoft® Word.
6
Related topics
Section 8 – Creating a custom report template on page 45
Publ. No. 1558567 Rev. a269 – ENGLISH (EN) – March 18, 2008
23
7
Screen elements & how to use
them
7.1
Toolbars & toolbar buttons
7.1.1
Main toolbar
NOTE
■
■
If you do not see the main toolbar, select the toolbar on the Toolbars menu (View
→ Toolbars → FLIR Reporter Professional).
You usually only insert infrared objects from the main toolbar when you design a
custom report template from scratch, or when you modify an existing report template.
Figure
10733803;a2
Explanation
This table gives an explanation to the figure above:
7
Click to insert an IR Viewer object for infrared images and sequence file.
An infrared image or sequence file contains valid temperature information
that may be output by overlaying different kinds of measurement tools,
such as spotmeters, profiles, areas, etc.
Click to insert an IR Profile object. An IR Profile object contains a graph
showing pixel values along a line in an infrared image.
Click to insert an IR Histogram object. An IR Histogram object contains
a graph illustrating how pixels in the image are distributed by graphing
the number of pixels at each temperature level.
Click to insert an IR Trending object. A trending object is a graphical
representation of measurement values or text comment values on the Yaxis by infrared report pages or infrared images on the X-axis sorted by
time, page number or text comment values. It can also display probable
trends, according to different algorithms.
Click to insert a Digital Photo object. This photo may be taken with a
stand-alone digital camera, or with the digital visual camera featured on
some FLIR Systems infrared cameras. Only use this method to insert a
photo when you design a report template. In all other situations, insert
photos by clicking Picture on the Insert menu (Insert → Picture → From
File).
Click to insert an Result Table object into your current document. A Result
Table object displays the results of the measurement tools laid out in the
infrared image, as well as other information that is related to the infrared
image.
24
Publ. No. 1558567 Rev. a269 – ENGLISH (EN) – March 18, 2008
7 – Screen elements & how to use them
Click to insert an Field object into your current document. A Field object
can be linked to values or texts in your infrared image.
Click to insert an Summary Table object. A Summary Table object lists
infrared data of your choice from all infrared images in the report, one
row per image.
Click this toolbar button and then click an infrared object to remove the
infrared object from your report.
Click to connect infrared objects to each other—for example, an IR Profile
object to an IR Viewer object.
Click to create a report using the QuickInsert function. For more information about this function, see the following:
■
■
Section 6.2 – Creating a report using the QuickInsert menu command
on page 21
Section 14.2 – Explanation of the QuickInsert dialog box on page 86
Click to duplicate the current page and insert the duplicate page after the
current page.
Click to delete the current page.
7
Click to enter the design mode of Microsoft® Word. Use this mode when
creating report templates and when you want to select and move objects.
Click to create an Adobe® PDF document of the Microsoft® Word document. A free version of Adobe® Reader is available from
http://adobe.com/products/acrobat/readstep2.html.
Click to display the task pane.
Click to display online help.
Publ. No. 1558567 Rev. a269 – ENGLISH (EN) – March 18, 2008
25
7 – Screen elements & how to use them
7.1.2
IR Viewer object toolbar
General
This toolbar is only displayed when an IR Viewer object is selected.
Figure
10733903;a2
Explanation
This table gives an explanation to the figure above:
Click to display the selection tool, which works similar to other selection
tools in word processing and desktop publishing programs. You use the
selection tool to select measurement tools.
Click to display a spotmeter with an attached flag that you can use to
identify temperature values by moving it over the infrared image. If you
click the image, the flying spotmeter tool will create a fixed spotmeter on
the image. To stop the flying spotmeter mode, press ESC.
Click to create fixed spotmeters on infrared images. The measurement
result can then be displayed in a Result Table object.
7
Click to create areas on infrared images. The measurement result can
then be displayed in a Result Table object.
Click to create ellipsoidal areas on infrared images. The measurement
result can then be displayed in a Result Table object.
Click to create polygon areas on infrared images. The measurement result
can then be displayed in a Result Table object.
Click to create a line on infrared images. The measurement result can
then be displayed in an IR Profile object.
Click to create a bent line on infrared images. The measurement result
can then be displayed in an IR Profile object.
Click to calculate the difference between two temperatures—for example,
two spotmeters, or a spotmeter and the maximum temperature in the
image. The result from the calculation will be displayed both as a ToolTip,
and as a result in the result table.
Using this toolbar button requires that you have laid out at least one
measurement function on your image.
Click to create a marker that you can move anywhere in an image and
point to an area of interest.
26
Publ. No. 1558567 Rev. a269 – ENGLISH (EN) – March 18, 2008
7 – Screen elements & how to use them
Click to display a menu where you can do one of the following:
■
■
■
■
■
Insert an isotherm between two temperature levels. This assigns a
color to all temperatures between two temperature levels in an image
with one preset color.
Insert an isotherm above a temperature level. This assigns a color to
all temperatures above a certain temperature level in an image with
one preset color.
Insert an isotherm below a temperature level. This assigns a color to
all temperatures below a certain temperature level in an image with
one preset color.
Set an isotherm color that is displayed when the camera detects an
area where there may be a risk of humidity in the building structure (a
humidity alarm).
Set an isotherm color that is displayed when the camera detects what
may be an insulation deficiency in a wall (an insulation alarm).
For more information about alarms, see section 14.3.1.2 – Isotherms tab
on page 90.
Click to draw a rectangle around the area you want to zoom in on.
When you are in zoom mode, a thumbnail image will appear in the top
right corner, indicating the location of the area you have zoomed in to.
You can move the area by clicking and holding down the left mouse
button, then moving the mouse in any direction.
To leave the zoom mode, either select 1× on the Zoom menu, or press
the space bar on the keyboard.
Click to fuse an infrared image with a digital photo. Fusing images can
make it easier to identify the exact position of temperature anomalies.
Related topics
■
■
■
■
■
■
■
■
Section 8.2.2.1 – Inserting IR Viewer objects and Digital Photo objects on page 49
Section 8.2.2.10 – Moving measurement tools on page 58
Section 8.2.2.11 – Selecting measurement tools on page 59
Section 8.2.2.12 – Moving between measurement tools on page 60
Section 8.2.2.13 – Cloning measurement tools on page 61
Section 8.2.2.14 – Deleting measurement tools on page 62
Section 8.2.2.15 – Deleting infrared objects on page 63
Section 14.3 – Shortcut menu for IR Viewer objects on page 87
Publ. No. 1558567 Rev. a269 – ENGLISH (EN) – March 18, 2008
27
7
7 – Screen elements & how to use them
7.1.3
IR Profile object toolbar
General
This toolbar is only displayed when an IR Profile object is selected.
Figure
10734003;a1
Explanation
This table gives an explanation to the figure above:
Click to create a three-dimensional rendering of the graph of the IR Profile
object.
Click to turn on/turn off the grid lines in the graph of the IR Profile object.
Related topics
■
■
■
■
Section 8.2.2.3 – Inserting IR Profile objects on page 51
Section 8.2.2.9 – Resizing infrared objects on page 57
Section 8.2.2.15 – Deleting infrared objects on page 63
Section 14.6 – Shortcut menu for IR Profile objects on page 101
7
28
Publ. No. 1558567 Rev. a269 – ENGLISH (EN) – March 18, 2008
7 – Screen elements & how to use them
7.1.4
IR Histogram object toolbar
General
This toolbar is only displayed when an IR Histogram object is selected.
Figure
10734103;a1
Explanation
This table gives an explanation to the figure above:
Click to create a three-dimensional rendering of the graph of the IR Histogram object.
Click to turn on/turn off colors in the graph of the IR Histogram object.
Click to turn on/turn off the grid lines in the graph of the IR Histogram
object.
Click to use a band threshold in the IR Histogram object.
A band threshold shows how many percent of the pixels are below a
lower temperature, between this lower temperature and a higher temperature, and above that higher temperature. The percentages are displayed
in the threshold legend below the IR Histogram object.
Click to use a step threshold in the IR Histogram object.
A step threshold shows how many percent of the pixels are below and
above a specific temperature. The percentages are displayed in the IR
Histogram object legend below the IR Histogram object.
Related topics
■
■
■
■
Section 8.2.2.2 – Inserting IR Histogram objects on page 50
Section 8.2.2.9 – Resizing infrared objects on page 57
Section 8.2.2.15 – Deleting infrared objects on page 63
Section 14.7 – Shortcut menu for IR Histogram objects on page 105
Publ. No. 1558567 Rev. a269 – ENGLISH (EN) – March 18, 2008
29
7
7 – Screen elements & how to use them
7.1.5
IR Trending object toolbar
General
This toolbar is only displayed when an IR Trending object is selected.
Figure
10734203;a1
Explanation
This table gives an explanation to the figure above:
Click to create a three-dimensional rendering of the graph of the IR
Trending object.
Click to turn on/turn off the grid lines in the graph of the IR Trending object.
Related topics
■
■
■
■
Section 8.2.2.4 – Inserting IR Trending objects on page 52
Section 8.2.2.9 – Resizing infrared objects on page 57
Section 8.2.2.15 – Deleting infrared objects on page 63
Section 14.8 – Shortcut menu for IR Trending objects on page 110
7
30
Publ. No. 1558567 Rev. a269 – ENGLISH (EN) – March 18, 2008
7 – Screen elements & how to use them
7
INTENTIONALLY LEFT BLANK
Publ. No. 1558567 Rev. a269 – ENGLISH (EN) – March 18, 2008
31
7 – Screen elements & how to use them
7.2
Infrared objects
7.2.1
IR Viewer object
NOTE
You usually only insert an IR Viewer object when designing a custom report template.
Inserting an IR
Viewer object
To insert an IR Viewer object, click
on the main toolbar.
Displaying the
toolbar
To display the toolbar for this object, select the object with the cursor.
An IR Viewer
object with an
infrared image
10758303;a2
Callouts
This table gives information to the figure above:
7
1
Infrared image
2
Sliders to adjust level and span
3
Temperature scale
4
Indicator that the image file has embedded GPS data. Click the globe to
display the position on a map.
5
Indicator that the image file has a text comment.
6
Indicator that the image file has a voice comment.
7
Slider to control image fusion.
Drag the slider left or right to fuse an infrared image with a digital photo.
For more information about image fusion, see section 14.3 – Shortcut menu
for IR Viewer objects on page 87.
32
Publ. No. 1558567 Rev. a269 – ENGLISH (EN) – March 18, 2008
7 – Screen elements & how to use them
An IR Viewer
object with a
sequence file
10741703;a2
Callouts
This table gives information to the figure above:
1
Infrared sequence
2
Sliders to adjust scale limits
3
Control buttons to play back the sequence file
4
Temperature scale
5
Indicator that the image file has embedded GPS data. Click the globe to
display the position on a map.
6
Progress indicator
7
Explanation
An IR Viewer object is a placeholder for infrared images and sequence files. An infrared
image contains valid temperature information that may be output by overlaying different kinds of measurement tools, such as spotmeters, profiles, areas, etc.
Common tasks
Common tasks related to the IR Viewer object include the following:
■
■
To change the scale limits, move the sliders left or right.
To control image fusion, drag the slider left or right to fuse an infrared image with
a digital photo. You can also use one of the following shortcuts to control image
fusion:
■
■
■
■
To go to fully infrared image or fully digital photo, click the corresponding icon
at the left or right end of the gauge.
To center the slider on the gauge, right-click the gauge.
To move the slider to a specific position on the gauge, double-click the gauge
at that position.
To move the slider in small increments to the left or to the right, click the gauge
to the left or to the right of the slider.
For more information about image fusion, see section 14.3 – Shortcut menu for
IR Viewer objects on page 87.
Publ. No. 1558567 Rev. a269 – ENGLISH (EN) – March 18, 2008
33
7 – Screen elements & how to use them
■
■
■
■
■
■
■
■
■
■
■
■
7
Related topics
■
■
■
■
■
34
To auto-adjust an image for best image brightness and contrast, right-click one
of the sliders.
To move both sliders together, press and hold SHIFT and move one of the sliders.
To open a new infrared image or sequence file, double-click the IR Viewer object.
You can also right-click the IR Viewer object and select Open.
To play back a voice comment, click the voice comment symbol. The voice
comment symbol is only visible when the image has a voice comment.
To see a text comment, click the text comment symbol. The text comment symbol
is only visible when the image has a text comment.
To display the position where the image was taken on a map, click the globe
symbol. This requires that the image contains GPS data.
To insert measurement tools, click the appropriate toolbar button.
To save under a different file name, right-click the image and select Save As.
To zoom in on an image, right-click the image and select Zoom.
To change settings related to colors, isotherms, text comments, object parameters
and preferences, right-click the image and select Settings.
To rotate the image left or right, right-click the image and select Rotate Left or
Rotate Right.
To insert measurement tools using a menu instead of the toolbar buttons, rightclick the image and select a measurement tool on the Measurement submenu.
Section 7.1.2 – IR Viewer object toolbar on page 26
Section 8.2.2.1 – Inserting IR Viewer objects and Digital Photo objects on page 49
Section 8.2.2.9 – Resizing infrared objects on page 57
Section 8.2.2.15 – Deleting infrared objects on page 63
Section 14.3 – Shortcut menu for IR Viewer objects on page 87
Publ. No. 1558567 Rev. a269 – ENGLISH (EN) – March 18, 2008
7 – Screen elements & how to use them
7.2.2
IR Profile object
NOTE
You usually only insert an IR Profile object when designing a custom report template.
Inserting an IR
Profile object
To insert an IR Profile object, click
on the main toolbar.
Displaying the
toolbar
To display the toolbar for this object, select the object with the cursor.
Figure
10738103;a1
7
Explanation
An IR Profile object contains a graph showing pixel values along a line in an infrared
image.
Common tasks
Common tasks related to the IR Profile object include the following:
■
■
■
■
■
Related topics
■
■
■
■
■
To create a three-dimensional rendering, click the appropriate toolbar button or
right-click the IR Profile object and select 3D View.
To turn on/turn off the grid lines, click the appropriate toolbar button or right-click
the IR Profile object and select Grid Lines.
To turn on/turn off the legend, right-click the IR Profile object and select Legend.
To swap X- and Y-axes, right-click the IR Profile object and select Swap X & Y
Axes.
To change settings related to general settings, color and lines, right-click the IR
Profile object and select Settings.
Section 7.1.3 – IR Profile object toolbar on page 28
Section 8.2.2.3 – Inserting IR Profile objects on page 51
Section 8.2.2.9 – Resizing infrared objects on page 57
Section 8.2.2.15 – Deleting infrared objects on page 63
Section 14.6 – Shortcut menu for IR Profile objects on page 101
Publ. No. 1558567 Rev. a269 – ENGLISH (EN) – March 18, 2008
35
7 – Screen elements & how to use them
7.2.3
IR Histogram object
NOTE
You usually only insert an IR Histogram object when designing a custom report
template.
Inserting an IR
Histogram object
To insert an IR Histogram object, click
on the main toolbar.
Displaying the
toolbar
To display the toolbar for this object, select the object with the cursor.
Figure
10738203;a1
Explanation
An IR Histogram object contains a graph illustrating how pixels in the image are distributed by graphing the number of pixels at each temperature level.
Common tasks
Common tasks related to the IR Histogram object include the following:
7
■
■
■
■
■
■
Related topics
■
■
■
■
■
36
To turn on/turn off three-dimensional rendering, click the appropriate toolbar
button or right-click the IR Histogram object and select 3D View.
To turn on/turn off color, click the appropriate toolbar button.
To turn on/turn off the grid lines, click the appropriate toolbar button or right-click
the IR Histogram object and select Grid Lines.
To turn on/turn off the legend, right-click the IR Histogram object and select Legend.
To swap X- and Y-axes, right-click the histogram and select Swap X & Y Axes.
To change settings related to general settings, color and measurement objects,
right-click the IR Histogram object and select Settings.
Section 7.1.4 – IR Histogram object toolbar on page 29
Section 8.2.2.2 – Inserting IR Histogram objects on page 50
Section 8.2.2.9 – Resizing infrared objects on page 57
Section 8.2.2.15 – Deleting infrared objects on page 63
Section 14.7 – Shortcut menu for IR Histogram objects on page 105
Publ. No. 1558567 Rev. a269 – ENGLISH (EN) – March 18, 2008
7 – Screen elements & how to use them
7
INTENTIONALLY LEFT BLANK
Publ. No. 1558567 Rev. a269 – ENGLISH (EN) – March 18, 2008
37
7 – Screen elements & how to use them
7.2.4
IR Trending object
NOTE
You usually only insert an IR Trending object when designing a custom report template.
Inserting an IR
Trending object
To insert an IR Trending object, click
on the main toolbar.
Displaying the
toolbar
To display the toolbar for this object, select the object with the cursor.
Figure
10738603;a1
Explanation
A trending object is a graphical representation of measurement values or text comment
values on the Y-axis by infrared report pages or infrared images on the X-axis sorted
by time, page number or text comment values.
7
It can also display probable trends, according to different algorithms.
38
Publ. No. 1558567 Rev. a269 – ENGLISH (EN) – March 18, 2008
7 – Screen elements & how to use them
Common tasks
Common tasks related to the IR Trending object include the following:
■
■
■
■
■
■
■
■
Related topics
■
■
■
■
■
To turn on/turn off three-dimensional rendering, click the appropriate toolbar
button or right-click the IR Trending object and select 3D View.
To turn on/turn off color, click the appropriate toolbar button.
To turn on/turn off the grid lines, click the appropriate toolbar button or right-click
the IR Trending object and select Grid Lines.
To show/hide inactive trends, right-click the IR Trending object and select Show
Only Visible Plot Lines in Legend.
To turn on/turn off the legend, right-click the IR Trending object and select Legend.
To swap X- and Y-axes, right-click the IR Trending object and select Swap X & Y
Axes.
To change settings related to connections, general settings, prediction, color and
lines, right-click the IR Trending object and select Settings.
To refresh the trending graph, right-click the IR Trending object and select Refresh.
Section 7.1.5 – IR Trending object toolbar on page 30
Section 8.2.2.4 – Inserting IR Trending objects on page 52
Section 8.2.2.9 – Resizing infrared objects on page 57
Section 8.2.2.15 – Deleting infrared objects on page 63
Section 14.8 – Shortcut menu for IR Trending objects on page 110
7
Publ. No. 1558567 Rev. a269 – ENGLISH (EN) – March 18, 2008
39
7 – Screen elements & how to use them
7.2.5
Digital Photo object
NOTE
Only use this method to insert a photo when designing a report template. In all other
situations, insert photos by clicking Picture on the Insert menu (Insert → Picture
→ From File).
Inserting a Digital
Photo object
To insert a Digital Photo object, click
Figure
10738303;a1
Explanation
The Digital Photo object is a placeholder for photos. This photo may be taken with
a stand-alone digital camera, or with the digital visual camera featured on some FLIR
Systems infrared cameras.
Common tasks
To open a new image, right-click the Digital Photo object and select Open.
Related topics
■
on the main toolbar.
7
■
■
■
40
Section 8.2.2.1 – Inserting IR Viewer objects and Digital Photo objects on page 49
Section 8.2.2.9 – Resizing infrared objects on page 57
Section 8.2.2.15 – Deleting infrared objects on page 63
Section 14.9 – Shortcut menu for Digital Photo objects on page 117
Publ. No. 1558567 Rev. a269 – ENGLISH (EN) – March 18, 2008
7 – Screen elements & how to use them
7.2.6
Result Table object
NOTE
■
■
You usually only insert a Result Table object when designing a custom report
template.
You can edit the texts in the Result Table object, once the report is created.
However, these changes will be deleted when you right-click the Result Table
object and select Refresh.
Inserting a Result
Table object
To insert an Result Table object, click
Figure
10738403;a1
Explanation
A Result Table object displays the results of the measurement tools laid out in the
infrared image, as well as other information that is related to the infrared image.
Common tasks
Common tasks related to the Result table object include the following:
■
■
■
■
Related topics
■
■
■
■
on the main toolbar.
To change borders and shading of the Result Table object, right-click the Result
Table object and select Borders and Shading. This is a standard Microsoft® Word
feature.
To spell-check the texts in the Result Table object, right-click the Result Table
object and select Spelling. This is a standard Microsoft® Word feature.
To specify what information should be displayed in the Result Table object, rightclick the Result Table object and select Contents.
To refresh the Result Table object contents, right-click the Result Table object and
select Refresh. You usually only have to do this if you have changed the contents
manually.
Section 8.2.2.5 – Inserting Result Table objects on page 53
Section 8.2.2.9 – Resizing infrared objects on page 57
Section 8.2.2.16 – Deleting Result Table objects on page 64
Section 14.10 – Shortcut menu for Result table objects on page 118
Publ. No. 1558567 Rev. a269 – ENGLISH (EN) – March 18, 2008
41
7
7 – Screen elements & how to use them
7.2.7
Field object
NOTE
You usually only insert a Field object when designing a custom report template.
Inserting a Field
object
To insert an Field object, click
Figure
10738503;a1
Explanation
A Field object can be linked to values or texts in your infrared image.
Common tasks
Common tasks related to the Field object include the following:
■
■
■
■
7
Related topics
■
■
■
■
42
on the main toolbar.
To change borders and shading of the Field object, right-click the Field object
and select Borders and Shading. This is a standard Microsoft® Word feature.
To spell-check the texts in the Field object, right-click the Field object and select
Spelling. This is a standard Microsoft® Word feature.
To specify what information should be displayed in the Field object, right-click the
Field object and select Contents.
To refresh the Field object contents, right-click the Field object and select Refresh.
You usually only have to do this if you have changed the contents manually.
Section 8.2.2.7 – Inserting Field objects on page 55
Section 8.2.2.9 – Resizing infrared objects on page 57
Section 8.2.2.18 – Deleting Field objects on page 66
Section 14.11 – Shortcut menu for Field objects on page 119
Publ. No. 1558567 Rev. a269 – ENGLISH (EN) – March 18, 2008
7 – Screen elements & how to use them
7.2.8
Summary Table object
NOTE
■
■
Inserting a
Summary Table
object
You usually only insert an Summary Table object when designing a custom report
template.
You can edit the texts in the Summary Table object, once the report is created.
However, these changes will be deleted when you right-click the Summary Table
object and select Refresh.
To insert a Summary Table object, click
on the main toolbar.
Figure
10740403;a1
Explanation
A Summary Table object lists infrared data of your choice from all infrared images in
the report, one row per image.
Common tasks
Common tasks related to the Summary Table object include the following:
■
■
■
■
Related topics
■
■
■
■
To change borders and shading of the Summary Table object, right-click the
Summary Table object and select Borders and Shading. This is a standard Microsoft® Word feature.
To spell-check the texts in the Summary Table object, right-click the Summary
Table object and select Spelling. This is a standard Microsoft® Word feature.
To specify what information should be displayed in the Summary Table object,
right-click the Summary Table object and select Contents.
To refresh the Summary Table object contents, right-click the Summary Table
object and select Refresh. You usually only have to do this if you have changed
the contents manually.
Section 8.2.2.6 – Inserting Summary Table objects on page 54
Section 8.2.2.9 – Resizing infrared objects on page 57
Section 8.2.2.16 – Deleting Result Table objects on page 64
Section 14.12 – Shortcut menu for Summary Table objects on page 120
Publ. No. 1558567 Rev. a269 – ENGLISH (EN) – March 18, 2008
43
7
7 – Screen elements & how to use them
7
INTENTIONALLY LEFT BLANK
44
Publ. No. 1558567 Rev. a269 – ENGLISH (EN) – March 18, 2008
8
Creating a custom report
template
8.1
A note about working in the Microsoft® Word
environment
General
Due to the fact that FLIR Reporter Professional is an add-in to Microsoft® Word, basically all existing features you usually use when creating a Microsoft® Word document template can be used when creating your report templates.
FLIR Reporter Professional adds a number of commands that are specific to the industry of infrared imaging and reporting, and these commands can be accessed on
the FLIR Reporter Professional menu as well as on the different toolbars.
You use these features, along with the usual Microsoft®Word features, when you
create infrared report templates.
NOTE
■
■
Creating a report template requires skill in creating document templates in Microsoft® Word. For more information about this, please refer to your Microsoft®
Word documentation, or the Microsoft® Word online help.
When creating a custom report template, you may it useful to select Show/Hide ¶
on the main toolbar in Microsoft® Word.
Publ. No. 1558567 Rev. a269 – ENGLISH (EN) – March 18, 2008
45
8
8 – Creating a custom report template
8.2
Creating a custom infrared report template
Typical structure
of a report
template
A custom infrared report template usually consists of the following types of pages:
■
■
■
Few or many
report templates?
A front cover
A number of different pages, containing combinations of IR Viewer objects, Digital
Photo objects, IR Histogram objects, IR Profile objects, Result Table objects,
Summary Table objects, etc.
A back cover
It is not uncommon that you will use one specific template for one specific customer.
If this is the case, you may want to include your customer’s company-specific information in the template, rather than entering it manually after the infrared report has
been generated.
Consequently, if several of your customers request an infrared report that could be
met with one, or a few, single templates, company-specific information should
probably not be included in the template, since that kind of information may easily
be entered after the Rapid Report Manager or the Wizard has generated the report.
Related topics
■
■
Section 8.2.1 – About the front & back covers on page 47
Section 8.2.2 – Creating the infrared report template pages on page 48
8
46
Publ. No. 1558567 Rev. a269 – ENGLISH (EN) – March 18, 2008
8 – Creating a custom report template
8.2.1
About the front & back covers
General
You create the front and back covers of the report template using existing features
in Microsoft® Word.
Types of
information
The front and back covers of an infrared report template typically include the following
information:
■
■
■
■
■
■
Your and your customer’s company names
Other contact information
Current date
Title of the infrared report
Your and your customer’s company logotypes
Any additional artwork or information that you may want to include
8
Publ. No. 1558567 Rev. a269 – ENGLISH (EN) – March 18, 2008
47
8 – Creating a custom report template
8.2.2
Creating the infrared report template pages
General
You create an infrared report page either by clicking the buttons on the FLIR Reporter
Professional toolbar, or by clicking the commands on the FLIR Reporter Professional
menu.
Types of infrared
objects
There are five different infrared objects and three table objects:
■
■
■
■
■
■
■
■
IR Viewer object
Digital Photo object
IR Histogram object
IR Profile object
IR Trending object
Result table object
Summary table object
Field object
NOTE
The procedures on the following pages assume that you click the toolbar buttons.
However, you can also click the commands on the FLIR Reporter Professional menu.
Related topics
■
■
■
■
■
8
■
■
■
■
■
■
■
■
■
■
■
■
■
48
Section 8.2.2.1 – Inserting IR Viewer objects and Digital Photo objects on page 49
Section 8.2.2.2 – Inserting IR Histogram objects on page 50
Section 8.2.2.3 – Inserting IR Profile objects on page 51
Section 8.2.2.4 – Inserting IR Trending objects on page 52
Section 8.2.2.5 – Inserting Result Table objects on page 53
Section 8.2.2.6 – Inserting Summary Table objects on page 54
Section 8.2.2.7 – Inserting Field objects on page 55
Section 8.2.2.8 – Connecting objects on page 56
Section 8.2.2.9 – Resizing infrared objects on page 57
Section 8.2.2.10 – Moving measurement tools on page 58
Section 8.2.2.11 – Selecting measurement tools on page 59
Section 8.2.2.12 – Moving between measurement tools on page 60
Section 8.2.2.13 – Cloning measurement tools on page 61
Section 8.2.2.14 – Deleting measurement tools on page 62
Section 8.2.2.15 – Deleting infrared objects on page 63
Section 8.2.2.16 – Deleting Result Table objects on page 64
Section 8.2.2.17 – Deleting Summary Table objects on page 65
Section 8.2.2.18 – Deleting Field objects on page 66
Publ. No. 1558567 Rev. a269 – ENGLISH (EN) – March 18, 2008
8 – Creating a custom report template
8.2.2.1
Inserting IR Viewer objects and Digital Photo objects
Procedure
Follow this procedure to insert IR Viewer objects and Digital Photo objects:
1
On your template page, place the cursor where you want the IR Viewer
object or Digital Photo object to appear. The placeholders will be inserted
after and below the cursor.
2
On the toolbar, click
(for an IR Viewer object) or
(for a Digital
Photo object). An placeholder will now appear on the page. Since you are
creating a template, you should not open any infrared images or photos at
this stage.
When you create the report by using the Wizard or the Rapid Report Manager, the image placeholder will automatically load infrared and/or visual
images.
Related topics
■
■
■
■
Section 7.1.2 – IR Viewer object toolbar on page 26
Section 7.2.1 – IR Viewer object on page 32
Section 7.2.5 – Digital Photo object on page 40
Section 14.3 – Shortcut menu for IR Viewer objects on page 87
8
Publ. No. 1558567 Rev. a269 – ENGLISH (EN) – March 18, 2008
49
8 – Creating a custom report template
8.2.2.2
Inserting IR Histogram objects
Procedure
Follow this procedure to insert an IR Histogram object:
1
On your template page, click where you want the IR Histogram object to
appear. The IR Histogram object will be inserted after and below the cursor.
2
On the toolbar, click
on your page.
. An empty IR Histogram object will now appear
When you create your report, the IR Histogram object will illustrate how
pixels in the area tools of the image are distributed by graphing the number
of pixels at each temperature level.
Related topics
■
■
■
Section 14.7 – Shortcut menu for IR Histogram objects on page 105
Section 7.1.4 – IR Histogram object toolbar on page 29
Section 7.2.3 – IR Histogram object on page 36
8
50
Publ. No. 1558567 Rev. a269 – ENGLISH (EN) – March 18, 2008
8 – Creating a custom report template
8.2.2.3
Inserting IR Profile objects
Procedure
Follow this procedure to insert an IR Profile object:
1
On your template page, click where you want the IR Profile object to appear.
The IR Profile object will be inserted after and below the cursor.
2
On the toolbar, click
your page.
. An empty IR Profile object will now appear on
When you create your report, the IR Profile object will automatically display
the values of any line tools that are saved in the infrared image.
Related topics
■
■
■
Section 7.1.3 – IR Profile object toolbar on page 28
Section 7.2.2 – IR Profile object on page 35
Section 14.6 – Shortcut menu for IR Profile objects on page 101
8
Publ. No. 1558567 Rev. a269 – ENGLISH (EN) – March 18, 2008
51
8 – Creating a custom report template
8.2.2.4
Inserting IR Trending objects
General
The default behavior of the IR Trending object is that it automatically displays a trend
for all IR Viewer objects in the report, once the report is created. You can also manually move images to the IR Trending object using a drag-and-drop operation.
Procedure
Follow this procedure to insert an IR Trending object:
1
On your template page, click where you want the IR Trending object to
appear. The IR Trending object will be inserted after and below the cursor.
2
On the toolbar, click
objects.
3
. This will display a dialog box for IR Trending
On the Connect tab, do the following:
1 Specify a parameter for the Y-axis. To do this click Add and select a label
and value in the left and right pane, respectively.
2 Specify a parameter for the X-axis.
■
■
■
4
Time
Image sequence number
Text Comment
On the General tab, do the following:
1 Under General, select options related to how the IR Trending object will
be displayed.
2 Under Trend range, select which images should be included in the IR
Trending object.
3 In the Threshold text box, enter a value that will display a horizontal
baseline in the IR Trending object.
8
5
On the Prediction tab, do the following:
1 Under Forecast, select the number of periods forward and backward for
which the algorithm will present a probable trend.
2 Under Trend Regression type, select the algorithm you want to use.
Related topics
■
■
■
52
6
On the Color tab, select colors for various items in the IR Trending object.
7
On the Line tab, select colors and line types for the lines that will be displayed in the IR Trending object.
8
Click OK.
Section 14.8 – Shortcut menu for IR Trending objects on page 110
Section 7.1.5 – IR Trending object toolbar on page 30
Section 7.2.4 – IR Trending object on page 38
Publ. No. 1558567 Rev. a269 – ENGLISH (EN) – March 18, 2008
8 – Creating a custom report template
8.2.2.5
Inserting Result Table objects
Procedure
Follow this procedure to insert a Result Table object:
1
On your template page, click where you want the Result Table object to
appear. The Result Table object will be inserted after and below the cursor.
2
On the toolbar, click
page.
. A Result Table object will now appear on your
When you create your report, the Result Table object will automatically
display the values of any measurement tools in the infrared image.
NOTE
If a result table is connected to an infrared image and you delete either the table or
the image, you will not be able to recreate the connection again.
Related topics
■
■
Section 7.2.6 – Result Table object on page 41
Section 14.10 – Shortcut menu for Result table objects on page 118
8
Publ. No. 1558567 Rev. a269 – ENGLISH (EN) – March 18, 2008
53
8 – Creating a custom report template
8.2.2.6
Inserting Summary Table objects
Procedure
Follow this procedure to insert a Summary Table object:
1
On your template page, click where you want the Summary Table object
to appear. The Summary Table object will be inserted after and below the
cursor.
2
On the toolbar, click
3
.
Do the following:
1 In the left pane of the Columns area, select an object.
2 In the right pane of the Columns area, select the values that you want to
display in the Summary Table object.
A structural preview of the Summary Table will be displayed in the Preview
area.
4
Click OK.
NOTE
Contrary to a Result Table object, a Summary Table object is static. You update a
Summary Table object by right-clicking it and selecting Refresh.
Related topics
■
■
Section 14.12 – Shortcut menu for Summary Table objects on page 120
Section 7.2.8 – Summary Table object on page 43
8
54
Publ. No. 1558567 Rev. a269 – ENGLISH (EN) – March 18, 2008
8 – Creating a custom report template
8.2.2.7
Inserting Field objects
Procedure
Follow this procedure to insert a Field object:
1
On your template page, click where you want the field to appear. The Field
object will be inserted after and below the cursor.
2
On the toolbar, click
. A dialog box will now appear.
3
Click the object you want to connect to the field.
4
Click OK.
NOTE
Field objects will not work if you insert them into a text box. Only Microsoft® Word
fields work in text boxes. However, Field objects work properly in Microsoft® Word
tables.
Related topics
■
■
Section 14.11 – Shortcut menu for Field objects on page 119
Section 7.2.7 – Field object on page 42
8
Publ. No. 1558567 Rev. a269 – ENGLISH (EN) – March 18, 2008
55
8 – Creating a custom report template
8.2.2.8
Connecting objects
NOTE
■
■
Procedure
This description assumes that you have one IR Viewer object and one IR Profile
object on your template page.
The objects you connect must be on the same page when you connect them. If
the document is repaginated and one of the objects falls on a different page the
connection will, however, still be maintained.
On the main toolbar, click
. This will display a dialog box where you can select
the IR Viewer object you want to connect the IR Profile object to.
8
56
Publ. No. 1558567 Rev. a269 – ENGLISH (EN) – March 18, 2008
8 – Creating a custom report template
8.2.2.9
Resizing infrared objects
Procedure
Follow this procedure to resize an infrared object:
1
Click anywhere on an IR Viewer object, a Digital Photo object, etc.
2
To change the size, drag one of the handles that will be displayed when
you select the object.
NOTE
The procedure above does not apply to resizing Field Objects, Result Table objects
and Summary Table objects. To resize these types of objects, select the object and
use the menu commands on the Table menu.
Related topics
Section 7.2 – Infrared objects on page 32
8
Publ. No. 1558567 Rev. a269 – ENGLISH (EN) – March 18, 2008
57
8 – Creating a custom report template
8.2.2.10
Moving measurement tools
Procedure
Follow this procedure to move a measurement tool:
1
Select one or several measurement tools according to section 8.2.2.11 –
Selecting measurement tools on page 59.
2
Do one of the following:
■
■
Related topics
■
■
To move the measurement tool, press the arrow keys.
To move the measurement tool, use the mouse.
Section 7.1.2 – IR Viewer object toolbar on page 26
Section 7.2.1 – IR Viewer object on page 32
8
58
Publ. No. 1558567 Rev. a269 – ENGLISH (EN) – March 18, 2008
8 – Creating a custom report template
8.2.2.11
Selecting measurement tools
Procedure
Do one of the following:
■
■
■
Related topics
To select one tool, click the tool.
To select several tools, SHIFT-click the tools.
To select all tools, select the IR Viewer object and press A.
■
To select one or several tools, click
you want to select.
■
Section 7.1.2 – IR Viewer object toolbar on page 26
Section 7.2.1 – IR Viewer object on page 32
■
and draw a rectangle around the tools
8
Publ. No. 1558567 Rev. a269 – ENGLISH (EN) – March 18, 2008
59
8 – Creating a custom report template
8.2.2.12
Moving between measurement tools
Procedure
Do one of the following:
■
■
Related topics
■
■
To select one tool after another, in one direction, press TAB.
To select one tool after another, in the other direction, press and hold SHIFT and
then press TAB.
Section 7.1.2 – IR Viewer object toolbar on page 26
Section 7.2.1 – IR Viewer object on page 32
8
60
Publ. No. 1558567 Rev. a269 – ENGLISH (EN) – March 18, 2008
8 – Creating a custom report template
8.2.2.13
Cloning measurement tools
Procedure
To clone a measurement tool, press and hold CTRL when you move the measurement
tool. This will create a clone of the measurement tool.
Related topics
■
■
Section 7.1.2 – IR Viewer object toolbar on page 26
Section 7.2.1 – IR Viewer object on page 32
8
Publ. No. 1558567 Rev. a269 – ENGLISH (EN) – March 18, 2008
61
8 – Creating a custom report template
8.2.2.14
Deleting measurement tools
Procedure
To delete a measurement tool, do one of the following:
■
■
Related topics
■
■
Select the tool and press DELETE.
Select the tool, right-click and select Delete.
Section 7.1.2 – IR Viewer object toolbar on page 26
Section 7.2.1 – IR Viewer object on page 32
8
62
Publ. No. 1558567 Rev. a269 – ENGLISH (EN) – March 18, 2008
8 – Creating a custom report template
8.2.2.15
Deleting infrared objects
Procedure
Follow this procedure to delete an infrared object (except Field objects, Result Table
objects and Summary Table objects):
1
Click anywhere on one of the following:
■
■
■
■
■
IR Viewer object
IR Profile object
IR Histogram object
IR Trending object
Digital Photo object
2
On the main toolbar, click
Related topics
.
Section 7.2 – Infrared objects on page 32
8
Publ. No. 1558567 Rev. a269 – ENGLISH (EN) – March 18, 2008
63
8 – Creating a custom report template
8.2.2.16
Deleting Result Table objects
Procedure
Follow this procedure to delete a Result Table object:
Related topics
1
Click anywhere in the Result Table object.
2
On the Microsoft® Word Table menu, point to Delete and then click Table
to delete the currently selected table.
Section 7.2 – Infrared objects on page 32
8
64
Publ. No. 1558567 Rev. a269 – ENGLISH (EN) – March 18, 2008
8 – Creating a custom report template
8.2.2.17
Deleting Summary Table objects
Procedure
Follow this procedure to delete a Summary Table object:
Related topics
1
Click anywhere in the Summary Table object.
2
On the Microsoft® Word Table menu, point to Delete and then click Table
to delete the currently selected table.
Section 7.2 – Infrared objects on page 32
8
Publ. No. 1558567 Rev. a269 – ENGLISH (EN) – March 18, 2008
65
8 – Creating a custom report template
8.2.2.18
Deleting Field objects
NOTE
This procedure applies to FLIR Reporter Field objects only (not Microsoft® Word
fields).
Procedure
Follow this procedure to delete a Field object:
Related topics
1
Place the cursor just to the left of the Field object and click once. This will
select the whole Field object.
2
Press DELETE on your keyboard.
Section 7.2 – Infrared objects on page 32
8
66
Publ. No. 1558567 Rev. a269 – ENGLISH (EN) – March 18, 2008
8 – Creating a custom report template
8.3
Creating a custom infrared report template based on
an existing template
General
The easiest way to create a custom infrared report template is to modify an existing
template.
By doing this, you can take advantage of the existing infrared objects already laid
out on the report template page and you will save a lot of time compared to creating
an infrared report template from scratch.
Procedure
1
Close all open infrared reports.
2
Point to New on the File menu.
3
Select New from template.
4
Select the infrared report template you want to use under the IR tab. Make
sure you have selected Template.
5
Click OK.
6
To avoid overwriting the original template, save the template under a different
file name before making any changes. When saving it, make sure you save
it with the *.dot file name extension.
7
Make your changes in the template according to the following sections:
■
■
8
Section 8.2.1 – About the front & back covers on page 47
Section 8.2.2 – Creating the infrared report template pages on page 48
Save the new infrared report template. When saving it, make sure you save
it with the *.dot file name extension.
Publ. No. 1558567 Rev. a269 – ENGLISH (EN) – March 18, 2008
67
8
9
Creating Microsoft® Word
document properties
9.1
Creating & editing Microsoft® Word document
properties
General
When creating an infrared report, FLIR Reporter Professional extracts the Microsoft®
Word document properties for the report template and inserts these properties in
corresponding Microsoft® Word fields in the final report.
You can use these document properties to automate several time-consuming tasks
when creating a report. For example, you may want FLIR Reporter Professional to
automatically add information such as the name, address and e-mail address of the
inspection site, the model name of the camera that you are using, your e-mail address,
etc.
Types of
document
properties
There are two different types of document properties:
■
■
Summary document properties
Custom document properties
For the former, you can only change the values, but for the latter you can change
both the labels and the values.
Procedure
9
Follow this procedure to create and edit a Microsoft® Word document property:
1
Start Microsoft® Word and then open one of the infrared report templates
(*.dot) that are shipped with FLIR Reporter Professional. Users of Microsoft®
XP operating systems can find the templates by typing the following path:
C:\Documents and Settings\[Your user name]\Application Data\Microsoft\Templates\IR
68
2
Click Properties on the File menu. This will display the Summary tab of the
Properties dialog box.
3
Type your information in the appropriate text boxes.
4
Click the Custom tab.
5
To add a custom property, type a name in the Name box. To make your
custom properties easy to find, you can type an underscore ( _ ) as the
first character in the name of the property.
6
To specify the type of property, select Text, Date, Number, or Yes or No in
the Type box.
7
To specify the value of the property, type a text in the Value box.
8
Click Add to add the custom property to the list of properties, and then click
OK.
Publ. No. 1558567 Rev. a269 – ENGLISH (EN) – March 18, 2008
9 – Creating Microsoft® Word document properties
9
NOTE
■
■
■
Save the infrared report template using a different file name but with the
same file name extension (*.dot). You have now added summary and custom properties to your renamed infrared report template.
If you want to change the name of a custom document property, due to how the
Custom tab of the Properties dialog box works in Microsoft® Word works there
is no other way than deleting it and then recreating it. If you want to move a document property up or down, the whole list has to be re-created.
A Microsoft® Word field is not the same thing as the field you can insert by clicking
on the field button on the main toolbar. Microsoft® Word fields are inserted by
clicking Field on the Insert menu in Microsoft® Word.
You may find that a FLIR Systems property automatically has been added to your
document. Do not remove this property. FLIR Reporter Professional uses it to
distinguish between infrared documents and other documents.
9
Publ. No. 1558567 Rev. a269 – ENGLISH (EN) – March 18, 2008
69
9 – Creating Microsoft® Word document properties
9.2
Creating a Microsoft® Word field and linking the field
to a document property
9.2.1
In Microsoft® Word XP
NOTE
This description assumes that you have created summary and custom properties
according to section 9.1 – Creating & editing Microsoft® Word document properties
on page 68.
Procedure
Follow this procedure to create a Microsoft® Word field and link the field to a document property:
1
In your infrared inspection report or report template, put the cursor where
you want to insert the field and then click Field on the Insert menu.
2
Select DocProperty in the Field name box.
3
Select a property in the Property box.
4
Click OK to confirm your selection and leave the dialog box.
9
70
Publ. No. 1558567 Rev. a269 – ENGLISH (EN) – March 18, 2008
10
Creating text comment files
10.1
Creating a text comment file
General
In FLIR Reporter Professional you can create a text comment file to be used when
carrying out your infrared inspections.
After having saved this text comment file to your hard disk drive and moved it to the
camera on a CompactFlash™ card or an SD Memory Card, the text comments in the
file will appear in the camera software.
For example, you can set the camera to prompt you for a text comment every time
you save an image. The text comments you have created in FLIR Reporter Professional will be available for selection in the camera to be saved with the image.
Valid file format
The valid file format for a text comment file is *.tcf.
Procedure
Follow this procedure to create a text comment file:
1
On the FLIR Reporter Professional menu, click Text Comment Editor.
2
On the File menu, click New → Text Comment.
3
To create a new text comment label, click the left-most button at the top of
the left pane. You can delete labels and move them up or down by using
the other buttons at the top of the pane.
4
To create a new text comment value, click the label for which you want to
create values, and then click the left-most button at the top of the right pane.
You use the buttons at the top in the same way as when creating the labels.
5
When you have finished, save the text comment file to a CompactFlash®
or SD Memory Card by clicking Save As on the File menu.
Publ. No. 1558567 Rev. a269 – ENGLISH (EN) – March 18, 2008
71
10
10 – Creating text comment files
10.2
Linking a text comment to a Result Table object
General
When carrying out large inspections of similar objects—e.g., radiators or air conditioners in every room in a large office building—you will save a lot of time if you add
rows for text comments in the result table in your template, rather than adding these
rows afterwards in the final report.
When you have finished your inspection and moved the infrared images from your
camera to your computer, the Wizard will extract the text comments from your images
and insert them in the predefined rows in the Result Table object.
This requires that a ‘dummy’ text comment is added to the IR Viewer object in the
report template. This ‘dummy’ text comment must have the same labels as the text
comment file in the camera.
Procedure
Follow this procedure to link text comments to a Result Table object:
1
In your report template, add a ‘dummy’ text comment to the IR Viewer object.
Do this the following way:
1 Right-click the IR Viewer object.
2 Select Settings.
3 Go to the Text Comments tab and enter a text comment. Make sure that
this ‘dummy’ text comment has the same labels as the text comment file
you will use in your camera.
2
In your report template, create a Result Table object in which the text
comments will be displayed.
The contents of the Result Table object depends on your settings in the
Contents dialog box. To display this dialog box, right-click the Result Table
object and select Contents.
Make sure that you select the text comment labels in this dialog box.
10
72
3
Save the template under a different file name.
4
Create a text comment file with the same labels according to section 10.1
– Creating a text comment file on page 71.
5
Save the text comment file on a CompactFlash® card or an SD Memory
Card and insert the card into your infrared camera.
6
Carry out your inspection as planned. Make sure your camera is set to ask
you for a text comment when saving each image.
7
Insert your CompactFlash® card or SD Memory Card containing your images and generate a report using the ThermaCAM™ Wizard. When asked
for a report template, select the report template you created in Steps 1–3
above.
8
When the Wizard has finished generating the report, you will find your text
comments in the Result Table object created in Step 2.
Publ. No. 1558567 Rev. a269 – ENGLISH (EN) – March 18, 2008
11
Creating emissivity table files
General
In FLIR Reporter Professional you can create an emissivity table file to be used when
carrying out your infrared inspections.
After having saved this emissivity table file to your hard disk drive and moved it to
the camera using a CompactFlash™ card or an SD Memory Card, it will appear in
the camera software. You can then set the emissivity from this emissivity table file
when changing object parameters in the camera.
Definition
Emissivity is a value that specifies how much radiation an object emits, compared
to the radiation of a theoretical reference object of the same temperature (called a
‘blackbody’).
Valid file format
The valid file format for an emissivity table file is *.etf.
Procedure
Follow this procedure to create an emissivity table file:
1
On the FLIR Reporter Professional menu, click Text Comment Editor.
2
On the File menu, click New → Emissivity Table.
3
To create a new emissivity label, click the left-most button at the top of the
left pane. You can delete labels and move them up or down by using the
other buttons at the top of the pane.
If you don’t need a subgroup for a material, you can enter the emissivity
value at this stage, e.g. Iron = 0.21.
4
To create a subgroup for a material, click the label for which you want to
create the subgroup, and then click the left-most button at the top of the
right pane.
You use the buttons at the top in the same way as when creating the labels.
5
Related topics
■
■
When you have finished, save the emissivity table file to a CompactFlash®
or SD Memory Card by clicking Save As on the File menu.
Section 17 – Thermographic measurement techniques on page 127
Section 21 – Emissivity tables on page 153
Publ. No. 1558567 Rev. a269 – ENGLISH (EN) – March 18, 2008
73
11
11 – Creating emissivity table files
INTENTIONALLY LEFT BLANK
11
74
Publ. No. 1558567 Rev. a269 – ENGLISH (EN) – March 18, 2008
12
Creating formulas
General
By clicking Formula on the Measurement submenu when right-clicking an image,
you can carry out advanced calculations on various objects in the infrared image.
A formula can contain all common mathematical operators and functions, such as
+, –, ×, ÷, etc. Also, numerical constants such as π can be used.
Most importantly, references to measurement results, other formulas and other numerical data can be inserted into formulas.
NOTE
A formula can only operate on a single infrared image, not calculate, for example,
differences between two infrared images.
Related topics
■
■
Section 12.1 – Creating a simple formula on page 76
Section 12.2 – Creating a conditional formula using the if statement on page 78
12
Publ. No. 1558567 Rev. a269 – ENGLISH (EN) – March 18, 2008
75
12 – Creating formulas
12.1
Creating a simple formula
Procedure
Follow this procedure to create a formula that calculates the difference between two
spots in an infrared image:
1
In your document, insert an IR Viewer object.
2
Lay out two spots in the image.
3
Place the cursor below the image and insert a Result Table object. You can
also insert a Result Table object after you have created your formula.
4
Right-click the IR Viewer object and select Formulas (Measurement →
Formulas). This will display the Formula dialog box.
5
Click Add to display a dialog box in which you define your new formula.
6
Do the following:
1 Click the
button to display a dialog box.
2 Click Sp2 in the left list box.
3 Click OK to leave the dialog box.
7
Click the minus button to add a subtraction mathematical operator.
8
Do the following:
1 Click the
button to display a dialog box.
2 Click Sp1 in the right list box.
3 Click OK to leave the dialog box.
9
The Formula dialog box will now display your formula using FLIR Systems
formula syntax:
[ana.Sp2.temp]-[ana.Sp1.temp]
12
76
10
Click Close to leave the dialog box.
11
Right-click the Result table object and select Contents.
12
In the left pane of the Table Items area, select the formula. Formulas are
indicated by the Fo prefix.
13
Click OK to leave the dialog box. The formula and formula result are now
displayed in your Result Table object.
Publ. No. 1558567 Rev. a269 – ENGLISH (EN) – March 18, 2008
12 – Creating formulas
INTENTIONALLY LEFT BLANK
12
Publ. No. 1558567 Rev. a269 – ENGLISH (EN) – March 18, 2008
77
12 – Creating formulas
12.2
Creating a conditional formula using the if statement
General
For some applications, you may want to display the result of a calculation in green
font color if the result is lower than a critical value, and in red font color if the result
is higher than the critical value.
You do this by creating a conditional formula using the if statement.
Procedure
Follow this procedure to create a conditional formula using the if statement:
1
Repeat the procedure above in a new document, but do not create a Result
Table object.
2
Click the IR Viewer object.
3
Right-click the IR Viewer and select Formulas (Measurement → Formulas).
This will display the Formula dialog box.
4
Do the following:
1 Click Add to display a dialog box in which you define your new formula.
2 Click the if button to display a new dialog box.
5
You will now set up a conditional formula that displays the result from the
Fo1 formula in red if the value is higher than 2.0 degrees, and in green if
the value is lower than 2.0 degrees.
Do the following:
1 Click the
button to the right of the top text box, select Fo1 and click
OK.
2 In the top text box, type ‘>2.0’ to the right of the formula (without quotation
marks). This will be your condition.
3 Click the
button to the right of the middle text box, select Fo1 and
click OK.
4 To the right of the middle text box, click Default Color and select a red
color.
5 Click the
button to the right of the bottom text box, select Fo1 and
click OK
6 To the right of the bottom text box, click Default Colorand select a green
color.
7 Click OK to leave the dialog box.
12
6
You will now see the complete conditional formula in the Formula dialog
box. The two 10-digit code strings after the equals sign represent the colors.
if([ana.Fo1.val]>2.0;[ana.Fo1.val]=0x000000ff;
[ana.Fo1.val]=0x00009300)
78
7
Click OK to leave the dialog box.
8
Click Close.
Publ. No. 1558567 Rev. a269 – ENGLISH (EN) – March 18, 2008
12 – Creating formulas
9
Place the cursor below your image and click the
will display the Field Contents dialog box.
10
toolbar button. This
Do the following:
1 Click the formula in the left pane.
2 Click OK.
A Field object will now be inserted below you image and the result of the
Fo1 formula will be displayed in red or green, depending on the measured
values of the two spotmeters.
NOTE
These types of conditional formulas can be connected to the following objects:
■
■
■
Field objects
Result table
Summary table
12
Publ. No. 1558567 Rev. a269 – ENGLISH (EN) – March 18, 2008
79
12 – Creating formulas
INTENTIONALLY LEFT BLANK
12
80
Publ. No. 1558567 Rev. a269 – ENGLISH (EN) – March 18, 2008
13
Converting radiometric sequence
files
General
In FLIR Reporter Professional, you can convert a radiometric sequence file (*.seq)
to an *.avi file.
The AVI format stands for Audio Video Interlaced and was created by Microsoft® and
introduced along with Windows 3.1. It is one of the most widespread semi-professional
video formats and will let you or your recipients view the converted sequence file in
a variety of video applications.
Valid file formats
■
■
Procedure
The valid file format for a radiometric sequence file is *.seq.
The valid file format for an AVI file is *.avi.
Follow this procedure to convert a sequence file to an AVI file:
1
On the FLIR Reporter Professional menu, click Create AVI File.
2
Click Next to continue. This will display the Open File dialog box.
3
Click Open to locate the file you want to convert.
4
Double-click the file you want to convert. By default the converted file will
be saved at the same location with the new file name extension (*.avi). You
can specify a different file name and location by clicking
5
Click Next to continue.
6
Do the following:
.
1 Select which video compression algorithm you want to use – Microsoft
video (recommended) or Additional codecs.
2 Specify the frame rate, which is the number of frames that will be displayed
per second.
3 Click Next to continue.
7
Click Finish to create your AVI file.
13
Publ. No. 1558567 Rev. a269 – ENGLISH (EN) – March 18, 2008
81
13 – Converting radiometric sequence files
INTENTIONALLY LEFT BLANK
13
82
Publ. No. 1558567 Rev. a269 – ENGLISH (EN) – March 18, 2008
14
Software reference section
General
Since FLIR Reporter Professional seamlessly integrates with the Microsoft® Word
environment, it will be displayed as a menu and additional toolbars, as well as a
number of shortcut menus. In this section all menus, submenus, and dialog boxes
will be described in detail.
Related topics
■
■
■
■
■
■
■
■
■
■
■
Section 14.1 – FLIR Reporter Professional menu on page 84
Section 14.2 – Explanation of the QuickInsert dialog box on page 86
Section 14.3 – Shortcut menu for IR Viewer objects on page 87
Section 14.5 – Shortcut menu for measurement tools on page 97
Section 14.6 – Shortcut menu for IR Profile objects on page 101
Section 14.7 – Shortcut menu for IR Histogram objects on page 105
Section 14.8 – Shortcut menu for IR Trending objects on page 110
Section 14.9 – Shortcut menu for Digital Photo objects on page 117
Section 14.10 – Shortcut menu for Result table objects on page 118
Section 14.11 – Shortcut menu for Field objects on page 119
Section 14.12 – Shortcut menu for Summary Table objects on page 120
14
Publ. No. 1558567 Rev. a269 – ENGLISH (EN) – March 18, 2008
83
14 – Software reference section
14
14.1
FLIR Reporter Professional menu
IR Viewer
Click to insert an IR Viewer object for infrared images and sequence file. An infrared
image or sequence file contains valid temperature information that may be output
by overlaying different kinds of measurement tools, such as spotmeters, profiles,
areas, etc.
IR Profile
Click to insert an IR Profile object. An IR Profile object contains a graph showing
pixel values along a line in an infrared image.
IR Histogram
Click to insert an IR Histogram object. An IR Histogram object contains a graph illustrating how pixels in the image are distributed by graphing the number of pixels at
each temperature level.
IR Trending
Click to insert an IR Trending object. A trending object is a graphical representation
of measurement values or text comment values on the Y-axis by infrared report pages
or infrared images on the X-axis sorted by time, page number or text comment values.
It can also display probable trends, according to different algorithms.
Digital Photo
Click to insert a Digital Photo object. This photo may be taken with a stand-alone
digital camera, or with the digital visual camera featured on some FLIR Systems infrared cameras. Only use this method to insert a photo when you design a report
template. In all other situations, insert photos by clicking Picture on the Insert menu
(Insert → Picture → From File).
Insert Table
Click to insert an Result Table object into your current document. A Result Table
object displays the results of the measurement tools laid out in the infrared image,
as well as other information that is related to the infrared image.
Insert Field
Click to insert an Field object into your current document. A Field object can be linked
to values or texts in your infrared image.
Insert Summary
Table
Click to insert an Summary Table object. A Summary Table object lists infrared data
of your choice from all infrared images in the report, one row per image.
Duplicate Page
Click to duplicate the current page and insert the duplicate page after the current
page.
Delete Page
Click to delete the current page.
Delete
Click this toolbar button and then click an infrared object to remove the infrared object
from your report.
Connect
Click to connect infrared objects to each other—for example, an IR Profile object to
an IR Viewer object.
QuickInsert
Click to display the QuickInsert dialog box, where you can create a report by using
a pre-defined page layout, or modify an existing page layout.
84
Publ. No. 1558567 Rev. a269 – ENGLISH (EN) – March 18, 2008
14 – Software reference section
For more information, see section 14.2 – Explanation of the QuickInsert dialog box
on page 86.
Create PDF
Document
Click to create an Adobe® PDF document of the Microsoft® Word document. A free
version of Adobe® Reader is available from http://adobe.com/products/acrobat/readstep2.html.
Create AVI File
For more information, see section 13 – Converting radiometric sequence files on
page 81.
Text Comment
Editor
Click to start a text comment editor where you can create text comment files and
emissivity table files.
Help
Click to display online help.
Check for updates
Click to check for program updates.
Open Reporter 8
manual
Click to display the user’s manual as an Adobe® PDF document.
Select Units
Click to display a dialog box where you can set units.
Select Language
Click to display a dialog box where you can set language.
14
Publ. No. 1558567 Rev. a269 – ENGLISH (EN) – March 18, 2008
85
14 – Software reference section
14.2
Explanation of the QuickInsert dialog box
NOTE
This explanation refers to the dialog box that is displayed when you click Customize
QuickInsert.
Explanation
Name
The name of the page layout you are currently creating.
Size → Number of
columns
The number of columns in the page layout.
Size → Number of rows
The number of rows in the page layout.
Example: One infrared image next to one photo equals
two columns.
Example: One infrared image above one photo equals
two rows.
Contents
A visual representation of the page layout.
The numbers refer to the rows and the capital letters
refer to the columns. The label Merge will merge (i.e.
straddle) two horizontal items into one single item.
Note that the Merge command prioritizes the first item
in a row.
A method to connect, or link, two objects.
Add a result table
To add a result table below your page layout, select
this box.
14
86
Publ. No. 1558567 Rev. a269 – ENGLISH (EN) – March 18, 2008
14 – Software reference section
14.3
Shortcut menu for IR Viewer objects
Open
To open an image in the IR Viewer, or change the current image to a new image,
click Open.
Save As
To save the currently displayed image to your hard disk drive, click Save As.
Show IR Scale
To show/hide the IR scale at the far right in the infrared image, click Show IR Scale.
Zoom
To zoom in on the currently displayed image, click 1×, 2×, 4×, or 8× on the Zoom
menu.
Settings
For more information, see section 14.3.1 – Settings dialog box on page 89.
Image Fusion
To display the image fusion dialog box, click Image Fusion. In this dialog box you
can fuse an infrared image with a digital photo. Fusing images can make it easier to
identify the exact position of temperature anomalies.
Follow this procedure to fuse an infrared image with a digital photo:
1
Click Open IR Image and select an infrared image.
2
Click Open Photo and select the corresponding digital photo.
3
In the infrared image, define the positions of interest by moving the three
reference crosshairs to these positions.
4
In the digital photo, move the three reference crosshairs to the corresponding positions.
5
To display the fused image, click OK.
In the IR Viewer object you can adjust the exact position of the digital photo in the
fused image by doing one or more of the following:
■
■
To move the digital photo up/down or left/right in 1 pixel increments, use the arrow
keys on your keyboard.
To rotate the digital photo clockwise/counter-clockwise in 1° increments, use the
Page Up and Page Down keys on your keyboard.
Explanation of additional buttons and controls:
Label
Explanation
View Full Image
To view the full image, click View Full Image.
Ref#1
To zoom in on crosshair #1, click Ref#1.
Ref#2
To zoom in on crosshair #2, click Ref#2.
Ref#3
To zoom in on crosshair #3, click Ref#3.
Picture in Picture (PiP)
To display the digital photo in its original size, select
Picture in Picture (PiP).
Publ. No. 1558567 Rev. a269 – ENGLISH (EN) – March 18, 2008
14
87
14 – Software reference section
Label
Explanation
Visual image in black
and white
To display the digital photo in grayscale, select Visual
image in black and white.
Open Photo
To open a digital photo, click Open Photo.
Threshold
To use one temperature interval for the infrared image
and use the digital photo for lower and higher temperatures, select Threshold and enter the desired temperature values in the corresponding text boxes.
You can adjust the temperature levels by dragging
the sliders in the IR Viewer object, once you have
closed the dialog box.
Blending
To mix the image from infrared pixels and digital
photo pixels, select Blending.
You can adjust the mixing levels by dragging the
sliders in the IR Viewer object, once you have closed
the dialog box.
Rotate Left
To rotate the image 90° to the left, click Rotate Left.
Rotate Right
To rotate the image 90° to the right, click Rotate Right.
Formulas
To create a formula, click Formula.
For more information about creating formulas, see section 12 – Creating formulas
on page 75.
14
88
Publ. No. 1558567 Rev. a269 – ENGLISH (EN) – March 18, 2008
14 – Software reference section
14.3.1
Settings dialog box
14.3.1.1
Colors tab
Explanation
Label
Explanation
Browse
To open palette files (*.pal) stored at a different location, click Browse.
Advanced
To open a dialog box where you can select advanced
parameters, click Advanced.
Max. Temperature
To define the maximum level temperature of the scale,
type a temperature value in the text box.
Min. Temperature
To define the minimum level temperature of the scale,
type a temperature value in the text box.
Invert palette
To invert the color distribution in a palette vertically,
select this check box.
Show out of range colors
To assign a special color for temperatures outside the
calibrated temperature range of the infrared camera,
select this check box.
Show saturation colors
To assign a special color for the temperatures outside
the scale limits, select this check box.
Use bilinear filtering to
enhance image quality
To improve the image quality, select this check box.
Histogram equalization
This is an image-displaying method that evenly distributes the color information over the existing temperatures of the image. This method to distribute the information can be particularly successful when the
image contains few peaks of very high temperature
values.
Signal linear
This is an image-displaying method where the color
information in the image is distributed linear to the
signal values of the pixels.
Output linear
This selection works in conjunction with the settings
under Preferred output on the Preferences tab.
This is an image-displaying method where you can
distribute the colors either according to temperature
or according to object signal.
14
Publ. No. 1558567 Rev. a269 – ENGLISH (EN) – March 18, 2008
89
14 – Software reference section
14.3.1.2
Explanation
Isotherms tab
Label
Explanation
Delete
To delete an isotherm, click this button.
Solid
To assign a solid color to an isotherm, select this option button and select a color in the drop-down list
box.
Contrast
To assign a contrasting color to an isotherm, select
this option button and select a color in the drop-down
list box.
Palette
To open a palette and use this palette for the isotherm,
select Palette and click Open.
Max. Temperature
To set the maximum temperature of an isotherm, enter
a new value here and click Apply.
Isotherms may exist outside the temperature range
of the current image, which will make the isotherm
invisible. By changing the maximum temperature, invisible isotherms can be brought back into range.
Min. Temperature
To set the minimum temperature of an isotherm, enter
a new value here and click Apply.
Isotherms may exist outside the temperature range
of the current image, which will make the isotherm
invisible. By changing the minimum temperature, invisible isotherms can be brought back into range.
Indoor air temperature
(This text box is only displayed when an insulation
alarm is active.)
This parameter refers to the air temperature inside the
building in question when setting up insulation alarms.
An insulation alarm is an alarm that can detect an area
where there may be a risk of humidity in a building
structure
Outdoor air temperature
(This text box is only displayed when an insulation
alarm is active.)
This parameter refers to the air temperature outside
the building in question when setting up insulation
alarms.
14
90
Publ. No. 1558567 Rev. a269 – ENGLISH (EN) – March 18, 2008
14 – Software reference section
Label
Explanation
Insulation factor
(This text box is only displayed when an insulation
alarm is active.)
The insulation factor is the accepted energy loss
through the wall. Different building codes recommend
different values, but typical values are 0.70-0.80 for
new buildings.
Note: Refer to your national building code for recommendations.
Atmospheric Temperature
(This text box is only displayed when a humidity alarm
is active.)
This parameter refers to the atmospheric temperature
when setting up humidity alarms. A humidity alarm is
an alarm that can detect what may be an insulation
deficiency in a wall.
Relative air humidity
(This text box is only displayed when a humidity alarm
is active.)
This parameter refers to the relative air humidity when
setting up humidity alarms.
Humidity Alarm Level
(This text box is only displayed when a humidity alarm
is active.)
The humidity alarm level is the critical limit of relative
humidity that you want to detect in, e.g., a building
structure. For example, mold will grow on areas where
the relative humidity is less than 100% and you may
want to find such areas of interest.
Note: Refer to your national building code for recommendations.
14
Publ. No. 1558567 Rev. a269 – ENGLISH (EN) – March 18, 2008
91
14 – Software reference section
14.3.1.3
Explanation
Annotations tab
Label
Explanation
Label
The label of a text comment. Example:
Value
Label
Value
Company
FLIR Systems
The value of a text comment. Example:
Label
Value
Company
FLIR Systems
Add
To display a dialog box where you can add a new text
comment, click Add.
Edit
To display a dialog box where you can change the
label and value, click Edit.
Delete
To delete the text comment, select the text comment
and then click Delete.
Image Description
An image description is a brief textual description that
is stored inside an image file. It can be created using
a Pocket PC and then beamed to the camera using
the IrDA communication link.
If the image has an image description, the text will be
displayed in this edit box. If not, you can add an image
description for the image by entering text.
The maximum number of characters in an image description is 512.
Click to listen to a voice comment.
Click to pause current playback.
Click to stop current playback.
Sketch
Click to display a dialog box where you can view a
freehand sketches that is associated with an image.
Note: Not all cameras support creating freehand
sketches.
14
92
Publ. No. 1558567 Rev. a269 – ENGLISH (EN) – March 18, 2008
14 – Software reference section
14.3.1.4
Explanation
Object Parameters tab
Label
Explanation
Emissivity
To change the emissivity, enter a new value and click
Apply. You can also select a preset emissivity from a
table by clicking
.
For more information about object parameters, see
section 17 – Thermographic measurement techniques
on page 127.
Reflected apparent temperature
To change the reflected apparent temperature, enter
a new value and click Apply.
For more information about object parameters, see
section 17 – Thermographic measurement techniques
on page 127.
Atmospheric Temperature
To change the atmospheric temperature, enter a new
value and click Apply.
For more information about object parameters, see
section 17 – Thermographic measurement techniques
on page 127.
Relative humidity
To change the relative humidity, enter a new value
and click Apply.
For more information about object parameters, see
section 17 – Thermographic measurement techniques
on page 127.
Distance to object
To change the distance, enter a new value and click
Apply.
For more information about object parameters, see
section 17 – Thermographic measurement techniques
on page 127.
Temperature
To specify the temperature of, e.g., an external lens
or heat shield, enter a new value and click OK and
Apply.
For more information about object parameters, see
section 17 – Thermographic measurement techniques
on page 127.
Transmission
To specify the transmission of, e.g., an external lens
or heat shield, enter a new value and click OK and
Apply.
For more information about object parameters, see
section 17 – Thermographic measurement techniques
on page 127.
Publ. No. 1558567 Rev. a269 – ENGLISH (EN) – March 18, 2008
93
14
14 – Software reference section
Label
Explanation
Computed transmission
FLIR Reporter Professional can compute the transmission based on atmospheric temperature and relative
humidity.
Clear the user-defined option button to use the computed transmission.
For more information about object parameters, see
section 17 – Thermographic measurement techniques
on page 127.
Fixed transmission
Select this option button, enter a value and click OK
and Apply if you want to use a specific transmission.
For more information about object parameters, see
section 17 – Thermographic measurement techniques
on page 127.
Value
To specify the reference temperature, enter a value
and click OK and Apply.
For more information about object parameters, see
section 17 – Thermographic measurement techniques
on page 127.
14
94
Publ. No. 1558567 Rev. a269 – ENGLISH (EN) – March 18, 2008
14 – Software reference section
14.3.1.5
Explanation
Preferences tab
Label
Explanation
Pre-defined measurement symbols and
isotherms
If this box is selected all new images will use the
analysis symbols and isotherms you set up in the
Settings dialog box, instead of using the image’s own
settings from the camera.
Pre-defined palette and
color distribution
If his box is selected all new images will use the
palette and color distribution you set up in the Settings dialog box, instead of using the image’s own
settings from the camera.
Pre-defined object parameters
If this box is selected all new images will use the object parameters you set up in the Settings dialog box,
instead of using the image’s own settings from the
camera.
Scale limits from image
To use the new image’s scale limits, select this check
box.
Auto-adjust
To autoadjust the image upon importing it, select this
check box.
Max. Temperature
To pre-define the scale limit for the new image, enter
the maximum temperature level here and click Apply.
Min. Temperature
To pre-define the scale limit for the new image, enter
the minimum temperature level here and click Apply.
Temperature
To output the pixel information as temperature in degrees Kelvin, Celsius, or Fahrenheit, select this option
button.
Object signal
To output the pixel information as an object signal,
select this option button.
14
Publ. No. 1558567 Rev. a269 – ENGLISH (EN) – March 18, 2008
95
14 – Software reference section
14.4
Shortcut menu for isotherms and IR scales
Delete
To open delete an isotherm, select Delete.
Note: This menu command is not available when right-clicking IR scales.
Palette
To change the palette, select Palette. This will display the Colors tab in the Settings
dialog box.
For more information about palettes, see section 14.3.1.1 – Colors tab on page 89.
Isotherm
To change the isotherm, select Isotherm. This will display the Isotherm tab in the
Settings dialog box.
For more information about isotherms, see section 14.3.1.2 – Isotherms tab on page
90.
14
96
Publ. No. 1558567 Rev. a269 – ENGLISH (EN) – March 18, 2008
14 – Software reference section
14.5
Shortcut menu for measurement tools
Cursor
Applicable for lines only:
Click to create a cursor that you can move along the line.
Delete
To remove the currently selected measurement tool from the infrared image, click
Delete.
Cold Spot
Applicable for all measurement tools except spotmeter, difference calculation, and
marker:
To create a spotmeter at the coldest location in the area, click Cold Spot.
Hot Spot
Applicable for all measurement tools except spotmeter, delta, and marker:
To create a spotmeter at the hottest location in the area, Hot Spot.
Formulas
For more information, see section 12 – Creating formulas on page 75.
Settings
For more information, see section 14.5.1 – Settings dialog box on page 98.
Image
This section is identical to section 14.3 – Shortcut menu for IR Viewer objects on
page 87.
14
Publ. No. 1558567 Rev. a269 – ENGLISH (EN) – March 18, 2008
97
14 – Software reference section
14.5.1
Settings dialog box
14.5.1.1
General tab
Explanation
Label
Explanation
Label
To specify a label (i.e. a name appearing in the infrared image) for this measurement tool, enter a name
here and click Apply.
Show label
To show the label for the measurement tool, select
Show label.
Show value
To display the value of the measurement tool (i.e. the
measurement result) in the infrared image, select the
value type and click Apply. The number of possible
value types differs between different measurement
tools.
Font size
To specify the font size of the label, select a font size
in the Font size box and clickApply.
Measurement symbol
To specify the color of the symbol for the measurement tool, select a color in the Measurement symbol
box and click Apply.
Text
To specify the color of the label text, select a color in
the Text box and click Apply.
Text background
To specify the color of the background, select a color
in the Text background box and click Apply.
Set as default
To use these settings as default settings for all measurement tools, click Set as default and click Apply.
14
98
Publ. No. 1558567 Rev. a269 – ENGLISH (EN) – March 18, 2008
14 – Software reference section
14.5.1.2
Explanation
Object Parameters tab
Label
Explanation
Custom
To specify custom parameters, select Custom, enter
new values in the three text boxes and click Apply.
Emissivity
To change the emissivity, enter a new value and click
Apply. You can also select a preset emissivity from a
table by clicking
.
For more information about object parameters, see
section 17 – Thermographic measurement techniques
on page 127.
Distance to object
To change the distance, enter a new value and click
Apply.
For more information about object parameters, see
section 17 – Thermographic measurement techniques
on page 127.
Reflected apparent temperature
To change the reflected apparent temperature, enter
a new value and click Apply.
For more information about object parameters, see
section 17 – Thermographic measurement techniques
on page 127.
Set as default
To use these object parameters settings as default
settings for all measurement tools, select Set as default and click Apply.
14
Publ. No. 1558567 Rev. a269 – ENGLISH (EN) – March 18, 2008
99
14 – Software reference section
14.5.1.3
Explanation
Size/Position tab
Label
Explanation
X
To change the X-position for a measurement tool,
enter a negative or positive value and press Apply to
move the measurement tool the same number of pixels, relative to its original position.
Y
To change the Y-position for a measurement tool,
enter a negative or positive value and press Apply to
move the measurement tool the same number of pixels, relative to its original position.
Height
To change the height of a measurement tool, enter a
value and press Apply to specify a new height of the
measurement tool.
Width
To change the width of a measurement tool, enter a
value and press Apply to specify a new width of the
measurement tool.
Rotate
To rotate a measurement tool, enter a negative or
positive value and press Apply to specify a new angle
of rotation for the measurement tool.
14
100
Publ. No. 1558567 Rev. a269 – ENGLISH (EN) – March 18, 2008
14 – Software reference section
14.6
Shortcut menu for IR Profile objects
Grid Lines
To display a grid of horizontal lines in the IR Profile object, click Grid Lines.
Legend
To display a legend below the IR Profile object, click Legend.
Show Only Visible
Profile Lines in
Legend
If two or more lines are laid out in the infrared image, clicking Show Only Visible
Profile Lines in Legend will remove any cleared line results from the legend below
the IR Profile object.
3D View
To create a three-dimensional rendering of the graph of the IR Profile object, click
3D View.
Swap X & Y Axes
To swap the X- and Y-axes of the IR Profile object, click Swap X & Y Axes.
Settings
For more information, see section 14.6.1 – Settings dialog box on page 102.
14
Publ. No. 1558567 Rev. a269 – ENGLISH (EN) – March 18, 2008
101
14 – Software reference section
14.6.1
Settings dialog box
14.6.1.1
General tab
Explanation
Label
Explanation
Grid Lines
To display a grid of horizontal lines in the IR Profile
object, click Grid Lines.
Legend
To display a legend below the IR Profile object, click
Legend.
Show Only Visible Profile Lines in Legend
If two or more lines are laid out in the infrared image,
clicking Show Only Visible Profile Lines in Legend
will remove any cleared line results from the legend
below the IR Profile object.
3D View
To create a three-dimensional rendering of the graph
of the IR Profile object, click 3D View.
Swap X & Y Axes
To swap the X- and Y-axes of the IR Profile object,
click Swap X & Y Axes.
Columns
To add or remove columns in the IR Profile object,
select or clear these boxes.
IR Scale
To use the IR scale as the temperature axis, select
this option button and click Apply.
Auto
To let FLIR Reporter Professional automatically define
the temperature axis, select this option button and
click Apply.
Fixed
To manually define the maximum and minimum axis
temperature, select this option button, enter new values and click Apply.
Max. Temperature
See above.
Min. Temperature
See above.
Threshold
To display a horizontal line at a certain temperature
in the IR Profile object, enter a value in the text box
and click Apply.
14
102
Publ. No. 1558567 Rev. a269 – ENGLISH (EN) – March 18, 2008
14 – Software reference section
14.6.1.2
Explanation
Color tab
Label
Explanation
Background
To change the color of the table background, select
a new color from the drop-down list box and click
Apply.
Plot Area
To change the color of the plot area, select a new
color from the drop-down list box and click Apply.
Text
To change the color of the table text, select a new
color from the drop-down list box and click Apply.
Axes
To change the color of the axes, select a new color
from the drop-down list box and click Apply.
Grid
To change the color of the grid lines, select a new
color from the drop-down list box and click Apply.
14
Publ. No. 1558567 Rev. a269 – ENGLISH (EN) – March 18, 2008
103
14 – Software reference section
14.6.1.3
Lines tab
Explanation
To select the line you want to connect the IR Profile object to, select a check box and
click Apply.
14
104
Publ. No. 1558567 Rev. a269 – ENGLISH (EN) – March 18, 2008
14 – Software reference section
14.7
Shortcut menu for IR Histogram objects
Grid Lines
To display a grid of horizontal lines in the IR Histogram object, click Grid Lines.
Legend
To display a legend below the IR Histogram object, click Legend.
3D View
To create a three-dimensional rendering of the graph of the IR Histogram object,
click 3D View.
Swap X & Y Axes
To swap the X- and Y-axes of the IR Histogram object. click Swap X & Y Axes.
Settings
For more information, see section 14.7.1 – Settings dialog box on page 106.
14
Publ. No. 1558567 Rev. a269 – ENGLISH (EN) – March 18, 2008
105
14 – Software reference section
14.7.1
Settings dialog box
14.7.1.1
General tab
Explanation
Label
Explanation
Grid Lines
To display a grid of horizontal lines in the IR Histogram
object, click Grid Lines.
Legend
To display a legend below the IR Histogram object,
click Legend.
3D View
To create a three-dimensional rendering of the graph
of the IR Histogram object, click 3D View.
Swap X & Y Axes
To swap the X- and Y-axes of the IR Histogram object.
click Swap X & Y Axes.
Use palette
To use a color palette for the three-dimensional rendering of the IR Histogram object, select Use palette
and click Apply.
Columns
To add or remove columns in the IR Histogram object,
select or clear these boxes.
None
Select this option button if no threshold should be
used in the IR Histogram object.
Step
To use a step threshold in the IR Histogram object,
select this option button.
A step threshold shows how many percent of the
pixels are below and above a specific temperature.
The percentages are displayed in the IR Histogram
object legend below the IR Histogram object.
Band
To use a band threshold in the IR Histogram object,
select this option button.
A band threshold shows how many percent of the
pixels are below a lower temperature, between this
lower temperature and a higher temperature, and
above that higher temperature. The percentages are
displayed in the threshold legend below the IR Histogram object.
14
106
IR Scale
To use the IR scale as the temperature axis, select
this option button and click Apply.
Auto
To let FLIR Reporter Professional automatically define
the temperature axis, select this option button and
click Apply.
Publ. No. 1558567 Rev. a269 – ENGLISH (EN) – March 18, 2008
14 – Software reference section
Label
Explanation
Fixed
To manually define the maximum and minimum axis
temperature, select this option button, enter new values and click Apply.
Max. Temperature
See above.
Min. Temperature
See above.
Percentage axis → Auto
To let FLIR Reporter Professional automatically define
the percentage axis, select this option button and click
Apply.
Percentage axis → Fixed
To manually define the percentage axis, select this
option button, enter a new value and click Apply.
14
Publ. No. 1558567 Rev. a269 – ENGLISH (EN) – March 18, 2008
107
14 – Software reference section
14.7.1.2
Explanation
Color tab
Label
Explanation
Background
To change the color of the table background, select
a new color from the drop-down list box and click
Apply.
Plot Area
To change the color of the plot area, select a new
color from the drop-down list box and click Apply.
Text
To change the color of the text, select a new color
from the drop-down list box and click Apply.
Axes
To change the color of the axes, select a new color
from the drop-down list box and click Apply.
Grid
To change the color of the grid, select a new color
from the drop-down list box and click Apply.
Threshold
To change the color of the threshold, select a new
color from the drop-down list box and click Apply.
Limit
To change the color of the limit, select a new color
from the drop-down list box and click Apply.
Bar color
To change the color of the bar color, select a new
color from the drop-down list box and click Apply.
14
108
Publ. No. 1558567 Rev. a269 – ENGLISH (EN) – March 18, 2008
14 – Software reference section
14.7.1.3
Lines tab
Explanation
To select the line you want to connect the IR Histogram object to, select a check box
and click Apply.
14
Publ. No. 1558567 Rev. a269 – ENGLISH (EN) – March 18, 2008
109
14 – Software reference section
14.8
Shortcut menu for IR Trending objects
Grid Lines
To display a grid of horizontal lines in the IR Trending object, click Grid Lines.
Legend
To display a legend below the IR Trending object, click Legend.
Show Only Visible
Plot Lines in
Legend
To display trend lines in the legend that you have cleared on the Lines tab, click
Show Only Visible Plot Lines in Legend.
3D View
To create a three-dimensional rendering of the graph of the IR Trending object, click
3D View.
Swap X & Y Axes
To swap the X-and Y-axes of the IR Trending object, click Swap X & Y Axes.
Refresh
To update the trending graph, click Refresh.
Settings
For more information, see section 14.8.1 – Settings dialog box on page 111.
14
110
Publ. No. 1558567 Rev. a269 – ENGLISH (EN) – March 18, 2008
14 – Software reference section
14.8.1
Settings dialog box
14.8.1.1
Connect tab
Explanation
Label
Explanation
Y Axis
To specify a parameter for the Y-axis, click Add and
select a label and value for in the left and right pane,
respectively.
Time
To specify time as the X-axis parameter, select the
Time option button.
Image sequence number
To specify an incrementally stepped image sequence
number as the X-axis parameter, select the Image
sequence number option button.
Text Comment
To specify text comments as the X-axis parameter,
select the Text Comment option button.
When using text comments as the X-axis parameter,
all images must have the same text comment label.
The value of the text comment must be a numerical
value.
14
Publ. No. 1558567 Rev. a269 – ENGLISH (EN) – March 18, 2008
111
14 – Software reference section
14.8.1.2
Explanation
General tab
Label
Explanation
Grid Lines
To display a grid of horizontal lines in the IR Trending
object, click Grid Lines.
Legend
To display a legend below the IR Trending object,
click Legend.
Show Only Visible Plot
Lines in Legend
To display trend lines in the legend that you have
cleared on the Lines tab, click Show Only Visible Plot
Lines in Legend.
3D View
To create a three-dimensional rendering of the graph
of the IR Trending object, click 3D View.
Swap X & Y Axes
To swap the X-and Y-axes of the IR Trending object,
click Swap X & Y Axes.
All
To include all images for the trending, select the All
option button.
Items
To include a range of adjancent or non-adjacent images, click Images and select the images you want
to include.
Threshold
To display a horisontal baseline in the IR Trending
object, enter a value.
14
112
Publ. No. 1558567 Rev. a269 – ENGLISH (EN) – March 18, 2008
14 – Software reference section
14.8.1.3
Explanation
Prediction tab
Label
Explanation
Forward
To specify the number of periods forward for which
the algorithms will present a probable trend, select a
value in the Forward box.
The probable trend is a mathematical approximation
only.
Backward
To specify the number of periods backward for which
the algorithms will present a probable trend, select a
value in the Backward box.
The probable trend is a mathematical approximation
only.
None
To disable Trend Regression type, select None.
Linear
To use a linear trending algorithm, select Linear. This
algorithm uses the following mathematical expression:
y=m×x+c
Logarithmic
To use a logarithmic trending algorithm, select Logarithmic. This algorithm uses the following mathematical expression:
y = m × ln(x) + c
Power
To use a power trending algorithm, select Power. This
algorithm uses the following mathematical expression:
y = ec × xm
Exponential
To use an exponential trending algorithm, select the
Exponential option button. This algorithm uses the
following mathematical expression:
y = exp(c) × e(m × x)
Polynomial
To use an polynomial trending algorithm, select the
Polynomial option button. This algorithm uses the
following mathematical expression:
y = a0x0 + a1x1 + a2x2 + ... + akxk, where k = order.
Moving average
To use a moving average trending algorithm, select
the Moving average option button. This algorithm
uses the following mathematical expression:
An n-period moving average is the average value over
the previous n time periods.
Display equation on
chart
Publ. No. 1558567 Rev. a269 – ENGLISH (EN) – March 18, 2008
To display the equation on the chart, select Display
equation on chart.
113
14
14 – Software reference section
Label
Explanation
Display R-squared value
on chart
To display a numerical value that indicates how successful the algorithm is to approximate the curve, select Display R-squared value on chart. The value is
between 0 and 1, where 0 is poor quality and 1 is high
quality.
14
114
Publ. No. 1558567 Rev. a269 – ENGLISH (EN) – March 18, 2008
14 – Software reference section
14.8.1.4
Explanation
Color tab
Label
Explanation
Background
To change the color of the table background, select
a new color from the drop-down list box and click
Apply.
Plot Area
To change the color of the plot area, select a new
color from the drop-down list box and click Apply.
Text
To change the color of the table text, select a new
color from the drop-down list box and click Apply.
Axes
To change the color of the axes, select a new color
from the drop-down list box and click Apply.
Grid
To change the color of the grid lines, select a new
color from the drop-down list box and click Apply.
14
Publ. No. 1558567 Rev. a269 – ENGLISH (EN) – March 18, 2008
115
14 – Software reference section
14.8.1.5
Line tab
Explanation
■
■
■
To specify which lines should be displayed in the IR Trending object, select one
or more of the check boxes.
To specify color, select a new color from the drop-down list box.
To specify line type, select a new line type from the drop-down list box
14
116
Publ. No. 1558567 Rev. a269 – ENGLISH (EN) – March 18, 2008
14 – Software reference section
14.9
Shortcut menu for Digital Photo objects
Open
To open a visual image, click Open.
14
Publ. No. 1558567 Rev. a269 – ENGLISH (EN) – March 18, 2008
117
14 – Software reference section
14.10
Shortcut menu for Result table objects
NOTE
The menu items Borders and Shading and Spelling will not be described here, since
these are standard Microsoft® Word features.
Contents
To select a label and value for a Result Table object, select the label in the left pane
and its value in the right pane and click Apply.
Refresh
To update the Result Table object, click Refresh.
14
118
Publ. No. 1558567 Rev. a269 – ENGLISH (EN) – March 18, 2008
14 – Software reference section
14.11
Shortcut menu for Field objects
NOTE
The menu items Borders and Shading and Spelling will not be described here, since
these are standard Microsoft® Word features.
Contents
To select a label and value for a Field object, select the label in the left pane and its
value in the right pane and click Apply.
Refresh
To update the Field object, click Refresh.
14
Publ. No. 1558567 Rev. a269 – ENGLISH (EN) – March 18, 2008
119
14 – Software reference section
14.12
Shortcut menu for Summary Table objects
NOTE
The menu items Borders and Shading and Spelling will not be described here, since
these are standard Microsoft® Word features.
Contents
To select a label and value for a Summary Table object, select the label in the left
pane and its value in the right pane and click Apply.
Refresh
To update the Summary Table object, click Refresh.
14
120
Publ. No. 1558567 Rev. a269 – ENGLISH (EN) – March 18, 2008
15
Supported file formats in the IR
Viewer object
Radiometric file
formats
The IR Viewer object supports the following radiometric file formats:
■
■
■
■
■
■
■
■
■
ThermaCAM™ radiometric *.jpg
ThermaCAM™ radiometric *.img
ThermaCAM™ radiometric 8-bit *.tif
ThermaCAM™ radiometric 8/12-bit *.tif
ThermaCAM™ radiometric 12-bit *.tif
ThermoTeknix® *.tgw
ThermoTeknix® *.tmw
ThermoTeknix® *.tlw
ThermaCAM™ radiometric *.seq (radiometric sequence files)
15
Publ. No. 1558567 Rev. a269 – ENGLISH (EN) – March 18, 2008
121
15 – Supported file formats in the IR Viewer object
INTENTIONALLY LEFT BLANK
15
122
Publ. No. 1558567 Rev. a269 – ENGLISH (EN) – March 18, 2008
16
16
About FLIR Systems
FLIR Systems was established in 1978 to pioneer the development of high-performance
infrared imaging systems, and is the world leader in the design, manufacture, and
marketing of thermal imaging systems for a wide variety of commercial, industrial,
and government applications. Today, FLIR Systems embraces four major companies
with outstanding achievements in infrared technology since 1965—the Swedish
AGEMA Infrared Systems (formerly AGA Infrared Systems), and the three United
States companies Indigo Systems, FSI, and Inframetrics.
10722703;a1
Figure 16.1 LEFT: Thermovision® Model 661 from 1969. The camera weighed approximately 25 kg
(55 lb.), the oscilloscope 20 kg (44 lb.), and the tripod 15 kg (33 lb.). The operator also needed a 220 VAC
generator set, and a 10 L (2.6 US gallon) jar with liquid nitrogen. To the left of the oscilloscope the Polaroid
attachment (6 kg/13 lb.) can be seen. RIGHT: InfraCAM from 2006. Weight: 0.55 kg (1.21 lb.), including
the battery
The company has sold more than 40,000 infrared cameras worldwide for applications
such as predictive maintenance, R & D, non-destructive testing, process control and
automation, and machine vision, among many others.
FLIR Systems has three manufacturing plants in the United States (Portland, OR,
Boston, MA, Santa Barbara, CA) and one in Sweden (Stockholm). Direct sales offices
in Belgium, Brazil, China, France, Germany, Great Britain, Hong Kong, Italy, Japan,
Sweden, and the USA—together with a worldwide network of agents and distributors—support our international customer base.
Publ. No. 1558567 Rev. a269 – ENGLISH (EN) – March 18, 2008
123
16 – About FLIR Systems
16
FLIR Systems is at the forefront of innovation in the infrared camera industry. We anticipate market demand by constantly improving our existing cameras and developing
new ones. The company has set milestones in product design and development such
as the introduction of the first battery-operated portable camera for industrial inspections, and the first uncooled infrared camera, to mention just two innovations.
FLIR Systems manufactures all vital mechanical and electronic components of the
camera systems itself. From detector design and manufacturing, to lenses and system
electronics, to final testing and calibration, all production steps are carried out and
supervised by our own engineers. The in-depth expertise of these infrared specialists
ensures the accuracy and reliability of all vital components that are assembled into
your infrared camera.
16.1
More than just an infrared camera
At FLIR Systems we recognize that our job is to go beyond just producing the best
infrared camera systems. We are committed to enabling all users of our infrared
camera systems to work more productively by providing them with the most powerful
camera–software combination. Especially tailored software for predictive maintenance,
R & D, and process monitoring is developed in-house. Most software is available in
a wide variety of languages.
We support all our infrared cameras with a wide variety of accessories to adapt your
equipment to the most demanding infrared applications.
16.2
Sharing our knowledge
Although our cameras are designed to be very user-friendly, there is a lot more to
thermography than just knowing how to handle a camera. Therefore, FLIR Systems
has founded the Infrared Training Center (ITC), a separate business unit, that provides
certified training courses. Attending one of the ITC courses will give you a truly handson learning experience.
The staff of the ITC are also there to provide you with any application support you
may need in putting infrared theory into practice.
16.3
Supporting our customers
FLIR Systems operates a worldwide service network to keep your camera running at
all times. If you discover a problem with your camera, local service centers have all
the equipment and expertise to solve it within the shortest possible time. Therefore,
there is no need to send your camera to the other side of the world or to talk to
someone who does not speak your language.
124
Publ. No. 1558567 Rev. a269 – ENGLISH (EN) – March 18, 2008
16 – About FLIR Systems
16.4
A few images from our facilities
16
10401303;a1
Figure 16.2 LEFT: Development of system electronics; RIGHT: Testing of an FPA detector
10401403;a1
Figure 16.3 LEFT: Diamond turning machine; RIGHT: Lens polishing
Publ. No. 1558567 Rev. a269 – ENGLISH (EN) – March 18, 2008
125
16 – About FLIR Systems
16
10401503;a1
Figure 16.4 LEFT: Testing of infrared cameras in the climatic chamber; RIGHT: Robot used for camera
testing and calibration
126
Publ. No. 1558567 Rev. a269 – ENGLISH (EN) – March 18, 2008
17
17.1
Thermographic measurement
techniques
17
Introduction
An infrared camera measures and images the emitted infrared radiation from an object.
The fact that radiation is a function of object surface temperature makes it possible
for the camera to calculate and display this temperature.
However, the radiation measured by the camera does not only depend on the temperature of the object but is also a function of the emissivity. Radiation also originates
from the surroundings and is reflected in the object. The radiation from the object
and the reflected radiation will also be influenced by the absorption of the atmosphere.
To measure temperature accurately, it is therefore necessary to compensate for the
effects of a number of different radiation sources. This is done on-line automatically
by the camera. The following object parameters must, however, be supplied for the
camera:
■
■
■
■
■
The emissivity of the object
The reflected apparent temperature
The distance between the object and the camera
The relative humidity
Temperature of the atmosphere
17.2
Emissivity
The most important object parameter to set correctly is the emissivity which, in short,
is a measure of how much radiation is emitted from the object, compared to that from
a perfect blackbody of the same temperature.
Normally, object materials and surface treatments exhibit emissivity ranging from
approximately 0.1 to 0.95. A highly polished (mirror) surface falls below 0.1, while an
oxidized or painted surface has a higher emissivity. Oil-based paint, regardless of
color in the visible spectrum, has an emissivity over 0.9 in the infrared. Human skin
exhibits an emissivity 0.97 to 0.98.
Non-oxidized metals represent an extreme case of perfect opacity and high reflexivity,
which does not vary greatly with wavelength. Consequently, the emissivity of metals
is low – only increasing with temperature. For non-metals, emissivity tends to be high,
and decreases with temperature.
Publ. No. 1558567 Rev. a269 – ENGLISH (EN) – March 18, 2008
127
17 – Thermographic measurement techniques
17
17.2.1
Finding the emissivity of a sample
17.2.1.1
Step 1: Determining reflected apparent temperature
Use one of the following two methods to determine reflected apparent temperature:
17.2.1.1.1
1
Method 1: Direct method
Look for possible reflection sources, considering that the incident angle = reflection angle (a
= b).
10588903;a1
Figure 17.1 1 = Reflection source
2
If the reflection source is a spot source, modify the source by obstructing it using a piece if
cardboard.
10589103;a2
Figure 17.2 1 = Reflection source
128
Publ. No. 1558567 Rev. a269 – ENGLISH (EN) – March 18, 2008
17 – Thermographic measurement techniques
3
Measure the radiation intensity (= apparent temperature) from the reflecting source using the
following settings:
■
■
Emissivity: 1.0
Dobj: 0
17
You can measure the radiation intensity using one of the following two methods:
10589003;a2
Figure 17.3 1 = Reflection source
Note: Using a thermocouple to measure reflected apparent temperature is not recommended for two important reasons:
■
■
A thermocouple does not measure radiation intensity
A thermocouple requires a very good thermal contact to the surface, usually by
gluing and covering the sensor by a thermal isolator.
17.2.1.1.2
Method 2: Reflector method
1
Crumble up a large piece of aluminum foil.
2
Uncrumble the aluminum foil and attach it to a piece of cardboard of the same size.
3
Put the piece of cardboard in front of the object you want to measure. Make sure that the side
with aluminum foil points to the camera.
4
Set the emissivity to 1.0.
Publ. No. 1558567 Rev. a269 – ENGLISH (EN) – March 18, 2008
129
17 – Thermographic measurement techniques
5
Measure the apparent temperature of the aluminum foil and write it down.
10727003;a2
17
Figure 17.4 Measuring the apparent temperature of the aluminum foil
17.2.1.2
Step 2: Determining the emissivity
1
Select a place to put the sample.
2
Determine and set reflected apparent temperature according to the previous procedure.
3
Put a piece of electrical tape with known high emissivity on the sample.
4
Heat the sample at least 20 K above room temperature. Heating must be reasonably even.
5
Focus and auto-adjust the camera, and freeze the image.
6
Adjust Level and Span for best image brightness and contrast.
7
Set emissivity to that of the tape (usually 0.97).
8
Measure the temperature of the tape using one of the following measurement functions:
■
■
■
Isotherm (helps you to determine both the temperature and how evenly you have heated
the sample)
Spot (simpler)
Box Avg (good for surfaces with varying emissivity).
9
Write down the temperature.
10
Move your measurement function to the sample surface.
11
Change the emissivity setting until you read the same temperature as your previous measurement.
12
Write down the emissivity.
Note:
130
Publ. No. 1558567 Rev. a269 – ENGLISH (EN) – March 18, 2008
17 – Thermographic measurement techniques
■
■
■
■
Avoid forced convection
Look for a thermally stable surrounding that will not generate spot reflections
Use high quality tape that you know is not transparent, and has a high emissivity
you are certain of
This method assumes that the temperature of your tape and the sample surface
are the same. If they are not, your emissivity measurement will be wrong.
17.3
Reflected apparent temperature
This parameter is used to compensate for the radiation reflected in the object. If the
emissivity is low and the object temperature relatively far from that of the reflected it
will be important to set and compensate for the reflected apparent temperature correctly.
17.4
Distance
The distance is the distance between the object and the front lens of the camera. This
parameter is used to compensate for the following two facts:
■
■
That radiation from the target is absorbed by the athmosphere between the object
and the camera.
That radiation from the atmosphere itself is detected by the camera.
17.5
Relative humidity
The camera can also compensate for the fact that the transmittance is also dependent
on the relative humidity of the atmosphere. To do this set the relative humidity to the
correct value. For short distances and normal humidity the relative humidity can normally be left at a default value of 50%.
17.6
Other parameters
In addition, some cameras and analysis programs from FLIR Systems allow you to
compensate for the following parameters:
■
■
■
Atmospheric temperature – i.e. the temperature of the atmosphere between the
camera and the target
External optics temperature – i.e. the temperature of any external lenses or windows
used in front of the camera
External optics transmission – i.e. the transmission of any external lenses or windows
used in front of the camera
Publ. No. 1558567 Rev. a269 – ENGLISH (EN) – March 18, 2008
131
17
17 – Thermographic measurement techniques
17
INTENTIONALLY LEFT BLANK
132
Publ. No. 1558567 Rev. a269 – ENGLISH (EN) – March 18, 2008
18
History of infrared technology
Less than 200 years ago the existence of the infrared portion of the electromagnetic
spectrum wasn’t even suspected. The original significance of the infrared spectrum,
or simply ‘the infrared’ as it is often called, as a form of heat radiation is perhaps less
obvious today than it was at the time of its discovery by Herschel in 1800.
10398703;a1
Figure 18.1 Sir William Herschel (1738–1822)
The discovery was made accidentally during the search for a new optical material.
Sir William Herschel—Royal Astronomer to King George III of England, and already
famous for his discovery of the planet Uranus—was searching for an optical filter
material to reduce the brightness of the sun’s image in telescopes during solar observations. While testing different samples of colored glass that gave similar reductions
in brightness, he was intrigued to find that some of the samples passed very little of
the sun’s heat, while others passed so much heat that he risked eye damage after
only a few seconds’ observation.
Herschel was soon convinced of the necessity of setting up a systematic experiment,
with the objective of finding a single material that would give the desired reduction in
brightness as well as the maximum reduction in heat. He began the experiment by
repeating Newton’s prism experiment, but looking for the heating effect rather than
the visual distribution of intensity in the spectrum. He first blackened the bulb of a
sensitive mercury-in-glass thermometer with ink, and with this as his radiation detector
he proceeded to test the heating effect of the various colors of the spectrum formed
on the top of a table by passing sunlight through a glass prism. Other thermometers,
placed outside the sun’s rays, served as controls.
As the blackened thermometer was moved slowly along the colors of the spectrum,
the temperature readings showed a steady increase from the violet end to the red
end. This was not entirely unexpected, since the Italian researcher Landriani, in a
similar experiment in 1777, had observed much the same effect. It was Herschel,
Publ. No. 1558567 Rev. a269 – ENGLISH (EN) – March 18, 2008
133
18
18 – History of infrared technology
however, who was the first to recognize that there must be a point where the heating
effect reaches a maximum, and that measurements confined to the visible portion of
the spectrum failed to locate this point.
10398903;a1
18
Figure 18.2 Marsilio Landriani (1746–1815)
Moving the thermometer into the dark region beyond the red end of the spectrum,
Herschel confirmed that the heating effect continued to increase. The maximum point,
when he found it, lay well beyond the red end—in what is known today as the ‘infrared
wavelengths.’
When Herschel revealed his discovery, he referred to this new portion of the electromagnetic spectrum as the ‘thermometrical spectrum.’ The radiation itself he sometimes
referred to as ‘dark heat,’ or simply ‘the invisible rays.’ Ironically, and contrary to
popular opinion, it wasn’t Herschel who originated the term ‘infrared.’ The word only
began to appear in print around 75 years later, and it is still unclear who should receive
credit as the originator.
Herschel’s use of glass in the prism of his original experiment led to some early
controversies with his contemporaries about the actual existence of the infrared
wavelengths. Different investigators, in attempting to confirm his work, used various
types of glass indiscriminately, having different transparencies in the infrared. Through
his later experiments, Herschel was aware of the limited transparency of glass to the
newly discovered thermal radiation, and he was forced to conclude that optics for
the infrared would probably be restricted to the use of reflective elements exclusively
(i.e., plane and curved mirrors). Fortunately, this proved to be true only until 1830,
when the Italian investigator Melloni made his great discovery that naturally occurring
rock salt (NaCl)—which was available in large enough crystals to be made into lenses
and prisms—is remarkably transparent to the infrared. The result was that rock salt
became the principal infrared optical material, and remained so for the next century,
until the art of synthetic crystal growing was mastered in the 1930s.
134
Publ. No. 1558567 Rev. a269 – ENGLISH (EN) – March 18, 2008
18 – History of infrared technology
10399103;a1
18
Figure 18.3 Macedonio Melloni (1798–1854)
Thermometers, as radiation detectors, remained unchallenged until 1829, the year
Nobili invented the thermocouple. (Herschel’s own thermometer could be read to
0.2°C (0.036°F), and later models were able to be read to 0.05°C (0.09°F).) Then a
breakthrough occurred: Melloni connected a number of thermocouples in series to
form the first thermopile. The new device was at least 40 times as sensitive as the
best thermometer of the day for detecting heat radiation—capable of detecting the
heat from a person standing 3 meters (10 ft.) away.
The first so-called ‘heat-picture’ became possible in 1840, the result of work by Sir
John Herschel, son of the discoverer of the infrared and a famous astronomer in his
own right. Based upon the differential evaporation of a thin film of oil when exposed
to a heat pattern focused upon it, the thermal image could be seen by reflected light
where the interference effects of the oil film made the image visible to the eye. John
Herschel also managed to obtain a primitive record of the thermal image on paper,
which he called a ‘thermograph.’
10399003;a2
Figure 18.4 Samuel P. Langley (1834–1906)
Publ. No. 1558567 Rev. a269 – ENGLISH (EN) – March 18, 2008
135
18 – History of infrared technology
18
The improvement of infrared-detector sensitivity progressed slowly. Another major
breakthrough, made by Langley in 1880, was the invention of the bolometer. This
consisted of a thin blackened strip of platinum connected in one arm of a Wheatstone
bridge circuit upon which the infrared radiation was focused and to which a sensitive
galvanometer responded. This instrument is said to have been able to detect the heat
from a cow at a distance of 400 meters (1311 ft.).
An English scientist, Sir James Dewar, first introduced the use of liquefied gases as
cooling agents (such as liquid nitrogen with a temperature of −196°C (−320.8°F)) in
low-temperature research. In 1892 he invented a unique vacuum insulating container
in which it was possible to store liquefied gases for entire days. The common ‘thermos
flask’, used for storing hot and cold drinks, is based upon his invention.
Between the years 1900 and 1920, the inventors of the world ‘discovered’ the infrared.
Many patents were issued for devices to detect personnel, artillery, aircraft, ships—and
even icebergs. The first operating systems, in the modern sense, began to be developed during the 1914–18 war, when both sides had research programs devoted to
the military exploitation of the infrared. These programs included experimental systems
for enemy intrusion/detection, remote temperature sensing, secure communications,
and ‘flying torpedo’ guidance. An infrared search system tested during this period
was able to detect an approaching airplane at a distance of 1.5 km (0.94 miles), or
a person more than 300 meters (984 ft.) away.
The most sensitive systems up to this time were all based upon variations of the
bolometer idea, but the period between the two world wars saw the development of
two revolutionary new infrared detectors: the image converter and the photon detector.
At first, the image converter received the greatest attention by the military, because
it enabled an observer for the first time in history to literally ‘see in the dark.’ However,
the sensitivity of the image converter was limited to the near-infrared wavelengths,
and the most interesting military targets (i.e. enemy soldiers) had to be illuminated
by infrared search beams. Since this involved the risk of giving away the observer’s
position to a similarly equipped enemy observer, it is understandable that military interest in the image converter eventually faded.
The tactical military disadvantages of so-called ‘active’ (i.e. search beam-equipped)
thermal-imaging systems provided impetus following the 1939–45 war for extensive
secret military infrared-research programs into the possibilities of developing ‘passive’
(no search beam) systems based around the extremely sensitive photon detector.
During this period, military secrecy prevented disclosure of the status of infraredimaging technology. This secrecy only began to be lifted in the middle of the 1950s,
and viable thermal-imaging devices finally began to be available to civilian science
and industry.
136
Publ. No. 1558567 Rev. a269 – ENGLISH (EN) – March 18, 2008
19
Theory of thermography
19.1
Introduction
The subjects of infrared radiation and the related technique of thermography are still
new to many who will use an infrared camera. In this section the theory behind thermography will be given.
19.2
The electromagnetic spectrum
19
The electromagnetic spectrum is divided arbitrarily into a number of wavelength regions, called bands, distinguished by the methods used to produce and detect the
radiation. There is no fundamental difference between radiation in the different bands
of the electromagnetic spectrum. They are all governed by the same laws and the
only differences are those due to differences in wavelength.
10067803;a1
Figure 19.1 The electromagnetic spectrum. 1: X-ray; 2: UV; 3: Visible; 4: IR; 5: Microwaves; 6: Radiowaves.
Thermography makes use of the infrared spectral band. At the short-wavelength end
the boundary lies at the limit of visual perception, in the deep red. At the long-wavelength end it merges with the microwave radio wavelengths, in the millimeter range.
The infrared band is often further subdivided into four smaller bands, the boundaries
of which are also arbitrarily chosen. They include: the near infrared (0.75–3 μm), the
middle infrared (3–6 μm), the far infrared (6–15 μm) and the extreme infrared (15–100
Publ. No. 1558567 Rev. a269 – ENGLISH (EN) – March 18, 2008
137
19 – Theory of thermography
μm). Although the wavelengths are given in μm (micrometers), other units are often
still used to measure wavelength in this spectral region, e.g. nanometer (nm) and
Ångström (Å).
The relationships between the different wavelength measurements is:
19.3
19
Blackbody radiation
A blackbody is defined as an object which absorbs all radiation that impinges on it
at any wavelength. The apparent misnomer black relating to an object emitting radiation is explained by Kirchhoff’s Law (after Gustav Robert Kirchhoff, 1824–1887), which
states that a body capable of absorbing all radiation at any wavelength is equally
capable in the emission of radiation.
10398803;a1
Figure 19.2 Gustav Robert Kirchhoff (1824–1887)
The construction of a blackbody source is, in principle, very simple. The radiation
characteristics of an aperture in an isotherm cavity made of an opaque absorbing
material represents almost exactly the properties of a blackbody. A practical application
of the principle to the construction of a perfect absorber of radiation consists of a box
that is light tight except for an aperture in one of the sides. Any radiation which then
enters the hole is scattered and absorbed by repeated reflections so only an infinitesimal fraction can possibly escape. The blackness which is obtained at the aperture
is nearly equal to a blackbody and almost perfect for all wavelengths.
By providing such an isothermal cavity with a suitable heater it becomes what is
termed a cavity radiator. An isothermal cavity heated to a uniform temperature generates blackbody radiation, the characteristics of which are determined solely by the
temperature of the cavity. Such cavity radiators are commonly used as sources of
radiation in temperature reference standards in the laboratory for calibrating thermographic instruments, such as a FLIR Systems camera for example.
138
Publ. No. 1558567 Rev. a269 – ENGLISH (EN) – March 18, 2008
19 – Theory of thermography
If the temperature of blackbody radiation increases to more than 525°C (977°F), the
source begins to be visible so that it appears to the eye no longer black. This is the
incipient red heat temperature of the radiator, which then becomes orange or yellow
as the temperature increases further. In fact, the definition of the so-called color
temperature of an object is the temperature to which a blackbody would have to be
heated to have the same appearance.
Now consider three expressions that describe the radiation emitted from a blackbody.
19.3.1
Planck’s law
19
10399203;a1
Figure 19.3 Max Planck (1858–1947)
Max Planck (1858–1947) was able to describe the spectral distribution of the radiation
from a blackbody by means of the following formula:
where:
Wλb
Blackbody spectral radiant emittance at wavelength λ.
c
Velocity of light = 3 × 10⁸ m/s
h
Planck’s constant = 6.6 × 10⁻³⁴ Joule sec.
k
Boltzmann’s constant = 1.4 × 10⁻²³ Joule/K.
T
Absolute temperature (K) of a blackbody.
λ
Wavelength (μm).
Publ. No. 1558567 Rev. a269 – ENGLISH (EN) – March 18, 2008
139
19 – Theory of thermography
➲ The factor 10-6 is used since spectral emittance in the curves is expressed in
Watt/m2, μm.
Planck’s formula, when plotted graphically for various temperatures, produces a
family of curves. Following any particular Planck curve, the spectral emittance is zero
at λ = 0, then increases rapidly to a maximum at a wavelength λmax and after passing
it approaches zero again at very long wavelengths. The higher the temperature, the
shorter the wavelength at which maximum occurs.
10327103;a4
19
Figure 19.4 Blackbody spectral radiant emittance according to Planck’s law, plotted for various absolute
temperatures. 1: Spectral radiant emittance (W/cm2 × 103(μm)); 2: Wavelength (μm)
19.3.2
Wien’s displacement law
By differentiating Planck’s formula with respect to λ, and finding the maximum, we
have:
This is Wien’s formula (after Wilhelm Wien, 1864–1928), which expresses mathematically the common observation that colors vary from red to orange or yellow as the
temperature of a thermal radiator increases. The wavelength of the color is the same
as the wavelength calculated for λmax. A good approximation of the value of λmax for
a given blackbody temperature is obtained by applying the rule-of-thumb 3 000/T
140
Publ. No. 1558567 Rev. a269 – ENGLISH (EN) – March 18, 2008
19 – Theory of thermography
μm. Thus, a very hot star such as Sirius (11 000 K), emitting bluish-white light, radiates
with the peak of spectral radiant emittance occurring within the invisible ultraviolet
spectrum, at wavelength 0.27 μm.
10399403;a1
19
Figure 19.5 Wilhelm Wien (1864–1928)
The sun (approx. 6 000 K) emits yellow light, peaking at about 0.5 μm in the middle
of the visible light spectrum.
At room temperature (300 K) the peak of radiant emittance lies at 9.7 μm, in the far
infrared, while at the temperature of liquid nitrogen (77 K) the maximum of the almost
insignificant amount of radiant emittance occurs at 38 μm, in the extreme infrared
wavelengths.
Publ. No. 1558567 Rev. a269 – ENGLISH (EN) – March 18, 2008
141
19 – Theory of thermography
10327203;a4
19
Figure 19.6 Planckian curves plotted on semi-log scales from 100 K to 1000 K. The dotted line represents
the locus of maximum radiant emittance at each temperature as described by Wien's displacement law.
1: Spectral radiant emittance (W/cm2 (μm)); 2: Wavelength (μm).
19.3.3
Stefan-Boltzmann's law
By integrating Planck’s formula from λ = 0 to λ = ∞, we obtain the total radiant
emittance (Wb) of a blackbody:
This is the Stefan-Boltzmann formula (after Josef Stefan, 1835–1893, and Ludwig
Boltzmann, 1844–1906), which states that the total emissive power of a blackbody is
proportional to the fourth power of its absolute temperature. Graphically, Wb represents
the area below the Planck curve for a particular temperature. It can be shown that the
radiant emittance in the interval λ = 0 to λmax is only 25% of the total, which represents
about the amount of the sun’s radiation which lies inside the visible light spectrum.
142
Publ. No. 1558567 Rev. a269 – ENGLISH (EN) – March 18, 2008
19 – Theory of thermography
10399303;a1
19
Figure 19.7 Josef Stefan (1835–1893), and Ludwig Boltzmann (1844–1906)
Using the Stefan-Boltzmann formula to calculate the power radiated by the human
body, at a temperature of 300 K and an external surface area of approx. 2 m2, we
obtain 1 kW. This power loss could not be sustained if it were not for the compensating
absorption of radiation from surrounding surfaces, at room temperatures which do
not vary too drastically from the temperature of the body – or, of course, the addition
of clothing.
19.3.4
Non-blackbody emitters
So far, only blackbody radiators and blackbody radiation have been discussed.
However, real objects almost never comply with these laws over an extended wavelength region – although they may approach the blackbody behavior in certain
spectral intervals. For example, a certain type of white paint may appear perfectly
white in the visible light spectrum, but becomes distinctly gray at about 2 μm, and
beyond 3 μm it is almost black.
There are three processes which can occur that prevent a real object from acting like
a blackbody: a fraction of the incident radiation α may be absorbed, a fraction ρ may
be reflected, and a fraction τ may be transmitted. Since all of these factors are more
or less wavelength dependent, the subscript λ is used to imply the spectral dependence of their definitions. Thus:
■
■
■
The spectral absorptance αλ= the ratio of the spectral radiant power absorbed by
an object to that incident upon it.
The spectral reflectance ρλ = the ratio of the spectral radiant power reflected by
an object to that incident upon it.
The spectral transmittance τλ = the ratio of the spectral radiant power transmitted
through an object to that incident upon it.
The sum of these three factors must always add up to the whole at any wavelength,
so we have the relation:
Publ. No. 1558567 Rev. a269 – ENGLISH (EN) – March 18, 2008
143
19 – Theory of thermography
For opaque materials τλ = 0 and the relation simplifies to:
Another factor, called the emissivity, is required to describe the fraction ε of the radiant
emittance of a blackbody produced by an object at a specific temperature. Thus, we
have the definition:
The spectral emissivity ελ= the ratio of the spectral radiant power from an object to
that from a blackbody at the same temperature and wavelength.
19
Expressed mathematically, this can be written as the ratio of the spectral emittance
of the object to that of a blackbody as follows:
Generally speaking, there are three types of radiation source, distinguished by the
ways in which the spectral emittance of each varies with wavelength.
■
■
■
A blackbody, for which ελ = ε = 1
A graybody, for which ελ = ε = constant less than 1
A selective radiator, for which ε varies with wavelength
According to Kirchhoff’s law, for any material the spectral emissivity and spectral absorptance of a body are equal at any specified temperature and wavelength. That is:
From this we obtain, for an opaque material (since αλ + ρλ = 1):
For highly polished materials ελ approaches zero, so that for a perfectly reflecting
material (i.e. a perfect mirror) we have:
For a graybody radiator, the Stefan-Boltzmann formula becomes:
This states that the total emissive power of a graybody is the same as a blackbody
at the same temperature reduced in proportion to the value of ε from the graybody.
144
Publ. No. 1558567 Rev. a269 – ENGLISH (EN) – March 18, 2008
19 – Theory of thermography
10401203;a2
19
Figure 19.8 Spectral radiant emittance of three types of radiators. 1: Spectral radiant emittance; 2:
Wavelength; 3: Blackbody; 4: Selective radiator; 5: Graybody.
10327303;a4
Figure 19.9 Spectral emissivity of three types of radiators. 1: Spectral emissivity; 2: Wavelength; 3:
Blackbody; 4: Graybody; 5: Selective radiator.
19.4
Infrared semi-transparent materials
Consider now a non-metallic, semi-transparent body – let us say, in the form of a thick
flat plate of plastic material. When the plate is heated, radiation generated within its
volume must work its way toward the surfaces through the material in which it is
partially absorbed. Moreover, when it arrives at the surface, some of it is reflected
back into the interior. The back-reflected radiation is again partially absorbed, but
Publ. No. 1558567 Rev. a269 – ENGLISH (EN) – March 18, 2008
145
19 – Theory of thermography
some of it arrives at the other surface, through which most of it escapes; part of it is
reflected back again. Although the progressive reflections become weaker and
weaker they must all be added up when the total emittance of the plate is sought.
When the resulting geometrical series is summed, the effective emissivity of a semitransparent plate is obtained as:
19
When the plate becomes opaque this formula is reduced to the single formula:
This last relation is a particularly convenient one, because it is often easier to measure
reflectance than to measure emissivity directly.
146
Publ. No. 1558567 Rev. a269 – ENGLISH (EN) – March 18, 2008
20
The measurement formula
As already mentioned, when viewing an object, the camera receives radiation not
only from the object itself. It also collects radiation from the surroundings reflected
via the object surface. Both these radiation contributions become attenuated to some
extent by the atmosphere in the measurement path. To this comes a third radiation
contribution from the atmosphere itself.
This description of the measurement situation, as illustrated in the figure below, is so
far a fairly true description of the real conditions. What has been neglected could for
instance be sun light scattering in the atmosphere or stray radiation from intense radiation sources outside the field of view. Such disturbances are difficult to quantify,
however, in most cases they are fortunately small enough to be neglected. In case
they are not negligible, the measurement configuration is likely to be such that the
risk for disturbance is obvious, at least to a trained operator. It is then his responsibility to modify the measurement situation to avoid the disturbance e.g. by changing
the viewing direction, shielding off intense radiation sources etc.
Accepting the description above, we can use the figure below to derive a formula for
the calculation of the object temperature from the calibrated camera output.
10400503;a1
Figure 20.1 A schematic representation of the general thermographic measurement situation.1: Surroundings; 2: Object; 3: Atmosphere; 4: Camera
Assume that the received radiation power W from a blackbody source of temperature
Tsource on short distance generates a camera output signal Usource that is proportional
to the power input (power linear camera). We can then write (Equation 1):
Publ. No. 1558567 Rev. a269 – ENGLISH (EN) – March 18, 2008
147
20
20 – The measurement formula
or, with simplified notation:
where C is a constant.
Should the source be a graybody with emittance ε, the received radiation would
consequently be εWsource.
We are now ready to write the three collected radiation power terms:
20
1 – Emission from the object = ετWobj, where ε is the emittance of the object and τ
is the transmittance of the atmosphere. The object temperature is Tobj.
2 – Reflected emission from ambient sources = (1 – ε)τWrefl, where (1 – ε) is the reflectance of the object. The ambient sources have the temperature Trefl.
It has here been assumed that the temperature Trefl is the same for all emitting surfaces
within the halfsphere seen from a point on the object surface. This is of course
sometimes a simplification of the true situation. It is, however, a necessary simplification
in order to derive a workable formula, and Trefl can – at least theoretically – be given
a value that represents an efficient temperature of a complex surrounding.
Note also that we have assumed that the emittance for the surroundings = 1. This is
correct in accordance with Kirchhoff’s law: All radiation impinging on the surrounding
surfaces will eventually be absorbed by the same surfaces. Thus the emittance = 1.
(Note though that the latest discussion requires the complete sphere around the object
to be considered.)
3 – Emission from the atmosphere = (1 – τ)τWatm, where (1 – τ) is the emittance of
the atmosphere. The temperature of the atmosphere is Tatm.
The total received radiation power can now be written (Equation 2):
We multiply each term by the constant C of Equation 1 and replace the CW products
by the corresponding U according to the same equation, and get (Equation 3):
Solve Equation 3 for Uobj (Equation 4):
148
Publ. No. 1558567 Rev. a269 – ENGLISH (EN) – March 18, 2008
20 – The measurement formula
This is the general measurement formula used in all the FLIR Systems thermographic
equipment. The voltages of the formula are:
Figure 20.2 Voltages
Uobj
Calculated camera output voltage for a blackbody of temperature
Tobj i.e. a voltage that can be directly converted into true requested
object temperature.
Utot
Measured camera output voltage for the actual case.
Urefl
Theoretical camera output voltage for a blackbody of temperature
Trefl according to the calibration.
Uatm
Theoretical camera output voltage for a blackbody of temperature
Tatm according to the calibration.
The operator has to supply a number of parameter values for the calculation:
■
■
■
■
■
■
the object emittance ε,
the relative humidity,
Tatm
object distance (Dobj)
the (effective) temperature of the object surroundings, or the reflected ambient
temperature Trefl, and
the temperature of the atmosphere Tatm
This task could sometimes be a heavy burden for the operator since there are normally
no easy ways to find accurate values of emittance and atmospheric transmittance for
the actual case. The two temperatures are normally less of a problem provided the
surroundings do not contain large and intense radiation sources.
A natural question in this connection is: How important is it to know the right values
of these parameters? It could though be of interest to get a feeling for this problem
already here by looking into some different measurement cases and compare the
relative magnitudes of the three radiation terms. This will give indications about when
it is important to use correct values of which parameters.
The figures below illustrates the relative magnitudes of the three radiation contributions
for three different object temperatures, two emittances, and two spectral ranges: SW
and LW. Remaining parameters have the following fixed values:
■
■
■
τ = 0.88
Trefl = +20°C (+68°F)
Tatm = +20°C (+68°F)
Publ. No. 1558567 Rev. a269 – ENGLISH (EN) – March 18, 2008
149
20
20 – The measurement formula
It is obvious that measurement of low object temperatures are more critical than
measuring high temperatures since the ‘disturbing’ radiation sources are relatively
much stronger in the first case. Should also the object emittance be low, the situation
would be still more difficult.
We have finally to answer a question about the importance of being allowed to use
the calibration curve above the highest calibration point, what we call extrapolation.
Imagine that we in a certain case measure Utot = 4.5 volts. The highest calibration
point for the camera was in the order of 4.1 volts, a value unknown to the operator.
Thus, even if the object happened to be a blackbody, i.e. Uobj = Utot, we are actually
performing extrapolation of the calibration curve when converting 4.5 volts into temperature.
20
Let us now assume that the object is not black, it has an emittance of 0.75, and the
transmittance is 0.92. We also assume that the two second terms of Equation 4 amount
to 0.5 volts together. Computation of Uobj by means of Equation 4 then results in Uobj
= 4.5 / 0.75 / 0.92 – 0.5 = 6.0. This is a rather extreme extrapolation, particularly when
considering that the video amplifier might limit the output to 5 volts! Note, though,
that the application of the calibration curve is a theoretical procedure where no electronic or other limitations exist. We trust that if there had been no signal limitations in
the camera, and if it had been calibrated far beyond 5 volts, the resulting curve would
have been very much the same as our real curve extrapolated beyond 4.1 volts, provided the calibration algorithm is based on radiation physics, like the FLIR Systems
algorithm. Of course there must be a limit to such extrapolations.
150
Publ. No. 1558567 Rev. a269 – ENGLISH (EN) – March 18, 2008
20 – The measurement formula
10400603;a2
20
Figure 20.3 Relative magnitudes of radiation sources under varying measurement conditions (SW camera).
1: Object temperature; 2: Emittance; Obj: Object radiation; Refl: Reflected radiation; Atm: atmosphere
radiation. Fixed parameters: τ = 0.88; Trefl = 20°C (+68°F); Tatm = 20°C (+68°F).
Publ. No. 1558567 Rev. a269 – ENGLISH (EN) – March 18, 2008
151
20 – The measurement formula
10400703;a2
20
Figure 20.4 Relative magnitudes of radiation sources under varying measurement conditions (LW camera).
1: Object temperature; 2: Emittance; Obj: Object radiation; Refl: Reflected radiation; Atm: atmosphere
radiation. Fixed parameters: τ = 0.88; Trefl = 20°C (+68°F); Tatm = 20°C (+68°F).
152
Publ. No. 1558567 Rev. a269 – ENGLISH (EN) – March 18, 2008
21
Emissivity tables
This section presents a compilation of emissivity data from the infrared literature and
measurements made by FLIR Systems.
21.1
References
1
Mikaél A. Bramson: Infrared Radiation, A Handbook for Applications, Plenum press,
N.Y.
2
William L. Wolfe, George J. Zissis: The Infrared Handbook, Office of Naval Research,
Department of Navy, Washington, D.C.
3
Madding, R. P.: Thermographic Instruments and systems. Madison, Wisconsin: University of Wisconsin – Extension, Department of Engineering and Applied Science.
4
William L. Wolfe: Handbook of Military Infrared Technology, Office of Naval Research,
Department of Navy, Washington, D.C.
5
Jones, Smith, Probert: External thermography of buildings..., Proc. of the Society of
Photo-Optical Instrumentation Engineers, vol.110, Industrial and Civil Applications of
Infrared Technology, June 1977 London.
6
Paljak, Pettersson: Thermography of Buildings, Swedish Building Research Institute,
Stockholm 1972.
7
Vlcek, J: Determination of emissivity with imaging radiometers and some emissivities
at λ = 5 µm. Photogrammetric Engineering and Remote Sensing.
8
Kern: Evaluation of infrared emission of clouds and ground as measured by weather
satellites, Defence Documentation Center, AD 617 417.
9
Öhman, Claes: Emittansmätningar med AGEMA E-Box. Teknisk rapport, AGEMA 1999.
(Emittance measurements using AGEMA E-Box. Technical report, AGEMA 1999.)
21.2
Important note about the emissivity tables
The emissivity values in the table below are recorded using a shortwave (SW) camera.
The values should be regarded as recommendations only and used by caution.
21.3
Tables
Figure 21.1 T: Total spectrum; SW: 2–5 µm; LW: 8–14 µm, LLW: 6.5–20 µm; 1: Material; 2: Specification;
3: Temperature in °C; 4: Spectrum; 5: Emissivity: 6: Reference
1
2
3
4
5
6
Aluminum
anodized, black,
dull
70
LW
0.95
9
Aluminum
anodized, black,
dull
70
SW
0.67
9
Publ. No. 1558567 Rev. a269 – ENGLISH (EN) – March 18, 2008
153
21
21 – Emissivity tables
21
1
2
3
4
5
6
Aluminum
anodized, light
gray, dull
70
LW
0.97
9
Aluminum
anodized, light
gray, dull
70
SW
0.61
9
Aluminum
anodized sheet
100
T
0.55
2
Aluminum
as received, plate
100
T
0.09
4
Aluminum
as received, sheet
100
T
0.09
2
Aluminum
cast, blast cleaned
70
LW
0.46
9
Aluminum
cast, blast cleaned
70
SW
0.47
9
Aluminum
dipped in HNO3,
plate
100
T
0.05
4
Aluminum
foil
27
3 µm
0.09
3
Aluminum
foil
27
10 µm
0.04
3
Aluminum
oxidized, strongly
50–500
T
0.2–0.3
1
Aluminum
polished
50–100
T
0.04–0.06
1
Aluminum
polished, sheet
100
T
0.05
2
Aluminum
polished plate
100
T
0.05
4
Aluminum
roughened
27
3 µm
0.28
3
Aluminum
roughened
27
10 µm
0.18
3
Aluminum
rough surface
20–50
T
0.06–0.07
1
Aluminum
sheet, 4 samples
differently
scratched
70
LW
0.03–0.06
9
Aluminum
sheet, 4 samples
differently
scratched
70
SW
0.05–0.08
9
Aluminum
vacuum deposited
20
T
0.04
2
Aluminum
weathered, heavily
17
SW
0.83–0.94
5
20
T
0.60
1
Aluminum bronze
Aluminum hydroxide
powder
T
0.28
1
Aluminum oxide
activated, powder
T
0.46
1
154
Publ. No. 1558567 Rev. a269 – ENGLISH (EN) – March 18, 2008
21 – Emissivity tables
1
2
Aluminum oxide
pure, powder (alumina)
Asbestos
board
Asbestos
fabric
Asbestos
floor tile
Asbestos
paper
Asbestos
powder
Asbestos
slate
Asphalt paving
3
4
5
6
T
0.16
1
T
0.96
1
T
0.78
1
35
SW
0.94
7
40–400
T
0.93–0.95
1
T
0.40–0.60
1
20
T
0.96
1
4
LLW
0.967
8
20
Brass
dull, tarnished
20–350
T
0.22
1
Brass
oxidized
70
SW
0.04–0.09
9
Brass
oxidized
70
LW
0.03–0.07
9
Brass
oxidized
100
T
0.61
2
Brass
oxidized at 600°C
200–600
T
0.59–0.61
1
Brass
polished
200
T
0.03
1
Brass
polished, highly
100
T
0.03
2
Brass
rubbed with 80grit emery
20
T
0.20
2
Brass
sheet, rolled
20
T
0.06
1
Brass
sheet, worked with
emery
20
T
0.2
1
Brick
alumina
17
SW
0.68
5
Brick
common
17
SW
0.86–0.81
5
Brick
Dinas silica,
glazed, rough
1100
T
0.85
1
Brick
Dinas silica, refractory
1000
T
0.66
1
Brick
Dinas silica,
unglazed, rough
1000
T
0.80
1
Brick
firebrick
17
SW
0.68
5
Brick
fireclay
20
T
0.85
1
Publ. No. 1558567 Rev. a269 – ENGLISH (EN) – March 18, 2008
21
155
21 – Emissivity tables
21
1
2
3
4
5
6
Brick
fireclay
1000
T
0.75
1
Brick
fireclay
1200
T
0.59
1
Brick
masonry
35
SW
0.94
7
Brick
masonry, plastered
20
T
0.94
1
Brick
red, common
20
T
0.93
2
Brick
red, rough
20
T
0.88–0.93
1
Brick
refractory, corundum
1000
T
0.46
1
Brick
refractory, magnesite
1000–1300
T
0.38
1
Brick
refractory, strongly
radiating
500–1000
T
0.8–0.9
1
Brick
refractory, weakly
radiating
500–1000
T
0.65–0.75
1
Brick
silica, 95% SiO2
1230
T
0.66
1
Brick
sillimanite, 33%
SiO2, 64% Al2O3
1500
T
0.29
1
Brick
waterproof
17
SW
0.87
5
Bronze
phosphor bronze
70
LW
0.06
9
Bronze
phosphor bronze
70
SW
0.08
9
Bronze
polished
50
T
0.1
1
Bronze
porous, rough
50–150
T
0.55
1
Bronze
powder
T
0.76–0.80
1
Carbon
candle soot
T
0.95
2
Carbon
charcoal powder
T
0.96
1
Carbon
graphite, filed surface
T
0.98
2
Carbon
graphite powder
T
0.97
1
Carbon
lampblack
20–400
T
0.95–0.97
1
Chipboard
untreated
20
SW
0.90
6
156
20
20
Publ. No. 1558567 Rev. a269 – ENGLISH (EN) – March 18, 2008
21 – Emissivity tables
1
2
3
4
5
6
Chromium
polished
50
T
0.10
1
Chromium
polished
500–1000
T
0.28–0.38
1
Clay
fired
70
T
0.91
1
Cloth
black
20
T
0.98
1
20
T
0.92
2
Concrete
Concrete
dry
36
SW
0.95
7
Concrete
rough
17
SW
0.97
5
Concrete
walkway
5
LLW
0.974
8
Copper
commercial, burnished
20
T
0.07
1
Copper
electrolytic, carefully polished
80
T
0.018
1
Copper
electrolytic, polished
–34
T
0.006
4
Copper
molten
1100–1300
T
0.13–0.15
1
Copper
oxidized
50
T
0.6–0.7
1
Copper
oxidized, black
27
T
0.78
4
Copper
oxidized, heavily
20
T
0.78
2
Copper
oxidized to blackness
T
0.88
1
Copper
polished
50–100
T
0.02
1
Copper
polished
100
T
0.03
2
Copper
polished, commercial
27
T
0.03
4
Copper
polished, mechanical
22
T
0.015
4
Copper
pure, carefully
prepared surface
22
T
0.008
4
Copper
scraped
27
T
0.07
4
Copper dioxide
powder
T
0.84
1
Copper oxide
red, powder
T
0.70
1
Publ. No. 1558567 Rev. a269 – ENGLISH (EN) – March 18, 2008
21
157
21 – Emissivity tables
1
2
3
4
5
6
T
0.89
1
80
T
0.85
1
20
T
0.9
1
Ebonite
Emery
coarse
Enamel
21
Enamel
lacquer
20
T
0.85–0.95
1
Fiber board
hard, untreated
20
SW
0.85
6
Fiber board
masonite
70
LW
0.88
9
Fiber board
masonite
70
SW
0.75
9
Fiber board
particle board
70
LW
0.89
9
Fiber board
particle board
70
SW
0.77
9
Fiber board
porous, untreated
20
SW
0.85
6
Gold
polished
130
T
0.018
1
Gold
polished, carefully
200–600
T
0.02–0.03
1
Gold
polished, highly
100
T
0.02
2
Granite
polished
20
LLW
0.849
8
Granite
rough
21
LLW
0.879
8
Granite
rough, 4 different
samples
70
LW
0.77–0.87
9
Granite
rough, 4 different
samples
70
SW
0.95–0.97
9
20
T
0.8–0.9
1
Gypsum
Ice: See Water
Iron, cast
casting
50
T
0.81
1
Iron, cast
ingots
1000
T
0.95
1
Iron, cast
liquid
1300
T
0.28
1
Iron, cast
machined
800–1000
T
0.60–0.70
1
Iron, cast
oxidized
38
T
0.63
4
Iron, cast
oxidized
100
T
0.64
2
Iron, cast
oxidized
260
T
0.66
4
Iron, cast
oxidized
538
T
0.76
4
158
Publ. No. 1558567 Rev. a269 – ENGLISH (EN) – March 18, 2008
21 – Emissivity tables
1
2
3
4
5
6
Iron, cast
oxidized at 600°C
200–600
T
0.64–0.78
1
Iron, cast
polished
38
T
0.21
4
Iron, cast
polished
40
T
0.21
2
Iron, cast
polished
200
T
0.21
1
Iron, cast
unworked
900–1100
T
0.87–0.95
1
Iron and steel
cold rolled
70
LW
0.09
9
Iron and steel
cold rolled
70
SW
0.20
9
Iron and steel
covered with red
rust
20
T
0.61–0.85
1
Iron and steel
electrolytic
22
T
0.05
4
Iron and steel
electrolytic
100
T
0.05
4
Iron and steel
electrolytic
260
T
0.07
4
Iron and steel
electrolytic, carefully polished
175–225
T
0.05–0.06
1
Iron and steel
freshly worked
with emery
20
T
0.24
1
Iron and steel
ground sheet
950–1100
T
0.55–0.61
1
Iron and steel
heavily rusted
sheet
20
T
0.69
2
Iron and steel
hot rolled
20
T
0.77
1
Iron and steel
hot rolled
130
T
0.60
1
Iron and steel
oxidized
100
T
0.74
1
Iron and steel
oxidized
100
T
0.74
4
Iron and steel
oxidized
125–525
T
0.78–0.82
1
Iron and steel
oxidized
200
T
0.79
2
Iron and steel
oxidized
1227
T
0.89
4
Iron and steel
oxidized
200–600
T
0.80
1
Iron and steel
oxidized strongly
50
T
0.88
1
Iron and steel
oxidized strongly
500
T
0.98
1
Iron and steel
polished
100
T
0.07
2
Publ. No. 1558567 Rev. a269 – ENGLISH (EN) – March 18, 2008
21
159
21 – Emissivity tables
21
1
2
3
4
5
6
Iron and steel
polished
400–1000
T
0.14–0.38
1
Iron and steel
polished sheet
750–1050
T
0.52–0.56
1
Iron and steel
rolled, freshly
20
T
0.24
1
Iron and steel
rolled sheet
50
T
0.56
1
Iron and steel
rough, plane surface
50
T
0.95–0.98
1
Iron and steel
rusted, heavily
17
SW
0.96
5
Iron and steel
rusted red, sheet
22
T
0.69
4
Iron and steel
rusty, red
20
T
0.69
1
Iron and steel
shiny, etched
150
T
0.16
1
Iron and steel
shiny oxide layer,
sheet,
20
T
0.82
1
Iron and steel
wrought, carefully
polished
40–250
T
0.28
1
Iron galvanized
heavily oxidized
70
LW
0.85
9
Iron galvanized
heavily oxidized
70
SW
0.64
9
Iron galvanized
sheet
92
T
0.07
4
Iron galvanized
sheet, burnished
30
T
0.23
1
Iron galvanized
sheet, oxidized
20
T
0.28
1
Iron tinned
sheet
24
T
0.064
4
Lacquer
3 colors sprayed
on Aluminum
70
LW
0.92–0.94
9
Lacquer
3 colors sprayed
on Aluminum
70
SW
0.50–0.53
9
Lacquer
Aluminum on
rough surface
20
T
0.4
1
Lacquer
bakelite
80
T
0.83
1
Lacquer
black, dull
40–100
T
0.96–0.98
1
Lacquer
black, matte
100
T
0.97
2
Lacquer
black, shiny,
sprayed on iron
20
T
0.87
1
160
Publ. No. 1558567 Rev. a269 – ENGLISH (EN) – March 18, 2008
21 – Emissivity tables
1
2
3
4
5
6
Lacquer
heat–resistant
100
T
0.92
1
Lacquer
white
40–100
T
0.8–0.95
1
Lacquer
white
100
T
0.92
2
Lead
oxidized, gray
20
T
0.28
1
Lead
oxidized, gray
22
T
0.28
4
Lead
oxidized at 200°C
200
T
0.63
1
Lead
shiny
250
T
0.08
1
Lead
unoxidized, polished
100
T
0.05
4
Lead red
100
T
0.93
4
Lead red, powder
100
T
0.93
1
T
0.75–0.80
1
T
0.3–0.4
1
Leather
tanned
Lime
Magnesium
22
T
0.07
4
Magnesium
260
T
0.13
4
Magnesium
538
T
0.18
4
20
T
0.07
2
T
0.86
1
Magnesium
polished
Magnesium powder
Molybdenum
600–1000
T
0.08–0.13
1
Molybdenum
1500–2200
T
0.19–0.26
1
700–2500
T
0.1–0.3
1
17
SW
0.87
5
Molybdenum
filament
Mortar
Mortar
dry
36
SW
0.94
7
Nichrome
rolled
700
T
0.25
1
Nichrome
sandblasted
700
T
0.70
1
Nichrome
wire, clean
50
T
0.65
1
Nichrome
wire, clean
500–1000
T
0.71–0.79
1
Nichrome
wire, oxidized
50–500
T
0.95–0.98
1
Publ. No. 1558567 Rev. a269 – ENGLISH (EN) – March 18, 2008
21
161
21 – Emissivity tables
21
1
2
3
4
5
6
Nickel
bright matte
122
T
0.041
4
Nickel
commercially
pure, polished
100
T
0.045
1
Nickel
commercially
pure, polished
200–400
T
0.07–0.09
1
Nickel
electrolytic
22
T
0.04
4
Nickel
electrolytic
38
T
0.06
4
Nickel
electrolytic
260
T
0.07
4
Nickel
electrolytic
538
T
0.10
4
Nickel
electroplated, polished
20
T
0.05
2
Nickel
electroplated on
iron, polished
22
T
0.045
4
Nickel
electroplated on
iron, unpolished
20
T
0.11–0.40
1
Nickel
electroplated on
iron, unpolished
22
T
0.11
4
Nickel
oxidized
200
T
0.37
2
Nickel
oxidized
227
T
0.37
4
Nickel
oxidized
1227
T
0.85
4
Nickel
oxidized at 600°C
200–600
T
0.37–0.48
1
Nickel
polished
122
T
0.045
4
Nickel
wire
200–1000
T
0.1–0.2
1
Nickel oxide
500–650
T
0.52–0.59
1
Nickel oxide
1000–1250
T
0.75–0.86
1
Oil, lubricating
0.025 mm film
20
T
0.27
2
Oil, lubricating
0.050 mm film
20
T
0.46
2
Oil, lubricating
0.125 mm film
20
T
0.72
2
Oil, lubricating
film on Ni base: Ni
base only
20
T
0.05
2
Oil, lubricating
thick coating
20
T
0.82
2
162
Publ. No. 1558567 Rev. a269 – ENGLISH (EN) – March 18, 2008
21 – Emissivity tables
1
2
3
4
5
6
Paint
8 different colors
and qualities
70
LW
0.92–0.94
9
Paint
8 different colors
and qualities
70
SW
0.88–0.96
9
Paint
Aluminum, various
ages
50–100
T
0.27–0.67
1
Paint
cadmium yellow
T
0.28–0.33
1
Paint
chrome green
T
0.65–0.70
1
Paint
cobalt blue
T
0.7–0.8
1
Paint
oil
17
SW
0.87
5
Paint
oil, black flat
20
SW
0.94
6
Paint
oil, black gloss
20
SW
0.92
6
Paint
oil, gray flat
20
SW
0.97
6
Paint
oil, gray gloss
20
SW
0.96
6
Paint
oil, various colors
100
T
0.92–0.96
1
Paint
oil based, average
of 16 colors
100
T
0.94
2
Paint
plastic, black
20
SW
0.95
6
Paint
plastic, white
20
SW
0.84
6
Paper
4 different colors
70
LW
0.92–0.94
9
Paper
4 different colors
70
SW
0.68–0.74
9
Paper
black
T
0.90
1
Paper
black, dull
T
0.94
1
Paper
black, dull
70
LW
0.89
9
Paper
black, dull
70
SW
0.86
9
Paper
blue, dark
T
0.84
1
Paper
coated with black
lacquer
T
0.93
1
Paper
green
T
0.85
1
Paper
red
T
0.76
1
Paper
white
T
0.7–0.9
1
20
Publ. No. 1558567 Rev. a269 – ENGLISH (EN) – March 18, 2008
21
163
21 – Emissivity tables
1
2
3
4
5
6
Paper
white, 3 different
glosses
70
LW
0.88–0.90
9
Paper
white, 3 different
glosses
70
SW
0.76–0.78
9
Paper
white bond
20
T
0.93
2
Paper
yellow
T
0.72
1
17
SW
0.86
5
Plaster
21
Plaster
plasterboard, untreated
20
SW
0.90
6
Plaster
rough coat
20
T
0.91
2
Plastic
glass fibre laminate (printed circ.
board)
70
LW
0.91
9
Plastic
glass fibre laminate (printed circ.
board)
70
SW
0.94
9
Plastic
polyurethane isolation board
70
LW
0.55
9
Plastic
polyurethane isolation board
70
SW
0.29
9
Plastic
PVC, plastic floor,
dull, structured
70
LW
0.93
9
Plastic
PVC, plastic floor,
dull, structured
70
SW
0.94
9
Platinum
17
T
0.016
4
Platinum
22
T
0.03
4
Platinum
100
T
0.05
4
Platinum
260
T
0.06
4
Platinum
538
T
0.10
4
Platinum
1000–1500
T
0.14–0.18
1
Platinum
1094
T
0.18
4
Platinum
pure, polished
200–600
T
0.05–0.10
1
Platinum
ribbon
900–1100
T
0.12–0.17
1
164
Publ. No. 1558567 Rev. a269 – ENGLISH (EN) – March 18, 2008
21 – Emissivity tables
1
2
3
4
5
6
Platinum
wire
50–200
T
0.06–0.07
1
Platinum
wire
500–1000
T
0.10–0.16
1
Platinum
wire
1400
T
0.18
1
Porcelain
glazed
20
T
0.92
1
Porcelain
white, shiny
T
0.70–0.75
1
Rubber
hard
20
T
0.95
1
Rubber
soft, gray, rough
20
T
0.95
1
T
0.60
1
20
T
0.90
2
Sand
Sand
Sandstone
polished
19
LLW
0.909
8
Sandstone
rough
19
LLW
0.935
8
Silver
polished
100
T
0.03
2
Silver
pure, polished
200–600
T
0.02–0.03
1
Skin
human
32
T
0.98
2
Slag
boiler
0–100
T
0.97–0.93
1
Slag
boiler
200–500
T
0.89–0.78
1
Slag
boiler
600–1200
T
0.76–0.70
1
Slag
boiler
1400–1800
T
0.69–0.67
1
Soil
dry
20
T
0.92
2
Soil
saturated with water
20
T
0.95
2
Stainless steel
alloy, 8% Ni, 18%
Cr
500
T
0.35
1
Stainless steel
rolled
700
T
0.45
1
Stainless steel
sandblasted
700
T
0.70
1
Stainless steel
sheet, polished
70
LW
0.14
9
Stainless steel
sheet, polished
70
SW
0.18
9
21
Snow: See Water
Publ. No. 1558567 Rev. a269 – ENGLISH (EN) – March 18, 2008
165
21 – Emissivity tables
21
1
2
3
4
5
6
Stainless steel
sheet, untreated,
somewhat
scratched
70
LW
0.28
9
Stainless steel
sheet, untreated,
somewhat
scratched
70
SW
0.30
9
Stainless steel
type 18-8, buffed
20
T
0.16
2
Stainless steel
type 18-8, oxidized at 800°C
60
T
0.85
2
Stucco
rough, lime
10–90
T
0.91
1
Styrofoam
insulation
37
SW
0.60
7
T
0.79–0.84
1
Tar
Tar
paper
20
T
0.91–0.93
1
Tile
glazed
17
SW
0.94
5
Tin
burnished
20–50
T
0.04–0.06
1
Tin
tin–plated sheet
iron
100
T
0.07
2
Titanium
oxidized at 540°C
200
T
0.40
1
Titanium
oxidized at 540°C
500
T
0.50
1
Titanium
oxidized at 540°C
1000
T
0.60
1
Titanium
polished
200
T
0.15
1
Titanium
polished
500
T
0.20
1
Titanium
polished
1000
T
0.36
1
Tungsten
200
T
0.05
1
Tungsten
600–1000
T
0.1–0.16
1
Tungsten
1500–2200
T
0.24–0.31
1
Tungsten
filament
3300
T
0.39
1
Varnish
flat
20
SW
0.93
6
Varnish
on oak parquet
floor
70
LW
0.90–0.93
9
Varnish
on oak parquet
floor
70
SW
0.90
9
166
Publ. No. 1558567 Rev. a269 – ENGLISH (EN) – March 18, 2008
21 – Emissivity tables
1
2
3
4
5
6
Wallpaper
slight pattern, light
gray
20
SW
0.85
6
Wallpaper
slight pattern, red
20
SW
0.90
6
Water
distilled
20
T
0.96
2
Water
frost crystals
–10
T
0.98
2
Water
ice, covered with
heavy frost
0
T
0.98
1
Water
ice, smooth
–10
T
0.96
2
Water
ice, smooth
0
T
0.97
1
Water
layer >0.1 mm
thick
0–100
T
0.95–0.98
1
Water
snow
T
0.8
1
Water
snow
–10
T
0.85
2
Wood
17
SW
0.98
5
Wood
19
LLW
0.962
8
T
0.5–0.7
1
Wood
ground
Wood
pine, 4 different
samples
70
LW
0.81–0.89
9
Wood
pine, 4 different
samples
70
SW
0.67–0.75
9
Wood
planed
20
T
0.8–0.9
1
Wood
planed oak
20
T
0.90
2
Wood
planed oak
70
LW
0.88
9
Wood
planed oak
70
SW
0.77
9
Wood
plywood, smooth,
dry
36
SW
0.82
7
Wood
plywood, untreated
20
SW
0.83
6
Wood
white, damp
20
T
0.7–0.8
1
Zinc
oxidized at 400°C
400
T
0.11
1
Zinc
oxidized surface
1000–1200
T
0.50–0.60
1
Publ. No. 1558567 Rev. a269 – ENGLISH (EN) – March 18, 2008
21
167
21 – Emissivity tables
1
2
3
4
5
6
Zinc
polished
200–300
T
0.04–0.05
1
Zinc
sheet
50
T
0.20
1
21
168
Publ. No. 1558567 Rev. a269 – ENGLISH (EN) – March 18, 2008
22
Glossary
Term or expression
Explanation
absorption (absorption factor)
The amount of radiation absorbed by an object relative to the
received radiation. A number between 0 and 1.
ambient
Objects and gases that emit radiation towards the object being
measured.
atmosphere
The gases between the object being measured and the camera,
normally air.
autoadjust
A function making a camera perform an internal image correction.
autopalette
The IR image is shown with an uneven spread of colors, displaying cold objects as well as hot ones at the same time.
blackbody
Totally non-reflective object. All its radiation is due to its own
temperature.
blackbody radiator
An IR radiating equipment with blackbody properties used to
calibrate IR cameras.
calculated atmospheric transmission
A transmission value computed from the temperature, the relative
humidity of air and the distance to the object.
cavity radiator
A bottle shaped radiator with an absorbing inside, viewed
through the bottleneck.
color temperature
The temperature for which the color of a blackbody matches a
specific color.
conduction
The process that makes heat spread into a material.
continuous adjust
A function that adjusts the image. The function works all the
time, continuously adjusting brightness and contrast according
to the image content.
convection
The process that makes hot air or liquid rise.
difference temperature
A value which is the result of a subtraction between two temperature values.
dual isotherm
An isotherm with two color bands, instead of one.
emissivity (emissivity factor)
The amount of radiation coming from an object, compared to
that of a blackbody. A number between 0 and 1.
emittance
Amount of energy emitted from an object per unit of time and
area (W/m2)
Publ. No. 1558567 Rev. a269 – ENGLISH (EN) – March 18, 2008
169
22
22 – Glossary
22
Term or expression
Explanation
estimated atmospheric transmission
A transmission value, supplied by a user, replacing a calculated
one
external optics
Extra lenses, filters, heat shields etc. that can be put between
the camera and the object being measured.
filter
A material transparent only to some of the infrared wavelengths.
FOV
Field of view: The horizontal angle that can be viewed through
an IR lens.
FPA
Focal plane array: A type of IR detector.
graybody
An object that emits a fixed fraction of the amount of energy of
a blackbody for each wavelength.
IFOV
Instantaneous field of view: A measure of the geometrical resolution of an IR camera.
image correction (internal or external)
A way of compensating for sensitivity differences in various parts
of live images and also of stabilizing the camera.
infrared
Non-visible radiation, having a wavelength from about 2–13 μm.
IR
infrared
isotherm
A function highlighting those parts of an image that fall above,
below or between one or more temperature intervals.
isothermal cavity
A bottle-shaped radiator with a uniform temperature viewed
through the bottleneck.
Laser LocatIR
An electrically powered light source on the camera that emits
laser radiation in a thin, concentrated beam to point at certain
parts of the object in front of the camera.
laser pointer
An electrically powered light source on the camera that emits
laser radiation in a thin, concentrated beam to point at certain
parts of the object in front of the camera.
level
The center value of the temperature scale, usually expressed
as a signal value.
manual adjust
A way to adjust the image by manually changing certain parameters.
NETD
Noise equivalent temperature difference. A measure of the image
noise level of an IR camera.
noise
Undesired small disturbance in the infrared image
object parameters
A set of values describing the circumstances under which the
measurement of an object was made, and the object itself (such
as emissivity, ambient temperature, distance etc.)
170
Publ. No. 1558567 Rev. a269 – ENGLISH (EN) – March 18, 2008
22 – Glossary
Term or expression
Explanation
object signal
A non-calibrated value related to the amount of radiation received by the camera from the object.
palette
The set of colors used to display an IR image.
pixel
Stands for picture element. One single spot in an image.
radiance
Amount of energy emitted from an object per unit of time, area
and angle (W/m2/sr)
radiant power
Amount of energy emitted from an object per unit of time (W)
radiation
The process by which electromagnetic energy, is emitted by an
object or a gas.
radiator
A piece of IR radiating equipment.
range
The current overall temperature measurement limitation of an
IR camera. Cameras can have several ranges. Expressed as
two blackbody temperatures that limit the current calibration.
reference temperature
A temperature which the ordinary measured values can be
compared with.
reflection
The amount of radiation reflected by an object relative to the
received radiation. A number between 0 and 1.
relative humidity
Percentage of water in the air, relative to what is physically
possible. Air temperature dependent.
saturation color
The areas that contain temperatures outside the present level/span settings are colored with the saturation colors. The saturation colors contain an ‘overflow’ color and an ‘underflow’
color. There is also a third red saturation color that marks everything saturated by the detector indicating that the range should
probably be changed.
span
The interval of the temperature scale, usually expressed as a
signal value.
spectral (radiant) emittance
Amount of energy emitted from an object per unit of time, area
and wavelength (W/m2/μm)
temperature range
The current overall temperature measurement limitation of an
IR camera. Cameras can have several ranges. Expressed as
two blackbody temperatures that limit the current calibration.
temperature scale
The way in which an IR image currently is displayed. Expressed
as two temperature values limiting the colors.
thermogram
infrared image
Publ. No. 1558567 Rev. a269 – ENGLISH (EN) – March 18, 2008
22
171
22 – Glossary
Term or expression
Explanation
transmission (or transmittance) factor
Gases and materials can be more or less transparent. Transmission is the amount of IR radiation passing through them. A
number between 0 and 1.
transparent isotherm
An isotherm showing a linear spread of colors, instead of covering the highlighted parts of the image.
visual
Refers to the video mode of a IR camera, as opposed to the
normal, thermographic mode. When a camera is in video mode
it captures ordinary video images, while thermographic images
are captured when the camera is in IR mode.
22
172
Publ. No. 1558567 Rev. a269 – ENGLISH (EN) – March 18, 2008
Index –
Index
*.img: 121
*.jpg: 121
*.seq files
converting: 81
*.tgw: 121
*.tif
8/12-bit: 121
8-bit: 121
12-bit: 121
*.tlw: 121
*.tmw: 121
3
3D View: 101, 102, 105, 106, 110, 112
A
about FLIR Systems: 123
Add: 92
Add a result table: 86
Adobe® PDF document, creating: 25, 85
Advanced: 89
alarm
inserting: 27
All: 112
altitude: 32, 33, 34
arrow
creating: 26
inserting: 26
Atmospheric Temperature: 91, 93
Auto: 102, 106, 107
Auto-adjust: 95
Axes: 103, 108, 115
B
back cover
creating: 47
Background: 103, 108, 115
Backward: 113
Band: 106
bands
extreme infrared: 137
far infrared: 137
middle infrared: 137
near infrared: 137
Bar color: 108
bent line
cloning: 61
creating: 26
Publ. No. 1558567 Rev. a269 – ENGLISH (EN) – March 18, 2008
bent line (continued)
deleting: 62
inserting: 26
moving: 58
selecting: 59
blackbody: 73
construction: 138
explanation: 138
practical application: 138
box
cloning: 61
creating: 26
deleting: 62
inserting: 26
moving: 58
selecting: 59
Browse: 89
C
cavity radiator
applications: 138
explanation: 138
changing
emissivity: 73
chart datum: 32, 33, 34
Check for updates: 85
circle
cloning: 61
creating: 26
deleting: 62
inserting: 26
moving: 58
selecting: 59
cloning
bent line: 61
box: 61
circle: 61
flying spotmeter: 61
line: 61
measurement tools: 61
polygon area: 61
Cold Spot: 97
Color: 103, 108, 115
Colors: 89
Columns: 102, 106
Computed transmission: 94
Connect: 84, 111
connecting
infrared object: 25, 84
23
173
Index – D
23
connecting (continued)
infrared objects: 56
Contents: 86, 118, 119, 120
Contrast: 90
conventions
typographical
italic: 1
monospace: 1
semibold: 1
UPPERCASE: 1
converting *.seq files: 81
copyright: viii
courses: 1
Create AVI File: 85
Create PDF Document: 85
creating
Adobe® PDF document: 25, 85
alarm: 27
arrow: 26
back cover: 47
bent line: 26
box: 26
circle: 26
custom report template: 45, 46, 48
difference calculation: 26
document properties: 68
emissivity table file: 73
flying spotmeter: 26
formula: 75
front cover: 47
isotherm: 27
line: 26
marker: 26
polygon area: 26
report
using QuickInsert: 21
using Rapid Report Manager: 22
using Windows® Explorer: 23
using Wizard: 16
report template: 45, 46, 48
spotmeter: 26
text comment file: 71
Cursor: 97
Custom: 99
customer support: 3
custom report template, creating: 45, 46, 48
D
Delete: 84, 90, 92, 96, 97
Delete Page: 84
deleting
bent line: 62
box: 62
174
deleting (continued)
circle: 62
Field object: 66
flying spotmeter: 62
infrared object: 25, 84
infrared objects: 63
line: 62
measurement tools: 62
page: 25, 84
polygon area: 62
Result Table object: 64
Summary Table object: 65
design mode: 25
Dewar, James: 136
difference calculation
creating: 26
inserting: 26
Digital Photo: 84
Digital Photo object
description: 40
inserting: 24, 49, 84
Display equation on chart: 113
Display R-squared value on chart: 114
distance
explanation: 131
Distance to object: 93, 99
document properties
creating: 68
custom: 68
summary: 68
Duplicate Page: 84
duplicating page: 25, 84
E
Edit: 92
education: 1
electromagnetic spectrum: 137
emissivity
changing: 73
data: 153
definition: 73
explanation: 127
tables: 153
Emissivity: 93, 99
emissivity table file
creating: 73
Exponential: 113
extreme infrared band: 137
F
far infrared band: 137
Field object
deleting: 66
Publ. No. 1558567 Rev. a269 – ENGLISH (EN) – March 18, 2008
Index – G
Field object (continued)
description: 42
inserting: 25, 55, 84
file formats
*.img: 121
*.jpg: 121
*.tgw: 121
*.tlw: 121
*.tmw: 121
8/12-bit *.tif: 121
8-bit *.tif: 121
12-bit *.tif: 121
files
indexing: 13
searching for: 13
Fixed: 102, 107
Fixed transmission: 94
FLIR Reporter Professional
starting
using command: 83
using context-sensitive menus: 83
using toolbar button: 83
FLIR Systems
copyright: viii
history: 123
ISO 9001: viii
legal disclaimer: viii
patents: viii
patents pending: viii
product warranty: viii
quality assurance: viii
quality management system: viii
trademarks: viii
warranty: viii
flying spotmeter
cloning: 61
creating: 26
deleting: 62
inserting: 26
moving: 58
selecting: 59
Font size: 98
formats
*.img: 121
*.jpg: 121
*.tgw: 121
*.tlw: 121
*.tmw: 121
8/12-bit *.tif: 121
8-bit *.tif: 121
12-bit *.tif: 121
formula, creating: 75
Publ. No. 1558567 Rev. a269 – ENGLISH (EN) – March 18, 2008
formulas
Planck's law: 139
Stefan Boltzmann's formula: 142
Wien's displacement law: 140
Formulas: 97
forums: 1
Forward: 113
front cover
creating: 47
fusion, image: 32, 33, 87
G
General: 98, 102, 106, 112
glossary: 172
GPS: 32, 33, 34
graybody: 144
Grid: 103, 115
Grid Lines: 101, 102, 105, 106, 110, 112
Gustav Robert Kirchhoff: 138
H
hardware requirements
PC: 5
heat picture: 135
Height: 100
Help: 85
help, displaying: 25, 85
Herschel, William: 133
histogram
description: 36
inserting: 24, 50, 84
Histogram equalization: 89
history
FLIR Systems: 123
infrared technology: 133
Hot Spot: 97
humidity alarm
inserting: 27
Humidity Alarm Level: 91
23
I
Image: 97
Image Description: 92
image fusion: 32, 33, 87
Image Fusion: 87
images
searching for: 13
Image sequence number: 111
img: 121
indexing files: 13
Indoor air temperature: 90
175
Index – J
23
infrared object
deleting: 25, 84
infrared objects
connecting: 25, 56, 84
deleting: 63
resizing: 57
infrared semi-transparent body: 145
infrared technology
history: 133
Insert Field: 84
inserting
alarm: 27
arrow: 26
bent line: 26
box: 26
circle: 26
difference calculation: 26
Digital Photo object: 24, 49, 84
Field object: 25, 55, 84
flying spotmeter: 26
IR Histogram object: 24, 50, 84
IR Profile object: 24, 51, 84
IR Trending object: 24, 52, 84
IR Viewer object: 24, 49, 84
isotherm: 27
line: 26
marker: 26
polygon area: 26
Result Table object: 24, 53, 84
spotmeter: 26
Summary Table object: 25, 54, 84
Insert Summary Table: 84
Insert Table: 84
installation: 6
insulation alarm
inserting: 27
Insulation factor: 91
Invert palette: 89
IR Histogram: 84
IR Histogram object
description: 36
inserting: 24, 50, 84
toolbar: 29
IR Profile: 84
IR Profile object
description: 35
inserting: 24, 51, 84
toolbar: 28
IR Scale: 102, 106
IR Trending: 84
IR Trending object
description: 38
inserting: 24, 52, 84
176
IR Trending object (continued)
toolbar: 30
IR Viewer: 84
IR Viewer object
description: 32
inserting: 24, 49, 84
toolbar: 26
ISO 9001: viii
isotherm
creating: 27
inserting: 27
Isotherm: 96
Isotherms: 90
italic: 1
Items: 112
J
James Dewar: 136
Josef Stefan: 142
jpg: 121
K
Kirchhoff, Gustav Robert: 138
L
Label: 92, 98
Landriani, Marsilio: 133
Langley, Samuel P.: 136
latitude: 32, 33, 34
laws
Planck's law: 139
Stefan-Boltzmann's formula: 142
Wien's displacement law: 140
legal disclaimer: viii
Legend: 101, 102, 105, 106, 110, 112
Leopoldo Nobili: 135
license information: 1
license number: 6, 7
Limit: 108
line
cloning: 61
creating: 26
deleting: 62
inserting: 26
moving: 58
selecting: 59
Line: 116
Linear: 113
Lines: 104, 109
linking
Microsoft® Word field: 70
text comment: 72
Publ. No. 1558567 Rev. a269 – ENGLISH (EN) – March 18, 2008
Index – M
Logarithmic: 113
longitude: 32, 33, 34
Ludwig Boltzmann: 142
M
Macedonio Melloni: 134
main toolbar: 24
map: 32, 33, 34
marker
creating: 26
inserting: 26
Marsilio Landriani: 133
Max. Temperature: 89, 90, 95, 102, 107
Max Planck: 139
Measurement: 88
measurement formula: 147
measurement situation
general thermographic: 147
Measurement symbol: 98
measurement tools
cloning: 61
deleting: 62
moving: 58
moving between: 60
selecting: 59
Melloni, Macedonio: 134
Microsoft® Word field
linking: 70
middle infrared band: 137
Min. Temperature: 89, 90, 95, 102, 107
monospace: 1
moving
bent line: 58
between measurement tools: 60
box: 58
circle: 58
flying spotmeter: 58
line: 58
measurement tools: 58
polygon area: 58
Moving average: 113
N
Name: 86
near infrared band: 137
Nobili, Leopoldo : 135
non-blackbody emitters: 143
None: 106, 113
Number of columns: 86
Number of rows: 86
Publ. No. 1558567 Rev. a269 – ENGLISH (EN) – March 18, 2008
O
Object Parameters: 93, 99
objects
Digital Photo object: 40
Field object: 42
IR Histogram object: 36
IR Profile object: 35
IR Trending object: 38
IR Viewer object: 32
Result Table object: 41
Summary Table object: 43
Object signal: 95
Open: 87, 117
Open Photo: 88
Open Reporter 8 manual: 85
Outdoor air temperature: 90
P
page
deleting: 25, 84
duplicating: 25, 84
Palette: 90, 96
patents: viii
patents pending: viii
PDF document, creating: 25, 85
Percentage axis: 107
photo
description: 40
inserting: 24, 49, 84
Picture in Picture (PiP): 87
Planck, Max: 139
Plot Area: 103, 108, 115
polygon area
cloning: 61
creating: 26
deleting: 62
inserting: 26
moving: 58
selecting: 59
Polynomial: 113
Power: 113
Pre-defined measurement symbols and
isotherms: 95
Pre-defined object parameters: 95
Pre-defined palette and color distribution: 95
Prediction: 113
Preferences: 95
product warranty: viii
profile
description: 35
inserting: 24, 51, 84
177
23
Index – Q
Q
Rotate Right: 88
quality assurance: viii
quality management system: viii
QuickInsert: 84
S
radiation power terms
emission from atmosphere: 148
emission from object: 148
reflected emission from ambient source: 148
radiation sources
relative magnitudes: 151, 152
radiators
cavity radiator: 138
graybody radiators: 144
selective radiators: 144
radiometric sequence files
converting: 81
Rapid Report Manager, using: 22
Ref#1: 87
Ref#2: 87
Ref#3: 87
reflected apparent temperature
explanation: 131
Reflected apparent temperature: 93, 99
Refresh: 110, 118, 119, 120
Relative air humidity: 91
relative humidity
explanation: 131
Relative humidity: 93
relative magnitudes
radiation sources: 151, 152
releases, service: 1
report, creating
using QuickInsert: 21
using Rapid Report Manager: 22
using Windows® Explorer: 23
using Wizard: 16
report template
creating: 45, 46, 48
requirements
hardware
PC: 5
resizing
infrared objects: 57
result table
description: 41
Result Table object
deleting: 64
description: 41
inserting: 24, 53, 84
Rotate: 100
Rotate Left: 88
Samuel P. Langley: 136
Save As: 87
Scale limits from image: 95
screen elements
Digital Photo object: 40
Field object: 42
IR Histogram object: 36
IR Histogram object toolbar: 29
IR Profile object: 35
IR Profile object toolbar: 28
IR Trending object: 38
IR Trending object toolbar: 30
IR Viewer object: 32
IR Viewer object toolbar: 26
main toolbar: 24
Result Table object: 41
Summary Table object: 43
security device: 6, 7
selecting
bent line: 59
box: 59
circle: 59
flying spotmeter: 59
line: 59
measurement tools: 59
polygon area: 59
Select Language: 85
Select Units: 85
semibold: 1
semi-transparent body: 145
sequence files
converting: 81
serial number: 6, 7
service releases: 1
Set as default: 98, 99
setting
emissivity: 73
Settings: 87, 89, 90, 92, 93, 95, 97, 98, 99, 100,
101, 102, 103, 104, 105, 106, 108, 109, 110, 111,
112, 113, 115, 116
Show IR Scale: 87
Show label: 98
Show Only Visible Plot Lines in Legend: 110,
112
Show Only Visible Profile Lines in Legend: 101,
102
Show out of range colors: 89
Show saturation colors: 89
Show value: 98
Signal linear: 89
178
Publ. No. 1558567 Rev. a269 – ENGLISH (EN) – March 18, 2008
R
23
Index – T
Sir James Dewar: 136
Sir William Herschel: 133
Size: 86
Size/Position: 100
Sketch: 92
software updates: 1
Solid: 90
spectrum
thermometrical: 134
spotmeter
cloning: 61
creating: 26
deleting: 62
inserting: 26
moving: 58
selecting: 59
starting
FLIR Reporter Professional: 83
starting Wizard: 16
Stefan, Josef: 142
Step: 106
Summary Table object
deleting: 65
description: 43
inserting: 25, 54, 84
support, technical: 3
Swap X & Y Axes: 101, 102, 105, 106, 110, 112
system requirements
hardware: 5
T
task pane: 14
displaying: 25
technical support: 3
temperature
reflected apparent: 131
Temperature: 93, 95
Text: 98, 103, 108, 115
Text background: 98
text comment
linking: 72
Text Comment: 111
Text Comment Editor: 85
text comment file
creating: 71
Text Comments: 92
tgw: 121
theory of thermography: 137
thermograph: 135
thermographic measurement techniques
introduction: 127
thermographic theory: 137
thermometrical spectrum: 134
Publ. No. 1558567 Rev. a269 – ENGLISH (EN) – March 18, 2008
thermos flask: 136
Threshold: 88, 102, 108, 112
tif: 121
Time: 111
tlw: 121
tmw: 121
toolbars
IR Histogram object toolbar: 29
IR Profile object toolbar: 28
IR Trending object toolbar: 30
IR Viewer object toolbar: 26
main toolbar: 24
trademarks: viii
training: 1
Transmission: 93
trending
description: 38
inserting: 24, 52, 84
typographical conventions
italic: 1
monospace: 1
semibold: 1
UPPERCASE: 1
U
uninstallation: 9
updates
software: 1
UPPERCASE: 1
Use bilinear filtering to enhance image
quality: 89
Use palette: 106
user-to-user forums: 1
23
V
Value: 92, 94
viewer
description: 32
inserting: 24, 49, 84
View Full Image: 87
Visual image in black and white: 88
W
warranty: viii
Width: 100
Wien, Wilhelm: 140
Wilhelm Wien: 140
William Herschel: 133
Wizard, starting: 16
Y
Y Axis: 111
179
Index – Z
Z
Zoom: 87
zooming: 27
23
180
Publ. No. 1558567 Rev. a269 – ENGLISH (EN) – March 18, 2008
Index – Z
23
Publ. No. 1558567 Rev. a269 – ENGLISH (EN) – March 18, 2008
181
A note on the technical production of this manual
This manual was produced using XML—the eXtensible Markup Language. For more information about XML, please visit http://www.w3.org/XML/
A note on the typeface used in this manual
This manual was typeset using Swiss 721, which is Bitstream’s pan-European version of the Helvetica™ typeface. Helvetica™ was designed
by Max Miedinger (1910–1980).
The following file identities and file versions were used in the formatting stream output for this manual:
20235103.xml a23
20235203.xml a21
20235303.xml a16
20236703.xml a36
20237103.xml a9
20238703.xml b8
20250403.xml a16
20254903.xml a43
20257003.xml a29
20273903.xml a4
20277903.xml a7
20279903.xml a9
20280003.xml a4
20280103.xml a8
20280203.xml a6
20280303.xml a3
20280403.xml a2
20280503.xml a3
20280603.xml a6
20280703.xml a9
20280803.xml a3
20281203.xml a2
20281403.xml a6
20281503.xml a4
20287303.xml a4
R0100.rcp a17
config.xml a5
182
Publ. No. 1558567 Rev. a269 – ENGLISH (EN) – March 18, 2008
■ AUSTRALIA
FLIR Systems
10 Business Park Drive
Nottinghill
Victoria 3168
Australia
Tel: +61-3-9550-2800
Fax: +61-3-9558-9853
Email: [email protected]
Web: www.flirthermography.com
■ BELGIUM
FLIR Systems
Uitbreidingstraat 60–62
B-2600 Berchem
BELGIUM
Phone: +32 (0)3 287 87 11
Fax: +32 (0)3 287 87 29
E-mail: [email protected]
Web: www.flirthermography.com
■ BRAZIL
FLIR Systems
Av. Antonio Bardella, 320
CEP: 18085-852 Sorocaba
São Paulo
BRAZIL
Phone: +55 15 3238 8070
Fax: +55 15 3238 8071
E-mail: [email protected]
E-mail: [email protected]
Web: www.flirthermography.com
■ CANADA
FLIR Systems
5230 South Service Road, Suite #125
Burlington, ON. L7L 5K2
CANADA
Phone: 1 800 613 0507 ext. 30
Fax: 905 639 5488
E-mail: [email protected]
Web: www.flirthermography.com
■ CHINA
FLIR Systems
Beijing Representative Office
Rm 203A, Dongwai Diplomatic Office
Building
23 Dongzhimenwai Dajie
Beijing 100600
P.R.C.
Phone: +86 10 8532 2304
Fax: +86 10 8532 2460
E-mail: [email protected]
Web: www.flirthermography.com
■ CHINA
FLIR Systems
Shanghai Representative Office
Room 6311, West Building
Jin Jiang Hotel
59 Maoming Road (South)
Shanghai 200020
P.R.C.
Phone: +86 21 5466 0286
Fax: +86 21 5466 0289
E-mail: [email protected]
Web: www.flirthermography.com
■ CHINA
FLIR Systems
Guangzhou Representative Office
1105 Main Tower, Guang Dong
International Hotel
339 Huanshi Dong Road
Guangzhou 510098
P.R.C.
Phone: +86 20 8333 7492
Fax: +86 20 8331 0976
E-mail: [email protected]
Web: www.flirthermography.com
■ FRANCE
FLIR Systems
10 rue Guynemer
92130 Issy les Moulineaux
Cedex
FRANCE
Phone: +33 (0)1 41 33 97 97
Fax: +33 (0)1 47 36 18 32
E-mail: [email protected]
Web: www.flirthermography.com
■ GERMANY
FLIR Systems
Berner Strasse 81
D-60437 Frankfurt am Main
GERMANY
Phone: +49 (0)69 95 00 900
Fax: +49 (0)69 95 00 9040
E-mail: [email protected]
Web: www.flirthermography.com
■ GREAT BRITAIN
FLIR Systems
2 Kings Hill Avenue – Kings Hill
West Malling
Kent, ME19 4AQ
UNITED KINGDOM
Phone: +44 (0)1732 220 011
Fax: +44 (0)1732 843 707
E-mail: [email protected]
Web: www.flirthermography.com
■ HONG KONG
FLIR Systems
Room 1613–15, Tower 2
Grand Central Plaza
138 Shatin Rural Committee Rd
Shatin, N.T.
HONG KONG
Phone: +852 27 92 89 55
Fax: +852 27 92 89 52
E-mail: [email protected]
Web: www.flirthermography.com
■ ITALY
FLIR Systems
Via L. Manara, 2
20051 Limbiate (MI)
ITALY
Phone: +39 02 99 45 10 01
Fax: +39 02 99 69 24 08
E-mail: [email protected]
Web: www.flirthermography.com
■ JAPAN
FLIR SYSTEMS Japan KK
Nishi-Gotanda Access 8F
3-6-20 Nishi-Gotanda
Shinagawa-Ku
Tokyo 141-0031
JAPAN
Phone: +81 3 6277 5681
Fax: +81 3 6277 5682
E-mail: [email protected]
Web: www.flirthermography.com
■ SWEDEN
FLIR Systems
Worldwide Thermography Center
P.O. Box 3
SE-182 11 Danderyd
SWEDEN
Phone: +46 (0)8 753 25 00
Fax: +46 (0)8 753 23 64
E-mail: [email protected]
Web: www.flirthermography.com
■ USA
FLIR Systems
Corporate headquarters
27700A SW Parkway Avenue
Wilsonville, OR 97070
USA
Phone: +1 503 498 3547
Web: www.flirthermography.com
■ USA (Primary sales & service
contact in USA)
FLIR Systems
USA Thermography Center
16 Esquire Road
North Billerica, MA. 01862
USA
Phone: +1 978 901 8000
Fax: +1 978 901 8887
E-mail: [email protected]
Web: www.flirthermography.com
■ USA
FLIR Systems
Indigo Operations
70 Castilian Dr.
Goleta, CA 93117-3027
USA
Phone: +1 805 964 9797
Fax: +1 805 685 2711
E-mail: [email protected]
Web: www.corebyindigo.com
■ USA
FLIR Systems
Indigo Operations
IAS Facility
701 John Sims Parkway East
Suite 2B
Niceville, FL 32578
USA
Phone: +1 850 678 4503
Fax: +1 850 678 4992
E-mail: [email protected]
Web: www.corebyindigo.com