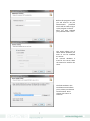
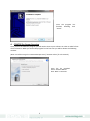
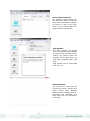
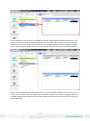
1
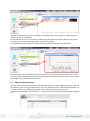
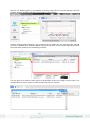
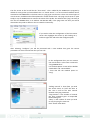
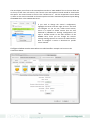
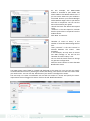
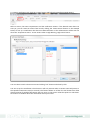
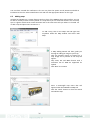
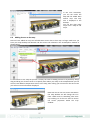
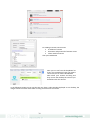
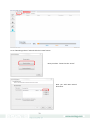
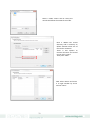
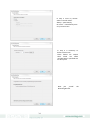
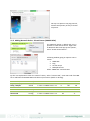
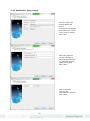
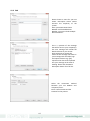
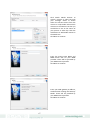
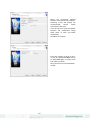
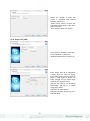
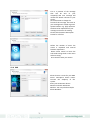
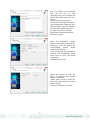
CONTEG Pro Server User Manual Version 1.1; Release 09/2013 © 2012 CONTEG, spol. s r.o. All rights reserved. No part of this publication may be used, reproduced, photocopied, transmitted or stored in any retrieval system of any nature, without the written permission of the copyright owner. Although this manual was prepared and checked with the best care, CONTEG, spol. s r.o. cannot accept any liability for omissions or errors in this publication. Due to the continuous development and progress, CONTEG, spol. s r.o. also reserves the right to change details and technical specifications of the products described in this manual. Such changes along with eventual errors or printing errata shall not constitute grounds for compensation. 2 Table of contents 1 CONTEG Pro Server overview ........................................................................................... 5 2 How to use this manual ...................................................................................................... 5 3 CONTEG Pro Server installation ........................................................................................ 5 4 CONTEG Pro Server licensing ........................................................................................... 8 5 Running the software for the first time ............................................................................. 9 6 Adding Devices and creating Desktops .......................................................................... 12 6.1 Adding multiple desktops ............................................................................................ 15 6.2 Using the Event Log .................................................................................................... 17 6.3 Configure sensors ....................................................................................................... 18 6.4 Receiving Notification.................................................................................................. 21 6.5 Adding maps ............................................................................................................... 26 6.6 Adding Sensors to the map ......................................................................................... 27 6.7 Adding cameras and viewing live video ....................................................................... 29 6.8 Setup video recording ................................................................................................. 31 7 Graphs ............................................................................................................................... 35 8 Sensors (other features) .................................................................................................. 36 8.1 Configure Sensors ...................................................................................................... 36 9 Access Control Setup ...................................................................................................... 37 9.1 Access Control – Page Overview ................................................................................ 37 9.2 Access Control – Setting RDU (Rack Door Unit) ......................................................... 37 9.2.1 Lock/Handle status settings .................................................................................. 37 9.2.2 Reader modes settings .......................................................................................... 39 9.2.3 Manual remote Unlock ......................................................................................... 40 9.3 Access Control – Group Overview .............................................................................. 40 9.4 Access Control – Groups. ........................................................................................... 40 9.5 Access Control – User ................................................................................................ 41 9.6 Access Control – Time Schedule ................................................................................ 44 9.7 Access Control – New Group ...................................................................................... 45 3 9.8 Access Control – Group Permissions .......................................................................... 47 9.9 Access Control – Update device ................................................................................. 49 9.10 Access Control – Access Logs .................................................................................... 49 10 Adding Cameras for Access Control Video Security ..................................................... 51 10.1 Setting up the Recording Policies................................................................................ 51 10.2 Playback window ........................................................................................................ 54 11 Adding network device and virtual sensors ................................................................... 54 11.1 Adding Network Device - Host status .......................................................................... 54 11.2 Adding Network Device - Virtual Sensor (RAMOS Mini) .............................................. 56 11.2.1 RAMOS Mini - Dry Contact (Input): ................................................................... 57 11.2.2 RAMOS Mini - Relay (Output): .......................................................................... 58 11.2.3 RAMOS Mini - Sensor (Temperature): ............................................................... 59 11.3 Adding Network Device - Virtual Sensor (Multiple Sensors) ........................................ 60 12 Notifications ...................................................................................................................... 61 12.1 Custom Script ............................................................................................................. 61 12.2 E-Mail ......................................................................................................................... 62 12.3 FAX............................................................................................................................. 64 12.4 FTP Photo and Information Upload ............................................................................. 65 12.5 MMS ........................................................................................................................... 66 12.6 Relay .......................................................................................................................... 69 12.7 Siren & Strobe Light .................................................................................................... 69 12.8 Skype Call / SMS ........................................................................................................ 70 12.9 SMS ............................................................................................................................ 71 12.10 SNMP Trap ............................................................................................................. 73 12.11 Sound ..................................................................................................................... 74 12.12 Speech.................................................................................................................... 75 12.13 Telephone Call ........................................................................................................ 76 12.14 Wake Up/Shutdown ................................................................................................ 77 12.15 Windows Alert ......................................................................................................... 78 4 1 CONTEG Pro Server overview Conteg Pro Server is a centralized monitoring application designed to integrate environmental and security monitoring, access control, and surveillance. CONTEG Pro Server has been developed specifically to integrate with RAMOS’s line of environmental and security monitoring hardware. For the first time multiple units from our RAMOS Ultra and RAMOS Optima product lines can be monitored from a single interface as well as integrating multiple digital or IP based cameras, as well as our door control unit. The increased storage capacity as a result of streaming the video to the server allows for much higher volume of video and sensor data to be stored, limited only by the size of your storage media. Using the “playback” window it is now possible to sync the sensor, access control and video data all together and be able to instantly retrieve this information at any specific time you wish to recall. For example, if your RAMOS Ultra alerts you via SMS of an unauthorized access through a secure doorway you can instantly access the video for this moment from the playback window and be able to see exactly who entered at that time. The setup and installation is quite straightforward and with the help of this user guide we aim to make it as easy as possible for you to be setup and using the software quickly. With a fully customizable layout to the interface it is well suited for multiple monitor environments. The software also saves any interface and layout alterations made so each time you run the software it is exactly how you left it. 2 How to use this manual This manual will take you step by step through the setup and use of the software. Instead of giving lots of information on every feature and function it aims to walk you through step by step in short tutorials which cover the basic set up and common configurations of the software, and give an introduction to its most useful features. If you need any further information or help with using this program then please contact us on [email protected] and one of our technical support staff will be only too pleased to help you with any information you require. 3 CONTEG Pro Server installation When you begin the setup program follow the onscreen instructions. You can use the screenshots below also for guidance. 5 After the installation has initialized the installation wizard will begin. Click “Next” to continue or "Cancel" to leave the installer. Next you will come to the End-User License Agreement window ("EULA") To continue with the installation you will need to agree to the terms in the scroll window. Click “I Agree” to continue Now we reach the components window, select which version you wish to install and click "Next" to continue 6 Before the program installs you will need to set you administrator password which will be used to log in to the program in future. After you have selected your password click "next". This option allows you to select which database you want to use for CONTEG Pro Server. An internal database is used for the server while the external is used for the client. The final window in the installation wizard allows you to select your desired install location. Once chosen click "Next" to continue. 7 Once the program has finished installing click "Finish" 4 CONTEG Pro Server licensing Once you have installed the program you will need to license your software in order to make full use of all its features. When you access the program for the first time you will be shown the following window: (Note: we will be using the recommended process of "Activate online" for this tutorial) From the list provided select "Activate Online" Click ‘Next’ to continue. 8 The program will now update itself from the CONTEG database. Once the program is connected and it has verified your information you should see this window. You have now successfully installed CONTEG Pro Server! 5 Running the software for the first time After the installation is complete you are ready to run CONTEG Pro for the first time. Find the shortcut on your desktop for CONTEG Pro and double click to run the program. The first window that will be displayed is the login window, in this example we will assume you are logging onto the main server or "local machine". Enter your user name and password and click "OK" 9 After you login to CONTEG Pro you will be taken directly to the main interface of the application, it may look a little daunting at first so let's take a look at the four main areas shown on the main user interface in a little more detail. Workspace Window CONTEG Pro Server allows you to have multiple workspaces which can display different information in any way you choose. All created workspaces are listed in this window, the first workspace is called "Workspace" by default. We will look at adding new workspaces later in the manual. 10 Server Explorer Window This window is broken down into four tabs which will list all devices which have been added to CONTEG Pro Server as well as any maps which can be created within the program. More on maps later. Help Window The help window will display various information about CONTEG Pro Server when you either click or rollover any feature within the program. If at any point you're not sure what something does, look here! Help window can be shown/hide with “Ctrl + H”. Desktop Window This is the area in which you will view all your sensor, camera, and access control data. Multiple desktops can be created in order to streamline your workflow and easily access all your information at any time. 11 6 Adding Devices and creating Desktops Now we are familiar with the basic functions of these windows. It’s time to add a device to CONTEG Pro and access its data. In the following example we are going to add a RAMOS Ultra with a temperature sensor and one digital camera attached to the base unit. (Note: to configure intelligent sensors and cameras on a RAMOS Ultra please refer to the user manual for that unit) From the main menu bar at the top of the application select "Add" then from the dropdown list select "RAMOS Device" You will now be shown this window. Enter the hostname or IP of the base unit along with the username and SNMP write community. this maybe "public". Then click "Add" You can now see in the above pictures that once you have added a device to CONTEG Pro that it shows in all three serverExplorer windows with no need to add it further times for each tab. The next stage is to setup a desktop. You may have multiple desktops labeled whatever you wish so that you can arrange your sensor and video information in a customized format. In the following steps we will assume that you have one RAMOS Ultra added and we want to setup a desktop that will display some basic data and information on that RAMOS Ultra. We will cover in more detail desktops and how they can be used in a later chapter. 12 There is by default one desktop added after you have done the initial installation and scanning for probes. This is labeled “Desktop #1”. First we will rename the desktop to something more useful than “Desktop #1”. To do this right click on the desktop and click “Rename”. In this example we shall name the desktop RAMOS Ultra. The result can be seen in the screenshots below. Next we will add some basic data to the desktop. First some sensor data will be added. If you click the “+” sign next to the RAMOS Ultra you will get a list of the available sensors. In this case as you can see there is a temperature sensor on port 1. We will add some Temperature data to the desktop. To do this simply click the left mouse button on the highlighted sensor, hold and drag that sensor onto your desktop. The result can be seen in the next screenshot. 13 On the desktop you will now have an additional window named “Sensors Status Summary #1”. The Temperature Port 1 sensor is displayed together with the value and the status. If you wish to view additional sensors then follow the same process, in the following picture we have added an airflow sensor. Simply drag the airflow sensor onto the desktop, than you will now see something like this: The screen would quickly get cluttered this way, so you can instead combine several sensors in one sensor status window. Close the airflow sensor window, and this time instead of dragging the sensor onto the desktop, drag it and drop it inside the “Sensors Status Summary #1” window. You will now see the following: 14 Next we will add a Graph of the sensor data to the desktop also. This is done in a similar fashion to adding a sensor to the Desktop. Ensure that the "Sensors" tab is active and then locate the Graph icon which is found to the right of the sensors name. Now drag and drop this icon onto the Desktop. The graph displays several pieces of information and will be described in more detail later. You should now have a good idea of the basic operation of the software and interface. There are of course a lot more features than this. The following chapters will build from this to give more in-depth knowledge of the software and its functions. 6.1 Adding multiple desktops Now we have one desktop with some sensor data displayed. You could imagine with several sensors the desktop could soon get quite cluttered. You may therefore want to add multiple desktops, for example, a desktop for displaying the graphs, and another for displaying sensor data. To add a second desktop click on button “+”. You will now see a second Tab appear labeled “Desktop #1”. 15 Now we can display graphs on one desktop and other probe data on the first. Rename the new desktop “Graphs” and then add two or three graphs to that desktop. Another useful window to display is the system log for the Probe you are monitoring. We will add this to the “RAMOS Ultra” desktop together with the sensor data. To add a system log drag and drop the name of the probe you are monitoring as follows: You may want to re-name the title’s given to the windows such as the syslog or sensor status. You can edit these by click on “Option” of this window and then on “rename”. 16 You can now rename the window to something more meaningful to you, for example “Sensors on RAMOS Ultra”. You can also rename any other window you wish. You can change the Graphs also by following the same process. 6.2 Using the Event Log The Event Log will display lots of information regarding the probe such as every sensors change in status, if there are any errors, when the system boots up or reboots etc. This list can get very long so for simplicity and easy location of information you can filter the Event Log. Click "Filter" to display the submenu. You can choose what fields are displayed (check or uncheck what you wish to see). To filter the syslog click the “Advanced Filter” button. You will then be presented with a new window that gives several tabs and options in order to filter the syslog. 17 Under the filter tab you can control what information you wish to see in the Event Log. You can choose to view or exclude the notification log, or the logged sensor events. And so on with the other options, you can choose whether to view or exclude that information. The second tab on the advanced filter dialog box allows you to choose the time period of the Event Log you wish to view. There is a choice from 1 week up to 3 months. You can also choose a specific time interval in which to filter your Event Log. 6.3 Configure sensors The CONTEG Pro Server explorer window is by default on the left side of the page. There are 3 tabs labeled “Sensor”, “Camera” and “Map”. We will deal with each of these tabs separately later. The sensor tab allows you to view, add and configure the various sensors you have connected to the probe you are monitoring. In this example we only have one RAMOS Ultra connected which we named "RAMOS Ultra (TEST)". If you had other probes then they would also be listed with a “+ / -“ sign to expand or deflate the list of sensors connected to that probe. In this example you can see 2 sensors listed on the RAMOS Ultra. 18 The first sensor in the list will be the “host status”. This is added by the CONTEG Pro program by default for every probe you have added. This is a “virtual sensor”. It is not an actual hardware sensor attached to the RAMOS Ultra. The host status is a ping type virtual sensor. There are several types of virtual sensors available and will be explained in further details later. The ping virtual sensor is quite simply a way for CONTEG Pro to monitor the status of the probe. The software will “ping” the host (in this case the RAMOS Ultra on IP address 192.168.161.100). If the ping times out then you will be alerted that the probe is offline or has no network connectivity. If you wish to alter the configuration of the host status sensor then highlight the sensor by left clicking on it, and then right click and select the configure option. After selecting “configure” you will be presented with a new window that gives the various parameters for that virtual sensor that you can edit. In the configuration box you can rename the virtual sensor. In this case I renamed it “Ping RAMOS Ultra”. For the descriptions I have left the default “Reachable” and “Unreachable” . I have also left the method option as "Ping" “Polling Interval” is how often you wish the virtual sensor to “poll” the data. In this case it will be the time interval between each ping command. “Ping timeout” is the number of seconds the ping command goes un-responded before timing out. “Retry” is the number of times you wish to retry the ping if it times out. Click "Finish" when done. 19 The next object you will see in the serverExplorer window is "Main Module" this is the main base unit at the top of the chain. All sensors, door control units and expansion boards would be listed under this option. The second sensor in the list is the “Airflow Port 2”. Like the Temperature sensor below it, these are the sensors attached to the securityProbe and were automatically detected upon adding the RAMOS Ultra in the CONTEG Pro Server. If you wish to change the sensor’s configuration, highlight the sensor and then right click on it and click on Configure. As you can see, unlike virtual sensors, there is no option to delete sensors that are auto detected by CONTEG Pro. Clicking ‘Configuration’ will open a window similar to the web interface of the RAMOS Ultra, there you can change the sensor’s settings. Settings options are same as on web interface. How to configure a sensor is described on specific sensor manual. Configure window contain same tabs as on web interface. Example can be seen in the screenshots below. 20 6.4 Receiving Notification After you have configured the sensors according to your needs, we need to set some notifications. We cannot and do not want to monitor the sensors 24/7 in front of the computer screen and watch for sensors that may need attention. It will be more efficient when you can be notified by CONTEG Pro when a sensor’s status reaches a certain level. There are different types of notifications that CONTEG Pro Server is capable of. We will discuss each one of them in a later chapter. For now, we will show you how to set a SMS notification when the ‘host status’ virtual sensor goes offline using a GSM/GPRS modem. We will be using the iTegno gsm/gprs modem connected to the usb port of the machine where CONTEG Pro Server is installed. After setting this notification, you should be able to receive a text message from CONTEG Pro Server informing you that your RAMOS Ultra is offline. You are then able to take immediate action. With notifications, you can then be able to monitor your sensors anytime and anywhere. We create notifications on the Notification page. To open the Notification page, on the main navigation bar click the Notifications option. A Notification tab will appear in the main window . Below, we can see the Notifications tab. There are 4 tabs under it, named “Notification Rules”, “Actions”, “Notification Logs”, and “Notification Analyzer”. First, we need to create a notification action and then create a notification rule to link the action to a sensor and status conditions. To create a notification Action, Click on the Actions tab under Notifications and click the ‘Create’ button. A Create Action dialog window will appear. 21 In the Create Action Dialog window, you will see a list of notification actions. Select the SMS action and click ‘Next’ to run the SMS Wizard dialog. Enter an action name and enter at least one phone number in the Phone Number List. To add a number, enter the number in the ‘Phone Number’ field and click the ‘Add’ button. The number will then be added in the Phone Number List box. You can remove phone numbers in the list by selecting the number and click the ‘Remove’ button. Click ‘Next’ to continue. You can preview here the SMS message to be sent. In the “From” field is a macro description named $[IP], which is for IP address. In the actual sms message, the value of $[IP] will depend on the ip address of the host sending the notification. You can customize your message, by click on the ‘Macro Description’ button. 22 For this example, the RMS-U-GSM modem is attached to port COM1. We select COM1 as the Mobile Phone Port. If you are unsure what Port your modem is connected. Browse your Device Manager under Modems. Right click on your device and click on Properties. You can see the Port and maximum port speed. We will the leave the default Port Speed ‘Auto’. “Timeout” is the time lapsed in seconds that the system has no response from the modem device. Click ‘Next’ to continue.. “Number of Times to Retry” is the number of times the SMS message will be sent. “Retry Intervals” is the time interval in seconds between the resent SMS messages. In this example, we only want to receive one SMS message so we will set the “Number of Times to Retry” to 0. You can click the ‘Back’ button to change any previous configuration. Click the ‘Finish’ button to create the SMS Notification Action. Your SMS action named ‘SMS’ is created and displayed in the Action list. You can test your newly created notification action by selecting the action and clicking ‘Test Action’ to make sure it does what you need it to do. You can click the ‘Edit’ button if you need to reconfigure the action. The next step is to create a notification rule and link this action to a sensor and specify the status requirements that will trigger this action. Click on the tab ‘Notification Rules’. 23 To create a notification rule, click the ‘Create’ button and follow the Notification Rule Wizard. Select a sensor, the status requirements and the notification actions. If the desired action does not exist yet, you can create an action from here by clicking the ‘Create Action’ button. In the example below, we set up a notification rule where an SMS notification to the administrator will be sent out when the ‘Temperature Port 1’ sensor attains either a High Warning, High Critical status. You can select in each column more status holding “Ctrl” button and select by click. You can set up the notification rule wherein it will only execute when a certain status will persist in the specified continuous time (in seconds). This feature allows us to filter the real threats from false alarms because of possible fluctuations that can occur in the sensor values but poses no real threat. Click ‘Next’ to schedule when the notification will only be active. 24 You have the option to enable the calendar option, else the notification will always be active. After setting the calendar, You have the option to include an escalation that will trigger after a given time after the initial notification. If you wish, you may add it later from the Notification Rules list page. Click ‘Finish’ to create the notification rule. 25 You now have created the notification rule. You may have the option to Edit, Remove and add an Escalation to the rule. Select a Notification rule and click the appropriate button on the right. 6.5 Adding maps Included in CONTEG Pro is a Map feature similar to that of the RAMOS Ultra web interface. You can be able to visually monitor sensors placed on a map where you can view their details. You can easily spot in a glance which sensor needs attention and at the same time tells you where it’s located. Let us add a map and place some sensors on it. To add a map, click on the ‘Map’ tab and right click anywhere inside the Map window and select ‘Add Map’. A Map Adding Wizard will then guide you through in adding an image as your map. Click the ‘Browse’ button to browse for a map image and a preview of the map will appear. Only JPEG, GIF and BMP formats with a maximum size of 1MB are supported for upload. Click ‘Next’ to continue. Enter a meaningful map name that will appear under the CONTEG Pro Map tab. Click the ‘Finish’ button to close the wizard and add the map. 26 In the next screenshot, you can see under the Map tab the added ‘Data Centre’ map. This map also is displayed in the desktop. You can also drag other maps onto a map as sub maps. 6.6 Adding Sensors to the map Now we have added our map we will add some sensor data to that map. To begin make sure you have your map desktop tab selected and the sensors tab selected in the severExplorer window as shown below. To add sensors to the map the process is exactly the same as adding sensors to any desktop. Simply drag and drop your chosen sensor to a specific place within your map. In the example below you can see we have added a temperature sensor to the map, when rolling your mouse over the sensor icon you will see critical information displayed. Now that we can see our sensor data within the map window we will change the icon from a black circle to something a bit more eye catching. To do this we need to access the sensor properties within the map window. 27 To begin right click on the sensor icon then select "Properties" from the list shown. After selecting this option a new window will be presented. In this window you can select which type of icon you would like to use. For this tutorial we will use "Image". Make sure this is selected and click "Next" to continue. In this window you can select which image you would like to be shown for each status of your chosen sensor. Simply drag your chosen icon into the sensor status box on the right. In this example you can see we have chosen icon for the "Normal" and "High Critical" status. Click "Next" to continue. 28 Now you will be shown a preview of your chosen icon, you also have the option to add additional text and font styles to the icon. When you have made your changes click "Next" to continue. In this final window you can assign your custom icon to multiple sensors. Simply check the sensor you wish to use and click "Finish" You have now completed your icon setup. 6.7 Adding cameras and viewing live video In this section we will look at adding a camera to the desktop and some of its settings. You will see that the process for adding cameras to the desktop is the same as adding any other sensor. (Note: we will assume that you have already correctly setup the IP camera and is visible in network.) Click on the “Add” and select “Camera”. Or Click on + button in left corner for Add new device. Select in popup window shown below the “Camera Device” 29 For adding of new IP camera enter IP address of camera Username and password of Camera access select model of camera then press Add buton Now you can see from the dropdown list that in this example we have one camera connected, this is called "AXIS M1054" Now select your camera and drag and drop it onto the desktop the same as you did before with the sensors. In the following image you can see that we now have a video window displayed on our desktop, the images shown are of live video which is being received from the camera. 30 Now that we have added our camera, let’s take a quick look at some of the options available in live viewing mode. 6.8 Setup video recording Now that we have added live video to the desktop, let's take a look at how to setup and manage your video surveillance system with recording and archiving capabilities. Recording and archive size will only be limited by your hard drive space capacity. To set up video recording, go to View > check Video Recording. To set up video recording, go to View > Video Recording or press function key F9 or use an Icon in left side panel A video recording tab will appear with three sub tabs where you can view a summary of the video policies, and manage recording and archive policies. 31 Go to “Recording Policies” tab and click the ‘Create’ button. Now you select “Record on the Server” Now you Add New Record directories 32 Select a folder where will be saved the records and define the maximal size of file. Now is added new record directory and is necessary to define situation when size of file reach a maximum. There is two options to remove old items and record new or don’t record. Then press “Next”. Now select camera and move it to right window by arrow and use “Next”. 33 In step 3 must by choose when to record videos: Always – permanently On event – controlled by time or by sensor event. In step 4 is necessary to define a frame rate. These frames are camera shots which can affect recorded time in specified size on data space. Now just „Finish“ Recording Wizard. 34 the Now can see added Recording Policies 7 Graphs For other graph settings, click ‘Options’ and select Graph Settings. The Graph Settings dialog box will open. You can change the graph title by editing the default title and click the ‘Set Title’ button. You can change the time range of the graph. Select from the dropdown list. If you choose ‘Custom Range’, enter start date/time and end date/time for the range. Check the ‘Live Data’ checkbox to automatically update the graph every Refresh Period. Display Status Color checkbox allows you to display/hide the status colors. You can save graph data as text document or as an image. Click the corresponding Save As button in the Graph Settings dialog box or select from Options > Save As… menu. 35 8 8.1 Sensors (other features) Configure Sensors To configure sensors, we right click on the sensor and select Configure. After clicking Configure, you will open the window which look like configure page on web interface of Ramos Ultra. There you can change the sensor’s settings such as the status thresholds, sensor name, etc. The change in settings will then reflect upon saving in the web interface. Also is possible to configure advanced settings 36 9 9.1 Access Control Setup Access Control – Page Overview Click on the Access Control icon (shown below). This page is where the new Users, Groups, Time Schedules, Access Logs (Reports are entered and stored into the CONTEG Pro Server software. To add a new Group click on the “Group” tab, press “+” button and complete the wizard. To add a new User click on the “User” tab, press “+” button and complete the wizard and finally to add a new Schedule click on the “Time Schedule” tab, press “+” button and complete that wizard. We will go through each of these in detail in the following sections, but first we will need to configure our RDU to the CONTEG Pro Server software. 9.2 Access Control – Setting RDU (Rack Door Unit) 9.2.1 Lock/Handle status settings Return to the monitoring Section. 37 On the list of RAMOS Ultra you can see connected device „RDU 3.1“. Physically is connected on expansion port 3 and is first in the daisy-chain line. Door port 1 represents a Lock or Handle. Door port 1 (Reader IN) represents a reader. Door port 1 is red on example above, because signal is in default configure to “low” and on RDU is connected DP-ZM-E2-ACS, which require “high” signal. To set correct status use a right click on “Door Port 1” and then click on “configure”. Now it will open “Device Configuration” window of this RDU. Click on “Advanced settings” tab and you will see now an options “Rack Closed” Signal Level how is shown on picture above. 38 Set this “Rack Closed” Signal Level by tab below: Handle/Lock “Rack Closed” Signal Level DP-ZM-E1-ACS DP-ZM-E2-ACS DP-ZM-EML-S DP-ZM-EML-LW High High Low Low After you set the right signal level and press “OK” button, the lock/handle will show right status. When the “Door Port 1” receives correct signal is generally black. 9.2.2 Reader modes settings To set required mode use a right click on “Door Port 1 (Reader IN)” and click on “configure”. 39 Access status is generally set on “Card” mode. For “Card + PIN” mode is necessary to use keypad with integrated card reader, e.g. RMS-ACS-U-KER. 9.2.3 Manual remote Unlock For manual remote opening you can use right click on lock port “Door Port 1” and click on “Unlock”. 9.3 Access Control – Group Overview The CONTEG Pro Server software allows you to setup Groups of users. This feature is used for allowing or denying access to specific doors, specific times and also to set security and access levels for our groups of users. Creating new groups will be covered in section 9.4 Access Control – Groups. We will cover the Users and Schedules before covering the “Manage Permissions” for each of our groups as we need to add our users and schedules before adding our permissions to each group. Our second tab in the Access Control section is Groups. If we click on the Groups tab we can see in the screen shot above we have a list of the existing groups that by default are already setup in the system. We can use these pre-set groups or we can create our own groups using “+” button. As mentioned above the new group wizard will be covered in section of this manual after we have added our users and schedules to the system. After our groups have been created or chosen, then the Users, Schedules and Permissions can be assigned to each of the groups. 40 9.5 Access Control – User The CONTEG Pro Server software allows you to setup individual system users. You can enter your users name and details, assign each user to departments, holidays for each department and other personal information such as the users picture, email, telephone number etc. The Users data base will also hold each users system log in and out times and from which door they used. To add a new user to the CONTEG Pro Server software you will first click on the Users tab as shown above, then click on the “+” button which will launch the new user wizard. (Important Note: In order for each user that has been added to the software to clock in or out using their EM or HID Prox cards or to open doors in the system, the Users must be first added to a Group and that Group must be given permission to open that door and also have that access time schedule added. This is all covered in the Groups and Permissions in the following sections of this manual.) As you can see on the first screen of the new user wizard above is where you will begin to enter the new user details such as the users first and last name. 41 You can either choose a department from the drop down list or if you do not have any departed created already you can click on he “Add” button, then the “Manage Departments” and add your own here as shown in the screen shot above. In the next screen of your new user wizard you will choose your group that this new user will belong to from the “Group” drop down list as shown above. 42 You can select “ID“ or “Facility + ID”. Facility + ID format is when you want entering HID Prox card manually without Scanning. On the next screen is shown how you can scan in your card. you will use to scan the card reader that is if you already have the scanner connected to the system. Simply click in the Scan button and scan your card in the reader. You can get USB desktop card reader from Conteg: “RMS-ACS-DCR” You can also add your PIN code for the pad and any valid dates. After this information is entered you can press the finish button to complete the wizard. 43 After clicking on the Finish button we can now see our new user has been added to our access control. You can add a picture now or change details and after editing you must save it, by “Save” button. 9.6 Access Control – Time Schedule The CONTEG Pro Server software allows you to add scheduling to either allow access or deny access to specific users, groups and doors during these custom pre-set time zones. When you first click on the Schedules tab as shown above you can either edit any of the existing schedules that are in your schedules list, or you can create a new schedule by clicking on the “+” button which will launch the new schedule wizard. In First step is required name for new Schedule. Enter new name and press “OK”. You can allow or deny access just by clicking on each of the individual time zone squares or click on the times or days to all or deny access to that entire row. If you right mouse click on an individual time zone square you can adjust the Time Offset in minutes for each of the zones as shown in the screen shot above. 44 Then after completing the new schedule wizard you would click on the Save button as shown in the screen shot above. 9.7 Access Control – New Group The New Group function of the Access Control section allows you to assign groups of Users access permissions to each of the doors that are installed on the RAMOS Ultra that you have added to the system. Now that you have completed adding you user and our new schedule, you can now create a new Group and also assign a user and a schedule to an existing group. After clicking on the Groups tab, then clicking on the “+” button will launch your New Group Wizard as shown in the screen shot bellow. 45 You can add a Work Shifts to each group. Press “Add” and get on Shifts settings. Then press “+”button to add shift and new window will open. Enter a new name for shift e.g. Day Shift and set times and days. After that press “next” and you will be taken to second step of setting, where you can add this shift to other “Groups”. You can select group and press arrows to move it to “Selected Groups” than press “Finish” Now you can select added Work Shifts to group. Press “next” to get on second step of settings. 46 The next screen in your New Group Wizard is the list of users, so you can highlight each of the users you want to add then click on the >> button to move the users to the new group. Now as you can see in the screen shot above the user has been added to the list of users in this new group. You just have to click on the Finish button to complete the wizard. Now as you can see in the screen shot above that our new group has been added. 9.8 Access Control – Group Permissions The Groups Permissions section of the Access Control section allows you to assign groups of users access permissions to each of the doors that are installed on the RAMOS Ultra that you have added to the system. These permissions include the doors the groups can access and the schedules too. As the screen shot on the previous page shows you need to add permissions to your groups before each of our users in the system will be able to not only clock in or out using the system card readers and keypads, but to open each of the doors in the system as well. First you need to highlight the Group for which we will add our permissions to. Then you will click on the “+” button as shown in the screen shot above. 47 This will launch the Manage Permissions wizard which will guide you through adding permissions to the group. As the screen shot shows above we will first select the doors from the Available Doors column and click the >> button to move the to the Selected Doors column Now you can see that your door we selected have been moved across so we can click on the Next button to continue on with the permissions wizard. You will now choose the Schedule for the access from the drop down menu as shown in the screen shot above. And to finish the permissions wizard you click on the Finish button. Now as you can see in the screen shot above that the door access and schedule have been added to your Client group. 48 9.9 Access Control – Update device Extremely Important Note: In order to activate the new access in the system YOU MUST RUN THE UPDATE from the Update Device tab as shown in the screen shot below. Having Trouble Opening the Doors? If all the door locks and readers are wired up, you should be able to scan and open the doors. If you’re having trouble or you receive two beeps when scanning your card, proceed to the Users tab and check the Group to which the user you’re having problems with is assigned in the correct group that you have added permissions for. 9.10 Access Control – Access Logs The Access logs hold all of the information the users who accessed the system which includes the date and time, the user, the door name, the host or RDU name, and the event which occurred. The access logs can be accessed by clicking on the Access Log tab as shown in the screen shot below 49 There are several filters that can be applied to the logs for viewing specific information such as the Custom Filter, sorting by Today, Yesterday, This week or This Month by choosing any one of these from the drop down list as shown it the screen shot above. If you choose the Customer Filter you can enter any custom date and time for your report. You can also chose the advanced filter as shown above which will give you many more options for generating reports based on Events or Status. After generating your report, you can Export this data into a CSV type file which can then be imported into an Excel file or other types of file. To export your report just click on the Export button as shown in the screen shot above. Blocking a User To block a user - Move them to the No Access Group and Update Device. 50 Re-Using or Re-Assigning Access Cards You can also delete the card number from one person and make a new UserProfile with that Card. The past Access Details for the first card owner is retained in the system. If you update the User Profile of the First person with the Second Persons name for example changing Mary to Matt. Then all of the system log's would show Matt and Mary would cease to exist. So the best thing to do, for an example is if an employee works for you temporarily is to keep that user profile and remove their card number, save and synchronize. Then make a new employee with that card that way you can still search for Mary. 10 Adding Cameras for Access Control Video Security By addition IP cameras to the network you are then able add video security to your Access Control System. This will allow you record who exactly enters and exits each door that is controlled by your RAMOS Ultra. This is setup using the CONTEG Pro Server’s video recording policies tied to the digital IP cameras added in network. You have the option of storing this video only on the computer that the server software is running on, or on 3rd party video server, or both. 10.1 Setting up the Recording Policies In order to setup the recording policies on the server software you need to first make sure you cameras are connected to the network, they are operating properly and are mounted in the correct position that will record the users entering or exiting the premises or where ever you are monitoring your access control from. The setting been explained in capture “6.8 Setup video recording” and till step 3 is same. In step 3 In the screen of the wizard you will choose the recording condition and you will choose the On Event option and check the Sensor event so that the camera will record the video when the door opens. You will then click on the Next button to continue. 51 Step 4 On the previous page you can enable video recording when no event occurs and set the frame rate. This will allow the camera to still record video if the camera is not recording the video. Step 5 The next screen of the wizard you can set the frame rate for the video and also set the camera’s pre and post recording time in seconds as shown above. Step 6 On screen is shown how you will choose the door that will trigger the recording of the video and the status the door will be in when the recording starts. 52 Step 7 In the screen you can set the duration of time that you can delay the start of the recording or the notification tied to the door opening. This feature is normally used to eliminate any false alerts. Step 8 If you need to add a schedule to the recording policy then you would add this in the next screen of the wizard as shown in the screen shot. Step 9 To complete your new recording policy that will record the video when the door is opened you would click on the Finish button in the last screen of the wizard as shown in the screen shot 53 Now as you can see the new policy has been created as it now shows in our Recording Policy list as shown in the screen shot above 10.2 Playback window The playback feature allows you to go back to a specified time and review the corresponding details of sensor information and events from the system log. You can also view a video playback of cameras at the given time Playback Mode Playback Controller 11 Adding network device and virtual sensors 11.1 Adding Network Device - Host status On main top menu press “ADD” and select “Network Device” as shown on picture. 54 Now enter the IP address of RAMOS Mini and select if want only Ping or Ping & SNMP get. Select Ping and on next part will be shown how to add SNMP get. Click on “OK” IP address of Ramos Mini you can find via Application for identification of RAMOS Mini in the network named “RMS_Config.exe”. It’s explained in RAMOS Mini manual. Change the name of device for better identification by right click on device in list and select “Configure…” Enter new name of device e.g. RAMOS Mini and click “OK” The Ping feature can be configured too. Is possible to use ping or http method for checking the host status, which can renamed in first step of “host configuration” as shown on picture below. 55 On step 2 is option to set ping interval, timeout and quantity of retry as shown on picture. 11.2 Adding Network Device - Virtual Sensor (RAMOS Mini) The Network Device is added and now is possible to add Virtual Sensor. Right click on Network device will pop up the options, select “Create Virtual Sensor”. Following window giving an options now to create: SNMP Get Ping Custom Script Multiple Sensors Select “SNMP Get” and click Next. By the next explanations enter the name of sensor, select “Custom OID”, enter OID code from MIB file or tab below for RAMOS Mini and select style of sensor (Switch or Analog). RAMOS Mini Dry Contact / Input Relay / Output Sensor Style: Switch Switch Custom OID: .1.3.6.1.4.1.28402.4.3.1.1.2.1 .1.3.6.1.4.1.28402.4.3.2.1.2.1 normal 1 0 RAMOS Mini Sensor 215 Sensor 216 Sensor Style: Analog Analog Custom OID: .1.3.6.1.4.1.28402.4.3.3.1.5.1 .1.3.6.1.4.1.28402.4.3.3.1.5.2 Value Factor 0.1 0.1 56 Status 0 Open Off Status 1 Close On Unit °C °C 11.2.1 RAMOS Mini - Dry Contact (Input): Screenshots below will show you how to integrate Ramos Mini as Network device. Enter the name and specific OID for the sensor. If the sensor can provide information 0 or 1 select sensor style to “Switch”. Click “Next”. Now select value for normal status 0 or 1. Name the normal status e.g. Close, and name for critical status (Open). Click “Next”. Select interval for receiving the informations in seconds. Click “Next”. 57 11.2.2 RAMOS Mini - Relay (Output): Enter the name and specific OID for the sensor. If the sensor can provide information 0 or 1 select sensor style to “Switch”. Click “Next”. Now select value for normal status 0 or 1. Name the normal status e.g. OFF, and name for critical status (ON). Click “Next”. Select interval for receiving the informations in seconds. Click “Next”. 58 11.2.3 RAMOS Mini - Sensor (Temperature): Enter the name and specific OID for the sensor. If the sensor can provide information by number presenting a value, select sensor style to “Analog”. Click “Next”. Now select value factor, which will multiply a value to right format, e.g. temperature sensor read 22.6°C and send information via SNMP in format 226. This value must be multiply by 0.1. Enter unit text e.g. °C, °F, %RH and so on. Click “Next”. Select thresholds for each level. Click “Next”. 59 Select interval for receiving the informations in seconds. Click “Next”. 11.3 Adding Network Device - Virtual Sensor (Multiple Sensors) One of the option which how can by used virtual sensors is Boolean function called “Multiple Sensor” This virtual sensor can present several sensors and can be used for notification. For example, when all sensor match to their specified status, this virtual sensor will have critical status. Is possible to apply true or false method. This way can be detectors/sensors doubled to prevent notification action from faulty reading. 60 12 Notifications 12.1 Custom Script Macro Description button opens the Available Macros that you can use as arguments for your script file. Add New Script button lets you add a list of batch files and/or programs that you want to execute on events. The list will then appear as your choices under the Script File drop down list. 61 12.2 E-Mail Please choose a name for your email Action. Descriptive Action names increase the simplicity of the system. Complete the Mail To, From and CC fields with correctly formatted email addresses. The “Mail to” and “Mail from” fields are mandatory. Multiple recipients may be entered by separating addresses by a comma (,) of semicolon (;) This is a preview of the message that will be sent to your recipient(s). The sent message will include details relevant to your sensor. Click Customize to change the format of this message. The items in your message with a dollar sign and square brackets e.g. $[IP] represent the data to be imported into your message at the time of sending. Please click the Macro Description button for a full list. 62 Click Enable Picture to attach a Picture with your message. Select to attach either the Current Picture from the Camera or the most recent Picture Stored on the Picture Log. Select which Cameras you would like to use as the source of your picture. Enter your SMTP server IP address and Port. If the mail access is secured is necessary to enter valid login name and password. Enter the number of times to retry, in case of undelivered mail will try to send mail again so many times how much you enter. Retry interval is for period between resend. 63 12.3 FAX Please choose a name for your Fax action. Descriptive Action names increase the simplicity of the system. Enter your Destination Phone Number and Click Add Phone Number. You may include multiple Phone Numbers. This is a preview of the message that will be sent to your recipient(s). The sent message will include the details relevant to your sensor. Click Customize to change the format of this message. The items in your message with the dollar sign and square brackets e.g. $[IP] represent the data to be imported into your message at the time of sending. Please click the Macro Description button for a full list. Select the connection method between your Fax Modem and computer/server. Enter a Device Name and the Timeout for the process. 64 12.4 FTP Photo and Information Upload Please choose a name for your FTP Photo and Information Upload action. Descriptive Action names increase the simplicity of the system. Select which Cameras you would like to use as the source of your picture. Select the Media Type. Choose between pictures or video clips or both. You can set options for your Video Clip. Click Add to add the configuration to the Media List. Click Next to continue. Customize you message. Enter your FTP server, Destination Path and Authentication information such as the ftp login username and password. You can choose between the Active or Passive Transfer Mode. 65 For Single upload option, define the Maximum number of Times and interval between attempts that a photo is uploaded to your FTP server. For Continuous upload option, define the upload settings when Action is enabled or disabled. 12.5 MMS Enter a name for your MMS action. Descriptive Action names increase the simplicity of the system. Enter your destination Phone Number and Click Add Phone Number. You may include multiple Phone Numbers. This is a preview of the message that will be sent to your recipient(s).The sent message will include the details relevant to your sensor. Click Customize to change the format of this message. The items in your message with a dollar sign and parentheses e.g. $[IP] represent the data to be imported into your message at the time of sending. Please click the Macro Description button for a full list. 66 Click Attach Media Content to attach a picture or video clip with your message. Select to attach either the Current Picture from the camera or a Clip Video. Select which cameras in the Camera List that you would like to use as the source of your picture or video clip. Click the Add button to Add media content in the Media List. Click Next to continue. Enter the Access Point Name and MMS Server URL for your MMS provider. These will be provided by your MMS service provider. Click Next to continue. Enter your WAP gateway IP address, Authentication settings and Security Mode. These will be provided by your MMS service provider. Click Next to continue. 67 Select the connection method between your phone and computer. Choosing a port will display the corresponding Device Name connected to that port. If you do not know your Port Speed, Timeout and Initialization String leave them as Auto and Blank respectively. Click Next to continue. Enter the number of times to retry, in case of undelivered MMS will try to send MMS again so many times how much you enter. Retry interval is for period between resend. 68 12.6 Relay Please choose a name for your Relay Action. Descriptive Action names increase the simplicity of the system. Select the Host and Relay Port your relay is connected to and whether your Relay Action should Turn the relay On or Off. Set Cycle Time if Relay Action is a Cycle on-off-on or Cycle off-on-off. Click Next to continue. Define the number of times the action is repeated and interval between repetitions. Please select Cancel to leave the edit mode and go back to the menu without saving. Press Finish to Save your Action. 12.7 Siren & Strobe Light Please choose a name for your Siren and Strobe Light Action. Descriptive Action names increase the simplicity of the system. Select the Port your Siren and Strobe light is connected to and the length of time the light is on. You may choose Until Acknowledged or a Defined Time. If you select a Defined time also enter the Delay before Turn On and the Length of Time the light is on. Click Next to continue. 69 Define the number of times the action is repeated and interval between repetitions. Please select Cancel to leave the edit mode and go back to the menu without saving. Press Finish to Save your Action. 12.8 Skype Call / SMS Enter Server IP address or URL and Port of Windows system that Windows Notification is running on. Enter Skype user ID or Telephone number that you want to notify. Then select type of action. Skype to Skype is free. Skype to Phone has been charged and you need Skype credit in your Skype Account Remark: You need to run Windows Notification and log in to Skype using Skype client. Remark: Use international telephone number format (e.g. +12 345 678 9012) 70 This is a preview of the message that will be sent to your recipient(s).The sent message will include the details relevant to your sensor. Click Customize to change the format of this message. The items in your message with a dollar sign and square brackets e.g. $[IP] represent the data to be imported into your message at the time of sending. Please click the Macro Description button for a full list. Define the number of times the action is repeated and interval between repetitions. Please select Cancel to leave the edit mode and go back to the menu without saving. Press Finish to Save your Action. 12.9 SMS Please choose a name for your SMS action. Descriptive Action names increase the simplicity of the system. Enter your Destination Phone Number and Click Add Phone Number. You may include multiple Phone Numbers. 71 This is a preview of the message that will be sent to your recipient(s).The sent message will include the details relevant to your sensor. Click Customize to change the format of this message. The items in your message with a dollar sign and square brackets e.g. $[IP] represent the data to be imported into your message at the time of sending. Please click the Macro Description button for a full list. Select the connection method between your phone and computer. Choosing a port will display the corresponding Device Name connected to that port. If you do not know your Port Speed, Timeout and Initialization String leave them as Auto and Blank respectively. Click Next to continue. Define the number of times the action is repeated and interval between repetitions. Please select Cancel to leave the edit mode and go back to the menu without saving. Press Finish to Save your Action. 72 12.10 SNMP Trap Please choose a name for your SNMP Trap Action. Descriptive Action names increase the simplicity of the system. Enter your Destination Trap Address and Community and Click Add Trap Destination. You may include multiple Traps. Select an SNMP Trap Type. If CustomTypeTraps is selected, select the following variables to be bound in the trap. Please select Cancel to leave the edit mode and go back to the menu without saving. Click Next to continue. Define the number of times the action is repeated and interval between repetitions. Please select Cancel to leave the edit mode and go back to the menu without saving. Press Finish to Save your Action. 73 12.11 Sound Please choose a name for your Alarm Sound Action. Descriptive Action names increase the simplicity of the system. Select the sound file to use from the drop down box. You may select one of the predefined sounds or upload your own sound. Add your own sound by clicking the Add Your Own Sound button, locating the file on your computer and clicking Add Sound File. This will add your sound to the drop down box. Pressing the Play button, should hear the selected sound file played on your computer. You may also define the length of time and volume of the played sound. Please choose a name for your Alarm Sound Action. Descriptive Action names increase the simplicity of the system. Select the sound file to use from the drop down box. You may select one of the predefined Define the number of times the action is repeated and interval between repetitions. Please select Cancel to leave the edit mode and go back to the menu without saving. Press Finish to Save your Action. 74 12.12 Speech Please choose a name for your Alarm Sound Action. Descriptive Action names increase the simplicity of the system. Select the volume, speed and pitch at which the Text to Speech module will read the message. Click Next to continue. The Message is a preview of what will be said by the Text to Speech module. The sent message will include the details relevant to your sensor. Click Customize to change the format of this message. The items in your message with a dollar sign and parentheses e.g. $[IP] represent the data to be imported into your message at the time of sending. Please click the Macro Description button for a full list. Click Next to continue. Define the number of times the action is repeated and interval between repetitions. Please select Cancel to leave the edit mode and go back to the menu without saving. Press Finish to Save your Action. 75 12.13 Telephone Call Please choose a name for your Telephone Call action. Descriptive Action names increase the simplicity of the system. Enter your Destination Phone Number and Click Add Phone Number. You may include multiple Phone Numbers. Select the volume for your phone call. You may select to either use the Text to Speech module for your call or a Wav file. If you choose to use the Text to Speech module you can configure your Text-toSpeech Options by selecting the Speech Speed and the Speech Pitch. A preview of the message that will be read is displayed in the Message box. The sent message will include the details relevant to your sensor. Click Customize to change the format of this message. The items in your message with a dollar sign and square brackets e.g. $[IP] represent the data to be imported into your message at the time of sending. Please click the Macro Description button for a full list. If you chose to use a Wav file for your call you can choose a file from the drop down list or add your own. Add your own sound by clicking the Add Your Own Sound button, locating the file on your computer and clicking Add Sound File. This will add your sound to the drop down box. Select the connection method between your Voice Modem and computer by selecting a Voice Modem Port. The Device Name field will verify what device is connected to the selected port. Select your Voice Modem Port Speed in the drop down list. If you do not know your Port Speed, leave this as Auto. Select your Voice Modem Chipset on the drop down list. Click Next to continue. 76 Define the number of times the action is repeated and interval between repetitions. Please select Cancel to leave the edit mode and go back to the menu without saving. Press Finish to Save your Action. 12.14 Wake Up/Shutdown Please choose a name for your Wake Up / Shutdown Action. Descriptive Action names increase the simplicity of the system. Choose the action type, shutdown or wakeup. If you choose shutdown action you also have to select the operating system on the host you want to shutdown Action. Enter the Login details for the remote server such as the Remote Server IP or host name, Login username and password. Add server by clicking the Add Server button. You can add multiple servers if you need to shutdown or wakeup multiple servers simultaneously. Select Shutdown Options and the Timeout before Shutdown. Click Next to continue. On last step select if you would like a Shutdown message to be appended to the server log. This is a preview of the message that will be sent to the server log. The sent message will include the details relevant to your sensor. Click Customize to change the format of this message. The items in your message with a dollar sign and square brackets e.g. $[IP] represent the data to be imported into your message at the time of sending. Please click the Macro Description button for a full list. 77 12.15 Windows Alert Enter Server IP address or URL and Port of Windows system that Windows Notification is running on. E.g. “10.1.5.85” ! Windows Notification must be installed and running. See below! This is a preview of the message that will be sent to your recipient(s).The sent message will include the details relevant to your sensor. Click Customize to change the format of this message. The items in your message with a dollar sign and square brackets e.g. $[IP] represent the data to be imported into your message at the time of sending. Please click the Macro Description button for a full list. Click Next to continue. Define the number of times the action is repeated and interval between repetitions. Please select Cancel to leave the edit mode and go back to the menu without saving. Press Finish to Save your Action. 78