1
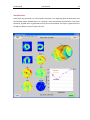
FlowQuant© User Manual Software Version 2.2.4 January 2014 University of Ottawa Heart Institute Cardiac PET Centre 40 Ruskin St. Ottawa, Ontario K1Y 4W7 Canada (613)-761-4275 www.ottawaheart.ca [email protected] FlowQuant© User Manual Disclaimer FlowQuant© is protected under international copyright law. Use of this software without the sole permission of the University of Ottawa Heart Institute, Cardiac PET Centre is illegal. FlowQuant© is a research tool that is still in the development phase and is not approved for clinical use. Any use of FlowQuant© is under the responsibility of the user and the results are not guaranteed by the developer. ExcelTM is a registered trademark of Microsoft Corporation. 1 FlowQuant© User Manual 2 Table of Contents Disclaimer ...............................................................................................................................................1 Table of Contents....................................................................................................................................2 Introduction ............................................................................................................................................5 Minimum System Requirements ............................................................................................................6 Terminology and Acronyms ....................................................................................................................7 FlowQuant© Graphical User Interface ...................................................................................................8 Menu ..................................................................................................................................................9 Toolbar ............................................................................................................................................ 10 Study List ......................................................................................................................................... 11 Comments ....................................................................................................................................... 11 Buttons ............................................................................................................................................ 11 Routine Use ......................................................................................................................................... 13 Creating a Study .............................................................................................................................. 13 Adding an Analysis Entry ................................................................................................................. 14 Adding a Scan Entry ......................................................................................................................... 15 Processing a Study ........................................................................................................................... 18 Reorientation .............................................................................................................................. 18 LV Modeling (Sampling) .............................................................................................................. 19 Dynamic Polar-Map .................................................................................................................... 23 Blood ROI Processing .................................................................................................................. 24 Kinetic Modeling ......................................................................................................................... 24 Single Window Processing (* in Beta testing) ............................................................................. 26 Analysis ....................................................................................................................................... 27 Results ............................................................................................................................................. 33 FlowQuant© User Manual 3 Dynamic Splash Display (DSD) ......................................................................................................... 33 Additional Features ............................................................................................................................. 36 Removing an Entry .......................................................................................................................... 37 Duplicating an Entry ........................................................................................................................ 38 Multiple Entry Selection .................................................................................................................. 38 Viewing Data ................................................................................................................................... 38 Analysis Settings .................................................................................................................................. 41 Settings Hierarchy ........................................................................................................................... 41 Entry Settings .................................................................................................................................. 42 Study Settings .................................................................................................................................. 46 General Options .......................................................................................................................... 46 Color Options .............................................................................................................................. 48 Default Analysis Options ............................................................................................................. 49 Rest-Stress Flow Analysis Options .............................................................................................. 49 Making Current Study Settings the Default Settings .................................................................. 50 Reverting to the Default Study Settings...................................................................................... 50 Exporting the Study Settings ....................................................................................................... 50 Importing Study Settings from another File ............................................................................... 50 Tools..................................................................................................................................................... 52 Close All Figures............................................................................................................................... 52 Clean Study Directory ...................................................................................................................... 52 Update Scan Files Directories .......................................................................................................... 52 Image Cropping Tool ....................................................................................................................... 53 Motion Correction Tool ................................................................................................................... 56 Administrator Tools ......................................................................................................................... 58 FlowQuant© User Manual 4 Data – Export Dynamic Data ........................................................................................................... 59 Data – Export KM Results ................................................................................................................ 59 Data – Export ROI Coordinates........................................................................................................ 60 Special Considerations for Small Animal PET Image Processing ......................................................... 61 Additional Documentation .................................................................................................................. 63 FlowQuant© User Manual 5 Introduction FlowQuant© is developed by the University of Ottawa Heart Institute, Cardiac PET Centre. Originally, FlowQuant© was intended as a tool for quantification of physiological function from dynamic positron emission tomography (PET). However, additional tools and analyses are continuously being added to support static and gated imaging of nuclear imaging modalities. FlowQuant© is a menu based GUI which is able to process large sets of scans, both in a research and clinical setting. Typical processing of dynamic images includes the following steps: 1. Scan processing: a. Generating polar-maps (uptake and dynamic sequence) and sampling the LV blood pool time-activity-curve (TAC). b. Kinetic modeling using the dynamic polar-map and blood TAC. 2. Analysis of the results of sets of scans. This includes mismatch analysis and rest/stress comparison. This document provides information on using the FlowQuant© tool and its features. More specific information about sampling polar-maps, kinetic models, and analysis tools is published in literature. The goal of this document is to form a user manual, not to describe the science. It is therefore expected that the reader has sufficient background in nuclear-cardiac imaging and be current with the field of quantitative imaging. FlowQuant© User Manual 6 Minimum System Requirements Before attempting to run FlowQuant©, please ensure that your system meets the minimum requirements listed below. In the event that your system does not meet these specifications, the proper functioning of the program is not guaranteed by the developer. Minimum requirements: Pentium D 4 GB of RAM 10 GB of hard drive space available 1280 x 800 screen resolution 32 bit colour Windows XP or Vista operating system *Recommended hardware: an OpenGL compatible graphics adaptor. FlowQuant© User Manual 7 Terminology and Acronyms Analysis Entry – A single entry comprised of several Scan Entries which contains information required for an analysis between scans and/or their analysis results. Polar-Map (PM) – A 2D rendering of the left ventricle myocardium that enables complete visualization without occlusions. Scan Entry – A single entry that includes a scan and all of the data required to process that scan. Study – A list of Analysis Entries that are saved together with accompanying data for future processing and analysis. FOV – Field of View: the spatial region that is sampled by the image. GUI – Graphical User Interface HLA – Horizontal Long-Axis KM – Kinetic Model LV – Left Ventricle Myocardium SA – Short Axis TAC – Time Activity Curve VLA – Vertical Long-Axis FlowQuant© User Manual 8 FlowQuant© Graphical User Interface The FlowQuant© GUI (shown below) is the main interface by which users interact with the program. This GUI provides the means to setup a study list, process the study, and view its results. Study Name Menu Unsaved study indicator Entry re-ordering buttons Toolbar Custom settings indicator Species Icon Settings unlocked Scan Entry Analysis Entry Tracer (red signifies a difference from the filename) Study List scrollbar Process Buttons FlowQuant© User Manual Menu The menu system contains all functionality pertaining to study files, settings, as well as various analysis tools. The menu includes the following hierarchy and shortcut key combinations in parentheses: File o Load Study (CTRL-O) o Save Study (CTRL-S) o Save Study As (CTRL-A) o Clear Study o Add Analysis Entry (CTRL-N) o Add Scan Entry (CTRL-E) o View Study Directory o Exit (CTRL-X) Settings o Edit Study Settings (CTRL-P) o Save Current Study Settings as Default o Load My Default Study Settings o Save Study Settings o Load Study Settings o Load Factory Settings Tools o Close all figures (CTRL-F) o Clean Study Directory o Update Scan File Directories o Image Cropper o DICOM Conversion Server 9 FlowQuant© o User Manual 10 Administrator Tools Data o Export Dynamic Data o Export KM Results o Export ROI coordinates Help o Help o Check for Updates o About Toolbar The toolbar contains quick access to a subset of functionality from the menu that is most commonly used. New Study Load Study Save Study Add Analysis Entry Add Scan Entry Remove Entry Duplicate Entry Settings FlowQuant© User Manual 11 Study List A list of analysis entries that may be batch processed in sequential order. This list forms the heart of FlowQuant©, and may be considered as a list of analyses that the user requests. The entries and their fields have context menus that may be accessed using the right mouse button. These context menus provide additional functionality that is specific to the entry. The context menus vary with the entry and field that is selected, therefore refer to the information below for more specific options. Comments This field allows the user to type texts associated to the study, which will be saved with the study and reappear each time that it is opened. Buttons Several buttons exist on the GUI, including: Study selection radio-buttons – selects which type of scan data location to add - Local Files – select individual image files stored locally - Local Directory – select an image directory stored locally (e.g. DICOM directory) - DICOM Node Q/R – perform a DICOM Query and Retrieve from a preconfigured DICOM node. Add Analysis – adds a new analysis entry to the study list. Add Scan Entry – adds a new scan entry to the current analysis entry. Up arrow – move the current entry (analysis entry or scan entry, highlighted in green) up in the study list. Down arrow – move the current entry (analysis entry or scan entry, highlighted in green) down in the study list. Process Buttons – process the study list in order from top to bottom. Four button combinations exist. o Complete Files - All – process all of the study list steps that have not yet been processed. Existing files are used if they are valid, otherwise they are overwritten. This is useful for quick completion of only the missing data. FlowQuant© User Manual 12 o Complete Files - Selection – process the entries that are selected by the checkbox. Existing files are used if they are valid, otherwise they are overwritten. o Overwrite Files - All – process the entire study list without regard for existing files. Existing files will be overwritten resulting in a longer processing time. o Overwrite Files - Selection – process the entries that are selected by the checkbox without regard for existing files. Existing files will be overwritten resulting in a longer processing time. FlowQuant© User Manual 13 Routine Use Creating a Study A study is created when it is first saved and it must be created for processing to take place. This is due to the need to save result files during processing. The study file (named with a *.std extension) can be saved to any directory, but by default will be saved to the C:\FlowQuant\Studies directory (see Administrator Tools for more detail). When the file is saved, a subdirectory with the same name will be saved in the same directory. The study file contains all of the data required by FlowQuant©, and the directory contains all of the result files. Several menu options (and toolbar buttons) relate to the study: - New Study– clears the existing study from FlowQuant©. - Load Study – loads a previously saved study file into FlowQuant©. - Save Study– saves the current study. If the study has not yet been saved, the user is queried for a study name and a directory in which to save it. - Save Study As – saves the current study under a new name and/or directory without removing the original study and corresponding results files. If a new study has been created and processed before saving, the user is first queried for a study name and directory in which it will be saved. Tip Use descriptive file names and organized directory structuring that will enable you to locate a study even in the distant future. Tip If a single patient is being processed, for example for a clinical case, consider saving the study in the directory with the original patient data. FlowQuant© User Manual 14 Adding an Analysis Entry An analysis entry may be added either through the menu or the button on the GUI. When this option is selected, a new dialogue window opens enabling the selection of a single scan or multiple scans to be added from an accessible directory. A new analysis entry is added at the bottom of the study list. In the Analysis field the user may choose an analysis type from the pull-down menu. This analysis entry contains 2 scan entries FlowQuant automatically determines the type of analysis based on the type of scans that were selected: Rest-Stress Analysis – if one rest and one stress scan were selected. For this particular study type, a special dialogue is displayed to enter heart rate and blood pressure data. Mismatch – Normalized whole LV analysis – if one metabolic (FDG or acetate) and one perfusion (Rb or ammonia) scans were selected. Each analysis entry has analysis settings that may be edited by the user. By default these settings are left blank, reverting to the study settings as described in the Settings Hierarchy section on page 23. The analysis entry settings may be accessed by right-clicking on the desired analysis entry and selecting Process Analysis Settings. If the settings are not all empty (i.e. if the user has entered FlowQuant© User Manual 15 values that are different from the default study settings) a red exclamation mark will appear to the left of the analysis entry once the OK button has been selected and the “Analysis Settings” menu closes. Adding a Scan Entry Using either the button on the GUI or the menu, the user may add a scan entry into the currently selected analysis (highlighted in green). The user will be queried for an image file. Once the file is selected, the scan analysis entry fields will be automatically populated based on the file header which must have been saved to the same directory as the image file. Ensure that the right tracer and state have been determined. The scan entry fields are as follows: - Patient – a unique name for the individual. By default this will be the patient name. If the mouse cursor is placed over the field, a tool tip with the species is displayed for user confirmation. The species is also indicated by the icon to the right of the patient entry field. This can be changed by right-clicking on the icon and selecting a different species. - File – the location of the file containing the image data. - Image Type – indicates whether the scan is dynamic (D), gated (G), or static (S). This is automatically determined by the image header and can be changed by the user by selecting a different image type. - Tracer – the radio-tracer used for imaging (automatically determined from the image header). - State – the patient’s (rest or stress) state during acquisition of the image (automatically determined from the image header). - Label – a description of the image. The list of available labels is determined from the list in the global options and is filtered by the tracer. - Orientation – the study label based on which the LV polar-map should be sampled. If the orientation is the same as the study-tracer-label combination of the same scan, the LV polar-map will be obtained from the same image; otherwise, the polar-map data of another image will be used to sample the polar-map. The required orientation file is expected to already exist; therefore, the options available in the pull-down relate to the FlowQuant© User Manual 16 scan entries above. There are three possible ways for this sampling from a previously processed image to proceed as indicated by the lock button that appears to the right of the orientation drop-down menu: : use orientation to guide sampling : lock sampling points : lock only ellipse size To toggle between the modes simply click on the icon. - Kinetic Model – the kinetic model that will be used to process the image. If Default Option is selected the model is chosen based on the tracer and the species of the subject. If “None” is chosen, kinetic modeling will not proceed. Each scan entry has settings that may be edited by the user. By default these settings are left blank, reverting to the study settings as described in the Settings Hierarchy on page 23. The scan entry settings (described in Scan Entries, page 23) may be accessed by right-clicking on the scan entry and selecting Process Scan Settings. If the settings are not all empty (i.e. if the user has entered values that are different from the default study settings) a red exclamation mark will appear on the scan entry once the OK button has been selected and the “Scan Settings” menu closes. Likewise the Subject Exam Data including heart rate, blood pressures, glucose levels and tracer specific activity can be edited. The Table below lists how these parameters are used. FlowQuant© User Manual 17 Parameter Units Usage Heart Rate bpm Rate-pressure product correction of rest flow values Coronary vascular resistance (CVR) in stress perfusion scans Systolic Blood Pressure mmHg Rate-pressure product correction of rest flow values Diastolic Blood Pressure mmHg Rate-pressure product correction of rest flow values Glucose Values Mmol/L Measured glucose values used for calculating the MGU values from the Patlak model for FDG scans. Once entered, the values will be averaged resulting in a single value. Specific Activity GBq/μmol Tracer Concentration (nmol/cc) uptake values Tracer Activity - Patient Weight Standard uptake values (SUV) calculations Kg FlowQuant© - Patient Height - Activity before injection - Residual activity - Assay time before injection - Residual assay time CTAC image file User Manual Meters MBq MBq hr:min:sec hr:min:sec Filename 18 CT and emission data fusion in Dynamic Splash Display Processing a Study By clicking on one of the process buttons, batch processing of the selection is started from top to bottom of the study list. First, all of the scans of an analysis entry are processed, and then the analysis entry is processed. The scan entry processing consists of several steps that follow in sequence: Reorientation An uptake image is generated by summing the uptake frames, as specified in the uptake field of the scan entry. Three orthogonal slices are taken in which the LV is registered. The slices are processed sequentially, starting with a transverse plane. The reorientation tool allows the user to monitor the process as well as manually intervene, if required. The transverse plane may be modified by sliding the arrow (shown in green) on the grey slide bar to the left of the Transaxial Plane figure. Similarly, the gut cropping slice (which allows gut/liver activity to be cropped from the FOV) can be manipulated using the gut bar (blue) on the same slide bar. The plane and gut settings can be preset in the scan settings dialogue or left blank, in which case they will be automatically determined at the start of processing each scan. Additionally, the colour saturation of the image may be modified for better visualization of the myocardium by sliding the green arrow shown on the Colour Saturation slider bar. The process begins with completely automated fitting; a countdown timer (shown in parentheses on the accept button) provides the time for the user to intervene. Once any change is made, the timer stops and the user is no longer limited by time. If no changes are made and the time runs out, the results are accepted and the LV model fitting (LV sampling) stage is initiated. The user may also click the accept button if no intervention is required. The user intervention time may be set in the General Options dialogue of the study settings menu. FlowQuant© User Manual 19 In each of the three orthogonal planes, a partial ellipse is fit to the LV (shown in red). The user may change the location, angle, and size by moving the lines, points, and ellipse respectively. In the event that the orientation is determined based on that of another scan, the size and/or angle may be locked (see Adding a Scan Entry on page 15). If, however, the user insists on changing the size and angle, the lock at the bottom center of the window may be clicked. Clicking the lock swaps between locked (red) and unlocked (green) states. The Reorientation Tool contains additional information such as the orientation source (in the transaxial plane figure) and whether the position, angle, and size of the ellipse in each slice was automatically determined, manually determined, or fixed. The signal-to-noise ratio (SNR) and myocardium-to-blood ratio (MBR) are displayed in the mid-VLA and mid-HLA frames, and file information is displayed in the basal-SA frame. The intention of this tool is to minimize user bias. Therefore, intervention should be at the early stages, such as selecting the plane and gut. The user should look for good overlap of the synthetic ellipse diagrams with the LV in the image. In addition, the last (bottom right) image is of a short axis slice through the base of the LV and should have a centered circular pattern. The tool does not need to result in a perfect fit since final registration and sampling of the LV occurs in the next step. LV Modeling (Sampling) The LV modeling stage detects the exact location of the center of the myocardium. The reoriented image is re-sliced in a bottle-brush fashion to generate a sequence of slice images with a circular pattern. A spline model with 13 degrees of freedom is then fit to the image. The Short Axis Rotational Control, an additional sampling point/line exterior to the septal wall, is present on a single slice image. This line indicates the center of the septal wall and is included to ensure that the septum is displayed in the common orientation on the polar-map (i.e. centered on the left side of the polar-map). Manual adjustment varies the short axis angle from 0°, as shown in the bottom right corner of the window. The figure on the following page demonstrates the slices from apex to atrium (top left to bottom right). Similarly, the horizontal and vertical long axis slices are displayed. The fitted model is displayed as a red line (except in the horizontal long axis, where it is cyan). In the short-axis slices the epicardium and endocardium are also drawn in solid red lines. FlowQuant© User Manual Transverse plane slider 20 Fitted Ellipse Parameter optimization status Gut crop slider Orientation source Accept button with countdown timer Angle control Position control Size control Color saturation slider Fixed settings lock/unlock A countdown timer as in the Reorientation Tool exists, providing time for the user to intervene if need be. The user may drag any of the rings in the short-axis slices of VLA/HLA to manually assist with the fit. Each ring in the short-axis slices is paired with a ring in the VLA (red) of the HLA (cyan). Also, if the septal wall sampling point/line does not appear to be centered on the septal wall, the user may change its orientation by dragging the point/line. The green circle, which is fit to the apex FlowQuant© User Manual 21 in the VLA and HLA frames, may also be manually adjusted. The user may also click the Optimize Fit button to improve the fit using the manual fit as a starting point. The Common image scale checkbox allows the user to swap between independent scaling of each image in the figure (for improved contrast) and a common scale for all slices. Short Axis Rotation Control Manual intervention spline points Accept button with countdown FlowQuant© User Manual 22 Once the LV model has been displayed, the Registered Polar-map, a static uptake polar-map and model figure, is also shown for visualization of the whole LV to ensure proper fitting. The model figure is displayed from three different angles to overcome visual occlusion. Missing sectors (sectors that are outside the FOV) are not displayed. Once the LV model has been accepted, a larger version of this figure is displayed. FlowQuant© User Manual 23 A drop-down menu appears in the Registered Polar-map window which gives the option of viewing the 3D polar-maps as a 3D Surface (default), Smoothed 3D Surface, or 3D Mesh. Dynamic Polar-Map The orientation and sampling are then applied to all time frames of the image sequence. This generates a dynamic polar-map as well as blood time activity curves. Three blood time-activitycurves are sampled: left ventricle cavity, left ventricle base, and left atrium. A TAC figure is created with the three blood TACs, their median, and their mean myocardial (polarmap as shown on the PM) TAC. FlowQuant© User Manual 24 A gamma-variate model is also fit to the Blood Media TAC and the model parameters are displayed in red for reference. During this stage, motion detection takes place. If motion correction is turned on correction is also applied. The small shift graph represents motion in x (septal-lateral), y (anterior-posterior), and z (apex-base) direction in mm. The vertical black line on both the motion and TAC curves represents the cutoff frame for which motion detection was applied (right of the line). Blood ROI Processing This processing step happens in the background. A blood pool frame is automatically selected based on the blood TACs and the image is used to automatically define a blood ROI which may be used as a blood input function to the kinetic model stage in place of the previously discussed regions (ABC). The LV model figure is also updated with the blood ROI shown as a red patch. Kinetic Modeling The last stage of processing a scan includes running of the kinetic model. Description of all kinetic models is beyond the scope of this document, but they all result in a similar figure format. A series of polar-maps are displayed for the uptake, kinetic model free variables, chi-square, r-square, exit flag, and upper bound saturation. At the bottom half, fitting information for the selected sector is displayed. By default the mean of the high uptake regions is displayed, but the user can click on any sector of the polar-map to view its specific fitting data. The fitting graph shows the following activity curves: Blue points: measured myocardial activity Solid blue line: the model fit to the measured myocardial activity Cyan line: pure myocardial signal Solid red line: measured blood activity Dashed red line: metabolite-corrected blood activity Dashed green line: the difference between the measured myocardial activity and the fit at that point (blue points less the blue solid line), i.e. the residuals In cases where myocardium to blood pool region spillover correction is used, the sampled blood TAC is shown with a shaded red line and the spillover corrected blood TAC (which is used for the kinetic modeling input function) is shown in red. FlowQuant© User Manual 25 FlowQuant© User Manual Tip Recycling windows may be important to reduce the chance of exhausting computer resources. This can be selected in “Study Settings”. Tip To abort processing, close the current window during processing. Tip To process a single entry (analysis or scan entry), right-click on the entry and select Process Scan (Overwrite or Complete) from the context menu. Single Window Processing Optionally, the user can choose to process a dynamic study using a single window, rather than all the figures shown above. The same processing steps apply, with similar operator interaction. No approval is required between steps, however, and processing continues from point of interaction. This option may be turned using the study setting explained below. 26 FlowQuant© User Manual 27 Analysis Upon completion of the scan entry processing, the analysis selected in the Analysis drop-down list will proceed. There are four main types of analysis available: Rest-Stress Mismatch Database Comparison (*not yet fully activated) Gated Animation Rest-Stress This analysis method provides rest, stress, reserve (stress/rest), difference (stress-rest) and stress/rest>threshold (where threshold is the value set by the user in the Study Settings menu; values < threshold are considered to be defects) polar maps for each of the relevant parameters FlowQuant© User Manual 28 from the kinetic model processing. For example, for the 1-compartment DV model, polar maps for uptake DV, K1 and flow are presented. Below each polar-map, the mean and % of maximum are given for each major coronary territory, and the segment with the lowest mean also indicated. For an example of the output please see the Flow Defect Quantification figure on the subsequent page. The polar-map is segmented based on the segment model set in the Study Settings menu. The parameter values in each segment are saved in a text file. For an explanation of the output values generated in the text file that accompanies the visual output please consult the Rest-Stress Defect Analysis Output File Guide as listed in the Additional Documentation section at the end of this manual. FlowQuant© User Manual 29 FlowQuant© User Manual 30 Mismatch This analysis method provides a comparison between the uptake of the perfusion tracer and a viability tracer, for example N-13-ammonia and FDG. Polar maps of: - uptake - defect area (area < threshold) normalized to the maximum value of the LV - match (perfusion defect – mismatch) - mismatch (FDG – perfusion) - reverse mismatch raw (perfusion – FDG) - reverse mismatch normalized (perfusion – FDG normalized to maximum of LV) are presented. Above each polar-map, the % of LV that corresponds to that parameter is indicated. For an example of the output please see the Mismatch Analysis figure on the subsequent page. The polar-map is segmented based on the segment model set in the Study Settings menu. The parameter values in each segment are saved in a text file. For an explanation of the output values generated in the text file that accompanies the visual output please consult the Mismatch Scores Output File Guide as listed in the Additional Documentation section at the end of this manual. Note that there are six different mismatch options: - Normalize whole LV: this is the standard option - LBBB exclude septal half-LV: to be used in cases of left bundle branch block where it is not useful to include the septal half-LV in the analysis - LBBB exclude septal wall: to be used in cases of left bundle branch block where it is not useful to include the septal wall in the analysis - LBBB lateral wall only: to be used in cases of left bundle branch block where it is only useful to include the lateral wall in the analysis - DBM – no FDG normalization: to be used in cases of diabetes mellitus where FDG normalization is not useful - Normalize whole LV using K1 map: use the K1 map for the perfusion tracer rather than the uptake map. FlowQuant© User Manual 31 Database Comparison Allows comparison of rest/stress scan pairs to a normal population database. Note that this feature is not fully functional at this time. FlowQuant© User Manual 32 Gated Animation Gated scans are processed in a similar fashion to dynamic scan, beginning with the Orientation and PM Sampling stages detailed above. LV sampling is then automatically processed for each phase separately. A gated report is generated for each scan as shown below. The report is gated and cycles through the phases synchronously for all scans. FlowQuant© User Manual 33 During cine playback the user may change the frame rate (top right scroll); change the zoom on the SA, VLA, and HLA (top left scroll); capture the sequence to a movie file (bottom left button), or pause/resume the cine display (bottom right button). In addition, the user may click on the X marks in the volume vs. phase curve to select a frame to pause the display on. Time frames are always synchronized between all reports. Results Images of the results are saved as image files to the study directory; the file type can be selected in the Study Settings menu. If the option is selected in the Study Settings, these results may also be printed to the default printer. Reports can be saved to an additional directory by checking “Enable spooling” in the Study Settings dialogue. Dynamic Splash Display (DSD) Dynamic Splash Display is an interactive GUI that provides the user tools to visualize processed studies. DSD is intended to interpret rest and stress perfusion studies, but is compatible with dynamic, gated and static images, providing more advanced functionality. Studies can be of the same or different patients or baseline vs. follow-up. DSD allows the user to also view CT images of the same patient fused with emission images. If dynamic images are present the user has the ability to play trough the image sequence and view time activity curves. Screen captures can be saved as movie or still images. Movies can be saved in *.gif or *.avi format while images are saved in JPEG format. The header at the top of the figure contains relevant patient data (e.g. patient identifiers, patient age, patient weight, blood pressure, heart rate). A series of buttons controlling majority of the features are located at the bottom of the figure. The buttons control everything from the colormap being displayed, to the zoom of the image. By default, the DSD shows select slices through the LV and the toggles located above each image can be used to scroll through the slices being displayed and to align between image series. Similarly the frame slider toggle at the bottom of the figure allows the user to change which frame is currently being displayed on the figure if the images are dynamic or gated. The Time Activity Curves plotted in the DSD are also interactive. By moving the “blue bar” around the user can change the time frame being displayed. If the user drags the bar to cover multiple time frames the images will update to a summation of the time frames. FlowQuant© User Manual 34 The user also has the ability to view the contour lines on the image by toggling them on and off. DSD also allows the user to fuse PET and CT images together for further comparison. Using the slider located below the Time Activity Curves the user can select mixing of the CT and emission images. By default 100% emission data will be displayed. If no CT data is loaded into FlowQuant this slider is not visible. A list of addition features in DSD is as follows: Ability to change the color-limits of the image o Custom - Using a slider or preset values o Study - Max and min of the entire data set o Frame - Max and min of entire data set within a frame Changing the colormap o Inverse of colormap Changing the x and y scale of the TACs o Logarithmic or linear Settings the Zoom of the Image Changing the image slices being displayed Changing the image frame being displayed (dynamic/gated only) Image Transparency (CT data required) Playback of images (dynamic/gated only) o Loop (forward) o Sweep (forward then backwards) o Changing speed of playback Enabling contour lines o Display or hide o Change color Saving (Screenshot or movie) FlowQuant© User Manual o Screen shot - JPEG o Slice Slider Zoom Slider 35 Printer friendly version (White background) Movie - GIF or Avi Patient Information header Frame Slider Playback Settings TAC slider Color Limit Toggles PET-CT FlowQuant© User Manual 36 Additional Features Many additional features may be accessed through context menus associated with an entry in the study list (analysis or scan entry). Context menus appear on the screen when the user clicks on an item using the right mouse button. The contents of the menus change depending on the object that was clicked. Some entries in the menu are common to the entry (analysis or scan), and will therefore appear regardless of which part of the entry was clicked. Other entries are specific to the field. The common context menu entries include: Analysis Entry Scan Entry Subject Exam Data Description Physiologic data associated with the exam (heart rate, blood pressures, glucose levels) Process Analysis Settings Process Scan Settings Settings associated with the entry. Process Analysis (Overwrite) Process Scan (Overwrite) Process the entry, overwriting existing results. Process Scan (Complete) Process the entry, completing only the results that have not yet been processed. Process Analysis (Complete) Duplicate Duplicate the entry. Remove Remove the entry from the study list. View Results View results (a sub-menu lets the user select the desired result to view). Delete Results Delete results (a sub-menu FlowQuant© User Manual 37 lets the user select a set of results to delete). Export Results Export the blood TAC to a CSV (comma separated variable) file. Subject Exam Data Enter heart rate, blood pressure (systolic and diastolic), and glucose values. Specific context menu entries include: Filename: - View – view the raw image. - View Smoothed – view the raw image after it has been smoothed to the resolution specified through the settings hierarchy. - View Header – view the image header information. - Select File – select an image file using a browser. - Crop File – crop out parts of an image that are not relevant to the analysis and may adversely affect software automation. - Motion-Correct File – adjust for patient motion. Orientation: - Import Orientation – import the orientation from a previously processed file (*PMSampling.mat file) Removing an Entry Select the entry > Press the delete button in the toolbar. OR > Right-click on the entry and select “Remove”. FlowQuant© User Manual 38 Confirm the removal by clicking on the “Yes” button in the confirmation pop-up box. Duplicating an Entry Select the entry > Click on the duplicate button in the toolbar. OR > Right-click on the entry and select “Duplicate” from the context menu. The duplicated entry is entered at the bottom of the study list for an analysis entry, or at the bottom of the analysis list for a duplicated scan entry. Multiple Entry Selection Hold the Control/Ctrl key > Click on the entry/entries of interest > Release key when done. This function is useful for removing, duplicating, processing, and changing the settings of several entries at once. Note: Multiple entries do not currently support result viewing. Note: Only entries of the same type (i.e. analysis or scan) can be selected simultaneously to avoid ambiguity. Viewing Data In a scan or analysis context menu under “View Results”, several of the datasets may be viewed. These include: - Header - Dynamic Image * FlowQuant© User Manual - Uptake Image *1 - Smoothed Uptake Image - PM Sampling - PM Sampling Validation Tool - Reoriented Image - Smoothed Reoriented Image - Dynamic Image Splash - Uptake PM - Dynamic Sequence Viewer - Dynamic Sequence Report - KM Data (blood time-activity-curves and dynamic polar-maps) - KM Results - Gated Results 39 Context menus also exist for 3D surface viewing of polar-maps. By right-clicking on any polar-map or 3D surface, a context menu with the following viewing options will appear: * - View Polar-map - View 3D Mesh – view a 3D rendering of the polar-map with the surface mesh displayed. - View 3D Surface – view a 3D rendering of the polar-map with the surface mesh displayed and a softer lighting which gives a smoother appearance. - View Smoothed 3D Surface – view a 3D rendering of the polar-map which has been smoothed using the spline points. - Apply to all PMs in figure – apply current view to all other polar-maps. - Copy to separate figure – copy the current subplot and its view to a separate figure. Volumetric data may be viewed with either VolumeViewer or 4DView. For further information, please refer to their respective documentations (page 47). FlowQuant© User Manual 40 FlowQuant© User Manual 41 Analysis Settings During the different processing stages, certain parameters are used which may be controlled by the user through a hierarchy. When a new study is created, default study settings are loaded. When a new scan or analysis entry is added, default entry settings are used. The user can modify the scan entry settings, analysis entry settings, and global settings, which are saved as part of the study. Settings Hierarchy When processing a study, the actual settings for processing are resolved based on a hierarchy, as demonstrated in the figure below. Analysis Setting Study Setting o Species + Tracer Highest (most specific) Priority Scan Setting Lowest (least specific) o Species Scan settings are specific for a scan entry and therefore are top priority. Settings that are common o Default to all scan entries in an analysis entry may be set through the analysis entry settings. However, if conflicting entries exist between analysis and scan entries, the scan setting will always prevail as dictated by the hierarchy. Study settings are split into combinations of species and tracer. Thus, the user can specify different default settings for species-tracer combinations. The hierarchy dictates that settings that are species-tracer specific have higher priority than settings of the species alone. At the lowest level of the hierarchy are default settings that are not specific to any species or tracer. If settings (global, analysis, and scan) are left empty, default values will take effect, which are determined by working backwards through the hierarchy. Therefore, if a setting is not specified for a scan, the analysis setting will be used. If that hasn’t been specified either, the study setting for that species-tracer combination is used. If that is set to default, the species setting is used. Finally, if the species setting is set to default, the software default setting is used. The entire global settings can be edited using the global settings dialogues. FlowQuant© User Manual 42 Entry Settings The following image demonstrates the “Scan Settings” (settings for a scan entry). Likewise, an “Analysis Settings” dialogue exists for an analysis entry, which differs in the scope of influence as dictated by the settings hierarchy explained in the section above. Entry settings may be accessed through the context menu of the respective entry. The species section in both the “Analysis Settings” and “Scan Settings” menus allows the user to override the species that was imaged, and may be useful if the wrong species is identified by the software. This field is located at the top of the “Analysis Settings” and “Scan Settings” dialogue windows, and can also be found under the Default Analysis Options heading in the “Study Settings” menu. The species may be seen on the reorientation reports as well as in the tooltip of the patient name. The species can be changed using the species icon to the right of the “Patient” field. FlowQuant© User Manual 43 The other sections relate to generating polar-maps and the kinetic modeling. If the entries are left blank, default values will be used from lower levels in the hierarchy. Default values (if relevant) are displayed based on the notation explained in the Default Value Display Feature section in orange under Default Analysis Options. The default values are determined by the hierarchy specific for the species and tracer of the scan. The editable fields include: o Species – the species of the patient that was imaged (Automatically Determine/human/dog/rat/mouse/pig). Polar-map Options o Plane – the transverse plane in the image to use in the first stage of orientation (integer value between one and number of planes) o Gut – the last transverse plane in the image to use for the analysis in order to crop out gut/liver activity (integer value between 1 and number of planes). o Radial Search (%) (100-200) – currently not used. o Radial sample endo (mm) – the distance from the center of the myocardium to the endocardium. Used in conjunction with Radial sample epi. Average activity over depth of myocardium. o Radial sample epi (mm) – the distance from the center of the myocardium to the epicardium. o Dynamic smoothing: o Type – type of smoothing (Default/Gaussian/Uniform/Peak) to apply to dynamic volume sequence prior to obtaining dynamic polar-map. Kernel size –size of the kernel used in smoothing. Uptake – the frames which are summed to generate an uptake image. The default is 1 (meaning the last frame). However, the user can enter integer numbers to indicate the last N frames to sum. The user can also specify a range of frames from anywhere in the sequence over which to sum. o Weighted Sum: Default/On/Off. Uptake resolution (mm) – target smoothing resolution (0-20 mm) of uptake images. FlowQuant© User Manual 44 o Normal uptake threshold (%) – the threshold in percent of maximum activity in the polar-map above which sectors are regarded as normal. o Segment model – the segment model (3, 5, 9, 17, or 20) to apply to the polar-map for analysis. o NRings – the number of polar-map rings to use with the segment model. Kinetic Modeling Options: o Start time (mins) – number of minutes from the start of acquisition at which to start the dynamic data for kinetic modeling. o End time (mins) – number of minutes from start of acquisition at which to end the dynamic data for kinetic modeling. o Blood spillover correction – correct for blood to myocardium spillover. o Auto estimate RC – automatically determine the recovery coefficient to be used for partial volume correction. o Recovery Coefficient– preset recovery coefficient if a constant RC model is used (01) o DV (K1/K2) – preset distribution volume value if a constant DV model is used. o Retention integral – means by which to obtain the retention integral for the retention model. (Use default/Peak + constant time [0-2 min]/Time/Gamma fit) o Blood input – regions of the blood pool used to generate blood time activity curve for kinetic modeling and retention model. Options include: All combinations of atrium (A), base (B), and cavity (C) ROI generated from an early blood pool image External file o RV blood correction – optional correction for RV blood spillover into the myocardium ROI. o Fast flag – choose either to process each sector of the polar-map or ¼ of sectors and interpolate; used to speed up kinetic-modeling processing (Default/Yes/No). Coronary Artery Tree: FlowQuant© User Manual 45 Locations of stenoses can be entered for the major arteries. The arteries will then be displayed on the polar-maps and 3D views of the LV. Anatomy options include: default, none, right dominant, left dominant. Extra TAC File: Select an external file containing a TAC to which TAC from the scan can be compared. Supported formats are comma separated variables (*.csv) files from GE micro volumetric blood sampler and Siemens IRW and Asipro software. FlowQuant© User Manual 46 Study Settings The “Study Settings” dialogue is shown below. The study settings are split into General Options, Study Options, and Default Analysis Options. General Options The general options pertain to the general functioning of FlowQuant© and include the following options: User Interaction Delay Time (sec) – a setting is available for both batch-processing and processing of a single scan. The time is specified in seconds (enter 0 for no user intervention and infinity (inf) for mandatory user confirmation). Recycle analysis windows – if checked, windows are reused rather than created for each new figure. This feature is especially useful when batch-processing. Warning If this feature is not used, many windows may be opened, leading to poor system respons. Volumetric Viewer – selects which viewer the user prefers to use for viewing results (Volume Viewer / 4D Viewer). FlowQuant© User Manual 47 Reports to Save – determines which reports to be saved, in which image format, and to what locations. The following report types can be individually configured: Orientation (includes reorientation, LV model, uptake polar-map, and TAC figures); Kinetic modeling; Analyses. Each report can be saved to one or more of the following: o Save – Local file in the study directory o Print – Print to the default local printer o Spool – Send to another directory for spooling into an archiving system (only tested with Hermes). Red text in the spooling directory text box indicates that the specified directory cannot be found. Supported file types are *.png, *.tif, or *.gif. o DICOM – push as a secondary screen capture to a DICOM complaint PACS system Supported image formats are: o File Formats – the file formats which the reports will be saved in include: Matlab Figure (*.fig) Post Script (*.eps) Enhanced Metafile (*.emf) Portable Network Graphics (*.png) TIFF, Compressed Image (*.tif) Print to default printer (Note: this option may be convenient in some cases, but may also lead to excess waste of printer supplies). Gated Report (*.mpeg) Gated reports can only be saved as animated *.gif files to the local study directory. This section includes options that are specific to the type of study and includes the following options: Scan Labels List – a list of possible labels that are available in the label pull-downs of each scan entry. The list should be edited to reflect the nature of the study. They should typically follow the format descriptionTracer where the description may include rest, stress, baseline, follow-up, 240s infusion, etc. Below are some examples: Example study Example labels FlowQuant© User Manual 48 Comparison of perfusion with Rubidium and RestRubidium Ammonia StressRubidium RestAmmonia StressAmmonia Clinical use with Rubidium and FDG mismatch RestRubidium analysis StressRubidium RestFDG StressFDG The tracer section will be used to help resolve the relevant labels to each entry based on the tracer in the image information. Apply scatter fraction correction – enable/disable correction for scatter fraction if need be (specific for Rb scans on GE scanners). *No longer required depending on the GE camera model/software. Save reoriented conical slices – turns on an optional saving of an additional intermediate file with the reoriented uptake frames sampled in a spherical-conical coordinate system. Copy images to study directory – copy the image files to the study directory. This feature is useful for transferring an entire study to one directory; however, it increases disk usage. Live PM display during LV modeling – displays the PM and three orthogonal views for quality control during short axis sampling. Process RV – enables segmenting and analysis of the RV myocardium in addition to the LV myocardium. Color Options Color scheme – changes the colour scheme to white, grey, or black Image Color-map – changes the color-map of the image to either: Jet, HSV, Hot, Cool, Spring, Summer, Autumn, Winter, Gray, Bone, iBone, Copper, Pink, or HotMetal Polar-map Color-map - changes the color-map of the polar-maps to either: Jet, HSV, Hot, Cool, Spring, Summer, Autumn, Winter, Gray, Bone, iBone, Copper, Pink, or HotMetal FlowQuant© User Manual 49 Preferred Uptake Units - activity Bq/cc, SUV-bw mL/g, SUV-lbm mL/g, or SUV bmi mL/gm2. Note that SUV values can only be displayed if relevant patient information (weight, height, sex) can be retrieved from the scan file header. In the absence of relevant data, activity units are displayed. Default Analysis Options This section pertains to default values for analysis. Note that the fields in this section are similar to those in the process scan/analysis settings dialogue. The description of each field in this panel is explained in the “Entry Settings” section above. The user may select combinations of species and tracer, and general default and default values for different species using the two pull-down menus at the top of the panel. Default values, which are determined through the hierarchy, are displayed using the notation as explained below: Element Default User-Defined Edit Boxes Blue text Black text Pull-Down Menus Shown in tooltip while hovering cursor over pull-down menu Radio Buttons Bold text Regular text Rest-Stress Flow Analysis Options These options control processing and reporting of Rest-Stress Analyses. Options include: Normal Rate-Pressure Product (RPP) – rate pressure product to which rest perfusion scans are normalized for RPP correction. Normalize only if RPP is greater – optionally applies normalization of flow to normal RPP if RPP is greater than the normal RPP. Otherwise normalization will be applied regardless if RPP is greater than or less than normal RPP. Defect Clinical Classification Method – determines the classification scheme by which flow segments are classifies Gould – based on Nils P. Johnson, Lance Gould, "Integrating noninvasive absolute flow, coronary flow reserve, and ischemic thresholds into a comprehensive map of physiological severity", JACC, 2012:5(4);430-440. Ottawa – unpublished Prior – unpublished FlowQuant© User Manual 50 Apply RPP – controls if classification is performed using RPP corrected or uncorrected reserve values. Confidence intervals – optionally display confidence intervals around classification points. Intervals can be specified for CFR and stress flow individually either as % of value or in absolute units. Generate Summary Report – optionally generates a summary clinical flow reserve classification report based on the either Flow or FlowRC values. Making Current Study Settings the Default Settings Select Menu > Settings > Save Current Study Settings as Default This will set the default study settings for future studies. Reverting to the Default Study Settings Select Menu > Settings > Load My Default Study Settings The user may load the default study settings to override the current study settings. The user is prompted to confirm the operation, as the current settings will be lost. Exporting the Study Settings Select Menu > Settings > Save Study Settings The user may export the current study settings to a file. The user is prompted for a file name and location. The *.ini file is saved and may be imported in the future. Note: The MMSettings.ini file in the FlowQuant© directory is the default study settings file. Saving to this file is equivalent to “Making Current Study Settings the Default Settings” as explained above. Importing Study Settings from another File Select Menu > Settings > Load Study Settings FlowQuant© User Manual 51 The user may import study settings from either an *.ini file, or from another study. This operation overwrites the current study settings. FlowQuant© User Manual 52 Tools Close All Figures Closes all the FlowQuant© generated figures in order to de-clutter the screen. Clean Study Directory Removes all files from the study directory which are not relevant to the current study settings. Update Scan Files Directories This tool is designed to quickly correct the location of multiple image files, particularly in large studies, which is particularly useful when the directory structure has been reorganized, or the study has been copied to another computer. When the tool is opened all the existing file locations are listed in the top. Select a file location that needs to be corrected and update the location it in the edit box below. You may use the browse button to locate the new directory using a directory browser. Finally, press the Apply to update the location in the current list of directories. The directory locations are updated in the study when the OK button is pressed. Pressing the Cancel button maintains the current locations in the study. FlowQuant© User Manual 53 Image Cropping Tool The Image Cropping Tool is intended to crop out parts of an image that are not relevant (ex. a urine pool under the animal, uptake in an adjacent organ, or irrelevant areas) to the analysis and may adversely affect the software automation (ex. out-of-memory errors). The Image Cropping Tool may either be accessed through the tools menu or by the context menu of a specific image filename entry. If the Image Cropping Tool is accessed through the context menu the image filename will already appear as the source filename, which will not be editable. If the tool is accessed through the menu, the source file field will not be populated and the user will have to enter a file. Below is an example dialogue accessed from the context menu. FlowQuant© User Manual 54 The cropped field can be selected in one of four ways: 1) Entering the 6 cropping coordinates directly on the left under Crop. The inputs include the starting and ending X, Y, and Z slices to include in the cropped image. By default the original image dimensions are populated. 2) Choosing a preset crop under Presets. The presets crop the image so that half of the X and half of the Y dimensions and all Z planes are kept. The buttons correspond to all combinations of left half (L); centre half (C); or right half (R), and top half (T); middle half (M); or bottom half (B). When any of these buttons are pressed, the X, Y, and Z edit boxes will update to reflect the new cropping coordinates. 3) Using Quick Pick. Select the desired region by selecting the uptake frame (top scroll bar) and the transverse slice (left scroll bar), and clicking on the centre of the LV. Tip The uptake frame in which the LV is most clearly defined depends upon the specific tracer. The Image Cropper Tool automatically selects the final frame; however, to facilitate cropping choose the frame with the highest uptake before selecting the transverse slice. 4) Using the Volume Viewer tool.*2 A range of frames to view may be specified in the edit box. By default, only the last time frame is selected. If the images are large, selecting too many frames may lead to out of memory errors. Once the desired time frame range has been selected, click the Use Volume Viewer button. The Volume Viewer enables the specification of cropping ranges by the moveable green and red bars on the axis rulers. Accept results by clicking on the Acquire Volume button. The * A link to the Volume Viewer documentation is found on page 42. FlowQuant© User Manual 55 selected cropping coordinates will be displayed in the coordinate edit boxes, mentioned in option 1. By default, the target file will have the same name as the source file with _cropped appended to the end of the filename. The file will also be saved as a .mat file. Click the save button to save the cropped image. If the Image Cropping Tool was accessed through a context menu, the file entry will be populated with the cropped image file name. FlowQuant© User Manual 56 Motion Correction Tool Tip As of version 2.2.0, automatic motion correction can be applied to dynamic images. The motion correction tool described below is a manual correction. The motion correction tool is used to determine if the subject moved during a dynamic scan. The tool is accessed through the context menu of the image file and brings up the 4D viewer as well as the motion estimation tool, which work in conjunction with each other. FlowQuant© User Manual 57 The user selects orthogonal x, y, and z planes on which the analysis is performed by moving the crosshairs to the slices of choice in the 4D Viewer window. The motion correction tool is updated with every pixel selected in the viewer. The correction tool shows cross correlations between adjacent time frames in all three axes (top row) as well as on a zoomed scale (bottom row). In the absence of patient motion, the darkest red regions would align on the zero-shift line. The tools can be used together as follows: 1. Select the pixel as well as time frame in the 4D Viewer window. 2. Control points (marked by “+” symbols) are superimposed on the zoomed views. The user can interact with the control points to correct motion by clicking and dragging each point. If there is no motion in the image, best cross correlations (red) will run as centered, vertical lines in all three axes. In practice some small deviations may be expected. The control points should superimpose the cross correlations closest to unity (red). Select the highest correlation (dark red) with the control points. This can be done in two ways: 3. i. Manually adjusting each control point by clicking and dragging them to the darkest red regions for the X, Y and/or Z axes. Select the axes to optimize along by checking “Enable X”, “Enable Y” and/or “Enable Z” below each zoomed frame in the Motion Estimator window. ii. Using the Automatically Optimize button. Select the time frame to optimize by clicking and dragging the horizontal black line to the desired time frame. The optimization will apply to all frames below this line. Select the axes to optimize along by checking “Enable X”, “Enable Y” and/or “Enable Z” below each zoomed frame in the Motion Estimator window. Click Automatically Optimize. Click Apply and the Motion Estimator and 4D Viewer windows will automatically update the image. Tip The playback feature in the 4D Viewer may be used in conjunction with the motion estimation tool to evaluate image motion. FlowQuant© User Manual 58 4. When satisfied with the correction, press the “Save” button to save the image to a new file. The new filename will automatically replace the existing one in the scan entry. The motion correction can be cancelled by closing both windows. Administrator Tools The administrator tool provides additional advanced options that are intended only for a user overseeing the FlowQuant installation. The administrator tool is password protected with the default password set to “password”, but the user may choose to change the password after receiving administrator access. The administrator tool can be used to configure default directories for study and scan file locations, and tracer and state dictionaries can be edited. FlowQuant© User Manual 59 Dictionaries are used to configure synonyms that will be translated into standard terms used throughout FlowQuant. The list of terms is displayed in the left half of the dictionary and the synonyms of that terms are listed on the right. When looking to resolve a state, any synonym that is encountered is translated into the corresponding term (same process for tracers). In the examples below, the terms Water, OWater and H2O will be translated into Water. The patterns SStress, Adeno, ATP of Stress will be translated into Stress. Patterns are sought in applicable image file header fields and are delimited by characters (,\.^- spaces and by numbers). Data – Export Dynamic Data Dynamic data can be exported to an Excel spreadsheet for further analysis. Each entry that has been processed (reoriented and sampled) is included in its own sheet. The sheet contains a table about each time frame (rows). Data – Export KM Results This tool is useful for further analysis of the kinetic modeling results, by exporting the desired data into an Excel spreadsheet. The user is queried where to save the results and is then queried for the FlowQuant© User Manual 60 desired parameters to record and into how many segments the polar-map should be divided. The user may specify how many rings of the polar-map to use or let FlowQuant automatically determine. An operation to perform on all pixels in a segment is also required (e.g. Mean, Median, StandardDeviation, Standard-Error, Maximum, Minimum). A new sheet will be created with the results tabulated with each parameter, of each segment in a column and each scan in a row. Only the available results (images that have been processed) are tabulated. Parameters that are not part of an entry’s kinetic model are left empty. The order of the entries is as specified in the study list. Data – Export ROI Coordinates This tool exports the ROI coordinates from the SA sampling phase of the processing to a CSV file. This is useful for importing the desired region of interest into other software packages for further or comparative analysis using the same initial registration of the data. FlowQuant© User Manual 61 Special Considerations for Small Animal PET Image Processing The previous sections pertained to image processing for scans in humans. The process is the same in small animals; however, special considerations must be made to accommodate their smaller size. Select SettingsEdit Study Settings The default options for each species can be viewed by selecting the species from the “Species” menu under “Default Analysis Options”. Settings specific to the species and tracer can be obtained by additionally selecting the tracer from the “Tracer” menu. Species-specific settings are shown in black text, whereas settings common to all species are shown in purple text. Although these settings are designed for the specific species, they can be adjusted by the user by simply typing in the desired value. Image Cropping ToolsImage Cropping Tool OR Right click the “File” field of the scan Crop File Due to the size of the image files in small animal PET, a memory error may result if the user attempts to process the files without using the Image Cropping Tool first. General instructions for using this tool are available in the Image Cropping Tools section. Gut Cropping During the use of the Reorientation Tool, the ellipse is automatically fit to the LV. Activity from the liver/kidneys is prevalent in small animal PET images and this may interfere with the automatic FlowQuant© User Manual 62 ellipse fitting, polar-map, and kinetic modeling. The Gut Crop slide bar is automatically set at the maximum number of planes (no cropping) and can be adjusted to any point along the transverse plane. Once set it will crop out the image below the plane it has been set to. Shown below is reorientation with (right) and without (left) gut cropping. The gut contains a region of high activity, thus the ellipse is erroneously matched to this area (L). The Gut Crop slider can be used to crop the gut to fit the ellipse to the LV more correctly (R). FlowQuant© User Manual 63 Additional Documentation Rest-Stress Defect Analysis Output File Guide – guide to the text file output for Rest-Stress analysis. http://www.lightbox.ca/~mfi/FlowQuant/Documentation/RestStress%20Defect%20Analysis%20Output%20File%20Guide.pdf Mismatch Scores Output File Guide– guide to the text file output for Mismatch analysis. http://www.lightbox.ca/~mfi/FlowQuant/Documentation/Mismatch%20Scores%20Output%20File% 20Guide.pdf Volume Viewer User Manual – instructions on using the Volume Viewer tool. http://www.lightbox.ca/~mfi/FlowQuant/Documentation/volViewer%20Manual.pdf DICOM Convert Server User Manual – instructions on installing and configuring the DICOM Convert Server. http://www.lightbox.ca/~mfi/FlowQuant/Documentation/DICOM%20Convert%20Server%20User%2 0Manual.pdf