1
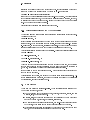
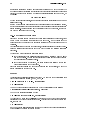
C.3 The Tuggeranong House Price Data
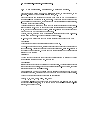
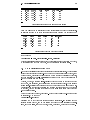
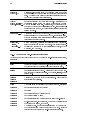
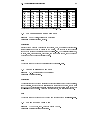
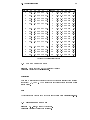
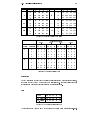
D H D
H
D
H
D
H
D
24.7 484 30.3 587 39.4 1210 42.9 1270 53.4
24.8 427 32.7 704 39.9 989 45.8 1180 56.0
27.3 413 35.6 979 40.3 1160 46.9 1400 56.5
28.4 517 38.5 914 40.6 1010 48.2 1760 57.3
28.4 549 38.8 1070 40.7 1100 51.5 1710 57.6
29.0 648 39.3 1020 40.7 1130 51.5 2010 59.2
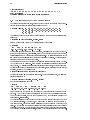
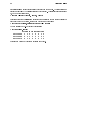
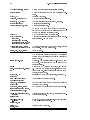
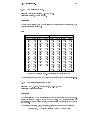
The data may be read as a data frame from le janka.data.
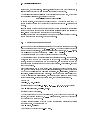
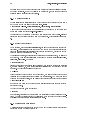
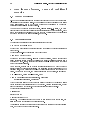
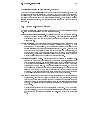
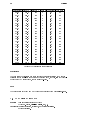
67
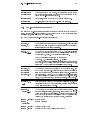
H
1880
1980
1820
2020
1980
2310
D
59.8
66.0
67.4
68.8
69.1
69.1
H
1940
3260
2700
2890
2740
3140
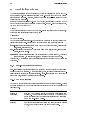
C.3 The Tuggeranong House Price Data
Source: Dr Ray Correll, Personal communication
Category: Multiple regression, coplots.
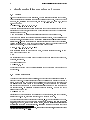
Description
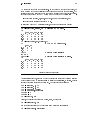
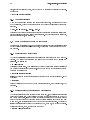
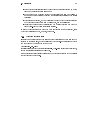
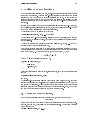
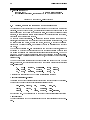
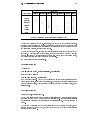
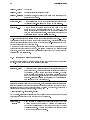
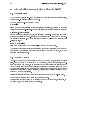
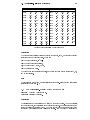
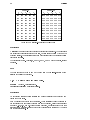
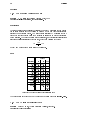
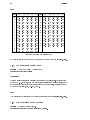
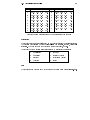
Before buying a house in Tuggeranong in February, 1987, a cautious potential householder collected some data on houses on the market. The data for 20 such houses is
shown in the table and is available as the le house.dat. The variables collected are,
in order, price, total oor area, block area, number of main rooms, age of house and
whether or not the house was centrally heated.
Data
The data is given in Table 5 and is available as the le house.data.
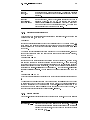
C.4 Yorke Penninsula Wheat Data
Source: K. W. Morris (private communication)
Category: Multiple regression.
Description
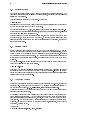
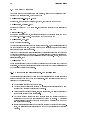
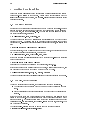
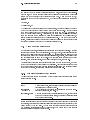
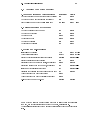
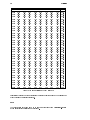
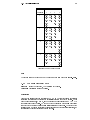
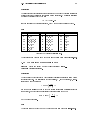
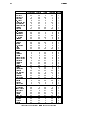
The annual yield of wheat in a marginal wheat growing district on the Yorke Penninsula,
South Australia, together with the rainfall for the three growing months, for the years
1931{1955. The year itself is potentially a surrogate predictor to allow for improvements
in varieties and farm practice. Yield is in bushels per acre, and rainfall is in inches.
Data
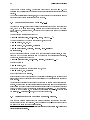
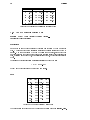
The data is given in Table 6 and may be read as a data frame from le sawheat.data.
C.5 The Iowa Wheat Yield Data
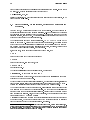
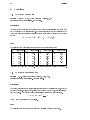
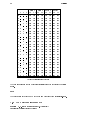
Source: CAED Report, 1964. Quoted in Draper & Smith.
Category: Multiple regression; diagnostics.