1
Multiparameter Numerical Medium
for Seismic Modeling, Planning,
Imaging & Interpretation
Worldwide
TESSERAL GEO MODELING
Windows Workplace (2D v.8.- )
User Manual
You can
...
produce
synthetic
gathers,
snapshots of the wave field, time field
of the incident waves, time crosssections and other seismic images,
AVO-dependencies for:
Models of virtually arbitrary
complexity including the ones
with strong lateral velocity
contrast, steep boundaries,
compartmentalization,
and
caustic zones, producing the
waves of complex ray-path
including those reflected from
the vertical boundaries etc.
Models
with
complex
topography and various nearsurface conditions, including
the
situation
when
source/receivers are on different elevations, traps, permafrost, low-velocity zone of variable
thickness (by correctly taking into account kinematics and dynamics of surface waves, satellite
waves, refractions, etc.).
Thin-layered models that are built on the basis of the acoustic and density well-logs.
Transversally isotropic media models with the tilted symmetry axis, which may be complicated by
tilted fracturing systems.
Models with visco-elastic properties (Q-factor) additionally allowing simulating the absorption of
seismic energy and such wave effects as velocity dispersion.
Models for porous fluid-saturated media (Gasman approximation);
… using different tools of (numerical) Seismic Modeling and prebuilt models allowing smoothly
start evaluation and working with the package.
Model Builder allows the user to quickly build models with any level of rock property and structural
complexity. Sonic log data in LAS format can be used to input Vp, Vs, and density values to easily
create thin layered models that are accurate representations of actual project reservoirs. Fracture
Tesseral 2D User Manual
systems in up to three zones each with different azimuth orientation, both vertically and
horizontally, can be defined.
Viewer interactively presents the results of the modeling in a visual format that enables the viewing
of wave propagation movies through the geologic model. The movies can be run forward or
backward to enable the user to determine the origins of all events and artefacts that are observed
on the synthetic shot records. Instantaneous flipping between the vertical, X- and Y-direction and
pressure wave records enables a full and rich understanding of the value of multi-component
recording.
Seismic Imaging procedures enable the processing of the modeling (synthetic) data. Capabilities
include velocity analysis, CDP stacking, pre-stack time and depth migration, time and depth VSP
migration, and AVO-modeling.
The source and resulting data in popular file formats can be used or output for further analysis and
processing in other packages.
The software runs parallelized calculations on a variety of hardware platforms including Windows
networks and Linux clusters, employing latest multicore and GPU technologies.
User Documentation
… consists from a number of Help documents available inline using or F1 or
buttons or menu items.
Use menu Help/
toolbar or dialogs
User Documentation for introductory information.
This User Manual provides overview of the package core functions. In other Help documents
described particular blocks and corresponding functionalities of the package.
are
Tutorial Tutorial_2D.pdf provides stepwise instructions for getting started.
Useful information can be found on the company’s website www.tesseral-geo.com:
Primer provides introductory information about the modeling in seismic and its different
applications.
Troubleshooting & FAQ provides explanations, answers and extended presentations to Frequently
Asked Questions which may occur at using the package.
You can also use training movies http://www.tesseral-geo.com/support.en.php .
It is advised to download complementary library of prebuilt models with some templates
allowing smoothly start evaluation of the package:
http://www.tesseral-geo.com/download.en.php /Tesseral Data Samples
…. look through overview of prebuilt models:
http://www.tesseral-geo.com/documentation/en/general/DataSamples.pdf
Starting
You can start the program using its icon (shortcut or pinned to taskbar) icon
sequence Start/Programs/Tesseral/ Tesseral 2D.
© 2012 Tesseral Technologies -User Documentation-
or by the
2
Tesseral 2D User Manual
The initial model data
are
associated with the Modelbuilder, and
seismic data
– with the Visualizer. A
mouse click on these files from Explorer
calls and executes the Tesseral 2D (2D here, an installed variant of the
package) with relevant data. You can run the package, also using the method of drag-anddrop method.
Creating Model
A simple and quite flexible scheme of presentation of the modeled cross-section area as a set of
overlapping polygons is used. Polygons allow localizing the distribution of the physical properties
inside the chosen area. The user normally sees the part of the polygons that is not overlain by
others. This visible parts are taken for calculations as the actual model presentation (WYSWYG what you see, what you get).
Polygons are arranged by the order in which user draws them. The next (new) polygon may be
drawn (partially or fully) over the preceding one (selected before drawing). The most convenient
order of their appearance during the model building is from the top to the bottom of the model.
There may be later modifications of the medium model: insertions, deletions, pasting, moving, etc
of polygons or their parts.
Additionally:
You can enter the pad image and draw polygons
on top of it (open the image using the dialog
Open/Picture Files, see its Help).
You can also enter acoustic, shear and density
well-logs in the form of LAS (format) files and use
them to build a thin-layered model (
Open/ Files of
type: LAS files (*.las), see the dialog’s ).
You can also use created in other packages grid model in
SEGY format (menu File/Import Grid Model, see the
dialog’s ).
You can enter the model data in the text and other
formats (dialog
Open, see the dialog’s ) for
creating or completing the Modelbuilder model.
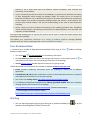
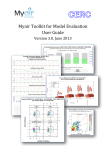
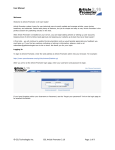
When you Start the program after the initializing dialogs
the Modelbuilder pane is automatically opened and you can start creating (draw on screen) a new
model.
The application’s main window may be split in several panes.
© 2012 Tesseral Technologies -User Documentation-
3
Tesseral 2D User Manual
Main Menu and
Toolbar
Modelbuilder
pane
Color Scale
Empty panes
Status bar
Report pane
Please use toolbar button
детальной информации.
to get more detailed informationдля получения более
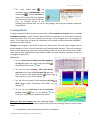
Framework dialog
… initially appears at creation of a new model. It contains a number of pages: Cross-section, Source,
Signal, Observation allowing setting the Survey Layout used in modeling.
This dialog may be also called any time by pushing
corresponding Edit popup menu item.
Please use
Framework toolbar button or
at dialogs’ pages and see provided description.
Options dialog
… allows to set general user’s Options, like selecting measurement units, and other defaults used
by the package. Use toolbar button
Options or the corresponding /File popup menu item.
Polygon dialog
... allows assigning the medium properties (velocities, density, etc.) for the selected area - polygon.
At the initialization of a new model this dialog appears for assigning properties for the base
(initial) polygon (the area of the base polygon covers the whole model rectangle and has 0
number) Over it can be drawn other polygons.
Then this dialog appears in the end of a new polygon drawing
or when user double-clicks
inside of the visible area of already existing polygon. It also can be called using toolbar button
or right mouse popup menu.
Drawing Model
Please see corresponding bookmark in the toolbar
© 2012 Tesseral Technologies -User Documentation-
Help document.
4
Tesseral 2D User Manual
Viewing Model
View Options are presented in the /View popup menu list. Use the / About ... item and see the
description.
You can select graphical representation for particular
property (component of properties vector) using /Component
menu popup list of available components.
In the status bar you can see name of this component and
corresponding value at the pointer position and the pointer
coordinates.
Color Scale allows you to see the correspondence between the colors filling the model
and property values.
/Scale menu allows applying some modifications of the object image scale on the
screen. You can see the model in isometric (same for horizontal and vertical axes) or
adjusted scale (toolbar button
);
/Magnitude menu allows adjusting magnitude of graphical presentation of the
property in different ways.
You can control view of coordinate grid, make print from the active panel, or save it in a raster
format, convert the model in the SEGY grid format, ...
By pushing button
Tune position you can see pointer hairs (lines parallel to axes stretching
from pointer). This mode brings up dialog Tune Position with coordinate values which can be
entered manually.
You can view up to two Overlain pictures (files) in one panel. Overlain can be model and pad
bitmap and snapshot or cross-section in depth scale and model. You can flip upper and lower
images using
button.
toolbar button and tune transparency of the upper image using pane
The / Help in the pane’s
panes.
menu is providing general description of manipulations with
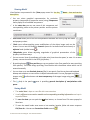
Saving Model
The model data is kept as a text file with .tam extension.
Usually different cross-section models and corresponding resulting information are kept in
separate folders.
To save the data you can push the
Save item.
Save button, or choose from File menu popup list
To save the model under new name or into another location follow the menu sequence
File/Save As… You can use Create New Folder control
© 2012 Tesseral Technologies -User Documentation-
.
5
Tesseral 2D User Manual
If you did not save model data the reminder message will appear.
o By choosing Yes button user will follow through
saving sequence. If model is modified and not
saved the model name with next version number,
e.g. Model-1.tam, is proposed.
o In case of No the new/modified model data will be
lost.
o Cancel button returns to the state preceding this message.
Loading Model
You can create a new model by clicking
menu items File/New.
New Model on the toolbar, or by a sequence of
You can open another existing model or other data by pushing
by File/Open menu sequence.
Please see corresponding bookmark in the pane menu
/
Open toolbar button, or
Help.
Converting Model
…in other formats. You can use File/Convert to/… menu options.
Model-grids
The model-prototype consisting from zero-polygon (defining minimal velocity) must be initially
created. The model rectangle (dialog Framework/Cross-section) must be tied to coordinates of the
model-grid.
The model-grid converted (File/Import Grid Model) to the internal (. tgr) format is placed in one
pane (Overlay) with a model-prototype. In this case it will be used for calculations along with the
model-prototype. Logically the grid is placed between the zero-polygon and all subsequent ones:
The zero-polygon of the model-prototype will fill all gaps in the model-grid (i.e. void values,
presented in the tgr-file as zeroes). For the non-zero grid nodes the background polygon
does not take any action.
Polygons with indexes >0 (i.e. overlaying the zero-polygon) unconditionally are overlaying all
corresponding grid values, i.e. have higher priority over the grid.
Using well-log data
The Modelbuilder model is used as a pad at creation of the model basing on the LAS-files. In setting
the parameters of the model rectangle should be considered that LAS-files have absolute binding
depths.
To download LAS-file use dialog
Open/Files of type: LAS files (*. las).
In detail work with well data and building a model for several wells is described in the Help
System of the package.
© 2012 Tesseral Technologies -User Documentation-
6
Tesseral 2D User Manual
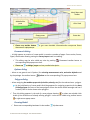
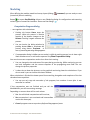
Modeling
After defining the medium model and survey layout (dialog /
(numerical) seismic modeling.
Framework) you are ready to start
Button
or menu Run/Modeling allows to see /Modeling dialog for configuration and executing
various types of numerical simulation. Please see the dialog’s .
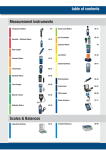
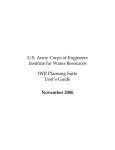
Computation Progress dialog
… runs together with calculations.
Pushing the button Pause stops the
process. When the process is inactive
caption of the button changes to the
Resume. Pushing it again activates the
process.
You can iconize the dialog window by
pushing button Hide or terminate the
process using button Terminate. In
case of canceling warning dialog appears.
If computation dialog is hidden you can make it visible by pushing process icon in lower right
main window corner or with menu sequence Run/Show Computation Dialog.
You can view current computation results short after their starting.
You can change the size and state of the pane during monitoring. While monitoring you can
see both shotgather and the current snapshot of the propagating wave field. You can
change the picture properties.
It takes time to draw the pictures, so the graphical monitoring slows the calculations. If you
do not need it you can iconize the viewer window.
When calculation is finished the viewer panel show resulting shotgather and snapshots of the last
calculated source position.
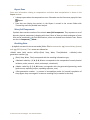
You can not only stop the execution of the program, but continue it even after it was
cancelled or crashed.
If the computation was not finished and you call the
Modelbuilder you will see warning message.
Depending on answer there will be such actions:
Yes: the unfinished computations will continue;
No: computation is not continued and intermediate
results are destroyed;
Cancel: program returns to previous (before dialog appears) state.
© 2012 Tesseral Technologies -User Documentation-
7
Tesseral 2D User Manual
Report Pane
Some text information relating to computations and other data manipulations is shown in the
Report window.
It always opens when the computations start. Otherwise use the View menu popup list item
Report.
Data that was (during last session) in the Report is stored in the current folder with
Tesseral.log name for possible later analysis.
Wave field Components
Synthetic data contains number of the seismic wave field components. They represent a set of
dynamic physical parameters (changing with time). Most of them are basic analogues of ones
that can be measured in the field observations; some are derived from the basic ones. Please
see also in Component/ About… .
Resulting Data
… by default are saved in the current model folder. Files have extension .tgr (internal binary format)
and .sgy (SEGY format). Their names are indexed as:
<Model name (with version suffix)>+{Gath, Snap, Wave, Time}<Method
generation number>].tgr
><Mode>[-<shot
{Gath, Snap, Wave, Time} corresponds with the resulting information type;
<Method> coded by I, C, A, E, N, V letter corresponds to the computation formula (vertical
incidence, scalar, acoustic, elastic, anisotropic, viscoelastic).
<Mode> coded by P, S, H, W letters corresponds with the generation/processing mode
(point source, exploding surface, exploding reflectors, sum).
<Shot generation number> - is present in intermediate results. At (normal) completion of
the program they are merged in a common resulting file (no number at the end).
© 2012 Tesseral Technologies -User Documentation-
8
Tesseral 2D User Manual
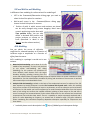
VSP and Well-to-well Modeling
In difference from modeling for surface seismic for modeling of:
VSP in the Framework/Observation dialog page you need to
select Vertical line option for receivers.
Well-to-well survey in the Framework/Source dialog page
choose Vertical line option for sources.
Position of wells in which sources and receivers are placed
can be easily changed using mouse dragging. More exact
numeric positioning can be done with
Tune position dialog. You can also
define a deviated well position and
project receivers or sources on its
trunk (described in detail in the
Tutorial, see the relevant section).
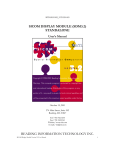
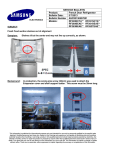
АVО-Modeling
You can obtain the curves of reflection
coefficient for selected boundary as a function of
incidence angle or amplitudes as a function of
offset from the source.
AVO- modeling in a package is carried out in two
variants.
1. Numerical AVO-modeling can be done for 2-2.5D
models of any complexity. To carry it out you have
to use option AVO-modeling (see dialog
/Modeling). At this receivers are positioned at
some relatively small distance from the target
boundary allowing recording incoming from the
source and reflected from the target boundary waves as separate events for further calculation of AVOdependencies. For their identification procedure of picking and correlation of these waves is used and
then numerically are calculated AVO-curves.
2. Analytical 3D AVO-modeling realized on the basis of the modernized variant of a solution of the fullwave equation by Haskell-Thompsen’s method for horizontal thin-layered stack. Unlike 2D modeling
here you can set axes of TTI-anisotropy in layers in any direction, as well as a direction and an inclination
of fractures. For 3D models you have an opportunity to model azimuthal AVO-effect from thin-layered
stack of rock taking into account also coupled refraction (splitting of shear waves on fast and slow in
case of monotypic and converted waves) and to obtain AVO-curves for the reflected and transitional
compressional, fast and slow shear waves. There is a capability to analyze separately amplitude and a
phase of a wave depending on frequency, an azimuth and an incidence angle. The given realization
allows considering also viscoelastic frequency dependent absorption separately for compression and
shear waves.
In details please see the description in the
© 2012 Tesseral Technologies -User Documentation-
Help of /Modeling and subsequent dialogs.
9
Tesseral 2D User Manual
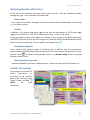
Analyzing Results with Viewer
At the end of the simulation two panes show results: the left - with the calculated synthetic
seismogram, right - with a snapshot of the wave field.
Viewer Pane
… has a separate set of tools, although it has a lot of common with the Modelbuilder one. See Help
in the Viewer toolbar.
Gathers
In addition to the internal grid format (.tgr) can be read and used gathers in SEGY format (.sgy,
.segy) of any modification - CSP, CRP or CMP (common shot-, receiver-, mid- point).
During sgy-gathers loading trace headers are modified. At first opening of sgy-gather dialog SegY
Load Info is produced (you can also call it using menu /Scale/Seg-Y Ruler) allowing additional tuning
before its using in the package. For more details, use dialog’s button .
Visualization Options
Viewer allows tuning graphical image of (resulting) data in different ways for interpretation
(enhanced picture) or/and following processing (one-trace transformations and selections). For this
purpose use the
Visualization dialog (toolbar button or by double-clicking inside of the pane)
and pop-up menu /View.
Data (formats) conversion
… between readable by the Viewer standard formats – please use menu options File/Convert to….
Seismic Processing
The package has a number of
built-in
procedures
for
processing of the synthetic
gathers and creating seismic
images. Please, use Run/
About…
for
more
information.
© 2012 Tesseral Technologies -User Documentation-
10