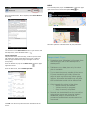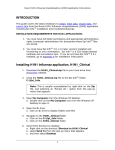
1
User Guide for Project Managers Using CASPER Developed by the North Carolina Institute for Public Health 1st Edition, August 2015 Development Team: Principal Investigator: Rachel Wilfert, MD, MPH, CPH Project Manager: Matt Simon, MA, GISP Research Associate: John Wallace, PhD, MSPH Research Associate: Kasey Decosimo, MPH Curriculum Developer: Meredith Davis, MPH Curriculum Developer: Kristen Ricchetti-Masterson, MSPH Manual Editor: Annika Pfaender Acknowledgements: David Zane, Tracy Haywood, Dr. Jennifer Horney and her PHEB 689, Methods in Field Epidemiology class, epidemiology graduate students from Gillings School of Global Public Health and community members, staff, and volunteers from Durham County Department of Public Health, Pender County Health Department, Chatham County Public Health Department, Forsyth County Department of Public Health, Gaston County Department of Health and Human Services, and Granville-Vance District Health Department for providing feedback during software piloting. For more information about this project, contact: North Carolina Institute for Public Health Gillings School of Global Public Health The University of North Carolina at Chapel Hill Campus Box 8165 Chapel Hill, NC 27599-8165 919-843-5561 [email protected] http://sph.unc.edu/nciph/ta/SMART Table of Contents Page | 3 Table of Contents CHAPTER 1: INTRODUCTION ......................................................................................... 7 Project Background ....................................................................................................... 7 Collect SMART Application ........................................................................................... 7 Purpose.......................................................................................................................... 7 Audience ...................................................................................................................... 8 Application ................................................................................................................... 8 Introduction to CASPER ................................................................................................. 9 Advantages of CASPER .............................................................................................. 9 When to USE CASPER................................................................................................... 9 ACTIVITY 1: KNOWLEDGE CHECK ............................... Error! Bookmark not defined. ACTIVITY 1: KNOWLEDGE CHECK ANSWER KEY ....... Error! Bookmark not defined. CHAPTER 2: PREPARING FOR YOUR CASPER ............................................................. 14 Introduction................................................................................................................... 14 Staffing ........................................................................................................................... 14 Using the Incident Command System .................................................................... 14 Questionnaire Design .................................................................................................. 16 Creating Questions .................................................................................................... 17 Questionnaire Layout ................................................................................................ 19 Finalizing the Questionnaire ..................................................................................... 20 Creating forms in CDC’s Epi InfoTM 7 ....................................................................... 20 ACTIVITY 2.1: DEVELOPING A QUESTIONNAIRE ........ Error! Bookmark not defined. ACTIVITY 2.1: DEVELOPING A QUESTIONNAIRE ANSWER KEYError! Bookmark not defined. Survey Site Selection .................................................................................................... 24 Sampling Frame ......................................................................................................... 25 Primary Sampling Units .............................................................................................. 27 Selecting the Clusters – Stage 1............................................................................... 28 Selecting Survey Sites – Stage 2 ............................................................................... 32 Recruiting Volunteers ................................................................................................ 35 Training Volunteers .................................................................................................... 36 Team Management .................................................................................................. 41 Field Safety ................................................................................................................. 42 Materials and Staging ................................................................................................. 44 Team Packets ............................................................................................................. 44 ACTIVITY 2.3: FORMING A SURVEY TEAM................... Error! Bookmark not defined. ACTIVITY 2.3: FORMING A SURVEY TEAM ANSWER KEYError! Bookmark not defined. CHAPTER 3: IMPLEMENTING THE SURVEY ................................................................... 50 Field Survey Methods ................................................................................................... 50 Scheduling .................................................................................................................. 50 Response Rates .......................................................................................................... 51 Going Door-to-Door .................................................................................................. 52 Special Sampling Situations...................................................................................... 53 Table of Contents Page | 4 Mobile Application ...................................................................................................... 54 Monitoring Teams and Analyzing Results in Real-time ............................................ 56 Downloading Records ................................................................................................. 57 “Day of” Preparations ................................................................................................. 59 Check-In ........................................................................................................................ 60 Before Next Survey Day ............................................................................................... 60 CHAPTER 4: ANALYZING AND REPORTING RESULTS ................................................... 62 Introduction................................................................................................................... 62 Analysis of Tracking Forms ........................................................................................ 62 Data Cleaning ........................................................................................................... 63 Weighted Analysis ..................................................................................................... 65 Reporting ....................................................................................................................... 68 APPENDIX ............................................................ ERROR! BOOKMARK NOT DEFINED. Appendix A: Resources ............................................................................................... 70 Basic Resources:......................................................................................................... 70 Questionnaire Design Resources: ............................................................................ 70 Sampling Resources: ................................................................................................. 70 Staffing Resources: .................................................................................................... 71 Training Resources: .................................................................................................... 71 Reporting Resources: ................................................................................................ 71 Appendix B: Team Assignment List ............................................................................ 72 Appendix C: Staff and Equipment Check Sheet .................................................... 73 Appendix D: Survey Press Release Template (Community Health Assessment) . 74 Appendix E: Community Flyer for Data Collection ................................................. 75 Appendix F: Base Station Layout ............................................................................... 76 Appendix G: Tracking Form Template ...................................................................... 77 Appendix H: Collect SMART Pocket Guide (Google Android Tablet) .................. 78 Appendix I: Team Packet Checklist........................................................................... 80 Appendix J: Collect SMART Data Collection FAQ .................................................. 81 Table of Contents Page | 5 Introduction Introduction Page | 6 CHAPTER 1: INTRODUCTION Project Background Collect SMART, The Survey Management and Response Tool, is a suite of software designed to help users manage and implement data collection efforts including the Center for Disease Control and Prevention’s (CDC) Community Assessment for Public Health Emergency Response (CASPER). Through collaboration with local health departments and their community and hospital partners, Collect SMART was designed, developed, and pilot tested to be an easy-to-use mobile app and project management dashboard to facilitate field data collection efforts. Collect SMART allows for the rapid collection of community-level data for decision makers based on validated sampling methods, improving the timeliness of data collection while reducing the cost of purchasing or maintaining mapping or data collection software and equipment. Collect SMART was designed to overcome some of the technical barriers of primary data collection using GPS units and CASPER including: Difficultly training volunteers in GPS units Lack of wireless connectivity Inability to upload data immediately upon capture to a cloud-based database Cost-prohibitive nature of GPS units and proprietary mapping software Inability to track results in real-time Given the increasing use of smartphones and tablets, even in resource-poor environments, data collection on these platforms makes this methodology more accessible to a wider audience. This user guide will walk project managers through all of the steps to implementing a CASPER using Collect SMART. Collect SMART Application Purpose The purpose of Collect SMART is to help users manage and implement data collection efforts including CASPER (Fig. 1). A project manager can access Collect SMART to pull their random sample of clusters and then upload this spatial data to their mobile devices installed with the Collect SMART app. Data is stored securely on the cloud and can be analyzed in real-time by the project manager. Figure 1. Collect SMART software suite Introduction Page | 7 Audience The audience for the Collect SMART application includes state and local public health professionals in the United States who require a rapid and simple way to assess the public health needs of their population. In addition, Collect SMART can be used by hospital, health care, and other community agency staff who are involved in conducting community health assessments (i.e., Health Impact Assessments), preparedness assessments, or other community surveys. Application The set of tools provided by Collect SMART enables users to: 1) Share digital questionnaire files 2) Select a random sample of neighborhoods using U.S. Census data 3) Locate the selected neighborhoods or address points using the built-in GPS 4) Digitally collect survey responses 5) Upload responses to a central server 6) Track team progress and locations 7) Conduct real-time analysis of results The Collect SMART tools will immediately provide the following innovations: 1) Electronic surveys reduce data entry time and errors common with paper forms 2) Cloud-based database for survey responses for added data security 3) Real-time survey frequency analysis using a web-based project management dashboard 4) Integration with mobile Epi InfoTM to create and share questionnaires and analyze results Materials and resources associated with Collect SMART include: MATERIALS Collect SMART software suite http://www.collectsmartdata.com/ RESOURCES CASPER Online introductory module (http://tinyurl.com/CASPERTrain) Epi InfoTM software download Community Health Opinion Just-inTime Training http://wwwn.cdc.gov/epiinfo/html/downloads.htm (http://tinyurl.com/CHOSJITTrain) Epi InfoTM Community Health Assessment Tutorial http://www.cdc.gov/epiinfo/script/eihat.aspx Table of Contents Page | 8 Introduction to CASPER The Community Assessment for Public Health Emergency Response (CASPER) is an epidemiologic sampling method that enables public health and emergency management professionals to rapidly collect data in order to determine the health status and basic needs of affected communities during all phases of a disaster response. The CASPER method can also be used to assess public health needs in non-disaster scenarios, such as community health needs assessments required for non-profit hospitals by the Patient Protection and Affordable Care, as well as to answer other research or preparedness questions in non-disaster settings. While CASPER has proven to be very effective for assessing health needs in a number of different settings, it still requires expertise in sampling, access to expensive GIS and statistical software, and often it requires extensive technical support from the CDC, state health departments, or academic partners. Collect SMART overcomes some of these technical barriers making the CASPER sampling method more accessible to a broader audience. This sampling method is a type of rapid needs assessment that was originally developed in the 1960s to assess immunization coverage, and was refined to assess health needs following a disaster. According to the CDC, CASPER is a specific set of tools designed to quickly obtain a snapshot of health needs and concerns for decision makers. Using valid sampling methods, CASPER divides populations of interest into randomly-selected geographically distinct clusters (such as census blocks). Within the clusters, a random sample of households is selected to be interviewed. This method has been validated for rapid assessments and the estimation of population-level health needs (producing valid and precise estimates of +/-10%)1. Advantages of CASPER Because everyone in the community has a chance to participate, CASPER results are representative of the community and generalizable beyond the individual respondents. This is not true of a convenience sample, which only represents the individuals who responded to the survey. Since CASPER is based on the rapid needs assessment framework, results can be collected and processed in several days giving decision makers the information they need in a timely manner. Door-to-door surveys like CASPER have higher quality data than other methods. The response rates are usually stronger than mailed surveys, the data is more complete, and the interviewer can clarify questions that may be unclear. In addition, interviewers in the field can gather data by personal observation, such as the physical condition of roads or structures. If volunteers are used to conduct interviews, CASPER can be significantly less expensive than other data collection methods. By going into the community, interviewers also promote increased community awareness of the organization (e.g., health department or hospital) conducting the assessment. Interviewers can distribute fact sheets, contact information, or resource lists. In this way, the CASPER serves an educational function as well as its primary function to determine the health status of the community. When to USE CASPER The CDC specifies three post-disaster situations in which CASPER is especially useful: when the effect of the disaster on the population is unknown, when the health status and basic needs of the affected population are unknown, or when the response and recovery efforts need to be evaluated. 1 Malilay J, Flanders WD, Brogan D. A modified cluster-sampling method for post-disaster rapid assessment of needs. Bull World Health Organ. 1996; 74(4): 399-405.); Frerichs RR, Shaheen MA. Small-community-based surveys. Annual Rev Public Health 22, 231-47, 2001. Table of Contents Page | 9 CASPER can also be used before a disaster occurs to assess community preparedness, including personal preparedness, hazard mitigation knowledge, and intent to evacuate. CASPER is also well suited to routine health data collection. Health departments and hospitals often must conduct periodic community health needs assessments. The same CASPER methods that apply after a disaster can be used for these assessments, with the added benefit of having more time to plan. Besides community health needs assessments, CASPER can be used for other surveys that gauge community opinion and knowledge on a variety of topics. In 2010 CASPER was used to determine levels of potassium iodide (KI) distribution and resident education in a 10-mile radius around a nuclear power plant in North Carolina. In another community in North Carolina, CASPER was used to gauge public opinion on how to reduce teen pregnancy and to assess how much of a problem teen pregnancy was in the community. Online Training Introduction to CASPER (25 minutes) Table of Contents Page | 10 ACTIVITY 1: KNOWLEDGE CHECK Time: Instructions: Additional Resources Required: 5 minutes Answer the following multiple choice questions. Compare your answers to the answer key on the following page. None 1. What is the primary purpose of CASPER? a. To gather disease surveillance data on a recurring basis b. To offer disaster assistance, including providing for basic needs such as food, water and shelter c. To determine the health status and basic needs of an affected community d. To identify individuals who qualify for public health programs Answer:_____________ 2. How are households chosen to participate in a CASPER survey? a. Simple random sampling in the geographic area of interest b. Two-stage cluster sampling, starting with Census blocks c. Convenience sampling of nearest households d. All households in the geographic area of interest are included Answer:_____________ 3. Which of the following is NOT a potential advantage to using CASPER over another data collection method? a. Low cost b. High quality data c. Few technical requirements d. Rapid results Answer:_____________ Table of Contents Page | 11 ACTIVITY 1: KNOWLEDGE CHECK ANSWER KEY 1. What is the primary purpose of CASPER? a. To gather disease surveillance data on a recurring basis b. To offer disaster assistance, including providing for basic needs such as food, water and shelter c. To determine the health status and basic needs of an affected community d. To identify individuals who qualify for public health programs Answer: C 2. How are households chosen to participate in a CASPER survey? a. Simple random sampling in the geographic area of interest b. Two-stage cluster sampling, starting with Census blocks c. Convenience sampling of nearest households d. All households in the geographic area of interest are included Answer: B 3. Which of the following is NOT a potential advantage to using CASPER over another data collection method? a. Low cost b. High quality data c. Few technical requirements d. Rapid results Answer: C Table of Contents Page | 12 Preparing for your CASPER Preparing for your CASPER Page | 13 CHAPTER 2: PREPARING FOR YOUR CASPER Introduction This chapter describes the basic steps necessary to conduct a CASPER for project managers. Although the steps are presented here sequentially, some may overlap or occur in a different order depending on the situation. Basic steps of conducting a CASPER: 1) 2) 3) 4) 5) 6) Gather your team Develop a questionnaire Select the sample Recruit and train interview teams Conduct interviews Analyze and report Staffing The first step in preparing for your CASPER is to get your team in place. Suggested staff include an epidemiologist, GIS specialist, and a volunteer coordinator. Once the team is formed, begin to schedule survey dates, preferably when the chance of inclement weather is low. Depending on the situation, this may occur days or months in advance of the survey. It is necessary to plan for volunteer training by developing or obtaining training materials. Using the Incident Command System One way to organize the survey team is to use the Incident Command Structure (ICS). ICS is a standardized incident management approach that is typically structured to facilitate activities in five major functional areas: Command, Operations, Planning, Logistics and Finance/Administration. Even with limited staff, the ICS structure can be used to conduct a community survey. One of the advantages of using ICS is that it is scalable and flexible. All of the functional areas do not have to be used depending on the scope of the survey. ICS is also extremely useful; not only does it provide an organizational structure for conducting a survey, but it also guides the process for planning the survey as well. We recommend that you use ICS for a CASPER to help hone, practice, and maintain skills needed for a potential disaster. Your agency might be able to use this opportunity as an exercise that can meet your agency’s disaster planning requirements. Implementing the survey Page | 14 Here are some examples on how it can be used when conducting a survey: Incident Commander would be team leader Public Information Officer send out communications about surveys to local papers, law enforcement, neighborhood associations Liaison Officer may report updates for overall CHA team or committee Safety Officer would provide safety training and monitor safety of those going out to conduct interviews Operations Section would perform the tasks needed to complete the survey, such as going out and conducting the interviews Planning Section may set the survey collection dates, anticipate resources that will be needed for data collection, determine interview teams, and prepare survey packets and maps. Logistics Section would provide the resources needed to complete the surveys, such as clipboards, pens, tablets, chargers, transportation, snacks, etc. Finance and Administration Section would provide administrative support to monitor and allocate staffing, volunteers, or money to complete the resources. They may also reimburse teams for travel expenses or track staff time. Above is an example of how the Texas Department of State Health Services organizes their teams for conducting CASPERs. This approach integrates into the ICS structure where the strike team leader Implementing the survey Page | 15 reports (either as a group or branch) to the Operations Section supervisor. Interview teams are added as needed. In some situations, there may not be enough people to fill Interview Team Lead roles, so teams might be reporting directly to the Strike Team Leader. Strike Team Leader is responsible for overall survey collection, organizing and directing the base station, and overseeing the tactical assignments given to the Strike Team. Assistant Strike Team Leader assists the Strike Team leader. GIS Specialist is responsible for random sampling process, creating and printing maps, assigning teams to clusters, and assigning equipment. Epidemiology Specialist is responsible for data collection, data analysis of survey results, and report writing Interview Team Leads are responsible for overseeing 5 interview teams of two people each (approximately 10 people) Interviewers are responsible for safely conducting household interviews within assigned clusters To learn more about how to organize your data collection team using the ICS structure, the Texas Department of State Health Services’ CASPER Strike Team created this pocket field guide. Other team members to consider for your survey team might be Information Technology (IT) staff to assist with any technical support, and if you are operating within a health department and environmental health staff that might have GIS expertise or are trained in interview methods for routine inspections. Lastly, if you are planning to conduct a survey in communities where residents speak other languages (such as Spanish) be sure to recruit team members who are bilingual. Now that your team is place you are ready to develop your questionnaire and select your sample. Let’s start with the questionnaire first. Questionnaire Design Well-developed questions on a thoughtfully designed questionnaire are critical to the success of collecting data and will allow programs to ask and answer questions about the health priorities of a community. Time spent during the questionnaire development phase will lead to higher data quality and easier data analysis. There are five components of designing a questionnaire: 1) Work with stakeholders to create questions addressing the topic of interest 2) Continue to prioritize and revise questions as necessary, with input from stakeholders 3) Keep the questionnaire to 50 questions or less, so that it can be completed in under 20 minutes 4) If necessary, have the finalized questionnaire translated into other languages 5) Pilot test the questionnaire and revise or edit as necessary Although there is often interest in many types of questions, focus on those that cannot be answered from other data sources. For example, for a community health needs assessment, you might consider including questions about community concerns, services needing improvement, health care access, and health behavior. A pre-disaster questionnaire may focus exclusively on emergency preparedness and special medical needs. In addition to the questions, the questionnaire should include opening and closing scripts, skip patterns, and appropriate transitions. Implementing the survey Page | 16 When adding new questions to your survey, try to use tested or validated questions when possible. First, the NC Division of Public Health’s Community Health Assessment Guidebook includes Community Health Opinion Survey templates in English and Spanish, as well as an Epi InfoTM template. There are additional resources out there, including the Behavioral Risk Factor Surveillance Survey (particularly their optional modules on specific topics) and the National Health Interview Survey that have questions that have been tested and validated. You can also conduct a PubMed search to see if there are questions that have already been tested. For example, your program may want to ask questions about health literacy. Instead of creating new, untested questions, identify studies that developed questions and survey instruments through a PubMed search. A key point in questionnaire design is to limit the number of questions to avoid survey fatigue and also to make analysis and interpretation of those results easier. Working with your community partners, it might be tempting to add all of the questions that interest each partner. However, you need to first ask before you add. Consider if the data are available through another source for that geographic area. For door-to-door surveys, the goal is to keep the survey length to about 15- 20 minutes. The average length of a survey within that time is about 40-60 questions total. Creating Questions The way questions are formatted and phrased, and the type of responses the questions solicit, impacts how respondents interpret and respond to the questions. You want all respondents to interpret a question the same way, and you want them to be able to easily answer the questions. If questions or response options are too long, complex, or difficult to interpret, you may not get the data that you need. Question design also impacts the type of data you will collect and how you will be able to analyze data. Formatting of the questionnaire itself can impact the design of an onscreen data entry form and/or analysis of variables in your software program. Questions should be specific and simple. For specific questions, avoid ambiguity in question wording. For example, if you ask “Did you ever have problems getting the health care you need?”, you could get a variety of responses – when the respondent was a child, when the respondent lived in another community, etc. A better way to ask the question is to be specific about the timeframe “In the past 12 months…” Try to write questions as simply as possible. The comprehension level should be appropriate for the community. Instead of asking if the respondent if they’ve ever been told by a health professional that they have “hypertension”, use the term “high blood pressure” instead. A question that is designed to be reliable will assure that the words are interpreted the same way in any setting, and that respondents answer the same way in any setting. To assure that your questions are reliable, avoid ambiguous terms or words that might be interpreted differently by different people. If you ask if the respondent has had a routine health check up in the past year, you may need to define what you mean by a “routine health check-up”. Does that include OB/GYN checkups? Or if you ask a respondent if they are caring for a friend or family member with a disability, define what you mean by “disability”. Closed-ended questions with pre-determined, categorical response options may provide more reliable responses than an open-ended question which can leave room for misinterpretation of the question. It’s also important to consider the answer choices for your questions. Limit lists to only what is necessary and analyzable. Consider how data will be analyzed to help determine what variables are Implementing the survey Page | 17 needed and thus, what questions should be included. If you are asking residents to list their 3 top concerns about the community and there are 20 possible answers, be sure to provide a laminated card of the choices so that the participant can look them over (which saves time from the interviewer reading them all out). Always offer to read the answer choices though since you should not assume the participant is literate. Here is an example that shows validity in the design of a particular question. By using this question, we are trying to determine where residents access health care most often. In response to the question, “Where do you go most often when sick?”, the first example gives options of clinic and hospital. At first glance, this may seem adequate, but if we think further there are a number of options that could be encompassed by the one response option of “clinic” – do they mean a doctor’s office, pharmacy, or community health clinic? In the second set of response options, which includes a doctor’s office, urgent care, community health center, pharmacy clinic, and emergency room, you will be able to gain a much more accurate measurement of where residents access health care most often. It’s also important in questionnaire design to ask only one question at a time. Instead of asking the respondent if they would evacuate in a large scale disaster and where they would go for shelter information all in one question, first ask if the respondent would or would not evacuate. Then if they indicated that they would evacuate, ask where they would turn to for shelter information. Implementing the survey Page | 18 For closed-ended questions, which are those that list response options, make sure that the response options are mutually exclusive. In other words, make sure that the response option categories don’t overlap. In the first example, the first list of answer options would be confusing for a respondent who was 34 years old, as this number is included in both of the options. The second set is better, as it is more clearly defined. All questions should have a response marked. Always provide an option for “don’t know” and “refused”. Mark “refused” if the respondent does not want to answer the question, mark “don’t know” if they don’t know the answer. This will also help you distinguish between missing data or nonresponses. Use the “other” choice to capture any responses that don’t fit in the choices and allow for a text entry to specify what other means. Keep in mind that allowing open-ended responses will add to data analysis time as you will have to attempt to categorize or group these responses to make sense of them. Limit the number of open-ended responses whenever possible. Questionnaire Layout The overall goal of good questionnaire format is to make questionnaire completion as straightforward as possible. Questionnaires should include detailed instructions, scripts, and definitions. To format a questionnaire that minimizes burden for the respondent and the interviewer, format the page layout with a vertical flow from question to question and from response option to response option. Here are some tips for questionnaire layout: Questions should be formatted in a logical order. It is best to group questions on related topics together. Place open-ended or sensitive questions towards the end of the survey, as these tend to be more taxing on the respondent. It is also important to build rapport with the respondent before asking sensitive or personal questions. Number every question and if there are skip patterns (“If the response is no, skip to question #...), be sure to use clear cues, either in text or with arrows, to guide respondents and interviewers. Response option codes should be consistent (e.g., responses to questions should either be labeled A, B, C, D or 1, 2, 3, 4; but do not use letters for one question and numbers for others). Always note the units for the response for each question, such as ‘select one’, ‘select all that apply’, and ‘choose up to 3’. Implementing the survey Page | 19 Finalizing the Questionnaire After the initial questions have been developed, meet with stakeholders to prioritize and revise the questionnaire as necessary. This is critical to ensure that stakeholders are invested in the project and have their key questions addressed in the survey. Depending on the area being surveyed, it may also be necessary to have the questionnaire translated in to other languages. Lastly, it’s very important to pilot your questionnaire before finalizing the survey. Test out your survey questions with staff to make sure it flows and makes sense and to also determine how long the survey takes. Remember your goal should be to make the interview less than 20 minutes. Ideally, the interview should only take 10-15 minutes to avoid survey fatigue. If the interview takes longer than that you risk respondents losing interest and not fully paying attention to your questions. This can lead to lower quality data and can possibly introduce bias into your results. Respondents may also feel like they have answered enough of your questions and want to end the interview prematurely, which results in missing data. Below are important elements for you to evaluate as you pilot test the questionnaire: Creating forms in CDC’s Epi Info TM 7 If you are using Epi InfoTM, you can create a new questionnaire from the main Epi InfoTM menu. Select Create Forms or select ToolsCreate Forms. Implementing the survey Page | 20 1) The form designer window will open You can select FileNew Project to create a new project name 2) Tab to, or select, the Form Name field (only use letters and numbers, no spaces- don’t start a form name with a number) 3) To create fields, right click on the workspace to open the Field Definition dialog box or drag the field type from the list of options on the left 4) The canvas for the form you are creating will be displayed in the in the Form Designer window 5) With the form loaded right-click on the canvas, a pop-up menu will appear 6) Move the mouse over the New Field option 7) The list of field types that you can add to your form will appear. Select a Field or Variable Type from the list (i.e., Text) 8) Then you type in the Question or Prompt for the field. Click OK. The field is created and displayed on the canvas 9) To add fields, simply select the type of field you want to add, give it a prompt, and the step is complete The steps above outlined how to create a text field. Other field types are also available, including number fields (which restrict the user to entering just valid numbers), date fields, checkboxes, and drop-down lists. You can also create code books in Epi InfoTM. For more guidance on how to create questionnaires in Epi InfoTM, see the Epi InfoTM User Guide from the CDC’s website or watch the demonstration videos below. Demonstration Videos Epi InfoTM 7: Create Forms, Part 1 (9 minutes) Epi InfoTM 7: Create Forms, Part 2 (11 minutes) Implementing the survey Page | 21 ACTIVITY 2.1: DEVELOPING A QUESTIONNAIRE Time: 10 minutes Instructions: You are working with the local hospital and other community partners to design a questionnaire for a community health assessment. One of the partners would like to add a question about diabetes since there currently is no local data providing prevalence for adults. Answer the following questions. Additional Resource: CDC BRFSS Questionnaires website: http://www.cdc.gov/brfss/questionnaires/index.htm 1. What is a potential question that has already been validated that would assess adult diabetes prevalence? 2. One of your partners came up with their own question to assess diabetes. What is wrong with the following question? Has a health professional EVER told you that you had diabetes and did not refer you to nutritional counseling? Yes No Implementing the survey Page | 22 ACTIVITY 2.1: DEVELOPING A QUESTIONNAIRE ANSWER KEY 1. Has a doctor, nurse, or other health professional EVER told you that you had diabetes? Yes Yes, but female told only during pregnancy No No, pre-diabetes or borderline diabetes Don’t know/Not sure Refused Source: 2014 BRFSS survey 2. The question is actually asking 2 questions. Also, the responses should include an option for “don’t know” and “refused”. Implementing the survey Page | 23 Survey Site Selection Collect SMART uses CASPER’s two stage cluster sample method. This sampling method is preferred as an alternative to simple random sampling and convenience sampling. By staging your selection in two steps, first by specific geographic areas, you can reduce travel and administrative costs by working in clusters versus random points spread out all over the your entire sample frame. To achieve similar results in a convenience sample, such as at a health fair or other central location like a shopping center, would necessitate the collection of at least twice as many surveys and it still would not guarantee that the sample could be generalizable to the entire county. More participants do not always lead to better survey results. In North Carolina, the two-stage cluster method is an accepted sampling strategy for conducting surveys for Community Health Assessments. For additional information, see A Guide to Sampling for Community Health Assessments and Other Projects and Two-Stage Cluster Sampling: General Guidance for Use in Public Health Assessments. In Stage 1, you randomly select 30 census blocks with a probability proportional to size within the sample frame. Size is typically the number of housing units or the number of occupied housing units within the cluster. Then for Stage 2, you randomly select 7 households within each cluster to conduct an interview at. The ‘gold standard’ would be to return to that randomly selected household as many times as it takes until the interview is completed or refused. However, this approach can be very expensive and time consuming and it is known that some replacement of selected households will have to occur in order to complete the data collection in a timely manner. If no one is home at the randomly selected household or the respondent refusing to be interviewed, then teams should be instructed to find the next closet house until they get an interview. The total sample size for this 30 by 7 cluster sample is 210 households. The 30 by 7 sample is most common, but other sizes are also an option. For rural areas where many of the clusters have less than 10 households each, you might consider conducting a 40/5 sample. That would mean selecting 40 clusters and then 5 interviews per cluster. Although you are interviewing 10 fewer residents you are actually conducting a more representative survey since you are visiting more clusters. The 30/7 or 40/5 method of sampling around 200 households is adequate for getting results within +/10% margin of error with 95% confidence. For example, the estimated prevalence of current smokers is 16%. If the margin of error is +/- 10%, your survey would predict that the true result lies within 6% and 26%. Another example with which you may be familiar: most political polls mentioned in the news refer to a margin of error -- “60% of voters said yes to Proposition Z, with a margin of error of +/- 5%”. Implementing the survey Page | 24 If a data point is also given a confidence interval (often 95%), it means that if we repeated the sampling and interview process 100 times, 95% of the time, the “true” value would fall within that plus or minus 10% range. Remember, in any sampling situation, each sample will produce only an estimate of the value of interest. 95% Confidence interval is a range above and below the observed estimate, where we would expect the “true” estimate to be 95% of the time, since the observation is influenced by random error. While results obtained through this two-stage cluster sampling can be generalizable to the sample frame level (e.g. the county as a whole), results CANNOT be broken down with this same precision into race, ethnic, gender or income categories. If you want to gather more information about a particular sub-population, consider conducting a focus group or key informant interview (e.g., homeless, Hispanic, certain geographic areas). Sampling Frame Before you address Stages 1 or 2, you must first determine the sampling frame for your CASPER, which is the largest “boundary” of the population that will be included in your assessment. Consider the community that you are studying for your assessment. Is it currently defined as a city, county, or service area? The purpose of conducting a survey is to describe key characteristics of the population under study. To derive an accurate estimate, the survey sample must be representative of the overall population. If the community being assessed is very large or dispersed over a large area, the survey sample should be taken from as wide an area as is practical and not restricted to a small sub-area, which may not be typical of the population as a whole. Moreover, surveys should avoid sampling only the most accessible members of the affected population. For example, try not to over-sample households along roads, near markets or in the center of town. The decision about which areas to survey depends on a number of other factors including: Number of survey team staff or volunteers available Amount of time and the funds available for the survey Availability of transportation options (are survey staff or volunteers able to use personal or work vehicles to reach the survey areas?) The sampling frame for health departments is typically the county or, if you are part of a regional health department, multiple counties. If you are conducting an assessment in multiple counties you could conduct one sample in each county or you could conduct one assessment for the entire region. The CDC recommends that a sampling frame should include at least 800 housing units. If there are fewer housing units, consider conducting a full census or another sampling methodology such as a simple random sample. Below is an example of an assessment for a regional health district in Northeastern North Carolina that included 7 counties. The sample size calculator at openEpi.com was used to determine that 80 surveys per county would be sufficient to assess the needs of the population. Interviews were conducted with 4 residents in each of 20 clusters selected in each county for a total of 560 interviews. Implementing the survey Page | 25 A sampling frame can also be defined by geographic boundaries (e.g., houses in a specific direction from a landmark, such as a road or a river), or by use of a subpopulation (e.g., the Hispanic or Latino population in your community). The map below shows how a 100 and 500-year floodplain, shown in dark and light blue, was used to delineate a sampling frame. Since the assessment was most concerned with areas likely to have flood damage, sampling was restricted to clusters where at least 50% of the area was within a flood prone region. Remember that if you choose to draw a sample from a sub-population, you can only generalize your results to that entire sub-population if every member of the sub-population has a chance of being selected. For example, if you wanted to conduct a survey with only the Hispanic or Latino population you could draw your sample from only census blocks where at least 50% of the population identified themselves as Hispanic in the last census. This can be a more efficient way to reach this population than a convenience sample but keep in mind that you CANNOT generalize the results to ALL Hispanics and Latinos since your sampling frame was limited to a smaller set of census blocks. However, CASPER sampling can still be used to assess the needs of sub-populations so long as you understand how to interpret your results. Implementing the survey Page | 26 If the CASPER is being conducted a part of a Community Health Needs Assessment, it is important to note that according to the Affordable Care Act, the Treasury and IRS expect non-profit hospitals to assess communities defined by a geographic location or service area (e.g., a particular city, county, or metropolitan region). However, in some cases, the definition of a hospital facility’s community may also take into account target populations served (e.g., children, women, or the aged) and/or the hospital facility’s principal functions (e.g., focus on a particular specialty area or targeted disease). More information can be found at the IRS website. Primary Sampling Units Once you have selected your sampling frame, you will need to determine your primary sampling unit (PSU): the cluster. Cluster sampling can be conducted with any number of geographic delineations so long as they don’t overlap (i.e. are “mutually exclusive”). Ideally these clusters are also geographically exhaustive, meaning that they cover the entire area within your sampling frame. The ideal data set for cluster sampling is U.S. Census Data since it is exclusive and exhaustive. Another advantage of the census data is that it is nested at different sizes. This means you could use Census Tracts, Census Block Groups, or Census Blocks. Census Tracts can have anywhere from 1,500 to 8,000 people in them and the optimum size is 4,000. Block groups can have anywhere from 600 to 3,000 people. Blocks are the smallest geographical unit used by the U.S. Census Bureau. On average, there are about 39 blocks per block group. Below is an example of 30 clusters, determined by Census Blocks, within a North Carolina County. If you decide to use U.S. Census Data, it is recommend that your PSU be either the block or block group. As you consider the choices, think about the following factors: Implementing the survey Page | 27 The CDC recommends the use of blocks but this is often problematic in areas where there are lots of blocks with fewer than 10 households. The main advantage of using blocks is that they are small and easy to navigate. You can often park your car in one area and walk the entire block. If your sample frame contains over 60 block groups you might consider using these as your sampling unit, particularly if you find that the majority of the blocks have fewer than 10 households. Block Groups typically contain between 600 and 3,000 people so there will be no shortage of eligible participants. Selecting the Clusters – Stage 1 Now that your sample frame is defined you are ready to draw the survey sample. There are three methods for selecting your clusters: 1) selecting by hand using a spreadsheet, 2) using Geographic Information Systems (GIS) software or 3) using Collect SMART’s website. If you are using your own GIS software you can find pre-joined demographic data via TIGER/Line Shapefiles or geodatabases. Keep in mind that block data (spatial and demographic) is only updated every 10 years so the most up-to-date census block data is from the 2010 Census. Block group data is now updated as part of the American Community Survey on a yearly basis and is reported as a 3-5 year average. Both blocks and block groups are now available from TIGER/line pre-joined with demographic data. If you want to sample by hand you can download the tabular data from the US Census Bureau’s American Fact Finder. Selecting by Hand You can create a population-weighted two-stage cluster sample with Microsoft Excel or spreadsheet software. The goal is to randomly select a sample of clusters using a probability proportional to the estimated number of housing units or total population in each cluster. This is what is commonly referred to as PPS sampling, probability-proportional-to-size. Most commonly, a two-stage cluster sample selects 30 clusters in the first stage and 7 interview locations in the second stage. After you have downloaded the demographic data for your sampling frame, the first step is to sort or rank your clusters from lowest to highest (largest to smallest) according to the number of housing units or total population. Next, create a new column titled “Cumulative housing units” and sum the housing units. For example if your first cluster has 10 households, the cumulative housing unit would be 10. Then add that 10 to the total from the next cluster. If Cluster #2 had 13 households then the Cumulative housing unit for Cluster 2 would be 23, and so on. Implementing the survey Page | 28 Next, determine the total number of housing units in your sampling frame. In the example presented below, it is assumed that you are conducting a 30 by 7 sample. The next step is to generate 30 random numbers between 1 and the total sum of housing units. You can use a random number generator within your spreadsheet software or one online such as http://www.random.org/integers/. Finally, match up the random numbers to the Clusters using the Cumulative # of housing units. Below is an example to clarify the process: In this example, the column HU_CUM signifies our cumulative housing unit total and HU_CUM Range shows the range. The first row in red shows the selected cluster based on the first random number of 84. Cluster 8 is selected because 84 is within the cumulative housing units range of 75-86. The next random number is 102. Cluster 10 would be selected since 102 is in the range 99-110. Repeat this procedure until you have all 30 clusters and then renumber the clusters from 1-30. It is possible that some clusters will be selected more than once. If a cluster is selected twice then you will need to collect twice as many surveys in that cluster. Selecting sample using GIS If you are using ESRI’s then you have a couple options to automate your sample selection. A toolbar that is compatible with ArcGIS 9.x is available upon direct request. This toolbar was created by the North Carolina Public Health Regional Surveillance Team 5 (also called PHRST 5), the NC division of Public Health’s office of Public Health Preparedness and Response and the Department of Agriculture. This work was envisioned and guided by Dr Mark Smith, Guilford County Health Department, and was partially funded by an ESRI industry Homeland Security grant back in 2002. This is an ArcGIS toolbar that runs in ArcMap 9.x and below. It is NOT compatible with ArcMap 10.x. The toolbar performs 3 primary functions including: 1. Automates the procedure of selecting both the first-stage and second-stage samples, including reverse geocoding points, 2. Assigning survey sites to multiple survey teams 3. Generation of routes to be uploaded to ArcPad using networking algorithms Implementing the survey Page | 29 If you are using ArcGIS 10.1 or 10.2, the CDC has a toolbox which is available as well. This toobox automates sample selection in the first stage. It is available upon direct request from the CDC’s CASPER group. Selecting using Collect SMART If you would like to generate a sample using Collect SMART, you must first sign up for a free account. Then choose “Create” from the Home Page. You have two options for using Collect SMART shown below. You can use the selection algorithm built into the platform that randomly selects blocks or block groups using the most current U.S. Census data or you can supply your own spatial data. First we’ll describe the process of using Collect SMART to select your sample. From the home page select “new project” and the page that says “Welcome to Collect SMART” choose new project again. Before proceeding with the sample selection you should have your questionnaire designed in Epi InfoTM and exported as an .xml, ready for upload to Collect SMART. On the new project page (see figure below) you should complete the following: (1)Assign your project a name and (2) survey date, (3,4) define your sampling frame by choosing your state then choose either one county or multiple counties or zip codes, (5) choose the number of clusters you would like to select (6) choose whether Implementing the survey Page | 30 to use blocks or block groups, (7) establish a threshold for the minimum number of housing units for a cluster to be included in the sampling frame. Finally choose (8) generate clusters to pull your sample. Keep in mind that if you exclude clusters you are limiting the generalizability of your sample. This needs to be balanced against your ability to collect enough interviews for a valid sample (typically 80% of total selected). In practice, it is often difficult to conduct enough interviews in blocks with fewer than 10 housing units. Your other option for using Collect SMART is to supply your own spatial data. From the first New Project window choose Use this option if you have used a GIS site selection tool to create your sample. Similar to the example above, you will need to supply a survey name and specify the state and date. Then choose your cluster, point and questionnaire file. The spatial data has to be a .kml with the fields specified on the webpage. Click the link to download an example to get started. Collect SMART requires that the ‘Survey Name’ be in each of the files that you upload and the cluster, point and questionnaire file be named in a specific manner. For example, if you were conducting a survey in Gaston County in 2015 you might enter “Gaston_2015” for the survey name. Then the cluster name would need to be named “clusters_Gaston_2015”, your points need to be names “points_Gaston_2015” and the questionnaire should be named “survey_Gaston_2015.” Implementing the survey Page | 31 Selecting Survey Sites – Stage 2 Once you have completed the first stage of the sample selection, you can move onto selecting the survey sites. Choose a fixed number, k, of housing units per cluster to approach; the most common approach is to select 7 housing units per cluster. The magic number for cluster sampling is 210; 30 clusters and 7 interviews per cluster. There are several methods for selecting survey sites. Choosing the method that is appropriate for your situation will largely depend on your available resources. It is important to remember that survey sites Implementing the survey Page | 32 should be random in all three options. The first option is a simple random sample. The second option is called the EPI method and requires the least amount of planning. The third option is recommended by the CDC and is called systematic random sampling. Option 4 requires random waypoints to be generated ahead of time. Option 1: Simple Random Sample (SRS) To use this method, you must have a census of your area or a complete list of housing units within the cluster. From this list you then randomly select seven housing units to conduct interviews. Alternately you could choose one random house to begin with and then visit every nth housing unit (e.g., house 1, 5, 10, 15). According to the CDC’s CASPER Toolkit, while this method does ensure that each household has an equal chance of being selected and is least likely produce a sample with bias, it may be less feasible and inefficient due to the difficulty of training volunteers and the time needed to count all housing units in a selected cluster. SOURCE: CDC CASPER TOOLKIT, FIRST EDITION Option 2: EPI Method When a census of your cluster is not available, one method you can use to make sure you are surveying a representative sample of the affected population is to: First, go to the center of the selected cluster selected in Stage 1. Then, randomly choose a direction by spinning a bottle, pencil, or pen on the ground and note the direction in which it is pointed when it stops. Finally, walk in the direction indicated by the object and select the first house closest to the point where you are standing. Proceed in that direction until you have completed 7 interviews of occupied households. This is called the EPI-Method and is the easiest to implement if the center of the cluster can be readily located. SOURCE: CDC CASPER TOOLKIT, FIRST EDITION Implementing the survey Page | 33 Option 3: Systematic Random Sampling Another option is systematic random sampling. According to the CDC’s CASPER Toolkit, this method involves selecting a random starting point by using a detailed map upon arriving at a given cluster, such as the one below: SOURCE: CDC CASPER TOOLKIT, SECOND EDITION A printed map can be used to count or estimate the number of housing units within the cluster. That total can be divided by 7, which will be the N that can be used starting at the house nearest the randomly selected starting point to consistently count every Nth house. Interviews should be conducted until every Nth house is complete. Option 4: Random Start Points The fourth option will likely produce a sample with the least amount of bias as it requires less surveyor training and reduces the chances of surveyor error implementing the above methods. In this method you must generate seven random points using mapping software. It is recommended that staff with knowledge of geographic information systems (GIS) perform this task. To increase the likelihood of success using this method, consider accessing local address point data, center line data or tax parcel data from the local GIS office. This data is often much more accurate than national address databases and contain attribute information such as residence type that you can use to identify residential addresses only. Assign an address to the points (reverse geocoding) and instruct surveyors to use these points as ‘random start sites.’ If no one is home at the point or the respondent refuses to be interviewed, surveyors should knock on the door of the next closet house until an interview is conducted. Once an interview is completed, move onto to the next random start site. If resources allow, this is the preferred method for implementing the second stage of the sample. Implementing the survey Page | 34 Now that you have your team, your questionnaire is designed and you now where you are going to conduct interviews it’s time to recruit surveyors. Recruiting Volunteers For a typical two-stage 30/7 sample (210 interviews), plan for 10 teams of two to work over 3 full days; you will need at least 20 volunteers or staff each day. Typically, teams can complete 5-14 interviews per day. This can vary depending on your survey instrument, the distance teams have to travel, as well as surveyor experience, competency and confidence. The ideal time to be in the field is Thursday through Saturday from 10am until dinnertime (before dark). For safety reasons, it is recommended that 2 people should be assigned to each interview team so that no one is ever sent out to conduct interviews alone. The best candidates would be those with prior experience with door-to-door activities, such as political canvassers, fundraisers, nurses who make home-visits. You are looking for individuals who easily find rapport with clients, patients, or community members. Participants that are familiar to the community can be a benefit. Outgoing, friendly people with stamina and a tolerance for rejection can nicely balance younger individuals with the technical savvy to interpret maps and work with mobile technology. Epidemiologists, nurses, environmental health, and administrative staff at your local health department can be a great place to start recruitment efforts. Also consider students in nursing, medical, or public health programs at local colleges or universities who often take courses in community health. Many of these programs require students to complete practicum projects working with communities. Don’t overlook the importance of recruiting volunteers from among agency partners and members of your Community Health Needs Assessment committee. Past surveys have included volunteers from hospitals, Federally Qualified Health Care Centers, medical society, United Way agencies, and nonprofit or community agencies (such as American Red Cross, local Latino advocacy organizations, and Hospice). Other volunteers to consider are those registered with the local Medical Reserve Corps, staff in your local county’s emergency services, and medical ministries or nurse parish programs from local faith-based organizations. Implementing the survey Page | 35 It is strongly recommended that you start recruiting early in the process. Set a date for your survey 1-2 months in advance and then immediately start recruiting volunteers. Recruitment materials should include an explanation of the purpose of the survey, the dates and times of the survey, training location, and what to bring (snacks, water, comfortable shoes and photo ID). As you collect volunteer information, be sure to include agency/community affiliation, cell numbers, dates of participation (encourage full participation rather than partial days), whether or not the volunteer can drive a personal vehicle, possible language skills (such as Spanish), and any dietary restrictions if you are providing food. Another strategy is to designate 10 team leaders and have the team leader be responsible for finding their partner for the 3 to 4 days of surveying. You may find that providing volunteers with some incentives and recognition will go a long way toward encouraging their participation. Incentives could include providing breakfast or lunch for at the start of each day. Since volunteers will be out conducting surveys from 10 a.m. to as late at 7:00 p.m., a to-go lunch should be provided at a minimum. Most often, volunteers eat their lunch in their car or out in the field, so keep that in mind when considering lunch vendors. Ask a local restaurant (sandwich shop, deli, or diner) if they would consider donating gift cards to participants. You can also ask local businesses to consider donating gift cards to volunteers. If county vehicles are not available for use, volunteer teams will have to use their personal vehicles, so consider a plan to reimburse them for mileage or provide gas cards. Lastly, it’s also important to find a way to recognize the survey volunteers. Include survey teams in the acknowledgements section of the survey report or presentation, take a team photo to share in the report or agency website, and provide volunteers with a certificate of acknowledgement. Training Volunteers To ensure data quality and safety of teams, it is important to conduct a 2-3 hour mandatory training for anyone who will be helping conduct the survey. Even though the survey will likely being conducted on a fast timeline, interviewer training is not an optional step that can be skipped for the sake of time. A lack of training may lead to lower quality data, which in turn may lead to data that is not useful for planning efforts, particular as it pertains to Community Health Assessments. Also, lack of training on how to use the survey equipment (tablet/GPS units) or the survey instrument can lead to missing data or data that was completed incorrectly. No one can control all the factors influencing community data collection, but a good interviewer training process will help start things out on the right foot. Training sessions can be hosted the day before or morning of the first day of surveying. This training should ideally cover the following topics (see link for interviewer training template): The purpose of the survey A brief review of the sampling method so interviewers know how houses were selected How to use the questionnaire including the intent and meaning of each question and how to record responses; and ways to address respondents’ questions Methods for improving the response rate How to track completed surveys Confidentiality Safety Implementing the survey Training Template (pptx): Interviewer Training Page | 36 Materials/equipment needed for training: AV: laptop and projector. If possible, it would help to have a software on your laptop (e.g., http://droid-at-screen.org/) that enables you to share your tablet screen so you can demonstrate and project Collect SMART for the trainees Training packets: for each interviewer, provide at a minimum: – Agenda – Team Safety Checklist – Copy of training slides – Questionnaire (in color to show probes and instructions) – Sample Tracking Form Mobile devices/tablets with Collect SMART software installed (for allowing interviewers to practice using technology) Sign-in sheet to track who attended the training Training evaluation (if applicable) The overall goal is to train the interviewer to overcome unwillingness and increase receptiveness among participants in the field. What one does or says as an interviewer can make or break a survey. Below are the various factors that are involved in motivating someone to participate in an interview. Source: Kahn RL, & Cannel CF. (1968). Interviewing. In Sills DL (ed.), International encyclopedia of the social sciences, (8:153). New York, NY: Crowell Collier and Macmillan. Interviewing someone in person requires careful attention on the part of the interviewer. Here are some tips that can be covered during a training session that can help improve response rates and open doors: Dress appropriately. Business casual or professional and neutral. Wear comfortable clothing and shoes. Always wear an identification badge. Refrain from eating, drinking, or chewing gum during an interview and remove sunglasses. Be neutral, yet attentive. Face the participant at a comfortable distance and maintain appropriate eye contact. Be accepting of the participant. Do not express any judgment of the participant through your body language, tone, or facial expression. Concentrate on what the participant is saying. Do not let your mind wander or interrupt the participant. Try to not show a reaction if the respondent says something unexpected. Implementing the survey Page | 37 The Introduction When training interviewers on the introduction, the first thing interviewers should do when approaching a resident is immediately identify yourself and affiliation. Remind interviewers to make eye contact and smile, and avoid reading from a script. Also have interviewers practice their introduction using these tips: Introductions should be brief. Interviewers should state the purpose of the survey and tell how the information will be used. It is important to state that information will be compiled with other responses from throughout the survey area, and that their identity will remain anonymous. Terms to avoid are research, study, and survey. The introduction should also define what is expected of the participant. For example, that participants can skip any questions they want and that participation is voluntary and will greatly help your organization understand what health concerns it should focus on and work to improve. It is encouraged that interviewers be empathetic. This is often easier said than done, but let interviewers know that with this point and all the others made thus far, with practice and experience they will improve. Below is an example of an appropriate introduction that an interviewer could use: “Hello, My name is Matt and this is Kristen. We are working/volunteering with the Chatham County Health Department talking to people/folks/residents in your neighborhood about community health issues. Do you have some time to speak with us today?” If the resident seems hesitant, the following assurances could be offered: “Your answers are anonymous and will be kept completely confidential. We will not record your name and your participation is voluntary. We are asking for resident’s opinions on a variety of public health issues and we will use this information to better inform the health department strategies for providing services to the community.” After the introduction, if the resident is willing to do the interview, interviewers should go ahead and conduct the interview (ideally outside of the home, but they should trust their best judgment). If the resident is firm they do not want to do the interview, they should be thanked or their time and the interviewers should discreetly record their address on the tracking form so they do not get bothered again. However, it is also important to train interviewers that they shouldn’t take “no” for an answer right away. Some residents might say no but really just need a little bit of encouragement. Interviewers should remind residents of the value of their perspective and input. If the resident refuses twice, the interviewers should move on to the next site. It is important not to coerce participation. The Interview When training interviewers on the questionnaire, be sure that they follow these guidelines: 1. Ask the questions properly: Don’t put the questions into your own words or skip words 2. Ask questions in the order presented: The questions are ordered in a particular way and often involve skip logic 3. Ask every question that is specified: Don’t skip around or skip questions entirely 4. Record the responses accurately: If you have to read a list of responses, read them all Implementing the survey Page | 38 During the training, have interviewers work in pairs and practice conducting the survey to each other using a copy of the questionnaire. Below are some suggestions for common interview techniques that can help make the interview run smoothly and capture the best quality data. Pause: After reading the question, pause briefly to wait for a response. Don’t rush to help them find an answer. Be patient and allow the individual a moment to consider. If you sense confusion, you may offer to repeat the question. If you are asked to repeat the question, please do so. Clarify: If appropriate, you may clarify the question. This can get tricky because this is where you might influence the response by putting your own spin on the question. This is considered surveyor bias. The best course of action is to repeat the question and offer clarification sparingly. However, clarification can be important when the participant does not understand the question. You may need to clarify what “sick” means or what constitutes an “emergency”. In these cases, be careful to simplify the question using neutral words that do not influence the participant’s answer. Practice active listening: Practice active listening by looking for non-verbal cues. For instance, if someone shakes or nods their head rather than saying “Yes” or “No” you will need to repeat the participants reply verbally to confirm their answer. This is especially important if the respondent offered a response that you didn’t quite understand or didn’t quite fit one of your categories. For example, a question asks the respondent to pick a choice on a scale of strongly agree to strongly disagree. A common response might be “Yeah, I think so” to which you should reply, “So would that be a Strongly Agree or Agree, ma’am?” Maintain neutrality: It is important to stress that interviewers maintain neutrality and avoid leading questions. A good example of this might be a question that asks whether or not a respondent smokes. A leading way to ask this question would be “You don’t smoke, do you?” This phrasing is giving the respondent the answer that you are expecting: “No, I don’t smoke.” This is another reason why it is important to ask the questions exactly as they are worded. Maintain pace: Interviewers will need to maintain an efficient pace in the field. Interview teams will get to meet all types of people going door-to-door. Some people will be impatient and want you to rush. Some people might want you off their porch as soon as possible and be in a hurry. Try to keep a steady pace but don’t skip over questions or paraphrase. Some people might be slow to respond to a question. If they are really struggling with comprehending a question and are still struggling to answer a question after further clarification, offer to move on and record their response to that question as “don’t know” or “No response/Refused to answer.” You might also find that respondents will get distracted and want to tell you a story they think is somewhat related to a question. Be polite and hear them out. However, if this happens repeatedly you will need to gently guide them back to the survey. “Sir, I don’t want to take up anymore of your time than necessary today. If it’s ok with you I would like to ask you the next question on...” Or if they still offer up stories you can say, “I am sorry but I have to ask you this next question so I can get back out there and talk to your neighbors about their concerns, too.” Avoid grilling participants: f respondents falter or are slow to respond, offer to move on. Do not cross-examine or “grill” the participant. Remember this is an opinion survey and there are no right answers. This isn’t a test of the respondent’s knowledge. If they keep saying “oh, I don’t know” remind them that there are no right answers and we just want their opinion. However, don’t press them for an answer if they don’t want to give you one. Implementing the survey Page | 39 Probing A common practice in interviewing is to probe a respondent for additional information. It is important to recognize that probing should also be done in a standardized way so not to influence the response. A probe is generally used when a respondent’s answer is unclear or irrelevant. When training interviewers, be sure to cover how to probe. The best probe is simply to repeat the question; it is a neutral method that an interviewer can consistently rely on. There are other neutral phrases that can be used, such as: What do you mean? How do you mean? Which would be closer? If you had to choose one, which would you pick? In the example above, the correct probe reiterates every possible response category. It allows the respondent a bit more time to consider the timeframe, rather than assuming the respondent’s frame of reference. By narrowing down the answers for the respondent, the interviewer is leading to a response. Feedback Another important area to train interviewers on to maintain rapport with the respondent is providing feedback during the interview. Inexperienced interviewers may use feedback inappropriately. Interviewers should give feedback only for acceptable performance, not “good" content. For example, if the respondent is answering questions about smoking and tells the interviewer that he quit Implementing the survey Page | 40 a few months ago, the interviewer may be tempted to provide a bit of encouragement. That is exactly what should be avoided. Examples of appropriate feedback include: I see… Uh-huh Thank you That is useful information That is helpful to know That is useful for our research Let me get that down I want to make sure I have that right (and repeat the answer given), and We have touched on this before, but I need to ask every question in the order that it appears in the questionnaire Finishing the Interview Lastly, it is important to train interviewers to maintain confidentiality throughout the process. Participants should be reminded that interviewers are not collecting identifying information (names, etc.). All survey information will be compiled with other responses from throughout the survey area, and their identity will remain anonymous. During the training, stress that the interviewer should never give out details about the participant’s home or what was said in the interview. Once the interview is complete, interviewers should thank participants and give them a thank you gift for their participation. Past gifts that have been effective incentives for participation include first aid kits, water bottles and reusable shopping bags. This is also an opportunity for participants to receive any informational handouts about the agency conducting the survey, services, or the assessment project without overwhelming them with paper. If the respondent wants more information about the survey, an interviewer should have a telephone number for him / her to call. Using the Mobile Application Interviewees will also need to be trained on the Collect SMART mobile application, including how to open the app, finding their cluster, opening a point, entering data, and sending sync files to the Collect SMART cloud space. See page 54 for instructions. It is recommended that you demonstrate the features of the app using screen mirroring software first before you hand out the equipment so that you have the full attention of the interviewers. Then hand out the tablets or smartphones and be sure to allow sufficient time for interviewers to become comfortable with the technology before sending them off in the field. Team Management When you are considering pairing up your staff or volunteers into 10 teams, ideally the teams will represent a mix of individuals based on gender, race/ethnicity, age, students vs. professionals, and locals with non-locals (out-of-town volunteers or state personnel). Also consider teaming folks up based on skill and experience. Ideally, have at least one person on the team who would feel comfortable interviewing strangers. Also make sure that team members feel comfortable with the technology and data collection methods before sending them off. These considerations are for safety and to evenly distribute local knowledge and field experience. Throughout the team pairing Implementing the survey Page | 41 process, remember to be flexible and allow for last-minute changes to teams. Appendix B is an example of how of a team assignment list. When managing teams, be sure to collect information such as team number, names, cell phone numbers, times checked out and in, equipment (whether checked out/in), the number of surveys completed each day, and notes on troubleshooting for team (if there were issues with getting to survey sites, with the equipment, etc.). This information can be tracked in a Word document (Appendix C as an example), or easily in a spreadsheet. Field Safety The safety of team members is the top priority, not completing the surveys and collecting the data. Communication with law enforcement and community partners is key in informing residents about the survey and what to expect, which will ultimately increase team safety. It is imperative that team members follow safety guidelines. Remind team members to use good judgment and common sense when it comes to ensuring their personal safety. Communication At least 1 week before the surveying is scheduled to begin, work with agency communication staff to alert residents that surveyors will be in their neighborhood. Communications can start with issuing a press release and subsequent media interviews about the data collection project, survey, and what residents can expect. Include a 1-page information flyer about the survey process that survey teams can take with them if residents have questions. Notification should also be sent through project partners and their networks to let folks know about the survey, as well as calling local law enforcement and neighborhood associations so that the surveyors will be anticipated. You can also provide these partners a copy of your informational flyer. If additional funds and staffing are available, you can also mail letters or postcards about the survey to the census blocks that are selected for the sample. An example press release is included in Appendix D and information flyer in Appendix E. Base Station When setting up the survey base station, consider having training and staging efforts in one central location. This would need to be a room that is large enough to accommodate training and base station materials, including audio/visual equipment available for training, and adequate and easily accessible parking for survey team staff or volunteers. Examples of base station venues include the health department, community centers, hotels, and libraries. Operations and technical assistance, usually provided by the strike team leader, GIS specialist, or epidemiology specialist should always be available for the survey team through the base station. Keep that in mind when booking a room, the space will be needed not just for the training but to staff the base station operations and technical staff during the entirety of the survey. This example of a base station layout was prepared by the Community Preparedness Section of the Texas Department of State Health Services who routinely implement CASPERs after disasters using the ICS structure (Appendix F). Implementing the survey Page | 42 Equipment Safety equipment includes vests or agency t-shirts to maximize visibility in the field, and every team member should wear identification badges with at least the agency logo and name. Official county or employee ID badges can work, too. Surveyors should also carry their driver’s license. If two-way radios are available, consider using them as part of a preparedness exercise. Cell phones are also sufficient in most areas, but expect that some teams will be in areas with little or no coverage at times. Texting could possibly be available in areas with low coverage, but not guaranteed. At a minimum, interviewer teams should contact base station after they complete the first interview and on their way back to the base station after the final survey for that day is complete. Remind team members to check their cell phone (or radio) often. Base station staff may try to contact teams and leave messages as necessary. Ensure that the interviewers’ equipment (especially the GPS unit/tablet) is kept secure and in their possession at all times. Interviewers should avoid leaving equipment in the car or on the dashboard when taking lunch or breaks. Since personal data is being collected, it is very important that the GPS unit/tablet is locked when not in use or, if paper surveys are being used, that the survey copies are in the interviewers’ possession at all times. If interviewers recognize houses or persons being interviewed, remind them to maintain the confidentiality of responses and not share any information. Personal Safety The following are personal safety tips that can be used while training interviewers: In remote areas, be aware that public restrooms may not be nearby. Never use the restroom in a residence, but instead use restrooms in town areas or a public place (such as a gas station or fast food establishment). When approaching a home, wait and observe the area before getting out of the car. Look at what’s going on and be aware of the surroundings. If there is a bad feeling, leave. When approaching doors, be sure to maintain a comfortable distance. First, knock and then step back. After you try 2 or 3 times knocking and using the doorbell, it’s time to move on. Regarding gates, screened porches or homes with side or back doors, use your judgment. If there is a gate, check for signs of dogs before entering. You probably shouldn’t assume you are welcome at someone’s back door so be courteous and always approach the front door. Be aware of dogs, cats, and other animals, even if they seem friendly. Avoid petting or picking up pets. Even if you are a “dog person”, everyone should be cautious about dogs. If at all possible, complete the interview outside of the home. Note that if an elderly or disabled resident comes to the door, it might be difficult or uncomfortable for them to stand at the door 10-15 minutes. Offer to sit on their porch. If they invite you in, use your best judgment. It would be good to come up with a code word or sign ahead of time to share with your interview partner for these situations. Base Station Check-In Once team members wrap up their final survey for the day, teams should check back into the base station no later than 6:00 p.m. These times can be revised based on project requirements, but it is recommend that teams report back to the base station before dark and before dinner time. When teams arrive back to the base, collect their equipment (mobile device/GPS unit), batteries, maps, clipboards, pens/pencils, questionnaires, and leftover incentives. You will need to sort through everything to make sure the paperwork is in order before the teams go back out the next day. Implementing the survey Page | 43 Materials and Staging As soon as the interview teams are established and the training is prepared, the next step is to plan the logistics of survey materials and staging. Team Packets Listed below are items to include in survey team packets. Three-ring binders work well for ease of use. 1. A list of contact numbers, including individual cell phone numbers, for all the team members as well as staff in the base station. This allows other team members to get in touch with each other to help finish up survey clusters. 2. A copy of the training materials (slides from a presentation offer a nice summary) for reference in the field. 3. At least one paper copy of the questionnaire for the interviewer to read the survey from as the other team member enters data on the mobile device. It is also helpful to include a handful of paper copies (5-7) of the questionnaire for each team as back up (in case there is a problem with the technology). 4. Set of tracking forms. There should be 2 blank tracking forms per cluster in each of the team packets. These will be discussed in greater detail on the following page. A tracking form template can be found in Appendix G. 5. Field maps and point lists. Include current aerial imagery or street maps, cluster boundaries and survey start sites. This will help teams orient themselves and stay within the selected cluster’s boundaries. Although field maps aren’t necessary, they can be a helpful addition to the digital map data displayed on the GPS units or tablets. Sample Overview Map Showing Clusters Sample Aerial Field Map 6. A Point List is a list of the households (seven, in the 30/7 method) within the cluster that have been identified to visit to conduct the survey. Information included should be the full address, possibly including GPS coordinates. This is not the same thing as a tracking form, which will include additional details about what happened at each household visited. But this point list is the guide for where each team will be heading. Implementing the survey Page | 44 7. A technology “cheat sheet” with basic instructions on how to use the technology. This can be in the form of a pocket guide for teams who run into glitches out in the field. An example is provided in Appendix H. 8. Instructions for non-English speaking households. In neighborhoods where you anticipate encountering non-English speaking households, be sure to have some materials translated into the language you are most likely to encounter. You can use U.S. Census data to determine what languages are spoken in your selected census blocks. One suggestion is to have a card in the appropriate languages that asks the resident to fill in their phone number if they wish to be surveyed; it can be arranged at a later time to survey the household by phone with the appropriate translator. 9. Laminated answer choices sheets in English and Spanish for questions that have a long list of responses (usually more than 5 possible responses). When the interviewer reads the question, they can hand over the response list to the respondent to read over the choices. 10. Educational materials and services offered by your agency or sponsoring organization. Don’t overwhelm households with too much information and unwanted literature. A checklist of items for team packets is included in Appendix I. Tracking Forms When interview teams are working in an assigned cluster, they need to document each household they reach beyond just those where an interview was conducted. It is important to document unoccupied households, those where no one eligible (over 18 and actual resident of household) was home, those where there was a language barrier, and those who refused to be interviewed. This level of detail will be important for the project manager to use when calculating response rates that determine whether there is a chance that bias could exist in the sample. More information about how to calculate response rates will be covered in the analysis section of the manual. It is also very important to remember that a different interview team may complete the cluster the following day, and you don’t want those team members to be approaching households that already refused or completed an interview. The tracking forms are also used to be aware that they may be addressing the households with language barriers. Below is an example of a tracking form, used by Team 1B. The starting point for this team’s cluster was 101 Main St. A tracking form template can be found in Appendix G. Implementing the survey Page | 45 Each attempt is labeled as the cluster number (this team was assigned to Cluster 2) followed by the survey number. It took the team three tries to get the first survey completed, so they keep using #1 until an attempt is successful. For the first interview in this cluster, 3 attempts were made: at 101 Main St (no one home), 103 Main St (interview refused), and 107 Main St (interview completed). Then, the next attempt is labeled 2-2 and the team was successful in getting an interview at 108 Main St. Then they move on to 2-3 where at 112 Main St no one was home and they were successful in getting 2-3 at 115 Main St. The next address to appear on the form would be labeled 2-4. If this team was unable to finish the cluster and another team went out the next day, the other team would start at point 2-4. If 2-4 was attempted the previous day and only NOs (not occupied/no one home) were noted, the new team would go back to those same households to see if anyone was home this time. They would not revisit any homes that were marked IR (interview refused) or IC (Interview completed). Sometimes a cluster is small enough that teams are essentially knocking on every door. If this is the case you can return to homes that were not occupied, 101 Main St. for example, until you reach the quota. It can be difficult for interview teams to remember to fill out these forms, especially while out on foot, but emphasize their importance to the teams; this tracking is essential for determining response rates and ensuring that teams finishing up clusters have the information they need to approach the right households. Implementing the survey Page | 46 ACTIVITY 2.3: FORMING A SURVEY TEAM Time: 5 minutes Instructions: Match the possible CASPER staff roles with their definition. Compare your answers to the answer key on the following page. A. Strike Team Leader ___Responsible for conducting (safely) household interviews within assigned clusters B. Assistant Strike Team Leader ___Responsible for random sampling process, creating and printing maps, assigning teams to clusters, and assigning equipment C. GIS Specialist ___Responsible for overseeing 5 interview teams of two people each (approximately 10 people) D. Epidemiology Specialist ___Assists the Strike Team leader E. Interview Team Leads ___Responsible for overall survey collection, organizing and directing the field command post, and overseeing the tactical assignments given to the Strike Team F. Interviewers ___Responsible for data collection, data analysis of survey results, and report writing Implementing the survey Page | 47 ACTIVITY 2.3: FORMING A SURVEY TEAM ANSWER KEY Match the possible CASPER staff roles with their definition: A. Strike Team Leader _F__Responsible for conducting (safely) household interviews within assigned clusters B. Assistant Strike Team Leader _C__Responsible for random sampling process, creating and printing maps, assigning teams to clusters, and assigning equipment C. GIS Specialist E__Responsible for overseeing 5 interview teams of two people each (approximately 10 people) D. Epidemiology Specialist _B__Assists the Strike Team leader E. Interview Team Leads _A__Responsible for overall survey collection, organizing and directing the field command post, and overseeing the tactical assignments given to the Strike Team F. Interviewers _D__Responsible for data collection, data analysis of survey results, and report writing Implementing the survey Page | 48 Implementing the survey Implementing the survey Page | 49 CHAPTER 3: IMPLEMENTING THE SURVEY Field Survey Methods At this point in the CASPER process, you should have a thorough and efficient questionnaire in the hands of well-trained volunteers, ready to head into the (safely informed) community to visit the 210 sites you have selected via a two-step cluster method. This next section of the manual will explain: How to implement a two-stage cluster sample in the field How to use survey start sites or points Strategies for efficient data collection; and identify special sampling situations Data collection, training and project management using the Collect SMART app and website Scheduling If you have 10 teams of two volunteers each and you are planning for 3 days of surveying, we recommend that you survey Thursday through Saturday. As a general rule, knocking on someone’s door before 10:00 a.m. might be considered rude and could adversely affect your response rates. The recommended time to catch residents at home is between 2:00 p.m. and dinner time. If your teams have tried all the homes in their assigned areas without success, tell them to take a break and return at 2:00 p.m. Interview teams should not go door-to-door after dark. Depending on what area of the country you are in and what time of year it is will determine what time you request teams to return to the base station. Be sure to set that time up front during the training and tell teams they MUST return to the base station at the designated time. Also keep in mind that this can be exhausting work for your teams, so avoid asking them to stay too late. Finally, if your teams are out too late they will likely be interrupting residents during dinner time which is not advisable. If you are planning for just 2 days of surveying, it’s important to include a weekend day to make sure you reach people who have to work during normal business hours, so a Friday and Saturday survey plan is recommended. To complete the surveying in two days, you might need to recruit more than 10 teams. As we discussed earlier, your survey efficiency will depend on a number of factors. The length of the survey instrument and the competency of your staff are the largest contributing factors. It is certainly possible to finish in 2 days with 10 teams, but it’s always best to plan for a third clean-up day where you can complete any last remaining surveys. Keep in mind that some teams may struggle to only get 4 to 5 surveys a day. If this is happening, try to figure out what are contributing factors. Do they lack confidence approaching strangers? If so, split the team up to make sure someone on the team is comfortable doing the interview. Are they getting lost or wasting time trying to find survey locations? Remind them how to use the field maps or data collection devices and give them the opportunity to ask questions. It can helpful to do this away from the entire group since teams are sometimes embarrassed that they are not getting interviews when everyone else is. Finally, if you are sending teams out only in the mornings on weekdays that might be another reason you are having low survey numbers. Typically, survey numbers are higher on the weekends and during the hours of 2:00 p.m. – 6:00 p.m. on the weekdays. Analyzing and reporting results Page | 50 Response Rates The goal for a successful CASPER survey is that it should be representative of the population within the sampling frame. In order to determine whether the survey results are actually representative, you will need to calculate response rates and compare your sample demographics to the geographic area as a whole. The data to calculate your response rates should be on the tracking forms that your field teams have, so it is vitally important that your volunteers understand how those forms are to be used and then they have to use them. More detail regarding the specifics of preparation of the data for use will be provided in the Analysis section of this manual, including comparing your sample demographics to the sampling frame demographics. Often in door-to-door surveys the elderly and women are oversampled. As the project manager you can make small adjustments to your methods to try to avoid this bias. For example, if you have already surveyed 100 residents and 70 of them are women, let your survey teams know that if a male answers the door, they should try even harder to convince him to participate citing the vital importance of both female and male opinions. Again, coercion is discouraged but taking extra time to explain the importance of diverse community participation should be encouraged and emphasized. Similarly adjustments should be made if you notice on the tracking forms that certain teams are getting a lot of refusals. As discussed earlier, talk to the team members about their challenges and split them up if needed or send a team that has had good success to their possibly stubborn neighborhood. Completion Rate: The completion rate describes how close the teams came to collecting the goal number of surveys (210, usually), also called the success rate. You want completion rates over 80% or your survey will not be representative of the sampling frame. Cooperation Rate: The cooperation rate is often what people think of when they hear ‘response rate.’ This rate describes how eligible and willing the community was to participate in the CASPER. The lower this rate is, the more the sample leans toward convenience and away from random and indicates the possibility of bias. Higher cooperation rates will mean a survey that is better representative of the sampling frame. Aim for cooperation rates above 60%. Contact Rate: The contact rate describes, essentially, the effort of the survey: the proportion of all households visited where a survey was completed. Try to keep your contact rates above 20%: one house in every five attempted completes a survey. If your contact rates are below 20%, you will need to interpret your results carefully as the demographics of your sample may not align well with the demographics of your sampling frame. Source: CDC CASPER Toolkit, Second Edition Implementing the survey Page | 51 Going Door-to-Door Each interview team should have a list of randomly selected households (7 in the 30/7 sampling method), including addresses and perhaps GPS coordinates. These seven households are referred to as “start sites” or points. The CDC recommends that the most scientific and representative way would be to select only 7 households and to continue returning to the selected 7 households until an interview is complete at each one. If a household is selected and no one answers the door, the team should plan to try again later in the day or even another day. This will keep the contact rates low and reduce the chance that a convenience sample will be result. Teams should attempt to revisit previously sampled households up to three times. This is also the ‘gold standard’ in survey research. However, this approach is much more expensive and time consuming and the need to obtain scientifically valid results needs to be balanced with the time constraints of completing the survey. So some replacement households will likely need to be found if surveyors are met with empty households or with individuals who are not appropriate candidates to complete the survey (e.g. someone under 18, someone who is not a permanent resident of the home, like a babysitter, etc.). It is also known in survey research that replacements from within the same cluster will be similar to each other. The most realistic method is to simply try the next closest house; continue on to the next closest home until you complete a survey. In densely populated areas, this should be easy enough to find; rural locations may require some assistance from a map or aerial imagery. Teams who are unsure of what to do should contact base station for guidance. Be sure the team notes their movements and the responses met at each household on the tracking form. By using the randomly selected start site, the home where the interview ultimately takes place will still be random using the method described above. This method does have the potential to bias results slightly towards the elderly and female population who tend to be home more often. Remember, the goal is to keep contact rates above 20% in order to avoid bias in your survey results. In small clusters, it is possible to exhaust all of the homes. In the example shown here, the cluster only has about 40 total homes to choose from. A survey team might start on point 7-1 and end up at 7-2 if no one is home or agrees to the interview. If this happens then the teams are effectively conducting a census. This is fine; teams should be instructed to continue in a census-like manner knocking on the door of each adjacent house until they conduct the two interviews for 7-1 and 7-2. In order to collect data in the field as efficiently as possible, when possible, have interview teams consider parking and walking between households. This works well in densely populated areas. In rural areas this can be done as well by parking near clusters of homes. Another strategy is to start at the furthest point from the base station and work back towards the base station. While it might be tempting for an interview team to split up and knock on doors individually, this is not recommended for safety reasons. Implementing the survey Page | 52 Special Sampling Situations If using Census data, the cluster boundaries are typically formed by roads or natural features of the landscape like rivers or streams. It is very important to only interview households within the selected clusters. This is an important assumption of cluster-sampling that must be adhered to in order for the results to be accurately and validly generalized to the entire sample frame. This is particularly important when clusters share borders. Shown in the map to the right, cluster 19 is north of the road and cluster 20 is just south of the road. Interview teams must maintain awareness of where they are in the cluster and conduct interviews in the correct clusters. Proper training and providing an overview map can help teams figure with this. In a household survey, it is important to keep in mind that teams should only be conducting interviews with residents who live in the selected cluster. This means avoiding industrial, commercial, or any non-residential neighborhood. This can be identified ahead of time using tax parcel data, building point or address data, or through interpretation of aerial imagery. Instruct teams to avoid these areas and focus on residential neighborhoods or addresses. In the case of multiple family units such as single high rise buildings or condos, first randomly select a floor in the building by using a random number generator. For example, in a 5 story building, randomly select a number between 1 and 5. Once on that floor, count the number of units on that floor, and randomly select the first unit to interview. Similarly in the case of multiple apartment buildings within a complex, if there are units A-E, assign the numbers 1–5 to the units and randomly choose a number between 1 and 5. Alternatively, survey teams could be instructed to contact the base station with an estimate of the number of floors and number of units per floor. Two random numbers should be then be chosen, one for the level and one for the unit. The teams should start at this random location and then proceed in a census like manner until an interview is completed. If you are sampling in 2010 U.S. Census blocks, teams should be careful to avoid the “donut holes” in which blocks are nested within blocks. In the example shown here, one side of the street is in one census block, the opposite side is in another. This is a rather common occurrence, so be on the lookout for clusters that look similar to the example provided. Donut holes are not a problem with Census tracts or block groups. Implementing the survey Page | 53 Mobile Application Interview teams will be using only the Collect SMART mobile application. The application is compatible with most Android tablets and phones. To ensure that teams feel comfortable using the Collect SMART mobile application, it is important to first go over the tablet features, including how to turn the devices on and off, how to monitor the cellular signal strength and how to turn the GPS and Wi-Fi on or off. Allow at least 30 minutes of demonstration time for the Collect SMART mobile application, allowing teams the opportunity to practice. Here is a recommended outline for demonstrating technology: • Watch on-screen demonstration – Basic introduction to Android OS – Epi InfoTM app – Other device features • Check for data signal • Email/communication • Hand-out devices to teams • Demonstrate again walking everyone through each step During the demonstration, first show the home screen and ask how many people are familiar with Android phones or tablets with a show of hands. This will give you a good sense of how much time you need to spend on the basics of Android. Then identify the Epi InfoTM app as the app we will be using to collect data. A typical home screen for Android devices, the home page for the Epi InfoTM and the Collect SMART login screens are shown below. Next demonstrate the mapping capabilities of the Collect SMART. Start by going over the 4 main navigation buttons shown below on the bottom right of the screen: 1) Clusters, 2) Points, 3) Map Type and 4) Staging Area. When a user clicks the ‘Clusters’ button they are shown a list of the numbered clusters on the bottom of the screen. Then if the user clicks on a cluster number in the list, they are zoomed to that cluster and shown the list of available points in that cluster. Implementing the survey Page | 54 From the image above on the right, choosing a point from the list will then zoom the user to that point in the cluster and pull up the address on the screen in a white callout box. Tapping on the callout box will bring up a prompt to either begin an interview for that random start point or cancel. When a user clicks begin interview the record list will come up and the form will be loaded. Instruct interviewers to be patient at this step as sometimes the forms are large and take up to 5 seconds to load. Once the form is loaded give interviewers time to scan through it and compare this digital version of the survey to the paper one. If you have built-in code to capture the date and time and exact location of the survey, be sure to tell interviews how this code is activated. In Epi InfoTM this code can be called up most easily with a button or simply upon loading the form. Keep in mind that a button will allow the surveyors to adjust the time and coordinates if they end up pulling the survey up early and then knock on multiple doors before actually beginning the interview. Implementing the survey Page | 55 One of the most important things to stress is to save the record after completing the interview! Once the record is completed it will show up in the record list and then interviewers will need to send a ‘sync file’ over to the Collect SMART cloud-based server. This sync file is an encrypted version of the data (.ep7) that for import in the desktop version of Epi InfoTM. Note that an .xml version of the data is also sent to the server There is a help screen with some information about the app and the sampling method that can accessed from the Map View screen. Also, a pocket guide guiding users through the Collect SMART mobile application is included in Appendix H. Monitoring Teams and Analyzing Results in Real -time Once teams are in the field the project manager can monitor team progress using the Project View dashboard on the Collect SMART website. This dashboard displays the point status in three different ways: Green dots: incomplete interviews Gray x’s: completed interviews Yellow dots: interviews in progress Red triangles: Survey teams Both points and surveyors can quickly be located using the drop-down menu in the upper left part of the screen. There are several management buttons at the top of the screen. Survey or Team dropdown: To view specific teams or survey points, select from the dropdown menu. Hide Clusters: Cluster boundaries and labels can be turned on and off and point status and surveyor location can be refreshed manually using the buttons at the top of the screen. Responses tool: Analysis of results can also be conducted “on the fly” or in real time. The Response Tool, shown on the left side of the image below, tabulates responses as sync files are sent to the server. Questions that are coded as check boxes, yes/no, or multiple choice are tabulated in a basic table. Open ended questions can’t be summarized with this tool. Implementing the survey Page | 56 Progress tool: Shown on the right side of the screen below, tracks the number of completed surveys in each cluster. Both of these tools can be turned on and off using the button at the top of the screen and moved around and resized to fit anywhere on your screen. Software Tip If you are not seeing the most up-to-date survey counts, click the “Refresh Points” button or refresh the browser page. Downloading Records As surveyors send their sync files to the server, results are stored in the under ‘survey files’ under the ‘Admin’ tools on the Collect SMART website. Choose Admin from the main screen and then Manage Projects. Implementing the survey Page | 57 From the Manage Project page, choosing ‘View Survey Files’ will bring up a listing of all the files associated with the project. Software Tip Choosing “Delete Survey” will permanently delete ALL survey files associated with your project, so use caution. On the listing of files you will notice both .ep7 files and .xml files. Use the .xml files if you are planning on using excel or some other database software for the compilation and analysis of your results. The .ep7 files can be imported back into your Epi InfoTM database using the password ‘a’ which is automatically created by the app. Appendix J includes some common FAQs from teams while in the field collecting interviews. Implementing the survey Page | 58 “Day of” Preparations Below is a summary steps that the project manager can do for day of data collection preparations: 1. Check Team Packets (binders should be assigned team numbers) Verify contents: tracking forms, maps, point lists Include 5-7 paper copies of questionnaire Include laminated answer choices (if using) Provide 10-15 Spanish referral forms 2. Tablet Preparations (label each tablet by team number) Ensure tablets are fully charged Turn all tablets on Open Collect SMART application and ensure proper login information is stored in project Verify the following mobile device/tablet settings (if applicable, below is an example using a Google Android tablet) – Mobile data is on – GPS is OFF – Wi-Fi and Bluetooth settings are OFF – Display is set to auto – Battery saver on (battery, options, battery saver) – Battery fully charged – Clean screens from any smudges Ensure each team has a car charger and USB cord for each mobile device/tablet (label by team number) 3. Match tablet, chargers, and team packets by team number 4. If providing, include GPS units (including charger and windshield mount) 5. Provide incentive boxes for each team (include at least 7-12 incentive bags in each box) 6. Verify team pairings and location assignments 7. Brief teams before they leave: Remind them of check-in procedures and safety (including weather forecast) Reminders on questionnaire edits if necessary Revisit common problems or issues teams were having (e.g., make sure to charge mobile device/tablet, switch to paper surveys if there are any technical issues, tracking forms reminders, etc.) If time allows, ask for feedback or for people to share their experiences from the previous survey day Implementing the survey Page | 59 Check-In 1. Collect all team equipment, including tablet, tablet chargers, team packets, GPS units/mounts/chargers (if using). Track check-in of equipment in Staff and Equipment Check Sheet 2. Verify with staff or volunteers who is committed to returning the next day 3. When you receive a team’s mobile device/tablet, open up Collect SMART o Sync the files in case the team forgot to sync after the last survey 4. Ask teams to walk you through tracking forms, as they explain, be sure to check: o Tracking forms have cluster number written on top o All addresses have been entered and there are no missing status codes (teams often forget to enter in the last address of the day) o The number of interviews they have completed matches what is on the tracking forms 5. On the Collect SMART website, open the Manage Project page, and choose ‘View Survey Files’ o Open the latest .xml file synced by the survey team o Make sure that the synced file is on the server o Verify the number of surveys complete in the synced file list Before Next Survey Day 1. Fully charge mobile devices/tablets 2. Check survey counts, looking at synched files and Team Packets (that have the maps and tracking forms) o On the Collect SMART website, go to the Project View dashboard on the Collect SMART website. You can review completed surveys in each cluster along with reviewing the tracking forms o Update counts for surveys to be complete the next day 3. Review next day team assignments, making sure to pair experienced/inexperienced and local/non-local o Check-in with staff or volunteers to ensure they will be there the following day 4. Check Team Packets so that each team has at least 10 surveys needed for next day (add “clean up” clusters that have remaining interviews to team assignments if necessary to make sure each team has enough interviews assigned) Implementing the survey Page | 60 Analyzing and reporting results Analyzing and reporting results Page | 61 CHAPTER 4: ANALYZING AND REPORTING RESULTS Introduction Once the surveys are collected, the next stage is to analyze and report the results. Analysis of Tracking Forms In summarizing the main outcomes of your CASPER, there are three different response rates to calculate, which were discussed briefly earlier in this manual: success rate (also known as the completion rate), cooperation rate, and contact rate. Response rates help determine if sample adequately represents the study population. For example if your rates are very low, then you might not have a very representative sample and you should interpret your results with caution. Tracking form codes can be entered into a database to count the numbers of attempts made, completed interviews, refusals, and ineligible participants. Success Rate Also called the completion rate, the success rate is a measure of how close you were to reaching your goal. For example, if your goal was to complete 210 surveys and you completed 200, then your success rate would be 200/210 or 95.2%. Success Rate = # of Completed Interviews ÷ Goal Number of Interviews Success rates below 80% (168 out of 210) result in an unacceptably low number to represent the sampling frame. Efforts should be made to ensure that clusters with a low response are revisited to ensure sufficient numbers. Cooperation Rate The cooperation rate is the proportion of housing units where contact was made and an interview was conducted. Cooperation Rate = # of Completed Interviews ÷ All housing units where contact was made The denominator includes all completed interviews, incomplete interviews and refusals. You should also include homes where a language barrier prevented the successfully completion of an interview. This cooperation rate is often call the “response rate” and typically falls between 60-80% for household interviews. Rates below 60% may indicate the potential for bias in the results but they do not necessarily mean that bias exists. Contact Rate The Contact rate is the proportion of housing units where contact was ATTEMPTED who successfully completed an interview. Contact Rate = # of Completed Interviews ÷ All household units where contact was attempted Analyzing and reporting results Page | 62 The denominator includes all completed interviews, incomplete interviews, refusals and nonresponses, including where a home was abandoned or unoccupied. You want your contact rate to be above 20%. The contact rate can vary greatly, particularly if a CASPER is being conducted after a disaster or emergency. If damage/impact is extensive you will likely experience very low contact rates. Contact rates are often used as a measure of the amount of effort involved in carrying out the survey. Data Cleaning Once data have been entered into whatever platform will be used to analyze it must be thoroughly reviewed or "cleaned" to check for inconsistencies, implausible entries, missing data, and skip pattern errors. Before the cleaning begins, always save a new copy of the database file so that any errors that may occur during cleaning and analysis do not corrupt the original, raw data. Your goal during data cleaning is to prepare the raw data for analysis. A thorough review of all of these considerations will improve the quality of your results and reduce problems down the line. In addition to dealing with possible errors and missing data, data cleaning can also include changes to the data to prepare for weighted analysis. For example, some numeric answer choices may be stored as text, which may impede analysis efforts. Data cleaning is an ideal time to check for these issues and update the coding before analysis. In addition, some statistical analysis packages require a standard type of numeric coding which might be applied after the data has been collected. You may also choose to combine variables or answer choices. For example, if each answer choice for a question was coded independently, you may wish to create a new summary variable that combines all of this information. For questions with an “other, please specify” answer choice, you may wish to review the text entries to organize those answers into new or existing numeric categories, which will give you precise 95% confidence intervals during weighted analysis instead of lumping all text entries into the “other” category. Some of the most common sources of errors are errors in the design of the data collection instruments, such as poorly worded questions or improper use of skip patterns. Other sources of error may stem from improper functioning of equipment, as well as errors made by interviewers, often due to inadequate training. The survey participants themselves may also introduce errors if they provide the incorrect response, which can occur if they do not read or interpret a question properly, or if they intentionally provide a false answer. Errors can also be introduced after the data has been collected, most often by data entry errors or coding errors. Another problem is unintelligible text entries. This is not uncommon and can happen when interviewers use abbreviations or when they enter typos into the text box field. In these cases, you will have to decide how to recode the data and document any subsequent changes. Missing Data There are very few datasets that are 100% complete. Usually there are at least a few missing values, and in the worst case, there might be so much missing data that a proper analysis is not possible. With smaller datasets, the easiest way to identify missing data is by looking at the actual dataset. You can also examine frequencies, and many statistical software programs have features that will help you identify missing data, which is necessary when working with larger datasets. Analyzing and reporting results Page | 63 Sometimes missing data occurs randomly, and sometimes it can occur in patterns (e.g., you may find that a number of people are all missing data on the same variable). When there are patterns to missing data, this may provide clues to why it is missing (e.g., one interviewer may not be appropriately entering data and is repeating this error for all of the interviews that they conduct). When there is a large amount of missing data for a single subject, this may indicate that the interview or questionnaire was terminated early. However, sometimes there may be pieces of data that are intentionally missing, such as when a questionnaire includes a skip pattern to avoid asking subjects irrelevant questions. Unless missing data is due to errors in data entry, it usually cannot be corrected without re-contacting the subject (which is not possible for anonymous surveys). Instead, there are several other approaches that can be taken when dealing with missing data: Often the best approach is to continue to analyze the results with the missing data, but do not include the “missing” category in your analysis. This will reduce the total number of respondents for any questions with missing data, but it will maximize the total amount of data that you have for other questions. Coding the data in this manner allows you to keep the record with missing data as opposed to deleting in entirely from your dataset. Another common approach is called complete case analysis, which is usually only valid when the amount of missing data is small (less than 10% for each variable). This method deletes subjects with missing data from the analysis, so that only subjects with complete data are analyzed. Another method is to delete variables that have a large amount of missing data. Of course, if the variable is important for your analysis and is related to your hypothesis, then this method should not be used! And presumably, you would not have asked the question if you did not think it was important, so dropping variables may not be a good solution. Another method that was common practice for many years was to treat missing data as another potential response category (of course, this can only be done for nominal variables). Epidemiologists have since recognized that this method can lead to biased results, and is therefore not recommended. For datasets with larger amounts of missing data, imputation techniques are often used to make informed guesses as to what the missing value would have been based on the range of responses observed in other subjects and the other characteristics of the subject with the missing value. With imputation you are insinuating what the response might have been. Imputation can be somewhat complex and requires more advanced statistical methods and software. Duplications Duplications occur when there is more than one record in a dataset that contains the exact same information. Duplications can arise in several ways, most often when the same person’s information is entered into the same database more than once. Less commonly, a person may be asked to complete the same interview or questionnaire twice. Good record keeping and organization will usually prevent these types of errors from occurring. Sometimes duplications can arise when multiple databases are merged together into one. Duplications can usually be identified by looking for multiple records that have the same identifying information (i.e., ID number). A frequency listing of ID numbers can be used to make sure that each ID number only has one record. If you are using Epi InfoTM for your analysis, the database will automatically exclude records with the same ID. The solution for dealing with data duplications is simple: first make sure that both records contain the exact same information, and then delete the duplicate record. Analyzing and reporting results Page | 64 Outliers or Improbable Values Outliers and improbable values are also common types of potential errors that can be found in data. Outliers are values that fall outside the range of values of the majority of the responses. Outliers are often defined statistically, such as values that fall outside 2 standard deviations of the mean. Improbable values are values that are highly unlikely or impossible. Often they are identified when you discover logically impossible combinations of responses, such as answers for questions that should have been skipped. Outliers are most often detected by examining descriptive statistics for each variable, including the minimum and maximum values, measures of central tendency, and frequency distributions, which are represented graphically by histograms. Variables based on continuous data such as age, usually have most of the values clustered around the mean, so if you see one or two people who are very old or very young compared to the rest of the study population, these people might be considered outliers. However, outliers in this case should be kept with the database and not deleted. Wherever possible, data should be examined for logic errors or logically impossible combinations of responses. You can often detect errors in data simply by looking at each record to see if the responses are logical. For example, a question was asked about current pregnancy and the reply is marked 'yes' but you notice that the respondent is male. There are some software programs that also have the capability to incorporate automated logic checks, so that improbable values are flagged for the investigator to examine. The simplest and best way to correct outliers or improbable values is to look at the original data source (the questionnaire), and compare it with the database to check for possible data entry errors. If this is the case, you simply correct the data with the true value. If this is not the case, or if you do not have access to the original data source, you have several options. One option would be to recode the value as missing, and then deal with it the same way you handled other missing data. You could also choose to delete the record from the analysis. Or you may decide to leave it as it is, because some outliers are not errors, and often true outliers can provide some important information on the characteristics of people at the extremes of the distribution. Overall, knowing how to deal with outliers and improbable values will depend on your knowledge of the subject area, and how important the variable is to your analysis. Weighted Analysis CASPER data can be analyzed in numerous software platforms such as Epi InfoTM, SAS, or other statistical analysis programs. Epi InfoTM is a useful program for producing statistics, particularly for the weights that need to be calculated. SAS and other statistical analysis programs are often more complex, but they allow for advanced statistical techniques. In general, advanced statistical analysis programs are only recommended if your analysis team is already familiar with the software. In addition, Excel (or any other spreadsheet software) can be used to present the results in visually pleasing tables and graphs. A properly conducted weighted frequency analysis should yield reasonably valid and precise estimates of plus or minus 10% of the proportion of the affected population. Additional guidance for proper analysis of CDC’s CASPER tool in Epi InfoTM can be found on the CDC website and in the CASPER toolkit, some of which is described below. Unlike a simple random sample of the entire sampling frame area, households selected in cluster sampling have an unequal probability of selection. To avoid biased estimates, all data analyses Analyzing and reporting results Page | 65 should include a mathematical weight for probability of selection. A weight must be added to each of the surveyed households using the formula shown here. Applying the weights when running analyses provides estimates that can be generalized to every housing unit in the geographic boundary for which the CASPER is being conducted. This step should be done in consultation with a statistician. Weight = Total # of households in the Sampling Frame (# of households interviewed within the cluster × Total # of clusters selected) Below is an example in a sampling frame of roughly 50,000. Out of the 30 clusters, within 28 of them all 7 expected interviews were conducted. In cluster 29, 6 interviews were conducted and in cluster 30, 5 were conducted. In the raw data, create a weight column and apply the calculated weight to each interview as shown below. In this example the weight for clusters 1-28 will be same while 29 and 30 have a larger weight since fewer surveys were collected in each cluster. 50,000 housing units ÷ (7 × 30) = 238.10, which will be applied to the 28 clusters where 7 interviews were completed. 50,000 housing units ÷ (6 × 30) = 333.33, which will be applied to the one cluster where 6 interviews were completed. 50,000 housing units ÷ (5 × 30) = 277.78, which will be applied to the one cluster where 5 interviews were completed. Once weights are assigned, frequencies can be calculated for each of the interview questions. To calculate frequencies in Epi InfoTM be sure to specify the weight variable calculated in the previous step. If you are using the Classic Analysis tools in Epi InfoTM, choose the complex sample frequencies option under Advanced Statistics. Analyzing and reporting results Page | 66 In addition to weighting the data analysis, you should also calculate 95% confidence intervals. These confidence intervals will indicate the reliability of the weighted estimate. Be sure to set the weight properly and assign the primary sampling unit to the CLUSTER variable. This option is available in Analysis mode if you select Advanced Statistics and then Complex Sample Frequencies. The demonstration video below will walk you through other analysis options within Epi InfoTM that you might want to explore as you analyze your dataset. Demonstration Video Epi InfoTM 7: Analyze Data (5 minutes) Analyzing and reporting results Page | 67 Reporting When it comes time to report your CASPER findings, first decide who will benefit most from the results. You will want to present the survey findings to your partners, participants, and other key stakeholders. Keep the reporting brief with a focus on elements that are actionable. Based on your target audience, be sure to tailor the presentation or report to that audience. For example, when presenting findings to community members, you will want to explain the process in simple, non-technical terms. At a minimum, you will want to: Explain how the community was engaged in the survey process (selecting survey questions, volunteering to conduct survey, etc. Allow community members and survey volunteers a chance to share their experiences collecting surveys) Describe the methods of when and how the survey was conducted, including the number sampled and how you selected the sample Provide the demographic results of the respondents (compare the data with the latest census data for your county or region), highlighting (depending on the audience, you may want to include the 95% confidence limits with data) and describing any limitations to the survey. It is important to convey what level the results can be generalized (typically the results are only generalizable at the county or region level). If the results are being included in a report, include a copy of the questionnaire as an appendix. Examples Wake County, NC (2013) Appendices D-F Durham County, NC (2010) Summary presentation Appendix G Analyzing and reporting results Page | 68 Appendix Page | 69 Appendix A: Resources Basic Resources: CASPER Online introductory module (available at http://tinyurl.com/XXXXX ) Epi InfoTM software download: http://wwwn.cdc.gov/epiinfo/html/downloads.htm Epi InfoTM Community Health Assessment Tutorial: http://wwwn.cdc.gov/epiinfo/script/eihat.aspx Epi InfoTM User Guide: http://wwwn.cdc.gov/epiinfo/user-guide/index.htm Questionnaire Design Resources: NC Division of Public Health’s Community Health Assessment Guidebook includes Community Health Opinion Survey templates in English and Spanish, as well as an Epi Info template: http://publichealth.nc.gov/lhd/cha Behavioral Risk Factor Surveillance Survey (optional modules on specific topics): http://www.cdc.gov/brfss/questionnaires/ National Health Interview Survey has questions that have been tested and validated: http://www.cdc.gov/nchs/nhis/quest_data_related_1997_forward.htm PubMed search to see if there are questions that have already been tested: http://www.ncbi.nlm.nih.gov/pubmed Sampling Resources: A Guide to Sampling for Community Health Assessments and Other Projects: http://cphp.sph.unc.edu/PHRST5/IntroSampling.pdf Two-Stage Cluster Sampling: General Guidance for Use in Public Health Assessments: http://cphp.sph.unc.edu/PHRST5/TwoStageSampling.pdf Sample size calculator: openEpi.com IRS requirements for health assessments conducted by hospitals: http://www.irs.gov/Charities&-Non-Profits/Charitable-Organizations/New-Requirements-for-501%28c%29%283%29-HospitalsUnder-the-Affordable-Care-Act Pre-joined demographic data for Census Blocks via TIGER/Line Shapefiles: http://www.census.gov/geo/maps-data/data/tiger-data.html Census Block Groups: tabular data from the US Census Bureau’s American Fact Finder system: http://factfinder.census.gov/faces/nav/jsf/pages/searchresults.xhtml?refresh=t Appendix Page | 70 Then download the spatial data from TIGER/Line Shapefiles: http://www.census.gov/cgibin/geo/shapefiles2010/main Random number generator: http://www.random.org/integers/. Staffing Resources: Incident Command System Field Guide from Texas Department of State Health Services’ CASPER Strike Team: http://www.dshs.state.tx.us/commprep/disasterepi/casper.aspx. Training Resources: Interviewer training template: http://nciph.sph.unc.edu/training/programs/collectsmart/Interviewer%20_Training_Template.pptx Reporting Resources: Sample Community Health Needs Assessment from Wake County, NC (Full Report; Appendices D-F pertain to the survey): http://www.wakegov.com/humanservices/data/Documents/2013%20Wake%20CHNA%20Full% 20Report%20FINAL.pdf Sample from the 2011 Durham County Community Health Needs Assessment (Summary Presentation): http://www.healthydurham.org/docs/CHA%202011%20-%20key%20findings.pdf Sample from the 2011 Durham County Community Health Needs Assessment (Appendix pertaining to survey analysis and results): http://www.healthydurham.org/docs/Appendix%20G%20-%20Survey.pdf Appendix Page | 71 Appendix B: Team Assignment List TEAM ASSIGNMENT LIST Day 1: [Enter date] Team Tablet CLUSTERS* NAME, affiliation, cell phone # # Surveys Needed DRIVER 1 2 3 4 5 6 7 8 9 10 *For clusters, you may want to note here which ones have a high concentration of Spanish speakers or any clusters that have additional safety concerns. Appendix Page | 72 Appendix C: Staff and Equipment Check Sheet Staff & Equipment Check Sheet Date (please circle) ___/___/____ ___/___/____ ___/___/____ TEAM # ______________ __/___/_____ Team Member Names: _________________________________________________________ Leave (start) time: _______________ AM/PM Arrival (finish) time: _____________AM/PM Driver Name: ________________________ Mileage Sheet Submitted? Yes No N/A Equipment Check-in (check all that apply): Binder Laminated cards Tablet Tablet car charger and USB cord GPS car unit and mount GPS car unit charger Incentives Base Station Notes (concerns, problems encountered, comments): Call In Status Notes (safety status, # surveys complete, expected time return to base station) Time of call: Notes: Time of call: Notes: Time of call: Notes: Appendix Page | 73 Appendix D: Survey Press Release Template (Community Health Assessment) Press Release Template FOR IMMEDIATE RELEASE [Date] [NAME] COUNTY INVITES PARTICIPATION IN COMMUNITY HEALTH OPINION SURVEY To identify and respond to the health needs of residents, [Name] County is partnering with a number of local organizations to conduct a Community Health Assessment. The assessment will include a health opinion survey of approximately 210 residents across the county. Starting [date], surveyors will be conducting randomly selected door-to-door surveys to get resident’s opinions on the most pressing health needs in the community. [Quote about importance of survey for the assessment process from CHA committee chair]. [Hospital/public health] staff and volunteers will be conducting the surveys in [survey area- city, county, region] on [dates] from approximately 10:00 a.m.- 6:00 p.m. To ensure the safety of citizens, surveyors will be wearing name badges. Survey participants will be asked questions about [list survey topics]. The Community Health Assessment is conducted every [#] years to identify the health status, concerns, and resources in [Name] County to as a part of a community-wide strategic health planning process. The results will be used by health and service organizations to develop priorities and action plans for improving services. [Quote encouraging residents to participate and share their opinions from lead agency director]. [List project partners] are providing support for this project. For more information on the Community Health Assessment, contact [phone number] or visit [website]. ### Appendix Page | 74 Appendix E: Community Flyer for Data Collection HELP IMPROVE THE HEALTH OF YOUR COMMUNITY! [NAME] COUNTY HEALTH SURVEY Insert Your Logo Here [Name] County is partnering with a number of local organizations to conduct a Community Health Assessment Surveyors will be conducting randomly selected door-to-door surveys to get resident’s opinions on the most pressing health needs in the community Survey questions include topics such as: [list topics] Surveyors will be in your neighborhood [Insert Dates] 10:00 a.m. – 6:00 p.m. To ensure the safety of residents, all surveyors can be identified by a name badge For more information, contact: [Office] [phone number] [web address] Appendix Page | 75 Appendix F: Base Station Layout Appendix Page | 76 Appendix G: Tracking Form Template Cluster _____________ Assessment Tracking Form Date: _______________ Interview Team:_____________ Status Codes: IC – Interview Conducted NE – Not Eligible NO- Not Occupied/No One Home LB – Language Barrier Cluster 1 – 28 and Survey 1-14 Appendix IR – Interview Refused Address Status Code Page | 77 Appendix H: Collect SMART Pocket Guide (Google Android Tablet) Turning it On On the side of the tablet, you will see the power/lock key to turn it on and the volume key. If you cannot get the tablet to power on, hold the power key for 5 seconds. Lock Code Each tablet is locked with a code. To access the tablet, draw the following pattern (square starting in middle drawing to the right, don’t complete): the home screen. Then click on Map View. An automatic login screen will briefly flash on the screen. From the Map View menu on the lower right, select Clusters and select the cluster number you are assigned to. Tap on the blue dots to pull up the call out of the point number and address –OR - you can select Points to view all starting points for that cluster. Then select the specific point on the list to zoom to that point area. Getting Around At the bottom of every screen, no matter what you’re doing, you’ll always find these three navigation buttons: Back: opens the previous screen you were working in, even if it was in a different app. Home: if you’re viewing a left or right Home screen, opens the central Home screen. Recent apps: opens a list of thumbnail images of apps you’ve worked with recently. GPS and Battery The CASPER App requires connection to a server. Make sure the GPS button is ON and keep WIFI off. Tap the call out box for the survey point you where would like to start an interview. Select Begin Interview to open the survey record screen. Quick Settings Access by swiping down from the right top corner of any screen (twice) to adjust Wi-Fi settings, manage display brightness, and view battery charge. Charge your tablet during lunch using the car charger. Getting Around EpiInfo Click on the EpiInfo icon on The form should load automatically. If it doesn’t, click on Add Record from the Record List to open up the survey form and start a new survey. Note: it may take a moment to load. HELP From the Map View, tap on the Menu Icon at the upper right hand corner to access the EpiInfo Help Screen. Fill in the questionnaire. Once complete, select Save Record at the top. Still have questions? Call Matt Simon at (919) 928-4477. You will return to the Record List screen. If you want to view the Map screen, select the Back button. Create a Sync File Mid-point and at the end of the day, create a sync file which will upload your locally saved files to the server (creates a back-up copy and allows the project manager to see the survey files). From the Record List, tap on the Menu Icon right hand corner. Important Tips: Protective cover (Otterbox) will protect from dust and light, but is NOT waterproof or shatterproof Tablets are on a data plan only. No voice plan is available Try to start the survey outside of the home. If you are asked to go inside, follow the steps to open up the survey before going indoors, otherwise the tablet may say that GPS coordinates could not be determined Color o o o Records can be deleted from the record list using a long press and choosing ‘delete.’ HOWEVER, keep in mind that this is permanent and deleted records cannot be recovered. at the upper From the Menu Icon, select Create Sync File. Click OK once the survey files have been transferred to the server. legends for points in Map View: Green=survey not started Yellow=survey in progress Gray X=survey completed Appendix I: Team Packet Checklist Team Packet Checklist One packet per team Item Item Description 1. Contact numbers List of all team member’s cell phone numbers, field post staff phone numbers 2. Training slides Copy of training slides for reference 3. Paper copies of questionnaire At least one paper copy for interviewer, include handful as back-up 4. Tracking forms 2 tracking forms per cluster 5. Field maps Overview map of entire area plus a map for each cluster with cluster boundary and survey start sites 6. Technology cheat sheet Pocket guide for using tablet technology 7. Instructions/ handouts for nonEnglish households Instructions in languages likely to encounter on how those households can participate in the survey 8. Survey answer choices Laminated answer choices (English and Spanish) for questions with more than 5 response categories 9. Informational handouts Educational materials or services offered by sponsoring organizations Appendix Included in Packet Page | 80 Appendix J: Collect SMART Data Collection FAQ The random start point house has a “no trespassing” sign. What do we do? Write the address down and note that on the tracking form. Go to the next closest houses until you get an interview. No one is home at our random start point. Do we go to the next random start point? Write the address down and note “NO” on the tracking form. Go to the next closest houses until you get an interview. Once you get that interview, then go to the next starting point location. We’ve knocked on the doors in all of our clusters and still need interviews. Suggest going to another assigned cluster and going back to the NOs in the first cluster later in the day. The map on Collect SMART app is not showing our location/we don’t have data signal. On mobile device, verify that the cellular data is not turned off. Also check to make sure it is not in Airplane mode. Check and see if there is any data signal. If you can still get into Collect SMART, you will still be able to open cluster points, just not see where you are on the map. The surveys need to have the Cluster and Survey number entered on the form and need to be saved. The surveys will be saved on the device and will need to be pulled off later. Teams can use paper surveys as a back-up. Once you are in a cellular coverage area, click on the OPTIONS (3 dots) button in the upper right corner to refresh points. Collect SMART won’t log us in (saying check connection). If you are in an area with no connectivity, hitting the back button can log you out of Collect SMART and you can’t get back in until you are in an area of connectivity. On mobile device, verify that the cellular data is not turned off. Also check to make sure it is not in Airplane mode. Check and see if there is any data signal. If Collect SMART does not work, you can instead go into the “Collect” window of Epi InfoTM and collect surveys offline (you can put tablet in Airplane mode to save battery). The surveys need to have the Cluster and Survey number entered on the form and need to be saved. The surveys will be saved on the device and will need to be pulled off later. Teams can use paper surveys as a back-up. I saved my record and it took me out of the interview form. Saving the record will automatically take you to the Record List. You can scroll down to the most recent interview and tap on the interview to get back in. The Cluster view shows that I have completed all the clusters in my survey, but I have not completed them all (accidentally opened one). How to I begin a new interview in that cluster? You can still begin an interview – you can restart a point that is saying it’s already complete or from the list at bottom, hard press a point until it opens up an interview form. We are at starting point 22-3 but the tracking form says 22-1. The starting points are just suggested starting sites for you to find homes to do the interview. Remember, the cluster itself is a randomly selected cluster, so any home within that cluster is “fair game”. The tracking form is just tracking homes you are going to and the cluster _ interview _ that you are working on. The most important thing is to track the addresses of where you are going (NO, IR, IC), how many interviews you are completing in the cluster, and use the random starting points as a suggested place to start. Appendix Page | 81