1
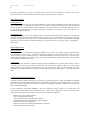
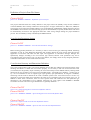
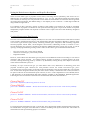
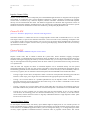
IGHEM 2000
Hydrometrics Ltd.
Page 1 /14
HYDRO 11
Integrated System for Hydrometric Data Processing
and Discharge Calculation in Open Channels and Closed Conduits
Author : Rastislav Slota, Hydrometrics Ltd., Slovak Republic
E-mail : [email protected] , [email protected]
Demo version available on : www.hydrometrics.cz
Introduction
HYDRO11 software product is an original, powerful and easy-to-use integrated system for hydrometric data
processing and discharge calculation, that has been originally developed for internal needs of Hydrometrics Ltd.
company. HYDRO11 package might be useful in the field of hydrology, hydraulic engineering and hydraulic
research, simply in most cases where it is necessary to measure and evaluate discharge of water (or other liquids)
using velocity–area methods according to international standards ISO 748 and ISO 3354. The range of possible
practical application covers flow measurements in natural watercourses, artificial channels, sewers and
measuring flumes, as well as pressure pipelines, penstocks and turbine inflows. The program‘s main features are
related especially to user-friendly interface, well arranged processing of the input data (including automatic
registration of measured data), visualization and interactive approach during the discharge calculation, graphical
and text data export for post-processing and presentation, etc.
The structure of HYDRO11 application consists of two independent executable modules: HYDRO11 EDITOR
and HYDRO11 Computational module. The EDITOR module includes a set of various pre-prepared dialoque
boxes, forms and tables for cross-sectional geometry input, propeller calibration-constants database, propeller
identification matrix, as well as the measurement data input for each measuring method and cross-section type
supported. In addition to the manual data input, it is possible to use also an internal Impulse Counter utility that
allows (in connection with a special hardware equipment) automatic registration of current meter impulses and
transmits the data directly into the appropriate data sheet. If any other measuring instrument is used instead of
the propeller current meter (for example electro-magnetic current meter), the point velocity matrix can be
entered directly. All data required for discharge calculation is stored within a well-arranged structure of internal
data files. The discharge calculation itself is carried out by means of the HYDRO 11 Computational Module.
Flow Cross-Section Types
The program supports six basic cross-section types including some additional modifications : Open Rectangular,
Open Circular, Open General (non-symmetrical), Open Symmetrical (usually egg-shaped), Closed Rectangular
(including a sub-type with 45° slant corners) and Closed Circular. This range covers almost 99 % of all
measuring sites from the hydrometrical practice. In the terminology used within HYDRO11, "open" type means
a cross-section with free water surface flow regime and "closed" type means a cross-section with full pressureflow regime. A "measuring project", that user creates in order to prepare all input data necessary for discharge
calculationin in a certain location, is allways related to one selected cross-section type, for which several
measurement records can be created afterwards. Generally, for "open" types a fixed number of measuring
verticals must be defined and a number of measuring points per each vertical may vary from record - to record,
from vertical – to vertical. For "closed" type a fixed number of measuring points must be defined and it remains
constant for all measurement records related.
Picture01.GIF
picture 1 : HYDRO11 - Flow Cross-Section Types Supported
IGHEM 2000
Hydrometrics Ltd.
Page 2 /14
Measuring Methods
The choice of the method of flow velocity measurement depends on certain factors. These are : time available,
width and depth of the cross-section, rate of variation of level, degree of accuracy required and measuring
equipment used. According to ISO 748, these methods are classified as follows :
-
Velocity distribution method
Reduced point method
Integration method
Other methods
HYDRO11 program recognizes two basic methods of flow velocity measurement. For the purposes of discharge
evaluation in HYDRO11 we will consider the “Point velocity method” (as a common method including Velocity
distribution method and Reduced point method) and the Integration method. Other methods (like Surface onepoint method, etc.) are not supported here.
Using a “Point velocity method”, values of flow velocity are obtained from observations at number of measuring
points properly distributed throughout the whole cross-section area. The number and spacing of points should be
chosen as to define accuratelly the velocity distribution on each vertical, resp. arm (circular cross-section type).
In HYDRO11, this measuring method is available for all cross-section types listed above and also for both
measuring instrument options (propeller current meter as well as electro-magnetic probe).
If using an "Integration method", the current meter is lowered and rised trough the entire depth on each vertical
at a uniform rate. Using propeller current meters, the mean vertical velocity can be calculated from instrument
calibration as equivalent to the average number of revolution divided dy the total integration time. In
HYDRO11, this measuring method is available for Open Rectangular, Open General and Closed Rectangular
cross-section types.
Computing Method
HYDRO11 software uses full graphical method of discharge computing in accordance with ISO 748
(Measurement of liquid flow in open channels, velocity – area methods) and ISO 3354 (Measurement of clean
water flow in closed conduits, velocity – area methods). This method, comparing to numerical methods and
combination of numerical and graphical methods, is recognized as the most accurate one. The principle of the
graphical method, in general, is to exactly calculate the area bounded by velocity distribution curve, crosssection boundaries and / or water level. The integral form that is applied in individual case depends on the crosssection type and measuring method used. In general, the computing method can be described by following
expressions :
-
Mean Vertical Velocity Calculation (applied in all open section types and closed rectangular cross-section
type, using point velocity measuring method)
v=
v
H
vb
1 H
. vb .dh
H ∫0
… is the mean vertical velocity
… is the mean vertical depth
... is the point velocity in distance h from bottom, that comes from velocity
distribution curve vb = f ( h )
- Discharge Calculation (applied in all cases mentioned above and also in integration measuring method)
B
Q = ∫ v.H .db
0
IGHEM 2000
Q
B
v
-
Hydrometrics Ltd.
Page 3 /14
… is discharge
… is breadth of flow cross-section
… is the mean vertical velocity in distance b from left bank, that comes from
velocity distribution curve v = f ( b )
Discharge Calculation (applied in closed circular cross-section)
2π R
Q=
R
r
φ
vb
∫0 ∫0 vb .dr.dϕ
… is cross-section radius
… is distance from the middle of cross-section
… is arm orientation angle from the vertical position
… is velocity in the point of polar coordinates [ϕ, r], that comes from velocity
distribution curve vb = f ( ϕ , r )
Velocity Distribution Curve is any suitable polynomical function that fluently connects measured point
velocities, resp. mean vertical velocities. In HYDRO11 computational module a set of cubic spline functions is
used for velocity distribution approximation. Spline functions are partial polynomical functions that are
connected in measuring points and have the same second derivation in this point. The algorithm using a set of
cubic spline functions is very stable for unlimited number of measuring points and for any distance distribution
of measuring points throughout the cross-section (unlike other polynoms of higher power, e.g. Newton‘s
interpolation polynom for non-equidistant spacing etc.). Partial cubic spline function that is applied for interval
from Xi to Xi+1 can be described by following general equation using variables x and y
y = ai .x2 + bi .x + ci
ai, bi, ci … are function parameters applied for partial interval Xi to Xi+1
This non-linear polynomical interpolation is valid in range from the first to the last measured point but it is also
necessary to describe velocity distribution curve near cross- section boundaries, i.e. between the first (or last)
measured point and flow cross-section bank, bottom or pipe wall. In this case the power approximation is used
for velocity calculation in accordance with recommendations of ISO 748 and ISO 3354. Velocity distribution
curve is defined by following equation
⎛ x⎞
y = Y1 .a.⎜⎜ ⎟⎟
⎝ X1 ⎠
1 /m
m … is boundary layer coefficient that usually varies between 2 and 14
Coefficient m depends on flow cross-section boundary hydraulic roughness. For purposes of discharge
calculation in HYDRO11 the value of this coefficient has been estimated according to shape of the first spline
polynom so that the two curves have the same derivation in connecting point.
Picture02.GIF
picture 2 : HYDRO11 - Approximation of Measured Point Flow Velocities by Spline Function
There are various methods for area A integration, including classical planimetry, simple arithmetical formulas,
numerical integration and also analytical solution of definite integral but only the two last ones could be taken
into account for precise calculation of discharge on computers. In addition to approximation type (oblong,
Simpson, Gauss, etc.), the accuracy of numerical integration depends mainly on the differential step count, so
increasing of step count causes increasing of accuracy but computing itself may take extremly long time. On the
IGHEM 2000
Hydrometrics Ltd.
Page 4 /14
other hand, the analytical solution of integral is exact and very fast. That is the reason why HYDRO11
computational module uses only this method in each calculation procedure. Following equation shows the
application of analytical solution in general form. The equation might be adapted in each particular case
depending on cross-section type.
n− 1 X i+ 1
X1
A = ∫ (a.x )dx+ ∑
m
i= 1
0
∫ (ai.x
X
3
+ bi.x2 + ci.x + di )dx =
i
X1
X i+ 1
n− 1
⎡ xm + 1 ⎤
⎡ x4
⎤
x3
x2
= ⎢ a.
+
a
.
+
b
.
+
c
.
+ di.x⎥
∑
i
i
⎥
⎢ i
4
3
2
i= 1 ⎣
⎣ m + 1⎦ 0
⎦ Xi
This algorithm – comparing to a numerical integration method - works very quickly on relative less powerful
PC-s as well and user will probably appreciate it if performing an interactive graphical editation of point
velocities when discharge changes are recalculated simultaneously with moving the measured point velocities
and /or surface velocity.
Picture03.GIF
picture 3 : HYDRO11 - Integration of Velocity Distribution Curve throughout Vertical Depth
Picture04.GIF
picture 4 : HYDRO11 - Integration of v-H Curve throuhgout Cross-Sectional Breadth
Picture05.GIF
picture 5 : HYDRO11 - Integration of Discharge in Closed Circular Cross-Section
Structure of Program Files
The essential part of the HYDRO11 system consists of two executable files EDITOR.EXE and HYDRO11.EXE.
Program's start up settings are stored in HYDRO11.INI initialization file, licence information is stored in
HYDRO11.USR user identification file. For storing all data necessary for discharge calculation, a structure of
data files is created for each particular "measuring project". This structure consists of ". MAK" (project
information file), ". PRF" (cross-section definition file), ". CAL" (calibration constants database), ". MER"
(measurement records data file) and ". BAK" (measurement records backup data file). The HYDRO11 EDITOR
application uses also two types of data-import files – " .VPN" (cross-section templates) and " .0XX" (userdefined measurement data import). In addition to these files, there are two output text files available for
exporting the measured data - IMPULSES.TXT (direct output from the Impulse Counter utility – pure matrix of
measured impulses) and TABLE.TXT (discharge measurement protocol) from the HYDRO11 Computational
Module.
Picture06.GIF
picture 6 : HYDRO11 - Structure of Program Files and I /O Interfaces
Executable Files
EDITOR.EXE
HYDRO11 EDITOR application is a well arranged set of sheets, panels and dialoque boxes that allow user to
prepare hydrometric measurement data for discharge computing. These data are then processed by means of
HYDRO11 Computational Module. EDITOR is full independent part of the software package and could be run
IGHEM 2000
Hydrometrics Ltd.
Page 5 /14
without HYDRO11 Computational Module (and even without MS WINDOWS environment in DOS full-text
regime). However, anytime it could be called from HYDRO11 environment.
Picture07.GIF
picture 7 : EDITOR.EXE - Program Menu Overview
There are several ways how to enter / import data into the EDITOR. As default, user can enter all the data
manually – using PC keyboard, but there are some cases where you can use also data import from text files (e.g.
cross-section templates) or automatic data (impulses) import from the Impulse Counter utility, that has been
integrated into the HYDRO11 EDITOR environment.
HYDRO11.EXE
is full WINDOWS application for hydrometric data processing, discharge computing and measured data export
and presentation. The application has been primarily designed for WINDOWS 95 and 98 environment. The
program consists of a main form (including working area, pop-up menus, list- and dialogue boxes) for graphics
displaying as well as several additional forms for table data output. HYDRO11 allows computing discharge,
drawing flow-velocity distribution curves and isolines, printing or exporting graphics and tabular outputs.
Picture08.GIF
picture 8 : HYDRO11.EXE - Program Menu Overview
Start–Up Files
HYDRO11.USR
User identification file HYDRO11.USR contains coded information on serial number, user’s company name and
address. It must be installed in the same directory with executable files. Executable files allways look for this file
during start and check the code information. If the information is incorrect or USR file does not exist, HYDRO11
software will automatically run in demonstration version. Demonstration version is identical with full working
version but does not allow you to create or edit data files. That means you can work with all existing data files
but cannot create new “measuring projects”, save changes in cross-section parameters, edit calibration constants
database and add, edit or erase measurement records. Demonstration version distributed with a set of sample data
files allows potencial user to try all functions and features offered by HYDRO11 software but disables its
commercial usage. To upgrade a demonstration version to full working version, simply copy the
HYDRO11.USR identification file into the working directory.
HYDRO11.INI
HYDRO11.INI---------------------------------Hydro11_Language = ENGLISH
Hydro11_Output_Editor = C:\DOS\QBASIC /EDITOR
Hydro11_K_Factor = 1
Editor_Language = ENGLISH
Editor_Back_Color = TRUE
Editor_Mouse_Cursor = TRUE
Editor_Impulse_Filter = TRUE
Editor_Filtration_Coefficient = 0.5
Editor_Transmit_Count = 96
Editor_Auto_Timer = 0
Editor_AX5214_Setting = 1000100
Editor_AX5214_Setting = 1000011
Editor_Counter_Matrix :
001,002,003,004,005,006,007,008,009,010,011
012,013,014,015,016,017,018,019,020,021,022
023,024,025,026,027,028,029,030,031,032,033
034,035,036,037,038,039,040,041,042,043,044
045,046,047,048,049,050,051,052,053,054,055
056,057,058,059,060,061,062,063,064,065,066
067,068,069,070,071,072,073,074,075,076,077
078,079,080,081,082,083,084,085,086,087,088
089,090,091,092,093,094,095,096,097,098,099
100,101,102,103,104,105,106,107,108,109,110
-------------------------------------------
IGHEM 2000
Hydrometrics Ltd.
Page 6 /14
Initialization file HYDRO11.INI is a text ASCII file containing various settings and parameters that are
automatically logged with every new start of executable files HYDRO11.EXE and EDITOR.EXE. Some of them
are read also in particular cases during run of the system. This file is not unconditionally necessary for running
the system, i.e. executable files will run without initialization file as well (with default settings) but creating
INI-file user can keep his own settings to be initialized with every next start. Initialization file may be created
and updated by means of arbitrary text editor or directly from HYDRO11 working desktop. Parameters and
settings included in the initialization file – in general - are related to program desktop environment as well as to
some special functions like Impulse Counter, Data Export, etc.
Structure of Data Files
Picture09.GIF
picture 9 : HYDRO11 - Structure of Data Files
FILENAME.MAK
Project Macro File containes all data file names related to the individual measuring project. Opening this file
from HYDRO11 environment all shared data files are automatically loaded as well.
SAMPLE_1.MAK---------------------------------sample_1.prf
constant.cal
sample_1.mer
----------------------------------------------
FILENAME.PRF
Cross-Section Definition File (sequential data file) containes location and measuring object description, crosssection parameters (cross-section type, measuring instrument, measuring method, etc.), cross-section definition
(geometrical shape and dimensions, measuring verticals resp. points distribution, etc.), current meters
identification matrix and other parameters.
FILENAME.CAL
Current Meters Calibration Constants Database (sequential data file) containes calibration constants of all
propeller current meters available. It is not necessary to create this file again and again for each particular
measuring project. User must prepare the database just once and this file can be included to each newly created
project. User just marks which current meter to use in which position (measuring point). This selection is defined
by current meters identification matrix in PRF file.
FILENAME.MER
Measurement Data File (random-access data file) containes all measurements carried out in the cross-section
defined in PRF file. This file includes measurement date and hour, meas. time, water depth and meas. points
distribution in each vertical (only for open cross-section types), propeller revolution count (resp. flow velocity)
for each meas. point, etc. All measurement saved in MER file have a fixed record length according to crosssection definition. In closed cross-section types, this record length comes from the constant number of measuring
points, in open cross-section types (where the number of measuring points on a vertical may vary) the record
length comes from the fixed number of measuring verticals and a maximum defined number of measuring points
per vertical (a mandatory parameter). Any of existing records can be chosen from the record-list in order to be
updated, saved as new record or erased.
FILENAME.BAK
Measurement Backup File that is the last backup copy of measurement (MER) file. This file is updated (or
automatically created if does not exist) anytime you make changes in MER file. It could be helpful, for example,
in case you have deleted some record and want to restore it back. Simply rename this BAK file to original MER
IGHEM 2000
Hydrometrics Ltd.
Page 7 /14
file name and load the project again. A backup data file name may not be included in macro file list. Its’ file
name automatically comes from measurement file name, just the extension is changed.
Data-Import Files
FILENAME.VPN
For some cross-section types, that are usually defined by a great number of definition points (open general and
open symmetrical), it is possible to prepare several cross-section templates (VPN files) that can be imported
directly into the cross-section definition table (EDITOR). This feature saves user's time while defining the crosssection geometry manually and is suitable especially for frequently used locations. User can create and / or
modify these templates himself.
FILENAME.0XX
This type of data-import file can be optionally used for measurement data imput as an alternative to manual data
input and / or the integrated Impulse Counter utility. For example, if any other software is used for current meter
impulses registration, this file represents a custom interface between the software and HYDRO11 EDITOR
application. This file format is usually modified for each particular user according to specific requirements –
upon request.
Data-Output Files
IMPULSES.TXT
This output text file is automatically created (or updated) if you want to save a pure propeller impulses matrix
from the Impulse Counter utility – without transfering the impulses into the measurement data sheet. To do this,
you do not have to open a measuring project – the measured impulses are allways saved as 11 x 10 matrix. This
feature might be helpful if you want to create several quick measurements without delay and it is an alternative
to a regullar measurement data record.
TABLE.TXT
This output text file containes a complete measuring protocol including point velocities, mean vertical / section
velocities, mean water level, discharge calculated, cross-sectional area, hydraulic radius, etc. If an external
output editor has been defined in initialization file, this external text editor can be called directly from
HYDRO11 environment and the document can be automatically opened, formated and / or printed within this
editor.
Creating New Measuring Project
Following comes the general description of creating new "measuring projects" within the HYDRO11 EDITOR
application. Several data sheets ane dialogue boxes may differ from project to project depending on cross-section
type and measuring method selected, but the procedure of building the data-files structure for each particular
project remains unchanged.
In the terminology used within HYDRO11, the term "measuring project" means a set of data files and
measurement records related to the particular location / object (that is defined as one of cross-section types
supported). Following are the mandatory steps necessary for thr project definition :
-
definition of project's data file-names
cross-section parameters setting
cross-section geometry and dimensions definition
preparing calibration constants database (if not existing)
propeller current meters assignment
setting the ratio between impulses and propeller revolutions
creating measurement data records
IGHEM 2000
Hydrometrics Ltd.
Page 8 /14
Definition of Project's Data File-Names
Picture10.GIF
picture 10 : HYDRO11 EDITOR - Definition of a New Project
The project's data file-names are usually identical to the project macro file (MAK), except for the calibration
constants database, that is usually common for several projects. All types of data files (i.e. PRF, CAL, MER) are
stored in the project macro file (MAK) and the access is automatically established by loading the macro file into
the HYDRO11 environment. Once the measuring project has been defined (or opened), all data sheets and values
are automatically accessed to the appropriate data files when saving changes during the project definition
process. This accessibility is fully controlled by the EDITOR itself.
Cross-Section Parameters Setting
Picture11.GIF
picture 11 : HYDRO11 EDITOR - Cross-Section Parameter Settings
Before starting geometry definition, it is necessary to select a cross-section type, measuring method, measuring
equipment as well as some additional parameters that explicitly define the cross-section itself and also the
appearance of all forms and tables for data input. The appearance of "Parameter Settings" dialogue box
dynamically changes according to the cross-section type selected, because some parameters may not be
accessible for other cross-section types, etc. Due to this feature, user simply cannot set any unlogical parametercombination that makes no sense in the selected context.
Cross-Section Geometry and Dimensions Definition
This is the essential phase of the cross-section definition process that may influence the total uncertainty of the
discharge calculation. To define the cross-section properly, it is necessary to take into account the basic rules
(conventions) for the geometry input. Generally, the cross-section shape can be defined either by entering inside
dimensions in case of regular cross-section types (breadth, height – rectangular type, diameter – circular type) or
by a set of coordinates in case of irregular types (open general, open symmetrical). If using the coordinates,
measuring verticals must be defined in the same coordinate system as the cross-section itself. It is also very
important to preciously define, how and where the water level is measured (open cross-section types), etc. In
addition to these basic conventions, there are some specific limits and restrictions for each particular type
described in the comprehensive User's Manual. Following are some figures and HYDRO11 EDITOR
screenshots for each cross-section type that describe it's geometry definition :
Picture12a.GIF
picture 12a : Open Rectangular Cross-Section Definition Schema
Picture12b.GIF
picture 12b : HYDRO11 EDITOR - Open Rectangular Cross-Section Definition Sheet
Picture13a.GIF
picture 13a : Open Circular Cross-Section Definition Schema
Picture13b.GIF
picture 13b : HYDRO11 EDITOR - Open Circular Cross-Section Definition Sheet
IGHEM 2000
Hydrometrics Ltd.
Page 9 /14
Picture14a.GIF
picture 14a : Open Symmetrical Cross-Section Definition Schema
Picture14b.GIF
picture 14b : HYDRO11 EDITOR - Open Symmetrical Cross-Section Definition Sheet
Picture15a.GIF
picture 15a : Open Non-Symmetrical (General) Cross-Section Definition Schema
Picture15b.GIF
picture 15b : HYDRO11 EDITOR - Open Non-Symmetrical (General) Cross-Section Definition Sheet
Picture16a.GIF
picture 16a : Closed Rectangular Cross-Section Definition Schema
Picture16b.GIF
picture 16b : HYDRO11 EDITOR - Closed Rectangular Cross-Section Definition Sheet
Picture17a.GIF
picture 17a : Closed Circular Cross-Section Definition Schema
Picture17b.GIF
picture 17b : HYDRO11 EDITOR - Closed Circular Cross-Section Definition Sheet
Preparing Calibration Constants Database
In order to calculate flow velocity in each measuring point, you have to define calibration constants for each
propeller current meter used in the measuring cross-section. HYDRO11 software allows you to create and use
one common database of calibration constants (CAL data file including all current meters available) for all your
“measuring projects”, so that you do not have to input these constants again and again when creating new
projects. However, you can optionally create a new CAL file whenever you start a new project.
Picture18.GIF
picture 18 : HYDRO11 EDITOR - Calibration Constants Database Sheet
The database of calibration constants might be periodically updated whenever you provide new calibration of
propeller current meters. That is the reason why it is recommended to archive the current version of the CAL file
together with each “measuring project” related. If you open any older project with recently updated calibration
database, the newly calculated velocities will – of course - differ from original values.
Propeller Current Meters Assignment
In following step it is necessary to select which current meters (from the calibration constant database) will be
used in the cross-section defined. For each measuring point of the cross-section you have to assign a unique
propeller identification number into the propeller identification matrix. The format of identification numbers
must correspond with identificators that have been used in the database of calibration constants (matching
upper/lowercases).
Picture19.GIF
picture 19 : HYDRO11 EDITOR - Propeller Identification Sheet
IGHEM 2000
Hydrometrics Ltd.
Page 10 /14
Setting the Ratio between Impulses and Propeller Revolutions
There are some older types of propeller current meters, still being used in hydrometry, that can be set to a
different ratio of revolutions and electrical impulses (1:1, 2:1, 4:1, etc). The impulse transfer rate matrix allows
user to define (if necessary) for each particular current meter the total number of revolutions that will generate
one single electrical impulse. The default setting is “one impulse per one revolution”. A valid range includes all
integer numbers higher then 0.
For evaluation of flow velocities a specific revolution count (number of revolutions per second) is calculated.
The total count of propeller revolutions for each particular measuring point is equal to the number of impulses
multiplied by impulse transfer ratio. Specific revolution count is equal to the total count divided by integration
time period.
Creating Measurement Data Records
Once the cross-section has been completly defined, user can create a set of measurement records that are related
to the currently opened measuring project. The measurement data sheet appearance depends (in general) on the
cross-section type selected (open, closed), measuring method (point, integration) and measuring equipment
selected (propeller current meter, electro-magnetic current meter). Measuring records (in contrast to crosssection parameters) are stored in a random access data file (MER) that allows saving new records, as well as
opening , modifying and deleting existing records. There are three basic types of measurement data sheets :
-
open cross-section type / point velocity method
closed cross-section type / point velocity method
integration method
However, each of these basic data sheet types may have several additional variations according to cross-section
parameters and options selected – for example entering propeller revolutions or entering directly the point
velocities, entering measuring points by verticals or by horizontals, entering directly water depth or water level
in the selected coordinate system, etc.
Generally, for open cross-section type you must define water level, distribution of measuring points and
propeller revolutions (point velocities) for each particular vertical. For closed cross-section type, just a
revolutions (point velocities) matrix is entered, because the measuring points are fixed within the cross-sectional
area. In case of the integration method, only the mean vertical velocity is measured in each vertical, but there is
an option to take into account the bottom-point velocities, as well... In the comprehensive User's Manual, there is
a full description of all measurement data-sheet templates available in the HYDRO11 EDITOR application.
Following are some screenshots of the three basic measurement data sheets described above :
Picture20a.GIF
picture 20a : Definition of Measuring Points on Vertical
Picture20b.GIF
picture 20b : HYDRO11 EDITOR - Measurement Data Sheet (Open Cross-Section / Point Velocity Method)
Picture21.GIF
picture 21 : HYDRO11 EDITOR - Measurement Data Sheet (Closed Cross-Section / Point Velocity Method)
Picture22.GIF
picture 22 : HYDRO11 EDITOR - Measurement Data Sheet (Integration Method)
For each particular measurement record, a current date, time, measurement number and measurement time must
be entered before saving the record. Records are sorted in ascending order by the creation time. The number of
measurement records per measuring project is not limited.
IGHEM 2000
Hydrometrics Ltd.
Page 11 /14
Impulse Counter Utility
Impulse Counter Panel is relative indepenent part of the EDITOR application that is integrated into the program
environment. In connection with a special hardware equipment, it allows automatic registration of propeller
current meter revolutions (resp. electrical impulses) and also automatic transmission of measured impulses
directly into the measurement data sheet. The hardware equipment for automatic data registration consists of
standard internal DI/O modules AXIOM AX5214 with external opto-isolated D/I module AX754 and a special
hardware extension for elimination of water self-conductivity, developed by Hydrometrics Ltd.
Picture23.JPG
picture 23 : Hardware Equipment for Automatic Data Registration
The Panel containes 11 columns and 10 rows of single impulse counters that are numbered from 1 to 110. For
each single counter, a space of five numerical characters is reserved on the screen (valid range of impulse count
is 0 to 99999). In this version of the software, user can use up to 96 current meters simultaneously connected to
the hardware interface. Impulse Counter allows processing and displaying measured data from all 96 binary
input channels in real time.
Picture24.GIF
picture 24 : HYDRO11 EDITOR - Impulse Counter Panel
Impulse counter timer, that is related to internal PC system timer, allows automatic stopping of impulse
integration after a pre-defined time period (measuring time). In addition to this, the Impulse Counter allows also
automatic starting and stopping the timer by means of external relay (or two relays). This feature is available
only for the integration measuring method, where the timer could be synchronized with a moving construction,
or a capstan motor.
After the timer has stopped, the matrix of measured impulses can be transfered directly into the opened
measurement data sheet. In this case, the current system date, system time and measuring (integration) time is
automatically generated into the measurement record header, so it is not necessary to enter it manually. There are
several ways (regimes) how to transfer the measured impulses into the EDITOR's measurement data sheet :
-
if using a single current meter, the Impulse Counter is started for each particular measuring point and each
time the Counter stops, just a single value is transfered into the appropriate position in data sheet.
-
if using a set of current meters on a portable hydrometrical rod, the Impulse Counter is started for each
particular measuring vertical and each time the Counter stops, a set of values is transfered at once into the
appropriate vertical position in data sheet
-
if using a complete set of current meters that are fixed within the cross-section, all measuring points are
measured simultaneously and the entire matrix of measured impulses is transfered at once into the data sheet
-
if using two (or more) complete sets of current meters that are fixed parallely in two (or more) identical
cross-sections, all measuring points are measured simultaneously (it is not necessary to start the Counter
several times) and the measured values are logically redistributed from the single Impulse Counter panel
into all cross-sections at once
Accessing Binary Inputs
On the Impulse Counter Panel, each binary input channel might be displayed at its own Counter position. If
keeping the default setting, a number of each physical input channel corresponds with the counter position on the
screen. However, the EDITOR application allows you to re-arrange this setting, i.e. to change the logical order
of binary inputs regardless of hardware-interface connection order of propeller current meters. The current
IGHEM 2000
Hydrometrics Ltd.
Page 12 /14
setting is saved in HYDRO11.INI initialization file as Editor_Counter_Matrix. This matrix determines
which input channel will be displayed on a particular counter position. To change the order, you can edit the
matrix manually inside the initialization file, or directly within the Binary Input Access Panel. This feature might
be helpful in case you have connected a set of propeller current meters to the hardware interface at random order
and want to re-arrange these inputs into the logical order directly on the PC screen.
Impulse Filtration
The principle of this Impulse Counter version (in connection with the AX5214 digital input module and AX754
opto-isolated modules) is based on continual checking of each input channel’s status in a permanent loop , while
the Counter timer is switched ON. For each active input channel, the status course is continually evaluated and
each new impulse is generated in case “contact ON” status changes to “contact OFF” status. The EDITOR
application allows you to create a digital (binary) record of any input channel’s status course and to save it into
an ASCII data file.
1.BIN -----------------------------------------------------------------------000000000000000000001111111111111111111111000000000000000000000000000000000000
000001111111111111111111100000000000000000000000000000000000000011111111111111
111111111100000000000000000000000000000000000000000111111111111111111111111100
------------------------------------------------------------------------------
If using older type of propeller current meters with a mechanical contact, this feature may help you to detect
whether a multiple false impulse is generated during single approach of mechanical contact. To eliminate this
negative phenomenon in order to avoid errors, a software filtration of electrical impulses should be activated.
Example of continuous electrical impulse, typical for magnetic contact type current meter (software filtration not
necessary) :
-----------------------------------------------------------------------------000000000000011111111111111111110000000000000000000000000000011111111111111111
------------------------------------------------------------------------------
Example of interrupted electrical impulse, typical for mechanical contact type current meter (software filtration
recommended) :
-----------------------------------------------------------------------------000000000000011011111111111111110000000000000000000000000000011101111111111111
------------------------------------------------------------------------------
Discharge Calculation
Once the measuring project's data has been prepared within the EDITOR module, finally a discharge calculation
can be executed by means of HYDRO11 Computational module. This module supports full visualization of all
steps of the calculation process and allows user to influence the total accuracy of discharge evaluation, i.e.
enables an interactive approach in the phase of drawing velocity distribution curves. This visualization may help
user to recognize eventual discontinuities in velocity distribution curves (that might be caused by measuring
instrument failure, flowing impurities, etc.) and to make some corrections, if necessary. The corrections of
measured point velocities, as well as corrections of surface velocity estimation, can be handled graphically using
the mouse pointer directly on the screen. Discharge corrections, caused by graphical editation, are displayed
simultaneously. For each currently opened measurement record, the point velocity corrections can be saved back
into the appropriate MER file.
Picture25.GIF
picture 25 : HYDRO11 - Velocity Distribution Curves by Verticals
IGHEM 2000
Hydrometrics Ltd.
Page 13 /14
Picture26a.GIF
picture 26a : Correction of Measured Point Velocity
Picture26b.GIF
picture 26b : Correction (Estimation) of Surface Velocity
Using a graphical integration of velocity distribution curves, the mean flow velocity is calculated for each
particular measuring vertical. Based on these mean velocities, a v-H curve – as a result of multiplication of flow
velocity and water depth – is integrated throughout the cross-sectional breadth. This is the most common case of
discharge evaluation, where the velocities are measured by verticals, however, there are some special cases
where the calculation differs from this model - for example closed circular cross-section (velocity distribution
curves integrated by arms), or integration method (velocity distribution curves by verticals are missing), etc.
Anyway, all the graphs related to a particular measurement, are accessible by scrolling the current graphic page
of HYDRO11 main form.
Picture27.GIF
picture 27 : HYDRO11 - Velocity Distribution Curve / v-H Curve throughout Cross-Sectional Breadth
In addition to displaying the velocity distribution curves and discharge calculation (that is the primary function
of the program), there are several graphical and tabular outputs available here, as well :
-
drawing the cross-section
drawing the equidischarge strips
drawing the velocity isolines
measurement protocol
calibration constants
cross-section parameters and dimensions
Picture28.GIF
picture 28 : HYDRO11 - Cross-Sectional Shape Drawing
Picture29.GIF
picture 29 : HYDRO11 - Equidischarge Strips Drawing
Picture30a.GIF
picture 30a : HYDRO11 - Velocity Isolines Drawing (Open General Cross-Section)
Picture30b.GIF
picture 30b : HYDRO11 - Velocity Isolines Drawing (Open Rectangular Cross-Section)
Picture30c.GIF
picture 30c : HYDRO11 - Velocity Isolines Drawing (Open Circular Cross-Section)
Picture30d.GIF
picture 30d : HYDRO11 - Velocity Isolines Drawing (Closed Circular Cross-Section)
IGHEM 2000
Hydrometrics Ltd.
Page 14 /14
Picture31a.GIF
picture 31a : HYDRO11 - Measurement Protocol Example (Open Cross-Section)
Picture31b.GIF
picture 31b : HYDRO11 - Measurement Protocol Example (Closed Cross-Section)
The HYDRO 11 software is available for MS WINDOWS 95 / 98 platforms and there are no special hardware
requirements for the installation. The program is available for free distribution as a demonstration version
including a set of sample data files. Demo-version allows full access to all functions and features, however,
creating new projects as well as saving changes within the existing ones has been temporary locked here. To
make it full-working version, a coded licence file is required, that is available optionally as “full licence” (both
open & closed cross-section types) or “reduced licence” (open cross-section types only / closed cross-section
types only). At run-time, the program can be switched optionally to one of four languages (English, German,
Slovak, Czech) that are supported in a standard version.
Related International Standards
ISO 748
ISO 772
ISO 1088
ISO 1100
ISO 2537
ISO 3354
ISO 3454
ISO 3455
ISO 4366
ISO 4369
ISO 4373
ISO 4375
ISO 5168
ISO 7194
ISO 9196
Measurement of liquid flow in open channels. Velocity – area methods.
Measurement of liquid flow in open channels. Vocabulary and symbols.
Collection of data for determination of errors in measurement of liquid flow by
velocity – area methods.
Measurement of liquid flow in open channels. Establishment and operation of a
gauging station. Determination of a stage - discharge relation.
Measurement of liquid flow in open channels. Rotating element current meters.
Measurement of clean water flow in closed conduits. Velocity – area method using
current meters in full conduits and under regular flow conditions.
Measurement of liquid flow in open channels. Direct depth sounding and suspension
equipment.
Measurement of liquid flow in open channels. Calibration of rotating element current
meters in straight open tanks.
Echo sounders for water depth measurements.
Measurement of liquid flow in open channels. Moving boat method.
Measurement of liquid flow in open channels. Water level measuring devices.
Measurement of liquid flow in open channels. Cableway systems for stream gauging.
Estimation of the uncertainty of a measurement of flowrate.
Measurement of liquid flow in closed conduits. Velocity – area methods of flow
measurement in swirling or asymmetric flow conditions in circular ducts by means of
current meters or Pitot tubes.
Measurement of liquid flow in open channels. Flow measurements under ice
conditions.