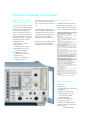
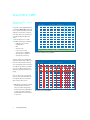
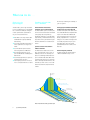
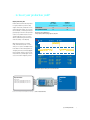
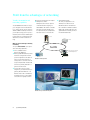
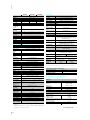
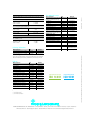
1
Spectrum Analyzer R&S FSU
The new high-end spectrum analyzer with unmatched performance
Features
Speed
Unmatched performance
Versatile resolution filters
◆ Gaussian, FFT, channel, RRC
Comprehensive test routines
◆ TOI, OBW, CCDF
◆ Channel power, ACPR
◆ ACPR in time domain
Full choice of detectors
◆ Auto Peak, Max Peak, Min Peak,
Sample, RMS, Average, Quasi Peak
◆ Fast ACP test routine in time domain
◆ User-configurable list for fast measurements at frequencies of interest
◆ Up to 60 measurements/s in time
domain via IEC/IEEE bus
(including trace data transfer)
Unmatched dynamic range
◆ TOI typ. +25 dBm
◆ 1 dB compression +13 dBm
◆ Phase noise
typ. –123 dBc/Hz at 10 kHz offset
typ. –160 dBc/Hz at 10 MHz offset
◆ Excellent display linearity <0.1 dB
◆ 84 dB ACLR/3GPP with noise correction
Optional electronic attenuator
GSM/EDGE
Code domain power for 3GPP
Milestones
The name Rohde&Schwarz has been synonymous with innovative spectrum analyzers since 1986, the unique features of
which have repeatedly set standards in
this technology. Examples are the analyzers of the R&S FSE and R&S FSIQ families.
The Spectrum Analyzer R&S FSU is
another milestone. New circuit concepts,
advanced RF components, A/D converters and ASIC technology, extensive experience gained from a variety of applications and customer requirements – all
this combines to form a solid basis on
which the R&S FSU was developed. Its
unparalleled features enable the use of
new test methods – to your advantage.
The future-oriented concept combines
unprecedented performance with continuity. The R&S FSU is compatible with the
R&S FSE and R&S FSIQ, the industry standards to date. Test routines and
sequences generated for the R&S FSE or
R&S FSIQ can be used on the R&S FSU
too. The R&S FSU family thus secures
your investment.
The operating concept of the top analyzer
R&S FSU is the same as that of the general-purpose analyzer R&S FSP, so these
instruments offer a uniform platform for a
variety of applications.
The R&S FSU family
R&S FSU3
20 Hz to 3.6 GHz
R&S FSU8
20 Hz to 8 GHz
R&S FSU26
20 Hz to 26 GHz
2
Spectrum Analyzer R&S FSU
Rohde&Schwarz innovation
in spectrum analyzers
1986
1995
1996
1997
1998
R&S FSA – first colour display,
first spectrum analyzer to feature
–154 dBm (6 Hz) displayed average noise level without the use of
preamplifiers, quasi-continuously
variable resolution bandwidths,
phase noise optimization
R&S FSE – fastest analyzer
R&S FSE – first spectrum analyzer with RMS detector
R&S FSE-B7 – universal vector
signal analysis and spectrum
analyzer capability combined for
the first time
R&S FSIQ – first analyzer offering 75 dB dynamic range for
UMTS/WCDMA ACLR measurements
1999
2000
2001
R&S FSP – 0.5 dB total measurement uncertainty as standard,
fast ACP test routines in time
domain, digital channel filters,
CCDF
R&S FSP-B25 – first electronic
attenuator for wear-free use in
production
R&S FSU – 0.3 dB total measurement uncertainty, 50 MHz resolution bandwidth, +25 dBm TOI
Performance surpassing all expectations
R&S FSU – ideal for signals
requiring wide dynamic range
The R&S FSU even surpasses the proven
excellent RF data of the R&S FSE and R&S
FSIQ families. Measurements calling for
an extremely wide dynamic range
become even simpler, faster and more
reliable – in development, quality management and production. The R&S FSU
can rightly be called the new reference in
spectrum analysis, with an unprecedented dynamic range:
◆ TOI >20 dBm, typ. +25 dBm
◆ 1 dB compression
(0 dB RF attenuation): +13 dBm
◆ Displayed average noise level:
–158 dBm (1 Hz bandwidth)
◆ 77 dB ACLR typ. for 3GPP,
84 dB typ. with noise correction
◆ HSOI 55 dBm typ.
◆ Phase noise: –160 dBc/Hz typ.
at 10 MHz carrier offset
These characteristics make it easy to find
small spurious signals even in the presence of strong carriers (e.g. at a base station).
For 3GPP adjacent-channel power measurements, a figure of 84 dB ACLR allows
good adjacent-channel power ratios to be
verified and demonstrated very simply
and with high accuracy. Build your
node B better than others, and prove it.
The high harmonic second-order intercept
point means optimum dynamic range for
multichannel cable TV measurements.
Wealth of functions
The R&S FSU is launched with the most
abundant functionality available on the
spectrum analyzer market. All major functions come straight away in the basic unit:
Highly selective digital filters from 10 Hz to 100 kHz
Fast FFT filters from 1 Hz to 30 kHz
Channel filters from 100 Hz to 5 MHz
RRC filters
1 Hz to 50 MHz resolution bandwidth
QP detector and EMI bandwidths 200 Hz, 9 kHz,
120 kHz
2.5 ms sweep time in frequency domain
1 µs sweep time in time domain
Number of measurement points/trace selectable
between 155 and 10001
Time-selective spectrum analysis with gating function
GPIB interface, IEEE 488.2
RS-232-C serial interface, 9-pin SUB-D connector
VGA output, 15-pin SUB-D
PC-compatible screenshots on diskette or hard disk
Up to 20 measurements/s in manual mode
Up to 30 measurements/s on GPIB interface
SCPI-compatible GPIB command set
R&S FSE/R&S FSIQ-compatible GPIB command set
Fast ACP measurement in time domain
Statistical signal analysis with CCDF function
RMS detector of 100 dB dynamic range
Transducer factor for correcting antenna or cable
frequency responses
2-year calibration cycle
3-year warranty1)
External reference from 1 MHz to 20 MHz in 1 Hz
steps
GSM/EDGE modulation measurements (with option
R&S FS-K5)
1)
Except parts subject to wear and tear (e.g. attenuators)
Ready today for tomorrow
Functions like
◆ CCDF analysis
◆ Fast ACP measurement in time domain
◆ RMS detector
◆ Selection of filter characteristic
◆ Recording and readout of up to
2 x 512 ksamples of IQ data
(8 MHz RF bandwidth)
◆ High measurement accuracy
◆ Excellent display linearity
and features like 50 MHz bandwidth
mean that the R&S FSU is ready now for
tomorrow’s needs.
Spectrum Analyzer R&S FSU
3
Shorter development cycles through versatile functions …
The most versatile resolution filter characteristics and largest bandwidth found
in a spectrum analyzer:
To handle the wide variety of measurement tasks in product development, an
instrument must offer ample functionality
and excellent performance in all areas of
interest. The R&S FSU fully meets these
requirements.
◆ Standard resolution filters from
10 Hz to 50 MHz in steps of 1, 2, 3, 5
◆ FFT filters from 1 Hz to 30 kHz
◆ 32 channel filters with bandwidth
from 100 Hz to 5 MHz
◆ RRC filters for NADC and TETRA
◆ EMI filters: 200 Hz, 9 kHz, 120 kHz
Full choice of detectors for adaptation to a
wide range of signal types (Fig. 1):
◆
◆
◆
◆
◆
◆
◆
RMS
Auto Peak
Max Peak
Min Peak
Sample
Average
Quasi Peak
1
Full range of analysis functions:
◆ Time-domain power in conjunction
with channel or RRC filters makes the
R&S FSU a fully-fledged channel
power meter (Fig. 2)
◆ TOI marker (Fig. 3)
◆ Noise/phase-noise marker
◆ Versatile channel/adjacent-channel
power measurement functions with
wide selection of standards,
user-configurable (Fig. 4)
◆ Split-screen mode with
selectable settings
◆ CCDF measurement function (Fig. 5)
◆ Peak list marker for fast search of all
peaks within the set frequency range
(search for spurious)
2
3
4
5
4
Spectrum Analyzer R&S FSU
…wide dynamic range and future-proof performance
Whether in synthesizer development or
front-end design, additional applications
add to the R&S FSU functionality while
user-friendliness is maintained:
Phase noise
measurement
with Software
R&S FS-K4
Phase Noise Measurement Software
R&S FS-K4 automates measurement
over a complete offset frequency range
and determines residual FM from the
phase noise characteristic. This in conjunction with the R&S FSU’s extremely
low phase noise generally does away
with the need for an extra phase noise
measurement system, which can be difficult to operate anyway.
Noise Measurement Software R&S FS-K3
is a convenient way to determine the noise
figure of amplifiers and frequency-converting UUTs throughout the R&S FSU’s
frequency range, so enabling complete
documentation. The high linearity and
extremely accurate power measurement
routines of the R&S FSU deliver precise
and reproducible results. So why bother
with a noise figure meter.
phase noise dBc/(1 Hz)
-70
-80
-90
-100
-110
-120
-130
-140
-150
-160
-170
SSB phase
noise of
R&S FSU
specification
typical
0.1
1
10
100
1000
carrier offset /kHz
10000
Noise figure
measurement
with Software
R&S FS-K3
Fast and simple analysis of anomalies: the cause
– spurious or RFI – can easily be traced with the
basic analyzer function without additional
measuring equipment
Spectrum Analyzer R&S FSU
5
From GSM to UMTS…
From GSM to UMTS – ready for
3G mobile radio
Ref
%
In conjunction with GSM/EDGE Application Firmware R&S FS-K5, the R&S FSU
offers complete functionality for RF and
modulation measurements in GSM systems. EDGE, which is the generation 2.5,
is already included inthe R&S FS-K5
option.
◆ Phase/frequency error for GSM
◆ Modulation accuracy for EDGE with:
– EVM and ETSI-conformant
weighting filters
– OOS
– 95:th percentile
– Power versus time with
synchronization to midamble
– Spectrum due to modulation
– Spectrum due to transients
The above features plus wide dynamic
range make the R&S FSU an ideal tool in
base station development and testing.
This is enhanced by excellent characteristics ready incorporated in the standard
unit, e.g. <0.3 dB total measurement
uncertainty, gated sweep and IF power
trigger.
3 dBm
Att
20 dB
Marker 1 [T1]
0.110 %
504.176400 µs
SWT 524.25 µs
40
SUMMARY [T1]
PEAK HLD
1.157
PEAK AVG
0.642
RMS HLD
0.362
RMS AVG
0.262
FREQ HLD
164.55
FREQ AVG
163.53
OOS
HLD
39.70
OOS
AVG
43.59
PERC HLD
0.630
PERC AVG
0.510
36
1 SA
CLRWR
2 PK
MAXH
3 MI
MINH
32
28
24
%
%
%
%
Hz
Hz
dB
dB
%
%
TRG
PRN
20
16
12
8
4
1
0
Center 890.2 MHz
52.43 µs/
Measurement of modulation accuracy on EDGE burst
Power versus Time
Ref
* Att
0 dBm
5 dB
SWT 4.837 ms
POWER [T1]
10
LIMIT CHECK
PVTU_E8A
POS
0 dBm
0
1
1 RM
AVG
2 PK
MAXH
3 MI
MINH
Marker 1 [T1 ]
-4.21 dBm
409.965607 µs
PASS
PVTU_E8B
-10
-20
-30
PRN
Even in its basic version, the R&S FSU
offers the functionality and characteristics needed to develop, verify and produce 3G mobile radio systems:
◆ RMS detector, provided as standard
in Rohde&Schwarz analyzers for
many years and allowing accurate
power measurements independently
of signal form; 3GPP specifications
stipulate RMS power measurements
for most tests
6
Spectrum Analyzer R&S FSU
EXT
-40
SWP
100 of
100
-50
-60
SWP
100 of
100
-70
-80
PVTL_E8A
T1
T2
PVTL_E8B
-90
Center 1 GHz
Measurement of power ramp on EDGE burst
483.7 µs/
…ready for 3G mobile radio
◆ ACP measurement function for 3GPP
with 3.84 MHz bandwidth RRC filter
for standard-conformant adjacentchannel power measurements with a
dynamic range limit of 77.5 dB
◆ Dedicated CCDF measurement function that determines the probability of
instantaneous signal power exceeding average power. CCDF measurement is indispensable to determine
optimum transmit power for CDMA
signals, assuming that clipping at
known, short intervals is tolerable.
dBc
-50
-55
ACLR
-60
-65
total
ACLR
-70
-75
-85
phase
noise
-90
Standard 3GPP modulation and
code domain power measurements
spectrum
regrowth
thermal
noise
-80
-20
-15
-10
-5
mixer level
0
dBm
Dynamic range of R&S FSU for adjacent-channel power measurement on WCDMA signal without noise
correction
◆ For BTS/node B signals: Application
Firmware R&S FS-K72
◆ For UE signals: Application Firmware
R&S FS-K73
◆ High measurement speed of 4 s/measurement
◆ Code domain power and CPICH power
◆ EVM and PCDE
◆ Code domain power vs. slot
◆ EVM/code channel
◆ Spectrum emission mask
WCDMA code domain power measurement with R&S FSU and R&S FS-K72
Spectrum Analyzer R&S FSU
7
What can we do …
Short test cycles,
high throughput
Downtime and repair time
cut to a minimum
Another step enhancing the reliability of
your test system!
The R&S FSU is just the right instrument
for this. Fast data transfer on the IEC/IEEE
bus or an Ethernet LAN plus intelligent
routines optimized for speed make for
very short measurement times:
Limited lifetime of mechanical
attenuators due to high throughput
The R&S FSU-B25 option solves this problem. The electronic attenuator with 25 dB
setting range does away with any
mechanical switching – so the R&S FSU’s
high accuracy is maintained without any
early failure. A two-year calibration cycle
minimizes downtime for instrument calibration.
Existing programs for R&S FSE, R&S FSIQ
or R&S FSP can be used on R&S FSU
The R&S FSU complies with SCPI conventions and is IEC/IEEE-bus-compatible with
respect to the R&S FSE and R&S FSIQ.
These instruments can in most cases be
directly replaced with no or only minor
changes to the software. If changes have
to be made, they affect only those program parts that concern the speedoptimized measurement routines of the
R&S FSU.
◆ FAST ACP: for the major mobile radio
standards with high reproducibility
and accuracy
◆ List mode: combined measurement of
various parameters at a single command
◆ Fast time domain power measurement using channel or RRC filters
◆ Up to 60 measurements/s in zero
span via IEC/IEEE bus including trace
data transfer
◆ Fast-sweeping FFT filters for spurious
measurement at low levels
◆ Fast frequency counter: 0.1 Hz resolution for a measurement time of <30 ms
Spurious emission measurements
without notch filter
The R&S FSU is an ideal choice for this
type of measurement, even for tests on
GSM base stations. The extremely low
phase noise and high 1 dB compression
point of the R&S FSU enable direct measurements without the use of extra automatic or manually tuned notch filters. This
eliminates possible sources of error and
makes measurements simpler and more
reliable.
External frequency standards
The R&S FSU accepts signals between
1 MHz and 20 MHz in steps of 1 Hz.
Probability
density
Yield for 1 dB
total measurement uncertainty
Additional yield for 0.3 dB
total measurement uncertainty
-1.5
-1
-0.3
Deviation from
mean power [dB]
+0.3
1
2
3
Tole
ran
ce
lim
it
4
5
Tes
6
tm
arg
in
7
8
9
10
11
12
13
Production sample
Effect of measurement uncertainty on production yield
8
Spectrum Analyzer R&S FSU
…to boost your production yield?
Higher production yield
Enhanced measurement accuracy makes
for higher production yield. The safety
margins that usually compensate for the
measurement uncertainty of test systems
can be reduced, so increasing the accept
(passed) region. Given the same spread of
results, more products will pass the test.
The R&S FSU helps you boost your production yield featuring a total measurement uncertainty of <0.3 dB (2σ).
ASCII format
Binary IEEE754 format
Sweeps/s
span 10 MHz,
sweep time 2.5 ms
30
50
Sweeps/s
span 0 Hz,
sweep time 100 µs
40
60
Measurement speed on GPIB interface
Settings: display off, default coupling, single trace, 625 points
Ref
6 dBm
Att
20 dB
SWT
100 ms
0
With 30 measurements/s in manual
mode, minimum sweep time of 2.5 ms
and 1 µs zero span as standard, the R&S
FSU is ideal for time-critical applications.
The highly selective, fast-sweeping digital
filters featuring "analog response" allow
measurements on pulsed signals as well
as use of the built-in frequency counter.
-10
A
SGL
-20
1 RM * -30
CLRWR
-40
-50
-60
-70
-80
PRN
-90
Center 2.1175 GHz
Tx Channel
Power
EXT
10 ms/
-0.01 dBm
Bandwidth
3.84 MHz
Adjacent Channel
Lower
Upper
-56.49 dBc
-56.45 dBc
Bandwidth
Spacing
3.84 MHz
5 MHz
Alternate Channel
Lower
Upper
-57.10 dBc
-57.02 dBc
Bandwidth
Spacing
3.84 MHz
10 MHz
Measurement of adjacent-channel power versus time: FAST ACP
Input command
SENSE:LIST:POW
100MHz,-0dBm,10dB,10dB,NORM,1MHz,3MHz,434us,0,
200MHz,-20dBm,10dB,0dB,NORM,30kHz,100kHz,1ms,0,
300MHz,-20dBm,10dB,0dB,NORM,30kHz,100kHz,1ms,0;
Output FSU
-28.3,
-30.6,
-38.1
Remote control of R&S FSU via IEC/IEEE bus in list mode cuts down on measurement times
Spectrum Analyzer R&S FSU
9
Profit from the advantages of networking
Versatile documentation and
networking capabilities
The standard disk drive makes it easy for
you to integrate results into documentation – simply save the screen contents as
a BMP or WMF file and import them into
your word processing system. To process
trace data, save them as an ASCII file (CSV
format), which not only documents trace
data but also the main instrument settings.
Make use of the advantages offered by
networking
The option R&S FSU-B16 opens up versatile networking capabilities:
◆ Link to standard network
(Ethernet 10/100BaseT)
◆ Running under Windows NT, the R&S
FSU can be configured for network
operation. Applications like data output to a central network printer or
saving results on a central server can
easily be implemented. The R&S FSU
can thus be optimally matched to a
given work environment.
◆ You can import screen contents
straight into your documentation programs by Word for Windows or an
MS Excel macro and so immediately
create data sheets for your products
or documents for quality assurance.
Remote control by Ethernet is even simpler:
◆ PCAnywhere software:
PCAnywhere allows mouse operation
of the R&S FSU after assigning it a
TCP/IP address. All elements of the R&S
FSU screen are represented by a soft
front panel function; the complete R&S
FSU screen shows on the remote PC.
Server
Printer
FSU remotely controlled
PC with PCAnywhere
R&S FSU
R&S FSU in networked operation
R&S FSU remotely controlled with PCAnywhere
10
Spectrum Analyzer R&S FSU
◆ Special RSIB interface
This links your application to the
TCP/IP protocol and acts like an
IEC/IEEE-bus driver. The RSIB interface is available for Windows and the
UNIX world. The R&S FSU can be programmed via this interface just like on
the familiar IEC/IEEE bus.
Specifications
Specifications apply under the following conditions:
30 minutes warm-up time at ambient temperature, specified environmental conditions met, calibration cycle adhered to, and total calibration performed.
Data without tolerances: typical values only.
Data designated “nominal“ apply to design parameters and are not tested.
Data designated “σ = xx dB“ are shown as standard deviation
.
R&S FSU3
R&S FSU8
R&S FSU26
Frequency
Frequency range
20 Hz to 3.6 GHz 20 Hz to 8 GHz 20 Hz to 26.5 GHz
DC coupled
1 MHz to 3.6 GHz 1 MHz to 8 GHz 10 MHz to 26.5 GHz
AC coupled
Frequency resolution
0.01 Hz
Internal reference frequency (nominal) with standard OCXO
Aging per day 1)
1 x 10⁻⁹
Aging per year 1)
1 x 10⁻⁷
Temperature drift
8 x 10⁻⁸
(0°C to +50°C)
Total error (per year) 1)
1.8 x 10⁻⁷
Internal reference frequency (nominal); option R&S FS-B4
Aging per day 1)
2 x 10⁻¹⁰
Aging per year 1)
3 x 10⁻⁸
Temperature drift
1 x10⁻⁹
(0°C to +50°C)
Total error (per year) 1)
5 x 10⁻⁸
External reference
1 MHz to 20 MHz, 1 Hz steps
frequency
Frequency display
with marker or frequency counter
Marker resolution
0.1 Hz to 10 kHz (dependent on span)
Max. deviation
±(marker frequency x reference error + 0.5 % x span
(sweep time >3 x
+10 % x resolution bandwidth + ½ (last digit))
auto sweep time)
Frequency counter
0.1 Hz to 10 kHz (selectable)
resolution
Count accuracy
±(frequency x reference error + ½ (last digit))
(S/N >25 dB)
Frequency span
0 Hz,
0 Hz,
0 Hz,
10 Hz to 3.6 GHz 10 Hz to 8 GHz 10 Hz to 26.5 GHz
Span resolution/
0.1 Hz/1 %
max. span deviation
Spectral purity (dBc(1Hz)), SSB phase noise, f = 640 MHz
Residual FM
<1 Hz nominal
Carrier offset
typ. –73 dBc(1Hz), with option R&S FS-B4 typ. –86 dBc
10 Hz
100 Hz
<–90 dBc(1Hz), typ. –100 dBc(1Hz)
1 kHz
<–112 dBc(1Hz), typ. –116 dBc(1Hz)
10 kHz
<–120 dBc(1Hz), typ. –123 dBc(1Hz)
100 kHz
<–120 dBc(1Hz), typ. –123 dBc(1Hz)
1 MHz
<–138 dBc(1Hz), typ. –144 dBc(1Hz)
10 MHz
<–155 dBc(1Hz) nominal, typ. –160 dBc(1Hz)
Sweep
Span 0 Hz
1 µs to 16000 s in steps of 5%
Span ≥10 Hz
2.5 ms to 16000 s in steps ≤10%
Max. deviation of
3%
sweep time
Sampling rate
31.25 ns (32 MHz A/D converter)
Measurement in
with marker and display lines (resolution 31.25 ns)
time domain
R&S FSU3
R&S FSU8
R&S FSU26
Resolution bandwidths
Analog filters
3 dB bandwidths
10 Hz to 20 MHz in 1/2/3/5 sequence, 50 MHz
Bandwidth error
10 Hz to 100 kHz
<3%
200 kHz to 5 MHz
<10%
10 MHz, 20 MHz
–30% to + 10%
50 MHz
–30% to +10%
–30% to +10% for f<3.6 GHz
–30% to +100% for f>3.6 GHz
Shape factor –60 dB: –3 dB
≤100 kHz
<6
200 kHz to 2 MHz
<12
3 MHz to 10 MHz
<7
20 MHz, 50 MHz
<6 nominal
Video bandwidths
1 Hz to 10 MHz in 1/2/3/5 sequence
FFT filters
3 dB bandwidths
1 Hz to 30 kHz in 1/2/3/5 sequence
Bandwidth error
<5% nominal
Shape factor
<3 nominal
–60 dB: –3 dB
EMI filters
6 dB bandwidths
200 Hz, 9 kHz, 120 kHz
Bandwidth error
<3% nominal
Shape factor
<6 nominal
–60 dB : –3 dB
Channel filters
Bandwidths
100, 200, 300, 500 Hz,
1, 1.5, 2, 2.4, 2.7, 3, 3.4, 4, 4.5, 5, 6, 8.5, 9, 10, 12.5, 14, 15,
16, 18 (RRC), 20, 21, 24.3 (RRC), 25, 30, 50, 100, 150, 192,
200, 300, 500 kHz,
1, 1.228, 1.5, 2, 3, 5 MHz
Shape factor
<2 nominal
–60 dB : –3 dB
Bandwidth error
2% nominal
Level
Display range
displayed average noise level to 30 dBm
Maximum input level
DC voltage
50 V
(AC coupling)
DC voltage
0V
(DC coupling)
RF attenuation 0 dB
CW RF power
20 dBm (= 0.1 W)
Pulse spectral density
97 dBµV/1 MHz
RF attenuation ≥10 dB
CW RF power
30 dBm (= 1 W)
Max. pulse voltage
150 V
Max. pulse energy
1 mWs
(10 µs)
1 dB compression +13 dBm nominal
+13 dBm nominal up to 3.6 GHz
–
+10 dBm nominal +7 dBm nominal
of input mixer
from 3.6 GHz
from 3.6 GHz
(0 dB RF attenuato 8 GHz
to 26 GHz
tion)
Intermodulation
Third-order intermodulation
Third-order inter>17 dBm,
>17 dBm,
>17 dBm,
cept (TOI), level 2 x
typ. 20 dBm
typ. 20 dBm
typ. 20 dBm
–10 dBm,
for f = 10 MHz to for f = 10 MHz to for f = 10 MHz to
∆f >5 x RBW or
300 MHz
300 MHz
300 MHz
10 kHz, whichever is
>+20 dBm,
>+20 dBm,
>+22 dBm,
the greater value
typ.+25 dBm
typ.+25 dBm
typ.+27 dBm
for f >300 MHz for f = 300 MHz for f = 300 MHz
to 3.6 GHz
to 3.6 GHz
>+18 dBm,
>+12 dBm,
typ.+23 dBm
typ. +15 dBm
for f = 3.6 GHz
for f = 3.6 GHz
to 8 GHz
to 26.5 GHz
1)
After 30 days of continuous operation.
Spectrum Analyzer R&S FSU
11
R&S FSU3
R&S FSU8
R&S FSU26
Second harmonic intercept point (SHI)
fin ≤100 MHz
>35 dBm
100 MHz<fin
>45 dBm, typ. 55 dBm
≤400 MHz
400 MHz< fin ≤500 Hz
>52 dBm, typ. 60 dBm
500 MHz< fin ≤1 GHz
>45 dBm, typ. 55 dBm
1 GHz < fin ≤ 1.8 GHz
>35 dBm
fin > 1.8 GHz
–
>80 dBm nominal
Displayed average noise level
(0 dB RF attenuation, RBW 10 Hz, VBW 30 Hz, 20 averages, trace average,
span 0 Hz, termination 50 Ω)
Frequency
<–80 dBm
20 Hz
100 Hz
<–100 dBm
1 kHz
<–110 dBm
10 kHz
<–120 dBm
100 kHz
<–120 dBm
1 MHz
<–130 dBm
10 MHz to 2 GHz
<–145 dBm, typ. –148 dBm
<–142 dBm,
typ. –146 dBm
2 GHz to 3.6 GHz
<–143 dBm,
<–143 dBm,
<–140 dBm,
typ. –147 dBm
typ. –145 dBm
typ. –143 dBm
3.6 GHz to 7 GHz
<–142 dBm,
<–142 dBm,
–
typ. –146 dBm
typ. –144 dBm
7 GHz to 8 GHz
–
<–140 dBm
–
3.6 GHz to 8 GHz
–
–
<–142 dBm,
typ. –146 dBm
8 GHz to 13 GHz
–
–
<–140 dBm,
typ. –143 dBm
13 GHz to 18 GHz
–
–
<–138 dBm,
typ. –141 dBm
18 GHz to 22 GHz
–
–
<–137 dBm,
typ. –140 dBm
22 GHz to 26.5 GHz
–
–
<–135 dBm,
typ. –138 dBm
Maximum dynamic range
1 dB compression to
170 dB
DANL (1 Hz)
Immunity to interference
Image frequency
f ≤ 3.6 GHz
>90 dB, typ. >110 dB
f >3.6 GHz
–
>70 dB, typ. 100 dB
Intermediate frequency
f ≤ 3.6 GHz
>90 dB, typ. >110 dB
3.6 GHz ≤f ≤4.2 GHz
–
typ. 70 dB
f > 4.2 GHz
>70 dB, typ. >90 dB
Spurious responses
<–103 dBm
(f > 1 MHz, without
input signal, 0 dB
attenuation)
Other spurious (∆f>100 kHz)
fin < 2.3 GHz
<–80 dBc (mixer level ≤ –10 dBm)
2.3 GHz≤ fin<4 GHz
<–70 dBc (mixer level ≤ –35 dBm)
4 GHz≤fin < 26.5 GHz
<–80 dBc (mixer level ≤ –10 dBm)
Level display (spectrum mode)
Screen
625 x 500 pixels (one diagram), max. 2 diagrams with
independent settings
Logarithmic level
1 dB, 10 dB to 200 dB in steps of 10 dB
axis
Linear level axis
10% of reference level per level division, 10 divisions or
logarithmic scaling
Traces
max. 6, with two diagrams on screen max. 3 per diagram
Trace detector
Max Peak, Min Peak, Auto Peak (normal), Sample, RMS,
Average, Quasi Peak
Trace functions
Clear/Write, Max Hold, Min Hold, Average
Number of measure625, settable between 155 and 100001
ment points
in steps of about the factor 2
R&S FSU3
R&S FSU8
R&S FSU26
Setting range of reference level
Logarithmic level
–130 dBm to (+5 dBm + RF attenuation), max. 30 dBm,
display
in steps of 0.1 dB
Linear level display
7.0 nV to 7.07 V in steps of 1%
Units of level axis
dBm, dBµV, dBmV, dBµA, dBpW (log level display) /
µV, mV, µA, mA, pW, nW (linear level display)
Level measurement error
Reference error at
<0.2 (σ = 0.07) dB
128 MHz, RBW
≤100 kHz, reference
level –30 dBm,
RF attenuation 10 dB
Frequency response (DC coupling, RF attenuation ≥ 10 dB)
10 MHz to 3.6 GHz
<0.3 dB (σ = 0.1 dB)1)
3.6 GHz to 8 GHz
–
<1.5 dB (σ = 0.5 dB)2)
8 GHz to 22 GHz
–
–
<2 dB
(σ = 0.7 dB)2)
22 GHz to 26.5 GHz
–
–
<2.5 dB
(σ = 0.8 dB)2)
Attenuator (≥5 dB)
<0.2 dB (σ = 0.07 dB)
Reference level
<0.15 dB (σ = 0.05 dB)
switching
Display nonlinearity (20 °C to 30 °C, mixer level ≤–10 dBm)
Logarithmic level display
RBW ≤100 kHz, S/N >20 dB
0 dB to –70 dB
<0.1 dB (σ = 0.03 dB)
–70 dB to –90 dB
<0.3 dB (σ = 0.1 dB)
10 MHz ≥ RBW ≥ 200 kHz, S/N >16 dB
0 dB to –50 dB
<0.2 dB (σ = 0.07 dB)
–50 dB to –70 dB
<0.5 dB (σ=0.17 dB)
RBW ≥ 10 MHz
0 dB to –50 dB
<0.5 dB (σ = 0.17 dB)
Linear level display
5 % of reference level
Bandwidth switching error (ref. to RBW = 10 kHz)
10 Hz to 100 kHz
–
200 kHz to 10 MHz
<0.2 dB (σ = 0.07 dB)
5 MHz to 50 MHz
<0.5 dB (σ = 0.15 dB)
FFT 1 Hz to 3 kHz
<0.2 dB (σ = 0.07 dB)
Total measurement error
(0 dB to –70 dB, S/N >20 dB, span/RBW <100, 95 % confidence level)
(20 °C to 30 °C, mixer level ≤–10 dBm)
<3.6 GHz
0.3 dB for RBW ≤ 100 kHz
0.5 dB for RBW > 100 kHz
3.6 GHz to 8 GHz
–
<2.0 dB
8 GHz to 18 GHz
–
–
<2.5 dB
18 GHz to 26.5 GHz
–
–
<3.0 dB
Audio demodulation
Modulation modes
Audio output
Marker hold time in
spectrum mode
AM and FM
loudspeaker and headphones output
100 ms to 60 s
Trigger functions
Trigger
Span ≥10 Hz
Trigger source
Trigger offset
Span = 0 Hz
Trigger source
Trigger offset
Max. deviation of
trigger offset
Gated sweep
Trigger source
Gate delay
Gate length
Max. deviation of
gate length
free run, video, external, IF level (mixer level >–20 dBm)
125 ns to 100 s, resolution 125 ns min. (or 1 % of offset)
free run, video, external, IF level (mixer level >–20 dBm)
± 125 ns to 100 s, resolution 125 ns min.,
dependent on sweep time
± (125 ns + (0.1 % x delay time))
external, IF level, video
1 µs to 100 s
125 ns to 100 s, resolution min. 125 ns or 1 % of gate
length
±(125 ns + (0.05 % x gate length))
Spectrum Analyzer R&S FSU
12
R&S FSU3
R&S FSU8
R&S FSU26
Inputs and outputs (front panel)
RF input
N female, 50 Ω
VSWR; RF attenuation ≥10 dB, DC coupling
f <3.6 GHz
<1.5
f <8 GHz
–
<2.0
<1.8
f <18 GHz
–
–
<1.8
f <26.5 GHz
–
–
<2.0
RF attenuation
typ. 1.5
<10 dB or AC
coupling
Setting range of
0 dB to 75 dB in 5 dB steps
attenuator
Probe power supply +15 V DC, –12.6 V DC and ground, max. 150 mA nominal
Power supply for
5-pin connector
antennas
Supply voltages
±10 V and ground, max. 100 mA nominal
Keyboard
Keyboard connector
PS/2 female for MF2 keyboard
AF output
AF output
3.5 mm mini jack
Output impedance
10 Ω
Open-circuit voltage
up to 1.5 V, adjustable
Inputs and outputs (rear panel)
IF 20.4 MHz
Bandwidth
RBW ≤ 100 kHz
10 MHz ≥ RBW ≥
200 kHz
Level
RBW ≤ 100 kHz, FFT
10 MHz≥RBW≥
200 kHz
IF 404.4 MHz
Zout = 50 Ω, BNC female
1.5 x resolution bandwidth, min. 2.6 kHz
same as resolution bandwidth
–20 dBm at reference level, mixer level >–70 dBm
0 dBm at reference level, mixer level >–50 dBm
Zout = 50 Ω, BNC female
404.4 MHz IF output active only if RBW >10 MHz
Bandwidth
RBW > 10 MHz
same as resolution bandwidth
Level
Mixer level ≤ 0 dBm mixer level –10 dB typ., only active if RBW 20.50 MHz
Video output
Zout = 50 Ω, BNC female
Voltage
0 V to 1 V, full scale (open-circuit voltage), logarithmic
(RBW ≥200 kHz)
scaling
Reference frequency
Output
BNC female
Output frequency
10 MHz
Level
>0 dBm nominal
Input
BNC female
Input frequency
1 MHz to 20 MHz in 1 Hz steps
range
Required level
>0 dBm from 50 Ω
Sweep output
BNC female, 0 V to 5 V, proportional to displayed
frequency
Power supply conBNC female, 0 V and 28 V, switchable,
nector for noise
max. 100 mA
source
External trigger/
BNC female, >10 kΩ
gate input
Trigger voltage
1.4 V
IEC/IEEE-bus
interface to IEC 625-2 (IEEE 488.2)
remote control
Command set
SCPI 1997.0
Connector
24-pin Amphenol female
Interface functions
SH1, AH1, T6, L4, SR1, RL1, PP1, DC1, DT1, C0
Serial interface
RS-232-C (COM), 9-pin SUB-D female
Printer interface
parallel (Centronics-compatible)
Mouse connector
PS/2 female
Connector for exter15-pin SUB-D female
nal monitor (VGA)
1)
2)
Valid for temperatures between +20°C and +30°C; <0.6 dB for temperatures between +5°C
and +45°C.
Valid for temperatures between +20°C and +30°C and span <1 GHz; add < 0.5 dB for temperatures between +5°C and +45°C or span >1 GHz.
General data
Display
21 cm TFT LCD colour display (8.4")
Resolution
800 x 600 pixels (SVGA resolution)
Pixel failure rate
<1 x 10 –5
Mass memory
1.44 Mbyte 3½" disk drive, hard disk
Data storage
>500 instrument settings and traces
Operating temperature range
Rated temperature
+5 °C to +40 °C
range
Limit temperature
+0 °C to +50 °C
range
Storage temperature
–40 °C to +70 °C
range
Damp heat
+40 °C at 95 % relative humidity (IEC 68–2–3)
Mechanical resistance
Vibration , sinusoidal
5 Hz to 150 Hz, max. 2 g at 55 Hz; 0.5 g from 55 Hz to
150 Hz; meets IEC 68-2-6, IEC 68-2-3, IEC 1010-1,
MIL-T-28800D, class 5
Vibration, random
10 Hz to 100 Hz, acceleration 1 g (rms)
Shock test
40 g shock spectrum, meets MIL-STD-810C
and MIL-T-28800D, classes 3 and 5
Recommended
2 years for operation with external reference,
calibration interval
1 year with internal reference
RFI suppression
meets EMC directive of EU (89/336/EEC) and
German EMC law
Power supply
AC supply
100 V AC to 240 V AC, 3.1 A to 1.3 A, 50 Hz to 400 Hz,
class of protection I to VDE 411
Power consumption
typ. 130 VA
typ. 150 VA
Safety
meets EN 61010-1, UL 3111-1, CSA C22.2 No. 1010-1,
IEC 1010-1
Test mark
VDE, GS, CSA, CSA-NRTL
Dimensions
435 mm x 192 mm
435 mm x 192 mm
(W x H x D)
x 460 mm
x 460 mm
Weight
14.6 kg
15.4 kg
Optional Extended Environmental Specification R&S FSU-B20
Temperature range (without condensation)
Rated temperature range
0°C to +50°C
Limit temperature range
0°C to +55°C
Mechanical resistance
Vibration, random
10 Hz to 300 Hz, acceleration 1.9 g (rms)
Optional Electronic Attenuator R&S FSU-B25
Frequency
Frequency range
R&S FSU 3
R&S FSU 8
R&S FSU 26
10 MHz to 3.6 GHz
10 MHz to 8 GHz
10 MHz to 3.6 GHz
Setting range
Electronic attenuator
Preamplifier
Maximum level measurement error
0 dB to 30 dB, 5 dB steps
20 dB, switchable
Frequency response, with preamplifier or electronic attenuator
10 MHz to 50 MHz
<1 dB
50 MHz to 3.6 GHz
<0.6 dB
3.6 GHz to 8 GHz
<2.0 dB
Reference error at 128 MHz, RBW ≤100 kHz, reference level –30 dBm,
RF attenuation 10 dB
Electronic attenuator
<0.3 dB
Preamplifier
<0.3 dB
Spectrum Analyzer R&S FSU
13
With the R&S FSU-B25 built in, the average noise level values displayed by the
basic units degrade by (R&S FSU-B25 off):
20 Hz to 3.6 GHz
1 dB
3.6 GHz to 8 GHz
2 dB
Preamplifier off, electronic attenuator 0 dB
20 Hz to 3.6 GHz
3.6 GHz to 8 GHz
Intermodulation
typ. 2.5 dB
typ. 3.5 dB
Third-order intermodulation, third-order intercept (TOI), electronic attenuator on,
∆f > 5 x RBW or 10 kHz
10 MHz to 300 MHz
300 MHz to 3.6 GHz
3.6 GHz to 8 GHz
>17 dBm
>20 dBm
>18 dBm
Ordering information
Order designation
Type
Order No.
Spectrum Analyzer 20 Hz to 3.6 GHz
R&S FSU3
1129.9003.03
Spectrum Analyzer 20 Hz to 8 GHz
R&S FSU8
1129.9003.08
Spectrum Analyzer 20 Hz to 26.5 GHz
R&S FSU26
1129.9003.26
Accessories supplied
Power cable, operating manual, service manual; R&S FSU26: test port adapter
with 3.5 mm female (1021.0512.00) and N female (1021.0535.00) connector
Type
R&S FSE-Z15
Order No.
1046.2002.02
–
R&S PSP-Z2
R&S FSE-Z2
R&S PMC3
R&S PCK
R&S PCK
R&S ZZA-411
R&S ZZA-T45
0708.9010.00
1091.4100.02
1084.7043.02
1082.6004.04
0292.2013.10
0292.2013.20
1096.3283.00
1109.3774.00
R&S RAM
R&S RAZ
R&S ZRB2
R&S ZRC
0358.5414.02
0358.5714.02
0373.9017.52
1039.9492.52
R&S RBU 100
1073.8820.XX
(XX=03/06/10/20/ 30)
High-Power Attenuators, 50 W
3/6/10/20/30 dB
R&S RBU 50
20 dB, 6 GHz
R&S RDL 50
1073.8895.XX
(XX=03/06/10/20/ 30)
1035.1700.52
Options
Order designation
Options
Delete Manual
Highly Accurate Reference Frequency
External Generator Control
LAN Interface100BT
Removable Hard Disk
Second Hard Disk for FSU-B18
Extended Environmental Specification
Electronic Attenuator, 0 dB to 30 dB,
with integrated 20 dB preamplifier
Software
Noise Measurement Software
Phase Noise Measurement Software
GSM/EDGE Application Firmware
FM Measurement Demodulator
3GPP BTS/Node B FDD Application
Firmware
Service Kit
1)
2)
3)
Type
Order No.
R&S FSU-B0
R&S FSU-B4
R&S FSP-B10
R&S FSU-B16
R&S FSU-B181) 2)
R&S FSU-B192)
R&S FSU-B203)
R&S FSU-B25
1144.9998.02
1144.9000.02
1129.7246.02
1144.9498.02
1145.0242.02
1145.0394.02
1155.1606.04
1144.9298.02
R&S FS-K3
R&S FS-K4
R&S FS-K5
R&S FS-K7
R&S FS-K72
1057.3028.02
1108.0088.02
1141.1496.02
1141.1796.02
1154.7000.02
R&S FSU-Z1
1145.0042.02
Certified Environmental System
Certified Quality System
ISO 14001 ISO 9001
REG. NO 1954
DQS REG. NO 1954
Factory installation only.
Not with R&S FSU-B20.
Not with R&S FSU-B18/-B19.
ROHDE&SCHWARZ GmbH & Co. KG ⋅ Mühldorfstraße 15 ⋅ D-81671 München ⋅ Germany ⋅ P.O.B. 8014 69 ⋅ D-81614 München ⋅ Germany ⋅ Telephone +49894129-0
www.rohde-schwarz.com ⋅ CustomerSupport: Telephone. +491805124242, Fax +4989 4129-13777, E-mail: [email protected]
0302 (U as)
<–152 dBm
<–150 dBm
<–147 dBm
Order designation
Microwave Measurement Cable with
Adapter Set (for R&S FSU26 only)
Headphones
US Keyboard with trackball
PS/2 Mouse
Colour Monitor, 17", 230 V
IEC/IEEE-Bus Cable, 1 m
IEC/IEEE-Bus Cable, 2 m
19" Rack Adapter
Adapter for mounting on telescopic
rails (only with 19" Adapter ZZA-411)
Matching Pads, 75 Ω
L Section
Series Resistor, 25 Ω
SWR Bridge, 5 MHz to 3000 MHz
SWR Bridge, 40 kHz to 4 GHz
High-Power Attenuators, 100 W,
3/6/10/20/30 dB
Printed in Germany
Preamplifier on
10 MHz to 2.0 GHz
2.0 GHz to 3.6 GHz
3.6 GHz to 8.0 GHz
Recommended extras
PD 757.6504.24 ⋅ Spectrum Analyzer R&S FSU ⋅ Trade names are trademarks of the owners ⋅ Subject to change ⋅ Data without tolerances: typical values
Displayed average noise level
RBW=1 kHz, VBW=3 kHz, zero span, sweep time 50 ms, 20 averages, mean
marker, normalized to 10 Hz RBW