1
IBM Cognos Express
Version 10.1.0
Business Insight User Guide
Note
Before using this information and the product it supports, read the information in “Notices” on page 119.
Product Information
This document applies to IBM Cognos Express Version 10.1.0 and may also apply to subsequent releases. To check
for newer versions of this document, visit the IBM Cognos Information Centers (http://publib.boulder.ibm.com/
infocenter/cogic/v1r0m0/index.jsp).
Licensed Materials - Property of IBM
© Copyright IBM Corporation 2010, 2012.
US Government Users Restricted Rights – Use, duplication or disclosure restricted by GSA ADP Schedule Contract
with IBM Corp.
Contents
Introduction . . . . . . . . . . . . . . . . . . . . . . . . . . . . . . . . . vii
Chapter 1. What's new? . . . . . . . . . . . . . . . . . . . . . . . . . . . . . 1
New features in version 10.1.1 . . . . . . . . . . . .
Resize charts . . . . . . . . . . . . . . . . .
Swap rows and columns . . . . . . . . . . . . .
Position Content pane to the left of the workspace. . . . .
Add Active Report content . . . . . . . . . . . .
User interface improvements . . . . . . . . . . . .
Dashboards are now workspaces . . . . . . . . . .
Improved thumbnails . . . . . . . . . . . . . .
More meaningful names for Analysis Studio report parts . .
Microsoft Internet Explorer support. . . . . . . . . .
Mozilla Firefox support . . . . . . . . . . . . . .
Freedom Scientific JAWS support . . . . . . . . . .
Larger worksheet sizes for Microsoft Excel 2007 report outputs
.
.
.
.
.
.
.
.
.
.
.
.
.
.
.
.
.
.
.
.
.
.
.
.
.
.
.
.
.
.
.
.
.
.
.
.
.
.
.
.
.
.
.
.
.
.
.
.
.
.
.
.
.
.
.
.
.
.
.
.
.
.
.
.
.
.
.
.
.
.
.
.
.
.
.
.
.
.
.
.
.
.
.
.
.
.
.
.
.
.
.
.
.
.
.
.
.
.
.
.
.
.
.
.
.
.
.
.
.
.
.
.
.
.
.
.
.
.
.
.
.
.
.
.
.
.
.
.
.
.
.
.
.
.
.
.
.
.
.
.
.
.
.
.
.
.
.
.
.
.
.
.
.
.
.
.
.
.
.
.
.
.
.
.
.
.
.
.
.
.
.
.
.
.
.
.
.
.
.
.
.
.
.
.
.
.
.
.
.
.
.
.
.
.
.
.
.
.
.
.
.
.
.
.
.
.
.
.
.
.
.
.
.
.
.
.
.
.
.
.
.
1
1
1
1
1
2
2
2
2
2
2
3
3
Chapter 2. Understanding IBM Cognos Business Insight. . . . . . . . . . . . . . . 5
Launching IBM Cognos Business Insight . . . .
Browser chrome . . . . . . . . . . .
Minimal support for Microsoft Internet Explorer
Logging on . . . . . . . . . . . . . .
Logging off . . . . . . . . . . . . . .
The user interface. . . . . . . . . . . .
Getting Started page . . . . . . . . . .
Application bar . . . . . . . . . . .
Workspace . . . . . . . . . . . . .
Content pane . . . . . . . . . . . .
Widgets . . . . . . . . . . . . .
Actions menus . . . . . . . . . . .
Setting a home page . . . . . . . . .
Resetting a home page to the default setting .
Upgrading IBM Cognos 8 Go! Dashboards . . .
Feature changes . . . . . . . . . . .
Upgrade limitations . . . . . . . . .
Interaction changes . . . . . . . . . .
.
.
6.
.
.
.
.
.
.
.
.
.
.
.
.
.
.
.
.
.
.
.
.
.
.
.
.
.
.
.
.
.
.
.
.
.
.
.
.
.
.
.
.
.
.
.
.
.
.
.
.
.
.
.
.
.
.
.
.
.
.
.
.
.
.
.
.
.
.
.
.
.
.
.
.
.
.
.
.
.
.
.
.
.
.
.
.
.
.
.
.
.
.
.
.
.
.
.
.
.
.
.
.
.
.
.
.
.
.
.
.
.
.
.
.
.
.
.
.
.
.
.
.
.
.
.
.
.
.
.
.
.
.
.
.
.
.
.
.
.
.
.
.
.
.
.
.
.
.
.
.
.
.
.
.
.
.
.
.
.
.
.
.
.
.
.
.
.
.
.
.
.
.
.
.
.
.
.
.
.
.
.
.
.
.
.
.
.
.
.
.
.
.
.
.
.
.
.
.
.
.
.
.
.
.
.
.
.
.
.
.
.
.
.
.
.
.
.
.
.
.
.
.
.
.
.
.
.
.
.
.
.
.
.
.
.
.
.
.
.
.
.
.
.
.
.
.
.
.
.
.
.
.
.
.
.
.
.
.
.
.
.
.
.
.
.
.
.
.
.
.
.
.
.
.
.
.
.
.
.
.
.
.
.
.
.
.
.
.
.
.
.
.
.
.
.
.
.
.
.
.
.
.
.
.
.
.
.
.
.
.
.
.
.
.
.
.
.
.
.
.
.
.
.
.
.
.
.
.
.
.
.
.
.
.
.
.
.
.
.
.
.
.
.
.
.
.
.
.
.
.
.
.
.
.
.
.
.
.
.
.
.
.
.
.
.
.
.
.
.
.
.
.
.
.
.
.
.
. 5
. 5
. 5
. 5
. 6
. 7
. 7
. 8
. 8
. 9
. 10
. 12
. 14
. 14
. 14
. 14
. 17
. 18
Chapter 3. Creating workspaces . . . . . . . . . . . . . . . . . . . . . . . . . 21
Adding IBM Cognos content . . .
Report content . . . . . . .
Active Report content . . . . .
PowerPlay content . . . . . .
TM1 content . . . . . . . .
IBM Cognos Navigator . . . .
Searching for content . . . . . .
Performing a search . . . . .
Refining IBM Cognos results . .
Adding tools . . . . . . . . .
Adding an image widget . . . .
Adding a My Inbox widget . . .
Adding an RSS feed widget . . .
Adding a select value filter widget
Adding a slider filter widget . .
Adding a text widget . . . . .
Adding a web page widget . . .
© Copyright IBM Corp. 2010, 2012
.
.
.
.
.
.
.
.
.
.
.
.
.
.
.
.
.
.
.
.
.
.
.
.
.
.
.
.
.
.
.
.
.
.
.
.
.
.
.
.
.
.
.
.
.
.
.
.
.
.
.
.
.
.
.
.
.
.
.
.
.
.
.
.
.
.
.
.
.
.
.
.
.
.
.
.
.
.
.
.
.
.
.
.
.
.
.
.
.
.
.
.
.
.
.
.
.
.
.
.
.
.
.
.
.
.
.
.
.
.
.
.
.
.
.
.
.
.
.
.
.
.
.
.
.
.
.
.
.
.
.
.
.
.
.
.
.
.
.
.
.
.
.
.
.
.
.
.
.
.
.
.
.
.
.
.
.
.
.
.
.
.
.
.
.
.
.
.
.
.
.
.
.
.
.
.
.
.
.
.
.
.
.
.
.
.
.
.
.
.
.
.
.
.
.
.
.
.
.
.
.
.
.
.
.
.
.
.
.
.
.
.
.
.
.
.
.
.
.
.
.
.
.
.
.
.
.
.
.
.
.
.
.
.
.
.
.
.
.
.
.
.
.
.
.
.
.
.
.
.
.
.
.
.
.
.
.
.
.
.
.
.
.
.
.
.
.
.
.
.
.
.
.
.
.
.
.
.
.
.
.
.
.
.
.
.
.
.
.
.
.
.
.
.
.
.
.
.
.
.
.
.
.
.
.
.
.
.
.
.
.
.
.
.
.
.
.
.
.
.
.
.
.
.
.
.
.
.
.
.
.
.
.
.
.
.
.
.
.
.
.
.
.
.
.
.
.
.
.
.
.
.
.
.
.
.
.
.
.
.
.
.
.
.
.
.
.
.
.
.
.
.
.
.
.
.
.
.
.
.
.
.
.
.
.
.
.
.
.
.
.
.
.
.
.
.
.
.
.
.
.
.
.
.
.
.
.
.
.
.
.
.
.
.
.
.
.
.
.
.
.
.
.
.
.
.
.
.
.
.
.
.
.
.
.
.
.
.
.
.
.
.
21
21
26
26
28
30
32
32
34
34
35
36
37
39
41
43
44
iii
Saving workspaces . . . . . . . . . . . . .
Save a workspace . . . . . . . . . . . .
Save a workspace using a different name or location
Editing widget properties. . . . . . . . . . .
Configuring widget communication . . . . . . .
Widget to widget communication . . . . . . .
Modifying the workspace layout . . . . . . . .
Resize individual widgets . . . . . . . . .
Set the workspace layout . . . . . . . . . .
Editing the workspace style . . . . . . . . . .
Edit the workspace style . . . . . . . . . .
Edit all workspace widgets . . . . . . . . .
Setting personal preferences . . . . . . . . . .
Creating accessible workspaces . . . . . . . . .
Creating multilingual workspaces . . . . . . . .
Language and locale . . . . . . . . . . .
Localize fixed content . . . . . . . . . . .
Localize filter content . . . . . . . . . . .
Localize report content . . . . . . . . . .
Prompt controls . . . . . . . . . . . . .
.
.
.
.
.
.
.
.
.
.
.
.
.
.
.
.
.
.
.
.
.
.
.
.
.
.
.
.
.
.
.
.
.
.
.
.
.
.
.
.
.
.
.
.
.
.
.
.
.
.
.
.
.
.
.
.
.
.
.
.
.
.
.
.
.
.
.
.
.
.
.
.
.
.
.
.
.
.
.
.
.
.
.
.
.
.
.
.
.
.
.
.
.
.
.
.
.
.
.
.
.
.
.
.
.
.
.
.
.
.
.
.
.
.
.
.
.
.
.
.
.
.
.
.
.
.
.
.
.
.
.
.
.
.
.
.
.
.
.
.
.
.
.
.
.
.
.
.
.
.
.
.
.
.
.
.
.
.
.
.
.
.
.
.
.
.
.
.
.
.
.
.
.
.
.
.
.
.
.
.
.
.
.
.
.
.
.
.
.
.
.
.
.
.
.
.
.
.
.
.
.
.
.
.
.
.
.
.
.
.
.
.
.
.
.
.
.
.
.
.
.
.
.
.
.
.
.
.
.
.
.
.
.
.
.
.
.
.
.
.
.
.
.
.
.
.
.
.
.
.
.
.
.
.
.
.
.
.
.
.
.
.
.
.
.
.
.
.
.
.
.
.
.
.
.
.
.
.
.
.
.
.
.
.
.
.
.
.
.
.
.
.
.
.
.
.
.
.
.
.
.
.
.
.
.
.
.
.
.
.
.
.
.
.
.
.
.
.
.
.
.
.
.
.
.
.
.
.
.
.
.
.
.
.
.
.
.
.
.
.
.
.
.
.
.
.
.
.
.
.
.
.
.
.
.
.
.
.
.
.
.
.
.
.
.
.
.
.
.
.
.
.
.
.
.
.
.
.
.
.
.
.
.
.
.
.
.
.
.
.
.
.
.
.
.
.
.
.
.
.
44
44
44
45
46
46
48
48
48
49
49
50
52
53
54
55
56
57
58
59
Chapter 4. Viewing and interacting with workspaces . . . . . . . . . . . . . . . . 61
Opening a workspace . . . . . . . . . . . . . . .
Open a workspace from the Getting Started page. . . . .
Open a workspace from the application bar . . . . . .
Open a workspace from the Actions menu . . . . . . .
Open a workspace from the Content tab. . . . . . . .
Open a workspace from IBM Cognos Connection. . . . .
Refreshing workspace widgets . . . . . . . . . . . .
Refresh all widgets . . . . . . . . . . . . . . .
Refresh a single widget . . . . . . . . . . . . .
Sharing workspaces . . . . . . . . . . . . . . .
Displaying data in lists, crosstabs, and charts . . . . . . .
Change the display type . . . . . . . . . . . . .
Choose a display type and configuration for charts . . . .
Supported chart formats . . . . . . . . . . . . .
Sort and filter chart content . . . . . . . . . . . .
Change the chart color palette . . . . . . . . . . .
Swap rows and columns . . . . . . . . . . . . .
Filtering report data . . . . . . . . . . . . . . .
Filtering in the report widget . . . . . . . . . . .
Filtering with slider filter and select value filter widgets . .
Sorting data in lists, crosstabs, and charts . . . . . . . .
Sorting lists . . . . . . . . . . . . . . . . .
Sorting crosstabs. . . . . . . . . . . . . . . .
Sorting charts. . . . . . . . . . . . . . . . .
Remove sorts with the sort button . . . . . . . . . .
Remove sorts using the information bar . . . . . . . .
Displaying filter and sort values in the information bar. . . .
Changing the prompt values in a report . . . . . . . . .
Resetting report content . . . . . . . . . . . . . .
Opening a workspace with a new version of a report . . . .
Adding simple calculations in lists and crosstabs . . . . . .
Add a simple calculation . . . . . . . . . . . . .
Delete a calculation . . . . . . . . . . . . . . .
Grouping identical values that are in a list report. . . . . .
Reordering list columns . . . . . . . . . . . . . .
Renaming list columns . . . . . . . . . . . . . .
Providing quick access to your favorite workspaces and reports .
Adding a workspace or report to My Favorites . . . . .
Viewing My Favorites . . . . . . . . . . . . . .
iv
IBM Cognos Express Version 10.1.0: Business Insight User Guide
.
.
.
.
.
.
.
.
.
.
.
.
.
.
.
.
.
.
.
.
.
.
.
.
.
.
.
.
.
.
.
.
.
.
.
.
.
.
.
.
.
.
.
.
.
.
.
.
.
.
.
.
.
.
.
.
.
.
.
.
.
.
.
.
.
.
.
.
.
.
.
.
.
.
.
.
.
.
.
.
.
.
.
.
.
.
.
.
.
.
.
.
.
.
.
.
.
.
.
.
.
.
.
.
.
.
.
.
.
.
.
.
.
.
.
.
.
.
.
.
.
.
.
.
.
.
.
.
.
.
.
.
.
.
.
.
.
.
.
.
.
.
.
.
.
.
.
.
.
.
.
.
.
.
.
.
.
.
.
.
.
.
.
.
.
.
.
.
.
.
.
.
.
.
.
.
.
.
.
.
.
.
.
.
.
.
.
.
.
.
.
.
.
.
.
.
.
.
.
.
.
.
.
.
.
.
.
.
.
.
.
.
.
.
.
.
.
.
.
.
.
.
.
.
.
.
.
.
.
.
.
.
.
.
.
.
.
.
.
.
.
.
.
.
.
.
.
.
.
.
.
.
.
.
.
.
.
.
.
.
.
.
.
.
.
.
.
.
.
.
.
.
.
.
.
.
.
.
.
.
.
.
.
.
.
.
.
.
.
.
.
.
.
.
.
.
.
.
.
.
.
.
.
.
.
.
.
.
.
.
.
.
.
.
.
.
.
.
.
.
.
.
.
.
.
.
.
.
.
.
.
.
.
.
.
.
.
.
.
.
.
.
.
.
.
.
.
.
.
.
.
.
.
.
.
.
.
.
.
.
.
.
.
.
.
.
.
.
.
.
.
.
.
.
.
.
.
.
.
.
.
.
.
.
.
.
.
.
.
.
.
.
.
.
.
.
.
.
.
.
.
.
.
.
.
.
.
.
.
.
.
.
.
.
.
.
.
.
.
.
.
.
.
.
.
.
.
.
.
.
.
.
.
.
.
.
.
.
.
.
.
.
.
.
.
.
.
.
.
.
.
.
.
.
.
.
.
.
.
.
.
.
.
.
.
.
.
.
.
.
.
.
.
.
.
.
.
.
.
.
.
.
.
.
.
.
.
.
.
.
.
.
.
.
.
.
.
.
.
.
.
.
.
.
.
.
.
.
.
.
.
.
.
.
.
.
.
.
.
.
.
.
.
.
.
.
.
.
.
.
.
.
.
.
.
.
.
.
.
.
.
.
.
.
.
.
.
.
.
.
.
.
.
.
.
.
.
.
.
.
.
.
.
.
.
.
.
.
.
.
.
.
.
.
.
.
.
.
.
.
.
.
.
.
.
.
.
.
.
.
.
.
.
.
.
.
.
.
.
.
.
.
.
.
.
.
.
.
.
.
.
.
.
.
.
.
.
.
.
.
.
.
.
.
.
.
.
.
.
.
.
.
.
.
.
.
.
.
.
.
.
.
.
.
.
.
.
.
.
.
.
.
.
.
.
.
.
.
.
.
.
.
.
61
61
61
61
61
62
62
62
62
63
63
63
65
66
66
66
66
67
67
69
69
69
70
71
72
72
72
74
74
74
75
75
76
76
77
77
78
78
78
Opening a workspace or report from My Favorites . . .
Removing a workspace or report from My Favorites. . .
Printing a workspace . . . . . . . . . . . . . .
Creating PDF files from workspace widgets . . . . . .
Exporting workspace widgets to different formats . . . .
Export a workspace widget . . . . . . . . . . . .
Making reports accessible to users with disabilities . . . .
Drilling to view related data. . . . . . . . . . . .
Drilling up or drilling down. . . . . . . . . . .
Synchronizing drill up and drill down . . . . . . .
Go to another target report . . . . . . . . . . .
Viewing report versions . . . . . . . . . . . . .
Creating watch rules for specific conditions. . . . . . .
Creating watch rules for different condition status indicators .
Defining alert details for watch rules . . . . . . . . .
Viewing, modifying, or deleting a watch rule . . . . . .
Viewing lineage information for a data item . . . . . .
View lineage information for a data item . . . . . .
Viewing information cards . . . . . . . . . . . .
Accessing the IBM InfoSphere Business Glossary . . . . .
.
.
.
.
.
.
.
.
.
.
.
.
.
.
.
.
.
.
.
.
.
.
.
.
.
.
.
.
.
.
.
.
.
.
.
.
.
.
.
.
.
.
.
.
.
.
.
.
.
.
.
.
.
.
.
.
.
.
.
.
.
.
.
.
.
.
.
.
.
.
.
.
.
.
.
.
.
.
.
.
.
.
.
.
.
.
.
.
.
.
.
.
.
.
.
.
.
.
.
.
.
.
.
.
.
.
.
.
.
.
.
.
.
.
.
.
.
.
.
.
Chapter 5. Collaborating with IBM Cognos Business Insight
Collaborating by using comments . . . . . . . . . . . .
Adding comments . . . . . . . . . . . . . . . .
Viewing comments . . . . . . . . . . . . . . . .
Editing or deleting comments . . . . . . . . . . . .
Collaborating by using IBM Connections activities . . . . . .
Starting a workspace activity . . . . . . . . . . . .
Accessing IBM Connections from IBM Cognos Business Insight .
Adding members to an activity . . . . . . . . . . . .
Changing the access for an activity . . . . . . . . . .
Adding sections to an activity . . . . . . . . . . . .
Adding entries to an activity . . . . . . . . . . . .
Working with to-do items in an activity . . . . . . . . .
Creating to-do items for an activity . . . . . . . . . .
Marking to-do items as complete . . . . . . . . . . .
Adding comments to an activity . . . . . . . . . . .
Marking activities as complete. . . . . . . . . . . .
Saving an activity as a template . . . . . . . . . . .
Tuning out of or in to an activity . . . . . . . . . . .
Opening a workspace from IBM Connections. . . . . . .
Viewing workspace activities . . . . . . . . . . . .
Using IBM Connections to collaborate outside of a workspace . .
.
.
.
.
.
.
.
.
.
.
.
.
.
.
.
.
.
.
.
.
.
.
.
.
.
.
.
.
.
.
.
.
.
.
.
.
.
.
.
.
.
.
.
.
.
.
.
.
.
.
.
.
.
.
.
.
.
.
.
.
.
.
.
.
.
.
.
.
.
.
.
.
.
.
.
.
.
.
.
.
.
.
.
.
.
.
.
.
.
.
.
.
.
.
.
.
.
.
.
.
.
.
.
.
.
.
.
.
.
.
.
.
.
.
.
.
.
.
.
.
.
.
.
.
.
.
.
.
.
.
.
.
.
.
.
.
.
.
.
.
.
.
.
.
.
.
.
.
.
.
.
.
.
.
.
.
.
.
.
.
.
.
.
.
.
.
.
.
.
.
.
.
.
.
.
.
.
.
.
.
.
.
.
.
.
.
.
.
.
.
.
.
.
.
.
.
.
.
.
.
.
.
.
.
.
.
.
.
.
.
.
.
.
.
.
.
.
.
.
.
.
.
.
.
.
.
.
.
.
.
.
.
.
.
.
.
.
.
.
.
.
.
.
.
.
.
.
.
.
.
.
.
.
.
.
.
.
.
.
.
.
.
79
79
80
80
81
82
83
83
83
84
84
84
85
85
86
87
88
88
89
89
. . . . . . . . . . . . 91
.
.
.
.
.
.
.
.
.
.
.
.
.
.
.
.
.
.
.
.
.
.
.
.
.
.
.
.
.
.
.
.
.
.
.
.
.
.
.
.
.
.
.
.
.
.
.
.
.
.
.
.
.
.
.
.
.
.
.
.
.
.
.
.
.
.
.
.
.
.
.
.
.
.
.
.
.
.
.
.
.
.
.
.
.
.
.
.
.
.
.
.
.
.
.
.
.
.
.
.
.
.
.
.
.
.
.
.
.
.
.
.
.
.
.
.
.
.
.
.
.
.
.
.
.
.
.
.
.
.
.
.
.
.
.
.
.
.
.
.
.
.
.
.
.
.
.
.
.
.
.
.
.
.
.
.
.
.
.
.
.
.
.
.
.
.
.
.
.
.
.
.
.
.
.
.
.
.
.
.
.
.
.
.
.
.
.
.
.
.
.
.
.
.
.
.
.
.
.
.
.
.
.
.
.
.
.
.
.
.
.
.
.
.
.
.
.
.
.
.
.
.
.
.
.
.
.
.
.
.
.
.
.
.
.
.
.
.
.
.
.
.
.
.
.
.
.
.
.
.
.
.
.
.
.
.
.
.
.
.
.
.
.
.
.
.
.
.
.
.
.
.
.
.
.
.
.
.
.
.
.
.
.
.
.
.
.
.
.
.
.
.
.
. 91
. 92
. 93
. 93
. 94
. 94
. 96
. 97
. 97
. 97
. 98
. 99
. 99
. 100
. 100
. 101
. 101
. 102
. 102
. 103
. 103
Chapter 6. Samples . . . . . . . . . . . . . . . . . . . . . . . . . . . . . . 105
The Sample Outdoors Company . . . . . . . .
Samples in the GO Data Warehouse (analysis) package
Employee Satisfaction Workspace. . . . . . .
Samples in the GO Data Warehouse (query) package .
Marketing workspace. . . . . . . . . . .
Recruiting workspace. . . . . . . . . . .
Revenue data workspace . . . . . . . . .
Sales By Year workspace . . . . . . . . .
Interactive samples . . . . . . . . . . . .
Sales workspace . . . . . . . . . . . .
.
.
.
.
.
.
.
.
.
.
.
.
.
.
.
.
.
.
.
.
.
.
.
.
.
.
.
.
.
.
.
.
.
.
.
.
.
.
.
.
.
.
.
.
.
.
.
.
.
.
.
.
.
.
.
.
.
.
.
.
.
.
.
.
.
.
.
.
.
.
.
.
.
.
.
.
.
.
.
.
.
.
.
.
.
.
.
.
.
.
.
.
.
.
.
.
.
.
.
.
.
.
.
.
.
.
.
.
.
.
.
.
.
.
.
.
.
.
.
.
.
.
.
.
.
.
.
.
.
.
.
.
.
.
.
.
.
.
.
.
.
.
.
.
.
.
.
.
.
.
.
.
.
.
.
.
.
.
.
.
.
.
.
.
.
.
.
.
.
.
.
.
.
.
.
.
.
.
.
.
.
.
.
.
.
.
.
.
.
.
.
.
.
.
.
.
.
.
.
.
105
106
106
106
106
106
106
106
107
107
Appendix. Accessibility features . . . . . . . . . . . . . . . . . . . . . . . . 109
Accessibility features in IBM Cognos Business Insight . . . . .
Keyboard shortcuts . . . . . . . . . . . . . . . .
Viewing a workspace in Microsoft Windows high contrast mode .
.
.
.
.
.
.
.
.
.
.
.
.
.
.
.
.
.
.
.
.
.
.
.
.
.
.
.
.
.
.
.
.
.
.
.
.
.
.
.
.
.
.
.
.
.
. 109
. 109
. 117
Contents
v
Notices . . . . . . . . . . . . . . . . . . . . . . . . . . . . . . . . . . . 119
Glossary . . . . . . . . . . . . . . . . . . . . . . . . . . . . . . . . . . 123
A
B
C
D
E
F
G
H
I.
J.
L
M
N
O
P
Q
R
S
T
U
W
.
.
.
.
.
.
.
.
.
.
.
.
.
.
.
.
.
.
.
.
.
.
.
.
.
.
.
.
.
.
.
.
.
.
.
.
.
.
.
.
.
.
.
.
.
.
.
.
.
.
.
.
.
.
.
.
.
.
.
.
.
.
.
.
.
.
.
.
.
.
.
.
.
.
.
.
.
.
.
.
.
.
.
.
.
.
.
.
.
.
.
.
.
.
.
.
.
.
.
.
.
.
.
.
.
.
.
.
.
.
.
.
.
.
.
.
.
.
.
.
.
.
.
.
.
.
.
.
.
.
.
.
.
.
.
.
.
.
.
.
.
.
.
.
.
.
.
.
.
.
.
.
.
.
.
.
.
.
.
.
.
.
.
.
.
.
.
.
.
.
.
.
.
.
.
.
.
.
.
.
.
.
.
.
.
.
.
.
.
.
.
.
.
.
.
.
.
.
.
.
.
.
.
.
.
.
.
.
.
.
.
.
.
.
.
.
.
.
.
.
.
.
.
.
.
.
.
.
.
.
.
.
.
.
.
.
.
.
.
.
.
.
.
.
.
.
.
.
.
.
.
.
.
.
.
.
.
.
.
.
.
.
.
.
.
.
.
.
.
.
.
.
.
.
.
.
.
.
.
.
.
.
.
.
.
.
.
.
.
.
.
.
.
.
.
.
.
.
.
.
.
.
.
.
.
.
.
.
.
.
.
.
.
.
.
.
.
.
.
.
.
.
.
.
.
.
.
.
.
.
.
.
.
.
.
.
.
.
.
.
.
.
.
.
.
.
.
.
.
.
.
.
.
.
.
.
.
.
.
.
.
.
.
.
.
.
.
.
.
.
.
.
.
.
.
.
.
.
.
.
.
.
.
.
.
.
.
.
.
.
.
.
.
.
.
.
.
.
.
.
.
.
.
.
.
.
.
.
.
.
.
.
.
.
.
.
.
.
.
.
.
.
.
.
.
.
.
.
.
.
.
.
.
.
.
.
.
.
.
.
.
.
.
.
.
.
.
.
.
.
.
.
.
.
.
.
.
.
.
.
.
.
.
.
.
.
.
.
.
.
.
.
.
.
.
.
.
.
.
.
.
.
.
.
.
.
.
.
.
.
.
.
.
.
.
.
.
.
.
.
.
.
.
.
.
.
.
.
.
.
.
.
.
.
.
.
.
.
.
.
.
.
.
.
.
.
.
.
.
.
.
.
.
.
.
.
.
.
.
.
.
.
.
.
.
.
.
.
.
.
.
.
.
.
.
.
.
.
.
.
.
.
.
.
.
.
.
.
.
.
.
.
.
.
.
.
.
.
.
.
.
.
.
.
.
.
.
.
.
.
.
.
.
.
.
.
.
.
.
.
.
.
.
.
.
.
.
.
.
.
.
.
.
.
.
.
.
.
.
.
.
.
.
.
.
.
.
.
.
.
.
.
.
.
.
.
.
.
.
.
.
.
.
.
.
.
.
.
.
.
.
.
.
.
.
.
.
.
.
.
.
.
.
.
.
.
.
.
.
.
.
.
.
.
.
.
.
.
.
.
.
.
.
.
.
.
.
.
.
.
.
.
.
.
.
.
.
.
.
.
.
.
.
.
.
.
.
.
.
.
.
.
.
.
.
.
.
.
.
.
.
.
.
.
.
.
.
.
.
.
.
.
.
.
.
.
.
.
.
.
.
.
.
.
.
.
.
.
.
.
.
.
.
.
.
.
.
.
.
.
.
.
.
.
.
.
.
.
.
.
.
.
.
.
.
.
.
.
.
.
.
.
.
.
.
.
.
.
.
.
.
.
.
.
.
.
.
.
123
123
123
124
125
125
125
126
126
126
126
126
127
127
127
128
128
128
129
129
129
Index . . . . . . . . . . . . . . . . . . . . . . . . . . . . . . . . . . . . 131
vi
IBM Cognos Express Version 10.1.0: Business Insight User Guide
Introduction
This document is intended for use with IBM® Cognos® Business Insight. It
provides step-by-step procedures and background information to help you create
workspaces. IBM Cognos Business Insight is a web product for creating interactive
workspaces using IBM Cognos content, as well as external data sources, according
to your specific information needs.
Audience
To use this information, you should have knowledge of your business
requirements.
Finding information
To find IBM Cognos product documentation on the web, including all translated
documentation, access one of the IBM Cognos Information Centers. Release Notes
are published directly to Information Centers, and include links to the latest
technotes and APARs.
You can also read PDF versions of the product release notes and installation guides
directly from IBM Cognos product disks.
Accessibility features
Accessibility features help users who have a physical disability, such as restricted
mobility or limited vision, to use information technology products. IBM Cognos
Business Insight has accessibility features. For information on these features, see
the accessibility section in this document.
How-to videos
To help you get the most value from IBM Cognos Business Insight, IBM provides
instructional videos that you can access through the product. Depending on
feedback from you and other customers, we may choose to expand, or reduce the
role of videos in future releases. These videos are hosted on the Internet and might
not be available; for example, your Internet access might be blocked, or the hosting
server might be temporarily unavailable. All of the topics explained in these videos
are also covered in the online product documentation.
Forward-looking statements
This documentation describes the current functionality of the product. References
to items that are not currently available may be included. No implication of any
future availability should be inferred. Any such references are not a commitment,
promise, or legal obligation to deliver any material, code, or functionality. The
development, release, and timing of features or functionality remain at the sole
discretion of IBM.
Samples disclaimer
The Great Outdoors Company, GO Sales, any variation of the Great Outdoors
name, and Planning Sample depict fictitious business operations with sample data
© Copyright IBM Corp. 2010, 2012
vii
used to develop sample applications for IBM and IBM customers. These fictitious
records include sample data for sales transactions, product distribution, finance,
and human resources. Any resemblance to actual names, addresses, contact
numbers, or transaction values is coincidental. Other sample files may contain
fictional data manually or machine generated, factual data compiled from
academic or public sources, or data used with permission of the copyright holder,
for use as sample data to develop sample applications. Product names referenced
may be the trademarks of their respective owners. Unauthorized duplication is
prohibited.
viii
IBM Cognos Express Version 10.1.0: Business Insight User Guide
Chapter 1. What's new?
This section contains a list of new features for this release.
To review an up-to-date list of environments supported by IBM Cognos products,
including operating systems, patches, browsers, web servers, directory servers,
database servers, and application servers, visit the IBM Cognos support pages at
http://www.ibm.com.
For more information about new features for this release, see the New Features
Guide.
New features in version 10.1.1
There are several new features since the last release.
Resize charts
You can now resize a chart in a widget. In the previous release, resizing a chart
resulted in either scrollbars or white space in the widget. In this release, when you
resize a chart in a widget, the chart resizes to fit the widget. If there are multiple
charts in the widget, the charts will not resize.
Swap rows and columns
You can now swap rows and columns in crosstabs and charts to look at
information from a different perspective.
For more information on swapping rows and columns, see “Swap rows and
columns” on page 66.
Position Content pane to the left of the workspace
You can now configure the Content pane to appear on the left side of the
workspace.
By default, the Content pane appears on the right side of the workspace. For steps
on how to move the Content pane to the left side, see “Positioning the Content
pane” on page 10.
As a result of this change to the user interface, the Content button that was used to
expand and collapse the Content pane is removed from the application bar. There
are still several ways to expand the Content pane. For more information, see
“Content pane” on page 9. Also, the search field is moved from the application
toolbar to the top of the Content pane. The search field stays with the Content
pane regardless of whether you position the Content pane to the right or the left.
Add Active Report content
You can now add IBM Cognos Active Report content to Business Insight.
For more information see, “Active Report content” on page 26.
© Copyright IBM Corp. 2010, 2012
1
User interface improvements
IBM Cognos Business Insight has a lighter and cleaner user interface.
The new user interface includes the following enhancements:
v Borders, menus, buttons and fonts are lighter and cleaner.
v User interface performance is improved.
v A color picker allows you to easily set custom colors for widget backgrounds,
widget borders, and workspace backgrounds.
v Widget toolbars are removed from slider filters and select value filters. To access
the widget actions and properties, right-click on the widget to display the
context menu.
v You can position widgets closer together.
v Widget borders are thinner and only appear when you select a widget.
Dashboards are now workspaces
In IBM Cognos Business Insight, the term dashboard is replaced by the term
workspace to describe a web page that contains widgets that graphically represent
business data.
Improved thumbnails
Thumbnails in IBM Cognos Business Insight are improved to display a more
accurate view of the layout, including the background and widget colors of a
workspace. The thumbnails allow you to quickly locate and identify workspaces
on the Getting Started page, in the information cards, and in the thumbnail view of
the Content pane.
This release also includes performance enhancements for thumbnails.
If your thumbnails do not reflect your changes to the layout and the colors of a
workspace, restart your web browser.
If you prefer to use the thumbnails from the previous version of Business Insight,
contact your administrator.
More meaningful names for Analysis Studio report parts
IBM Cognos Analysis Studio now supports user-specified names for report parts. If
the author of an Analysis Studio report enters report part names, you will see the
report names in the Content pane in IBM Cognos Business Insight when the
Analysis Studio report is expanded.
Microsoft Internet Explorer support
Version 9 of the Microsoft Internet Explorer web browser is now supported for
IBM Cognos Business Insight.
For a full list of supported software environments, see http://www.ibm.com.
Mozilla Firefox support
Version 4 of the Mozilla Firefox web browser is now supported for IBM Cognos
Business Insight.
For a full list of supported software environments, see http://www.ibm.com.
2
IBM Cognos Express Version 10.1.0: Business Insight User Guide
Freedom Scientific JAWS support
Version 12 of Freedom Scientific JAWS is now supported for IBM Cognos Business
Insight.
For a full list of supported software environments, see http://www.ibm.com.
Larger worksheet sizes for Microsoft Excel 2007 report
outputs
IBM Cognos Business Intelligence now supports a larger worksheet size for report
outputs exported in Microsoft Excel 2007 format.
In previous versions of IBM Cognos Business Intelligence, report output in
Microsoft Excel format was limited to a maximum of 256 columns by 65,000 rows.
Although this remains as the default worksheet size, administrators can now
enable larger worksheets and change the maximum number of rows in a
worksheet - up to a maximum of 16,384 columns by 1,048,576 rows - by using
advanced server properties. This number matches the Microsoft Excel 2007
worksheet size limitations.
For more information, see the IBM Cognos Business Intelligence Administration and
Security Guide.
For an up-to-date list of environments supported by IBM Cognos products, such as
operating systems, patches, browsers, Web servers, directory servers, database
servers, and application servers, visit http://www.ibm.com/.
Related concepts:
“Exporting workspace widgets to different formats” on page 81
You can export individual report widgets that contain report content to the
following formats: PDF, Microsoft Excel, CSV, and XML.
Chapter 1. What's new?
3
4
IBM Cognos Express Version 10.1.0: Business Insight User Guide
Chapter 2. Understanding IBM Cognos Business Insight
IBM Cognos Business Insight is a web-based tool that allows you to use IBM
Cognos content and external data sources to build sophisticated interactive
workspaces that provide insight and facilitate collaborative decision making.
Launching IBM Cognos Business Insight
To get started using the product, there are several ways you can open IBM Cognos
Business Insight.
You can launch Business Insight using the following methods:
v From the IBM Cognos Business Intelligence Welcome page
v From IBM Cognos Connection by clicking the new workspace button
application bar
in the
v In a web browser by entering the URL for IBM Cognos Business Insight using
the following format: http://machinename/ibmcognos/cgi-bin/
cognos.cgi?b_action=icd or the URL that your administrator provides
v By clicking the hyperlinked name of an existing workspace object from IBM
Cognos Connection
v From the Launch menu in IBM Cognos Connection and IBM Cognos
Administration
v From a workspace listed in the search results in IBM Cognos Connection
Browser chrome
The browser chrome includes toolbars and menus on a web browser. Whether the
browser chrome is displayed depends on how you launch Business Insight.
Business Insight opens in a chromeless browser if you launch from the IBM
Cognos Business Intelligence Welcome page. If you launch directly in a browser by
entering a URL, then your browser displays the chrome.
Minimal support for Microsoft Internet Explorer 6
IBM Cognos Business Insight does not fully support Microsoft Internet Explorer 6.
When you use this browser, Business Insight might function correctly; however,
performance is reduced and the appearance is degraded. For intended visual
display and performance, use a more recent browser such as Mozilla Firefox
version 3.5 or higher, or Microsoft Internet Explorer 8.
Logging on
IBM Cognos software supports authenticated and anonymous user access. To use
IBM Cognos software as an authenticated user, you must successfully log on.
If you want to see a summary of your logon information for the current session,
complete the following. From the workspace Actions Menu launch IBM Cognos
Connection, click My Area Options, My Preferences and then click the Personal
tab. This is not available to anonymous users.
© Copyright IBM Corp. 2010, 2012
5
Before you begin
During the logon process, you must provide your credentials, such as user ID and
password, as required by your organization. Anonymous users do not log on.
Procedure
1. On the application bar, click the Actions Menu button
and select Log On.
2. If the namespace Log on page appears, in the Namespace box, select the
namespace you want to use.
3. Type your user ID and password, and click OK.
Results
Your session starts.
Logging off
You log off to end your session. Even if you used multiple namespaces in the
session, you log off only once.
If you close your web browser without logging off, your session ends.
Procedure
1. On the application bar, click the Actions Menu button
and select Log Off.
You are now logged off of all the namespaces that you were using.
2. Choose whether to log on again:
v If you do not want to log on again, close your web browser.
v If you want to log on as an authenticated user, click Log on again.
v If you want to log on as an anonymous user, click Open a session as an
anonymous user. This is available only if your administrator set it up.
6
IBM Cognos Express Version 10.1.0: Business Insight User Guide
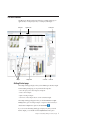
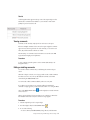
The user interface
The IBM Cognos Business Insight user interface has a Getting Started page, an
application bar, a workspace layout area, a content pane, and widgets.
Workspace
Widgets
Content pane
Application bar
Widget toolbar
Content tab
Toolbox tab
Getting Started page
The Getting Started page displays when you launch IBM Cognos Business Insight.
From the Getting Started page you can perform the following tasks:
v
v
v
v
View and open your favorite workspaces and reports
Create a new workspace
Open an existing workspace
View how-to videos that provide an overview to Business Insight
The Getting Started page disappears when you click the Create New or Open
Existing buttons, open an existing workspace or report from the favorites list, or
select the New or Open menu options in the Actions Menu
.
If you do not want the Getting Started page to display every time you launch
Business Insight, you can disable it from the My Preferences menu option.
Chapter 2. Understanding IBM Cognos Business Insight
7
Application bar
The application bar displays the name of the current workspace.
The application bar contains the following icons:
v
Access the application Actions Menu
v
Create a new workspace
v
Open an existing workspace
v
Save a workspace
v
Email the workspace as a link
v
Collaborate on the workspace using IBM Connections
Note: You will see this icon only if collaboration is set up.
v
Refresh all widgets on the workspace
v
Set the workspace layout and edit the workspace style
v
Open the Content pane to insert content or toolbox widgets onto the
workspace
Return to your home page, or specify a new home page
v
v
Access the help system, launch how-to videos, and find additional
information about Business Insight and other IBM Cognos products from the
Help menu
Add a workspace to or remove a workspace from your list of favorites
v
v Open the Content pane to access the Content and Toolbox tabs
Search for content
v
Workspace
Use a workspace to combine data from various sources and gain insight into your
business. A workspace is a collection of widgets that typically display tables or
charts of data, text, images, HTML pages, or RSS feeds.
Dotted guidelines appear when you insert, move, or resize widgets. They provide
a visual aid to assist you in aligning widgets.
To assist with content formatting, IBM Cognos Business Insight has two layout
actions that automatically arrange the widgets on the workspace:
v Fit All Widgets to Window
v
Arrange All Widgets to Fit Content
For more information on these layout actions, see “Modifying the workspace
layout” on page 48.
8
IBM Cognos Express Version 10.1.0: Business Insight User Guide
Content pane
The Content pane is available on-demand and displays the objects that you can
add to the workspace.
When you launch the Getting Started page, the Content pane is collapsed. You can
expand the Content pane in the following ways:
v On the Getting Started page, click the Create New button.
v On the far right or left edge of the Getting Started page, click the middle of the
collapsed Content pane.
v On the application bar, click the new button
v On the application bar, click the insert button
.
, and select Insert Content.
The Content pane contains two tabs: Content and Toolbox. The Content tab
displays IBM Cognos content that you can add to the workspace. The Toolbox tab
displays widgets that access other types of content such as, images and web pages,
and widgets that control the data on the workspace. You insert objects by dragging
them from the Content and Toolbox tabs to the workspace.
Tip: In the Content pane, you can also right-click objects to insert them on the
workspace, or select the object and use the keyboard shortcut Ctrl+Shift+Enter.
Content tab
The Content tab displays the IBM Cognos content that can be added to a
workspace and workspaces that can be opened. The content is the same content
that is displayed in IBM Cognos Connection, excluding any content that has been
filtered out.
There are two expandable folders:
v My Folders contains your personal content and workspaces.
v Public Folders contains entries that are of interest to and can be viewed by
many users.
Within the Content tab, you can enable and disable the display of information
. For more information, see
cards by clicking the information card button
“Viewing information cards” on page 89. You can also refresh the content in this
tab by clicking the refresh button
.
The Content tab displays content in one of the following views:
v Thumbnail
v List
v Tree
Within each of these views, you can filter the content. The available filters are
accessed from the drop-down list at the top of the Content tab. You can filter by
using the following criteria:
v All Content displays all content in the content store, excluding any content that
is not supported in Business Insight. This is the default setting.
Chapter 2. Understanding IBM Cognos Business Insight
9
My Favorites displays workspaces and reports that have been marked as
favorites.
v My Folders displays only the content in your My Folders folder.
v Search Results displays content based on search results. You must first perform
a search, otherwise this filter is not available.
v
Toolbox tab
The Toolbox tab displays additional widgets provided by Business Insight. The
slider filter and select value filter widgets allow you to filter report content. The
other toolbox widgets allow you to add more report content to the workspace,
such as HTML content, images, RSS feeds, and rich text. For a list of toolbox
widgets, see “Toolbox widgets” on page 11.
Positioning the Content pane
You can customize the position of the Content pane. The default location of the
Content pane is to the right of the workspace. You can move the Content pane to
the left side if you prefer.
Procedure
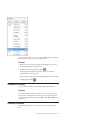
1. On the application bar, click the Actions Menu button and click My
Preferences.
2. Then, in the Set Preferences window, clear the Position pane on the right
check box, and click OK.
3. Refresh your web browser.
Widgets
Objects you add from the Content pane to the workspace are displayed in widgets.
Widgets are containers that allow you to interact with and manipulate the content
contained within them.
Widgets have an on-demand toolbar that is displayed when the widget is selected
or in focus. The available toolbar options depend on the type of widget and the
content displayed in the widget. Slider filters and select value filters do not have a
toolbar. To access the widget actions on a slider filter or select value filter,
right-click on the widget.
Widgets can also communicate with other widgets. For example, you can use a
select value filter widget to control what data is dynamically filtered in a report
widget.
Maximizing widgets
You can maximize a widget to view the report content in more detail or to view
the content that exceeds the size of the widget. Maximizing is useful for viewing
report content in large complex tables and detailed charts that cannot be fully
displayed in the widget within the constraints of the other workspace objects.
To maximize a widget, on the top right of the widget toolbar, click the maximize
10
button
. To restore the widget and view the workspace again, click the restore
button
.
IBM Cognos Express Version 10.1.0: Business Insight User Guide
Tip: You can also modify the number of rows to display in a widget. For more
information, see “Set report widget properties” on page 25.
Content widgets
The following widgets are used when content objects are added to the workspace
from the Content tab.
Report widget:
When a report object (report or report part) is added to a workspace, it is
displayed in a report widget. Report objects include reports created in IBM Cognos
Report Studio, IBM Cognos Query Studio, IBM Cognos Analysis Studio, and IBM
Cognos Metric Studio.
Report views and saved report output versions are also viewed in a report widget.
For more information on report widget content, see “Report content” on page 21.
IBM Cognos Navigator widget:
You can add an IBM Cognos Navigator widget to the workspace by dragging a
folder item from the Content tab to the workspace. Folder items include content
folders and packages. Use this widget to browse a list of links that open published
IBM Cognos reports and other entries in IBM Cognos Viewer or the associated
studio.
You can also open the same navigation view in IBM Cognos Connection by
in the widget. For more information, see “IBM
clicking the arrow button
Cognos Navigator” on page 30.
PowerPlay widget:
When a IBM Cognos PowerPlay® report is added to a workspace, it is displayed in
HTML in a PowerPlay widget or as a PDF in a widget.
For more information, see “PowerPlay content” on page 26.
TM1 widget:
When IBM Cognos TM1® Websheets or TM1 Cube views are added to a
workspace, they are displayed in HTML in TM1 widgets.
For more information, see “TM1 content” on page 28.
Toolbox widgets
You can add toolbox widgets to the workspace from the Toolbox tab.
Note: If any toolbox widgets are missing, it might be because your system
administrator has removed access to them.
Image widget
The image widget is used to display images. For more information, see “Adding
an image widget” on page 35.
Chapter 2. Understanding IBM Cognos Business Insight
11
My Inbox widget
The My Inbox widget is used to show a Really Simple Syndication (RSS) feed of
your secure approval requests, ad-hoc tasks, and notification requests from My
Inbox in IBM Cognos Connection. For more information, see “Adding a My Inbox
widget” on page 36.
RSS feed widget
The RSS feed widget is used to display RSS news feeds. For more information, see
“Adding an RSS feed widget” on page 37.
Select value filter widget
The select value filter widget is used to filter the data in other widgets; you select
or deselect the data items you want to display or remove. For more information,
see “Adding a select value filter widget” on page 39.
Slider filter widget
The slider filter widget is used to filter the data in other widgets; you display or
remove data items using a range slider filter. For more information, see “Adding a
slider filter widget” on page 41.
Text widget
The text widget is used to enter, format, and display text. For more information,
see “Adding a text widget” on page 43.
Web page widget
The web page widget is used to display HTML based content. For more
information, see “Adding a web page widget” on page 44.
Actions menus
An action menu is available for the workspace and for each widget on the
workspace. The items available in each menu depend on user capabilities and the
type of widget selected.
Actions menu
The available actions at the application level include the following menu options:
v New creates a new workspace.
v
v
v
v
Open opens an existing workspace.
Save saves changes to a workspace.
Save As saves a workspace with a new file name or new location.
Email Link sends the URL of the current workspace by email, or copies the
URL to the clipboard so it can be pasted into other documents.
Copy Link to Clipboard copies the URL to the clipboard so it can be pasted
into other documents.
v Edit Workspace Style changes the visual appearance of the workspace style and
widgets to customize the look of your workspace.
v
12
IBM Cognos Express Version 10.1.0: Business Insight User Guide
My Preferences sets personal preferences for accessibility support for reports,
Getting Started page display, product and content language, and time zone.
v Log On if your system requires authenticated access to launch Business Insight.
Log off to end your session.
v Launch starts installed IBM Cognos applications that you have permission to
use.
v
v
Refresh All refreshes all workspace widgets.
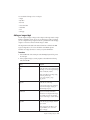
Widget actions
The actions available for a widget depend on the widget content and widget type.
All workspace widgets provide the following actions:
Remove from Workspace deletes the widget and content from the workspace.
Listen for Widget Events sets widget to widget communication.
Resize to Fit Content makes the widget the right size to display all of its
content without excess white space or scrollbars.
v Send to Back makes the selected widget appear behind other widgets when
two or more widgets overlap.
v
v
v
v
Properties sets the available properties for the widget.
Report widgets also provide the following actions:
v Print as PDF prints the selected widget content to a PDF document.
v Export to creates PDF, Excel, CSV or XML format versions of the widget data.
v Versions displays different versions of the report content if there are saved
output versions available.
v Refresh updates the widget content with the latest data.
v Prompt Again displays the prompt values if the widget contains prompted
report content.
v Reset updates the report content to the most recent version.
v Do More opens the report in the advanced mode. This mode allows you to
change the report content and apply more advanced sorting, filtering,
calculations, summaries, and formatting.
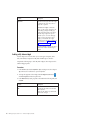
PowerPlay widgets provide the standard widget actions as well as the following
actions:
v Export creates CSV and XLS format versions of the widget data.
v Refresh updates the widget content with the latest data.
v Show Dimension Viewer displays the dimension view in the widget.
TM1 Cube Viewer widgets provide the standard widget actions, as well as the
following actions:
v Refresh updates the widget content with the latest data.
v
v
Reset sets the Cube view to the original view.
Restart restarts a session after a session timeout.
TM1 Websheet widgets provide the standard widget actions.
Chapter 2. Understanding IBM Cognos Business Insight
13
Setting a home page
You can set any saved workspace in IBM Cognos Business Insight as your home
page.
When you set a home page, you can click the home icon
home page at anytime.
to return to your
Procedure
1. Open the workspace you want to set as your new home page.
2. On the application bar, next to the home icon
Set Workspace as Home.
, click the arrow and select
Resetting a home page to the default setting
After you set a home page, you can reset it back to the default IBM Cognos
Connection Public Folders view.
Procedure
1. Launch Cognos Connection.
2. Next to the home icon
, click the arrow and select Set View as Home.
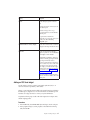
Upgrading IBM Cognos 8 Go! Dashboards
Workspaces created in IBM Cognos 8 Go! Dashboard are upgraded when they are
opened in IBM Cognos Business Insight. All of the content is maintained; however,
some interactions and layout customization might be lost or changed. The
workspace must be saved to be fully upgraded in the content store.
To view workspaces that were created in Go! Dashboard in Business Insight, it is
necessary to export the entire content store when deploying the content from the
old content store to the new content store. For more information, see the upgrade
section in the IBM Cognos Business Intelligence Installation and Configuration Guide.
Feature changes
There are some significant changes that you might notice when using an upgraded
workspace.
Modes
In Go! Dashboard, Assembly mode was used for creating and formatting
workspaces and Interactive mode was used for viewing and interacting with
workspaces. In IBM Cognos Business Insight, there are no modes. The same view
is used for creating, viewing, and interacting with workspaces.
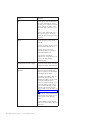
Portlet upgrade and support
The IBM Cognos Viewer portlet is replaced by the report widget. Content that was
displayed in the IBM Cognos Viewer portlet in Go! Dashboard is now displayed in
the report widget in Business Insight.
14
IBM Cognos Express Version 10.1.0: Business Insight User Guide
The IBM Cognos Navigator portlet is supported; however, it now displays as a
widget. The Navigator widget is not available in the Toolbox tab, although it can
still be added to a workspace by dragging a folder from the Content tab onto the
workspace.
The IBM Cognos Search portlet is also displayed as a widget on upgraded
workspaces; however, it is not available in the Toolbox tab. Business Insight has
built-in enhanced search and navigation options that allow you to use full-text
search to locate content.
The Bookmarks Viewer portlet is supported in Business Insight only for upgrades.
If a workspace that was created in Go! Dashboard contains a Bookmarks Viewer
portlet and it is opened in Business Insight, the Bookmarks Viewer displays. In
Business Insight, you cannot add a Bookmarks Viewer to a workspace.
If a workspace that was created in Go! Dashboard contains IBM Cognos Metric
Studio content and it is opened in Business Insight, that content is displayed in a
report widget.
The HTML viewer, image viewer, RSS viewer, and rich text portlets are all
supported in Business Insight as Web page, image, RSS feed, and text widgets
respectively. Some of the configuration properties have changed, though the
functionality of each remains the same.
The Slider portlet is replaced by the slider filter widget. Unlike the Slider portlet,
the slider filter widget in Business Insight filters report content based on a selected
data item. For more information, see “Filter support.”
The Checkbox List portlet has been replaced by the select value filter widget. The
select value filter widget allows you to specify the selection style for the filter:
check boxes or a list.
In Go! Dashboard, you could modify the following advanced properties for a
report to control the behavior of IBM Cognos Viewer portlets on a workspace:
v Fragment action
v Prompt the user
v Prompt values
v Drill down and drill up
v Report-based drill through
v Show toolbar
v Channel
The settings for these properties are not upgraded. These features still exist in
Business Insight however, they are handled differently. Use the Listen for Widget
Events dialog box to select or clear the check boxes beside the events that you
want or do not want the widget to receive information from. For more information,
see “Widget to widget communication” on page 46.
Filter support
In Go! Dashboard, report content was refined using the Slider and Checkbox List
controls. These controls were used to show and hide content based on the selected
control settings. In Business Insight, content is filtered using the slider filter and
the select value filter widgets. For more information, see “Filtering with slider filter
Chapter 2. Understanding IBM Cognos Business Insight
15
and select value filter widgets” on page 69.
Layout and style changes
In Go! Dashboard, you could select a predefined template to assist in the layout of
your content on the workspace. Business Insight has a free-form layout with
guidelines to help align widgets vertically and horizontally. When a workspace
that was created in Go! Dashboard is upgraded to Business Insight, the original
layout is maintained as much as possible. Business Insight also has two layout
actions that assist in sizing the widgets on the workspace. For more information,
see “Modifying the workspace layout” on page 48.
In Go! Dashboard, you could apply predefined themes to a workspace. On
upgrade to Business Insight, the theme is maintained as much as possible, but a
new theme cannot be applied. To make changes to an upgraded workspace that
has an applied theme, you can modify the workspace style and widget formatting.
For more information, see “Editing the workspace style” on page 49.
Display properties
Properties set at the widget level in Go! Dashboard will not display in Business
Insight. However, there is one exception; custom titles set in Go! Dashboard at the
widget level will display if the title is set to appear on the widget in Business
Insight.
Display properties set at the workspace level are upgraded and display in a
Business Insight workspace. However, not all the migrated display properties can
be modified in Business Insight.
The following table lists the display properties that can be set in Go! Dashboard
and whether the upgraded display properties can be configured in Business
Insight.
16
Display property you can upgrade from
Go! Dashboard
Upgraded display property configurable in
Business Insight?
Workspace background color
Yes
Workspace padding
No
Workspace background image show
Yes
Workspace background image URL
Yes
Workspace background image position
Yes
Workspace background image repeat
Yes
Widget margin
No
Widget title show
Yes
Widget content background color
Yes
IBM Cognos Express Version 10.1.0: Business Insight User Guide
Display property you can upgrade from
Go! Dashboard
Upgraded display property configurable in
Business Insight?
Widget title font
Yes
Widget title font weight
No
Widget title font size
Yes
Widget title font color
No
Widget title font alignment
No
Widget title font style
No
Widget title font decoration
No
Widget title background color
No
Widget title background image repeat
No
Widget title background image position
No
Widget title background image show
No
Widget title background image URL
No
Widget title border width
Yes
Widget title border color
Yes
Widget title border style
Yes
Upgrade limitations
The are some limitations you might encounter when you use workspaces in IBM
Cognos Business Insight that were originally created in IBM Cognos Go!
Dashboard.
v Communication between the IBM Cognos Viewer portlet and the IBM Cognos
Navigator and IBM Cognos Search portlets in upgraded workspaces is lost. For
example, in the upgraded workspace, it is no longer possible to click on a report
in IBM Cognos Navigator and have the selected report display in the associated
report widget.
v Although the IBM Cognos Viewer portlet is supported in upgraded workspaces
as a report widget, some of the original portlet properties are no longer
available. Also, if a workspace contains an IBM Cognos Viewer portlet that is
not configured to display report content, it is not displayed when the workspace
is opened in Business Insight.
v In Business Insight, report parts are displayed in a report widget and visual
appearance is slightly different than the Go! Dashboard portlet display. Also, the
size of report parts can change when the workspace is upgraded. This is because
Chapter 2. Understanding IBM Cognos Business Insight
17
the default height of the portlet was 250 pixels in Go! Dashboard. In Business
Insight, the height of the report widget is determined by the height of the
widget content.
v If you customized the column order or column sizes in a crosstab in Go!
Dashboard, the customizations are not maintained when you upgrade to
Business Insight. You cannot drag columns to re-size them in Business Insight.
v The original portlet layout properties from Go! Dashboard are not supported for
the associated widgets in Business Insight. If portlets were styled individually in
Go! Dashboard, when they are upgraded in Business Insight, the corresponding
widgets will all have the same appearance.
v Image widgets that use tiling in Go! Dashboard will have the tiling removed
when opened in Business Insight.
v IBM Cognos PowerPlay report parts are not supported in Business Insight. If a
workspace that contains PowerPlay report parts was created in Go! Dashboard
and is opened in Business Insight, the report parts are converted to PowerPlay
reports.
v Business Insight slider filters and select value filters do not support Go!
Dashboard date or time data items for Checkbox Lists and Sliders. If Checkbox
Lists or Sliders with date or time data items are upgraded to Business Insight,
users must select new data items in the filter properties.
v Go! Dashboard Slider filters might not upgrade properly to Business Insight
slider filters. If you upgrade Go! Dashboard Slider filters, users must select new
data items in the slider filter properties.
v In Go! Dashboard, enabling the "enable enhanced user features in saved output
versions" option allows report parts to be rendered as saved output. Rendering
saved output for report parts is not supported in Business Insight. Instead,
Business Insight renders live reports. As a result, a Go! Dashboard report might
look different when opened in Business Insight.
v In Go! Dashboard, you could apply styles to change the look and feel of
workspaces. The styles had names such as modern, contemporary, corporate,
and so on, and when applied, changed the colors and fonts for the user
interface. In Business Insight, the user interface is upgraded to one modern and
visually attractive style; you can no longer apply styles to the user interface.
Interaction changes
The interactions that are not available in IBM Cognos Business Insight are listed in
this section.
v In IBM Cognos Go! Dashboard, all rows of data were displayed for report parts.
In Business Insight, the first set of rows for a report part is displayed and you
must click the Next button to retrieve the next set of rows. This improves
performance. This change is also applicable to saved report part output versions.
v Re-ordering columns in crosstab reports that were authored using relational data
is not supported in Business Insight.
v Sorting by value in crosstab reports that were authored using relational data is
not supported in Business Insight.
v When report content was refined using the slider or checkbox list, an
information bar at the bottom of the IBM Cognos Viewer portlet identified the
data that was hidden. In Business Insight, report content is filtered using the
slider filter or select value filter widgets, and the filter criteria is now displayed
in the information bar at the top of each report object contained within the
report.
18
IBM Cognos Express Version 10.1.0: Business Insight User Guide
v
PowerPlay reports are supported in Business Insight and are displayed in a
PowerPlay widget. When PowerPlay reports are opened in HTML, the
PowerPlay toolbar is integrated into the widget toolbar so that PowerPlay
actions such as export, calculations, and suppression can be applied to the report
content. PowerPlay report content cannot interact with the slider filter and select
value filter widgets, and widget to widget communication is not supported.
v
IBM Cognos TM1 Cube views and TM1 Websheets are supported in Business
Insight. They are displayed in TM1 widgets, and the TM1 icons appear within
the widget. There are no TM1 icons on the TM1 widget toolbar. TM1 content
cannot interact with the slider filter and select value filter widgets.
The workspace layout format and behavior saved in Go! Dashboard is
maintained as much as possible when a workspace is opened in Business
Insight. In Go! Dashboard, portlets would automatically resize themselves to
accommodate the content displayed within them. For example, you drill down
in a list report and the resulting list is larger than the original list; the portlet
containing the list resizes to improve the display. This behavior is maintained in
Business Insight until you manually move or resize a widget. After that, a
widget does not automatically resize when the size of the report content
contained within changes.
Business Insight reports are always rendered in HTML.
In Business Insight, the widget styles are applied to all report widgets on a
workspace. Individual customized widget styles, such as widget background
color, border, or images, are not supported.
Depending on the type of data you are using, drilling down and back up in
Business Insight might result in the addition of more summary rows than the
original report had.
In Go! Dashboard, HTML content positioning was constrained to columns in
pre-defined page layouts. In Business Insight, widgets can be positioned
anywhere on the workspace and can even overlap.
The sort and reorder on Go! Dashboard columns might not upgrade to Business
Insight. This is especially true if the column names displayed in Go! Dashboard
are different from the model names.
v
v
v
v
v
v
v The "Default" chart palette in Go! Dashboard is called "Legacy" in Business
Insight.
v When you run a report in PDF format, curly brackets {} and parentheses () no
longer stay on the same line as the text before them. For example,
Products(2004) may now break to a new line between Products and (2004).
Chapter 2. Understanding IBM Cognos Business Insight
19
20
IBM Cognos Express Version 10.1.0: Business Insight User Guide
Chapter 3. Creating workspaces
Create workspaces with IBM Cognos Business Insight to give business users in
your organization an integrated Business Intelligence experience that includes
collaborative decision making. A workspace allows users to quickly complete a
wide variety of tasks such as viewing and interacting with reports and
collaborating and sharing information.
When you create an interactive workspace, you are assembling IBM Cognos
content. You can also add content from HTML and text sources.
Adding IBM Cognos content
You add IBM Cognos content objects to a workspace by dragging them from the
Content and Toolbox tabs onto the workspace.
Tip: You can use the keyboard shortcut Ctrl+Shift+Enter to add a selected content
object. You can also right-click an object to access the context menu.
You can add the following objects to a workspace:
v Reports
v Report parts such as tables and charts
v IBM Cognos PowerPlay reports
URLs
Folders
Prompt controls
Metric lists and individual metrics
IBM Cognos TM1 Websheets and TM1 Cube views
IBM Cognos Real-time Monitoring dashboard objects. For more information, see
the IBM Cognos Real-time Monitoring Dashboard User Guide.
v IBM Cognos Active Report reports
v
v
v
v
v
v
You can use the enhanced search feature of IBM Cognos Business Insight to find
and add relevant content to your workspace. For more information, see “Searching
for content” on page 32.
Report content
Report objects are displayed in a report widget. The objects in a report include
both full reports and the individual report parts, such as tables (lists and crosstabs)
and charts.
If you add a report that contains several report parts to the workspace, all of the
parts are displayed in a single report widget, including the report header and
footer. Add the individual report part to the workspace if you do not want to view
the full report. Report parts usually look better than reports on a workspace
because report parts do not display headers or footers in the report widget.
Note: As a best practice, use report parts whenever possible to improve workspace
layout and usability.
© Copyright IBM Corp. 2010, 2012
21
IBM Cognos Business Insight supports report objects that contain prompts, drill
through, and drill up and down.
There are several properties and style settings that you can specify to customize
the widget interface. You can also enable interactivity and communication between
widgets on the workspace.
Do more with Business Insight Advanced
You can perform advanced editing actions on report content by clicking the do
on the top right corner of the report widget toolbar. The report is
more button
opened in IBM Cognos Business Insight Advanced. Within Business Insight
Advanced, you can change the report content and apply more advanced sorting,
filtering, calculations, and summaries. You can also add a list, crosstab, or chart,
and format the report to enhance its appearance. Documenting the options and
actions available in Business Insight Advanced is outside the scope of this User
Guide. For more information, see the Business Insight Advanced User Guide.
Report versions
If there are multiple report output versions saved in HTML format in the content
store, you can view the saved report output versions or view the live version of
the report. By default, the report displays the latest saved output version. You can
also create watch rules based on specific conditions and thresholds for a given
report version.
Note: Only report versions saved in HTML format are supported in IBM Cognos
Business Insight.
For more information, see “Viewing report versions” on page 84.
Report prompts
A prompt is a report element that asks for parameter values before the report is
run. The resulting report content is filtered based on the parameter values.
If a report contains prompts, you might be prompted to select or enter values
when you add the report to the workspace, depending on the prompt settings that
the report author or system administrator specified.
When you save the workspace, the selected or entered prompt values are also
saved as part of the workspace. When you open a workspace that contains
prompted report objects, the saved prompt values are used and you are not
required to re-enter the prompt values.
If you refresh the workspace or the report widget, the report objects run, and the
most recent live data or saved output is retrieved from the content store. You are
not required to re-enter any prompt values for any prompted report content. The
saved prompt values are used.
You can change the prompt values for report content regardless of the default
prompt settings that are specified for the report. The report is run and live data is
filtered and returned based on the selected prompt value or values. For more
information, see “Changing the prompt values in a report” on page 74.
22
IBM Cognos Express Version 10.1.0: Business Insight User Guide
The Prompt Again action is only available on live reports. If you are viewing a
saved output version of a report, you must first view the live version of the report
before you can access the Prompt Again action. For more information, see “Report
versions” on page 22.
Tables and charts
You can navigate to the individual report parts (tables and charts) contained within
a report object in the Content tab.
Report data contained in tables include lists and crosstabs. Lists show detailed
information from a database, such as products and customers. A list shows data in
tabular format: rows and columns. Each column shows all the values for a data
item in the database or a calculation based on data items in the database. The
following graphic is an example of a table.
Crosstabs also show data in tabular format. However, the values at the intersection
points of rows and columns are summarized information rather than detailed
information.
Chapter 3. Creating workspaces
23
Charts provide a graphical way to present data. For information on the chart
formats that are supported in Business Insight, see “Supported chart formats” on
page 66.
To change the color palette for charts, see “Change the chart color palette” on page
66.
For detailed information on tables and charts, see the IBM Cognos Report Studio
User Guide.
You can change the display type for a table to a chart. You can also change a chart
to another chart type. For more information, see “Displaying data in lists,
crosstabs, and charts” on page 63.
Content contained in report widgets can interact with other report widgets and
with IBM Cognos Navigator, slider filter, and select value filter widgets. This
allows you to dynamically display, interact with, and filter report content. For
more information, see “Configuring widget communication” on page 46.
Metric Studio content
If IBM Cognos Metric Studio is installed and configured as part of your IBM
Cognos Business Intelligence environment, you can navigate Metric Studio content
in the Content tab.
You can add the following Metric Studio content to a workspace:
v Watch lists
v Scorecards
v Strategies
v Metric types
v Individual metrics
You can also navigate the report and other content contained within a metric
package. All metric content displays in report widgets.
If you add metric content such as a watch lists, scorecards, strategies or metric
types to the workspace, the content is displayed as a list of metrics for the selected
item. Each metric in the list has a hyperlink that opens the individual metric in
Metric Studio. You cannot change the display type for the list of metrics.
24
IBM Cognos Express Version 10.1.0: Business Insight User Guide
If you add an individual metric to the workspace, historical data for the metric
displays. By default, the data appears as a bar chart. For more information, see
“Displaying data in lists, crosstabs, and charts” on page 63.
Metric Studio content that is displayed as a report widget can interact with the
slider filter and select value filter widgets. For more information, see “Adding a
slider filter widget” on page 41 and “Adding a select value filter widget” on page
39.
For detailed information on metrics, see the Metric Studio User Guide.
Set report widget properties
After you add a report object to the workspace, you can set the properties for the
widget.
Use the properties dialog box to change the widget title and other content
properties for report widgets.
Procedure
1. Click the Widget Actions button
list, click Properties.
for the widget, and from the drop-down
2. Set the properties as described in the following tables, and click OK.
General property
Description
Widget title
Specifies the title of the widget. If no title is
specified, the report name is used.
Widget titles are only displayed if you select
the Show Titles option in the Widgets tab of
the Edit Workspace Style dialog box. By
default, widget titles are disabled. For more
information, see “Editing the workspace
style” on page 49.
For information on authoring workspaces
for use in multiple languages or locales, see
“Creating multilingual workspaces” on page
54.
Content property
Description
Maximum number of rows to show per
page
Specifies the maximum number of rows to
display per page for tabular reports and
report parts. The default value is 20.
The Maximum number of rows to show per
page property is the only widget property
that can be undone by using the undo
button
.
Chapter 3. Creating workspaces
25
Content property
Description
Prompt when workspace is opened
Specifies that if workspace reports contain
prompts, the prompts run when the
workspace starts. If this property is disabled,
the prompted reports use the last saved
prompt values. By default, prompts are
enabled.
Retrieve entire report
Specifies if the entire report loads into
memory when the workspace starts. By
default, this property is disabled and report
data is loaded one page at a time for better
workspace performance. This property is
only applicable to saved report output
versions. For more information, see
“Viewing report versions” on page 84.
View report specification
Displays the report specification in XML
format. The specification displays in a new
browser window. This is useful for
debugging reports that do not run properly.
Location
Displays where in the Content tab the report
is located. For example, the location might
look like the following: Public Folders >
Business Insight > Basic Report > List Basic.
Active Report content
You can navigate IBM Cognos Active Report content in the Content tab and add
Active Report content to the workspace.
The following conditions must be met to add Active Report reports to the
workspace:
v Active Report is installed and configured as part of your IBM Cognos Business
Intelligence environment
v You have the permissions and capabilities to view and interact with an active
report
v The active report must have a saved output. If you try to open an active report
that has no saved output, an error message appears. The active report author
must save the output of the report before you can view it on a workspace.
The active report widgets listen to each other if the active report author configured
the widgets to do so and you have more than one active report widget on a
workspace. The widget event in the Listen for Widget Events dialog box is
enabled by default. For more information, see “Configuring widget
communication” on page 46. To disable the communication between active report
widgets see, “Disabling widget communication” on page 47.
PowerPlay content
You can navigate IBM Cognos PowerPlay content in the Content tab and add
PowerPlay reports to the workspace.
26
IBM Cognos Express Version 10.1.0: Business Insight User Guide
The following conditions must be met to view PowerPlay content add PowerPlay
reports to the workspace:
v PowerPlay is installed and configured as part of your IBM Cognos Business
Intelligence environment
v You have the permissions and capabilities to view and interact with PowerPlay
content
Note: PowerPlay report content does not interact with the slider filter and select
value filter widgets. Widget to widget communication is also not supported.
Viewing PowerPlay content in HTML
When you drag PowerPlay objects to the workspace, a widget displays the
PowerPlay data in HTML format. The PowerPlay widget toolbar contains the
toolbar actions that are available in PowerPlay Studio.
The following list contains the available PowerPlay actions:
v Crosstab display
Switch between crosstab and indented crosstab display for the selected
PowerPlay report.
v Chart display
Select a chart type to display data graphically.
v Display options
Set report display options, add or edit report titles, view a crosstab and a chart
together, and reset report content.
v Swap rows and columns
Exchange the positions of categories in rows and columns.
v Hide and show categories
Selectively show or hide report categories.
v Calculations
Create a calculation that combines rows or columns to obtain a new item.
v Rank categories
Add rank categories to reports to show rank ordinals and compare categories.
v Zero suppression
Avoid displaying categories with zero values.
v 80/20 suppression
Remove rows or columns whose absolute values do not contribute to the top
80% of results.
v Custom exception highlighting
Emphasize specific data.
v Custom subsets
Define subsets of categories based on specified criteria to help you isolate,
explore, and analyze specific data elements.
v Drill through
Create drill through definitions to go to and from PowerPlay reports and IBM
Cognos BI reports.
For detailed information on PowerPlay reports, see the PowerPlay Studio User
Guide.
Chapter 3. Creating workspaces
27
Viewing PowerPlay content as a PDF
You can view PowerPlay reports in a widget on the workspace in PDF format.
Procedure
Right-click the PowerPlay content in the Content tab and, from the context menu,
select Insert as > PDF.
Set the PowerPlay widget title
After you add a PowerPlay object to the workspace, you can set the title for the
widget.
About this task
For steps on setting a widget title, see “Set report widget properties” on page 25.
TM1 content
You can access applications developed in IBM Cognos TM1 from within IBM
Cognos Business Insight in real time.
You can navigate TM1 content in the Content tab and add TM1 reports to the
workspace under the following conditions:
v TM1 is installed and configured as part of your IBM Cognos Business
Intelligence environment.
v You have the permissions and capabilities to view and interact with TM1
content.
Note: TM1 widgets do not interact with the slider filter and select value filter
widgets.
Adding TM1 content to Business Insight
When you drag TM1 objects to the workspace, they display in HTML format in
dedicated TM1 Viewer widgets. The TM1 toolbar buttons display on the widget
toolbar.
You can add the following TM1 content to the workspace:
v TM1 Websheet
v
v
TM1 Cube view
IBM Cognos TM1 Contributor
The TM1 Navigation Viewer is incorporated into the navigation in the content
pane and is not available as a separate widget.
For detailed information on TM1 Viewers, see the TM1 Developer Guide.
TM1 content is located in folders in the content pane. You can add only the
individual content objects; you cannot add the TM1 folders to the workspace.
There are two folders at the highest level in the tree: Applications and Views. The
Applications folder contains more folders, TM1 Websheet objects, and some TM1
Cube view objects. The Views folder contains TM1 Cubes and TM1 Cube view
objects.
28
IBM Cognos Express Version 10.1.0: Business Insight User Guide
If you change the data in a TM1 Cube view or a TM1 Websheet, you can click the
on the application bar to refresh the data for each TM1
Refresh All button
Cube view and TM1 Websheet on the workspace.
Adding TM1 Websheet Viewer widgets:
A Websheet is a spreadsheet with TM1 data that you can view in a web browser.
TM1 Websheet Viewer widgets provide the standard widget actions. For more
information on widget actions, see “Widget actions” on page 13.
Procedure
To add a TM1 Websheet Viewer widget, from the Content tab, drag content with
the TM1 Websheet icon
onto the workspace.
Adding TM1 Cube Viewer widgets:
The TM1 Cube Viewer widget displays a TM1 Cube view.
TM1 Cube Viewer widgets provide the standard widget actions as well as Reset
and Restart. For more information on widget actions, see “Widget actions” on page
13.
Also, TM1 Cube Viewer widgets listen to each other by default. You can disable
this communication. For more information, see “Widget to widget communication”
on page 46.
Procedure
To add a TM1 Cube Viewer widget, from the Content tab, drag content with the
TM1 Cube view icon
onto the workspace.
Viewing TM1 Contributor in a widget
TM1 Contributor displays in a Web page widget with a URL that a TM1
administrator specifies to point to a TM1 Contributor Web Client.
The TM1 Contributor object is located under Public Folders in the Content tab.
Procedure
1. In the Content tab, open the IBM Cognos TM1 Contributor Applications
folder, under Public Folders.
2. Drag the TM1 Contributor object onto the workspace.
Results
When you launch TM1 Contributor Web Client within the widget, a return arrow
button
in the top right corner provides navigation back to the main page.
For more information on TM1 Contributor, see the TM1 Contributor User Guide.
Chapter 3. Creating workspaces
29
Setting the TM1 widget title
After you add a TM1 object to the workspace, you can set the title for the widget.
Procedure
1. On the widget that you want to set the title for, select the border of the widget
to activate the widget toolbar.
for the widget and, from the drop-down
2. Click the Widget Actions button
list, click Properties.
3. Specify a title for the widget and select Show title on this widget.
For translated versions of the workspace, you can show this title on the widget
for other languages when the widget title is not specified in the other language.
To do so, select the Use title as default for other languages option.
IBM Cognos Navigator
Use this widget to add a navigation browser that contains a list of links that open
published IBM Cognos reports and other entries.
Complete the following steps to add a Navigator widget and to edit the widget
properties.
Procedure
1. In the Content tab, select a My Folders or Public Folders object and drag it
onto the workspace. The Navigator widget appears.
2. Click the Widget Actions button
list, click Edit Widget.
for the widget, and from the drop-down
3. In the properties dialog box, edit the properties as described in the following
table, and click OK.
Property
Description
Title
Specifies the title for the widget. You can
select the folder name or type the title.
Language
If you choose to type the title, you must also
specify the product language in which the
title is displayed. You can assign the same
title for multiple language versions.
For information on authoring workspaces
for use in multiple languages or locales, see
“Creating multilingual workspaces” on page
54.
Folder
30
IBM Cognos Express Version 10.1.0: Business Insight User Guide
Specifies the top-level location where the
navigation begins.
Property
Description
View
Specifies how folders and content objects
display in the navigator widget.
To show a list of objects, use the Navigator
list view. This is the default view.
To show objects and detailed information,
such as the last modification date, use the
Navigator details view. Links open more
detailed information about the object.
To show URL links and shortcuts in an
RSS-type format, use the News list view.
Open links
Specifies how the links in this widget are
opened. You can
v open and navigate the linked entries in a
new browser window. This is the default
option.
v open and navigate the linked entries in a
named HTML frame. Type the name or
widget type in the provided text box.
v open and navigate the linked entries in a
destination portlet. Type the channel name
as specified in IBM Cognos Viewer.
Navigation links
Specifies whether to maximize the widget
view when navigating the folder contents.
Features to expose in the Navigator views
Specifies how the folders and content objects
are displayed for the normal and maximized
modes in this widget. You can specify a
different view for normal and maximized
windows.
To show or hide the parent entry of the top
level folder in the IBM Cognos folder
hierarchy, select the Parent in path check
box.
To show or hide the Actions column for the
entries and view the content of container
entries in source applications, select the
Actions check box.
To show or hide the modification date and
description of entries in applicable views,
select the Additional information check box.
To specify in how many columns you want
the entries to appear in the details view,
select the values from the Number of
columns in a details view drop-down lists.
The default is 2 for the normal mode view
and 4 for the maximized mode view.
Chapter 3. Creating workspaces
31
Property
Description
Number of entries
Specifies the maximum number of entries to
show per navigator page.
The menu bar in the widget shows how
many entries are available for a folder.
Separators
Specifies whether separators are used in a
list view.
Tip: To make long lists of entries easier to
read, use alternating background colors to
separate the entries in the list.
Searching for content
The search provided in IBM Cognos Business Insight allows you to search entries
to locate content. This is known as a full-text search and is similar to that found in
popular search engines.
Note: Content must be indexed before you perform a search. If searching does not
work, contact your system administrator.
Searches are not case-sensitive. For example, "reports" and "Reports" return the
same search results.
Searches automatically include word variations. For example, if you enter the word
"tent" as the search term, the search results show entries that include "tents" and
"tenting". Words that contain "tent", such as "retention", are not included in the
results.
The results for searches that use multiple words include entries that include all
search terms and entries that contain only one of the search terms. You can use
search operators such as +, -, or " " (quotation marks) to modify the default
behavior when searching using multiple words.
Only entries for which you have access permissions at the time of the last index
update are included in the search results.
Performing a search
When you perform a search, content entries in the index are searched for matching
prompts, titles, headings, column names, row names, and other key fields. If a
search term matches a specific item on a workspace, the workspace is included in
the search results, but the individual item is not.
Search results are ranked according to the search term match relevance.
Search types
There are four types of search that you can perform in Business Insight:
v
32
IBM Cognos results
A list of all matching content within the IBM Cognos content store.
IBM Cognos Express Version 10.1.0: Business Insight User Guide
There may also be a separate list of suggested results. This shows objects that
your system administrator has identified as being relevant to your search terms.
v Create and explore results
A list of queries or analyses that can be created dynamically as a result of your
search terms.
v IBM Connections results
A list of all matching content within the Connections content store.
You will see this option only if collaboration is set up.
v Related results
A list of results generated from an external search engine. Depending on the
search engine used, these results can be from corporate data or external web
sites.
Searching for comments
You can search for comments, otherwise known as annotations, that have been
added to reports. When you search for IBM Cognos Business Intelligence content,
workspaces containing matching comments are included in the search results.
Suppose you have a "Sales" workspace that includes a report with the following
comment: "Sales lower than expected for Toronto branch". The search results for
"Toronto" include this workspace in the IBM Cognos results.
Searching for IBM Connections workspace activities
If you have collaboration set up, you see the following items in your search results:
v When you search for IBM Cognos Business Intelligence content, activities
connected to a workspace are included (depending on the index and search
rules).
For example, if you have an activity named "Toronto sales" that is connected to
your "Sales" workspace, the search results for "Toronto" include this workspace
in the IBM Cognos results.
v When you search for Connections content, activities connected to a workspace
are included (depending on the index and search rules). Additional Connections
content that is unrelated to the workspace but contains your search term is also
listed here.
Using the previous example, the "Toronto sales" activity connected to your
"Sales" workspace is included in the Connections results. If you have an
employee list for Toronto stored in Connections, it is also included.
Index and search rules
When you search for IBM Cognos BI content or IBM Connections content, the rules
concerning whether workspace activities are listed in the search results depend on
the access permissions of the user who indexed the content as well as your own
access permissions.
Search for content
You can use the search in IBM Cognos Business Insight to locate content.
You can right-click an item in the search results and open it in a workspace.
Chapter 3. Creating workspaces
33
If an item is subsequently removed from the content store, it remains in the search
results, but its link will be broken.
Complete the following steps to search for content.
Procedure
1. In the Content pane, type a term in the search box, and then click the Search
.
button
By default, IBM Cognos results are shown in the results pane.
2. From the result type drop-down list, select the type of search you want to
perform.
Entries that match the search criteria and that you have permission to view
appear in the results pane.
3. Expand an item to view further details.
Refining IBM Cognos results
You can use filters to refine the results of a search for IBM Cognos BI content.
To prevent long lists of metadata terms, similar terms are grouped together and the
root word is shown as a link. You can click the link to show individual terms.
To remove a filter, click the Any option for the item. For example, if you have
filtered by date, click Any Date to show all dates.
If you select a different search type from the Content pane, the refine pane
automatically closes.
Use the following filters to refine your search results:
v Result shows only report parts or hides report parts.
v
v
v
v
v
Type shows only specific IBM Cognos Business Intelligence objects.
Part shows only report parts for specific display types.
Date shows only content for specific creation years.
Owner shows only content for specific owners.
Metadata shows only content for specific dimension names used in the IBM
Cognos BI objects.
Procedure
1. In the Content pane, click Refine Search.
2. In the refine pane, refine the results by selecting one or more filters as required.
For each filter you select, the search results change to reflect your selections.
3. To close the refine pane, click Refine Search.
Adding tools
Tools are widgets that are available from the Toolbox tab in the Content pane. You
can add tools to a workspace by dragging them from the Toolbox tab onto the
workspace.
Note: If any tools are missing, this is likely because your system administrator has
removed access to them for security reasons.
34
IBM Cognos Express Version 10.1.0: Business Insight User Guide
You can add the following tools to a workspace:
v Images
v My Inbox
v RSS feed
v Select value filter
v Slider filter
v Text
v Web page
Adding an image widget
Use this widget to display an image on the workspace. The image must be a single
file that is reachable by a URL. You can also use the image as a link. For example,
you can configure the image widget to broadcast a specified URL in the Web page
widget or a new browser window when the image is clicked.
The image URL must be added to the trusted domain list as defined in the IBM
Cognos Configuration tool. For more information see the IBM Cognos BI
Installation and Configuration Guide or contact your system administrator.
Procedure
1. In the Toolbox tab of the content pane select the Image object and drag it onto
the workspace.
2. In the properties dialog box, set the properties as described in the following
table, and click OK.
Property
Description
Image
Specifies the folder location and the filename
of the image as a URL. The supported image
formats are PNG, GIF, and JPG.
Type the URL address for the image using
the following format: http://
www.my_server.com/path_to_image/
image_file_name.
Image size
Specifies the size of the image.
You can leave the original size of the image
or customize the image by changing its
width and height (in pixels).
Alternate text
Type text to be read by screen readers.
Alternate text is also displayed if the image
is not available. Leave this option blank if
you do not want images to contain alternate
text.
Target URL
Specifies the web page to display when the
image is clicked.
Type the appropriate URL address. Leave
this option blank if you do not want to
display a web page.
Chapter 3. Creating workspaces
35
Property
Description
Open links
Specifies how the target URL in this widget
is displayed. This option only works if a
target URL is specified.
Broadcast to all widgets is the default
option. Use this option to display the URL
in the Web page widget. The Web page
widget automatically listens to broadcasts
from the image widget if this option is
selected. If you do not want a Web page
widget to receive input from an image
widget, you must disable the widget
communication in the Web page widget. For
more information, see “Disabling widget
communication” on page 47.
Use In new window to display the URL in a
new browser window when the image is
clicked.
Adding a My Inbox widget
Use this widget to show an RSS feed of your secure approval requests, ad-hoc
tasks, and notification requests from My Inbox in IBM Cognos Connection.
Complete the following steps to add a My Inbox widget to the workspace and to
edit the widget properties.
Procedure
1. In the Toolbox tab, select the My Inbox object and drag it onto the workspace.
Tip: Click a task or notification to open it in My Inbox.
2. To change the properties of the widget, click the Widget Actions button
and click Properties from the drop-down list.
3. In the RSS Feed tab, set the properties as described in the following table, and
click OK.
36
Property
Description
URL
Specifies the URL address of the RSS feed
link to My Inbox.
Note: The URL address is pre-defined and
should not be changed.
IBM Cognos Express Version 10.1.0: Business Insight User Guide
Property
Description
Options
Specifies the display options for the RSS
feed.
To include a description of the feed, use the
Show details option.
To include an image, such as a logo,
associated with the feed, use the Show the
feed icon option.
To separate entries with different
background colors to make the entries easier
to read, use the Show alternating
background option.
Maximum number of entries to display
Specifies the maximum number of feed links
to display in the widget. The default value is
5.
Open links
Specifies how the links in the My Inbox
widget are opened. You can select Broadcast
to all widgets or In new window.
Use Broadcast to all widgets to display the
feed links in the Web page widget. The Web
page widget automatically listens to
broadcasts from the My Inbox widget if this
option is selected. If you do not want a Web
page widget to receive input from the My
Inbox widget, you must disable the widget
communication in the Web page widget. For
more information, see “Disabling widget
communication” on page 47.
Use In new window to display the linked
entries in a new browser window. This is the
default option.
Adding an RSS feed widget
Use this widget to show the content of a Real Simple Syndication (RSS) or an
Atom news feed that is specified by a URL address.
The RSS or Atom feed URL must be added to the trusted domain list as defined in
the IBM Cognos Configuration tool. For more information see the IBM Cognos BI
Installation and Configuration Guide or contact your system administrator.
Complete the following steps to add an RSS feed widget to the workspace and to
edit the widget properties.
Procedure
1. In the Toolbox tab, select the RSS Feed object and drag it onto the workspace.
2. In the properties dialog box, set the properties as described in the following
table, and click OK.
Chapter 3. Creating workspaces
37
Property
Description
URL
Specifies the URL address that identifies the
RSS or Atom channel feed. The specified
URL must point to a valid RSS or Atom feed
and not a web page. For example, a valid
RSS feed link opens an XML file, not a web
page.
The RSS or Atom channel includes a list of
links to specific web pages. The links can
include a title and a short description of the
linked story.
Options
Specifies the display options for the RSS or
Atom feed.
To include a description of the RSS or Atom
feed, use the Show feed details option.
To include an image, such as a logo,
associated with the RSS or Atom feed, use
the Show the feed icon option.
To separate entries with different
background colors to make the entries easier
to read, use the Show alternating
background option.
Maximum number of entries to display
Specifies the maximum number of feed links
to display in the widget. The default value is
5.
Open links
Specifies how the links in the RSS feed
widget are opened. You can select Broadcast
to all widgets or In new window.
Use Broadcast to all widgets to display the
feed links in the Web page widget. If
Broadcast to all widgets is selected, the Web
page widget automatically listens to
broadcasts from the RSS feed widget. If you
do not want a Web page widget to receive
input from the RSS feed widget, you must
disable the widget communication in the
Web page widget. For more information, see
“Disabling widget communication” on page
47.
Note: If you click an image in the RSS feed
widget, the image always displays in a new
browser window, not in the Web page
widget.
Use In new window to display the linked
entries in a new browser window. This is the
default option.
38
IBM Cognos Express Version 10.1.0: Business Insight User Guide
Adding a select value filter widget
You can use the select value filter widget to dynamically filter report data. Use this
widget to filter data items, such as product or country and region name or single
or multiple text values.
Complete the following steps to add a select value widget to the workspace and
set the properties of the widget.
Before you begin
If you add a select value filter widget to a blank workspace or to a workspace that
contains widgets that cannot interact with a select value filter widget, no properties
are available to set. Click Cancel to close the dialog box.
Procedure
1. In the Toolbox tab, select the Select Value Filter object and drag it onto the
workspace.
2. In the properties dialog box, set the properties as described in the following
table, and click OK.
For more information, see “Widget to widget communication” on page 46.
Chapter 3. Creating workspaces
39
Property
Description
Select a data item to filter on
Specifies the data items that you can refine.
Beside each listed data item, a column
identifies the widgets on the workspace that
use the data item and the widgets that the
select value filter widget will affect.
Disabled data items are already listening to
a slider filter or select value filter on the
workspace. You cannot select the same data
item for more than one filter.
You might see data items that are not shown
in the report; however, you can filter on
them. For example, a chart on the workspace
shows revenue for regions, but not years.
When you add a select value filter, if the
report was authored to filter on years when
displayed in IBM Cognos Business Insight,
you will see years in the filter properties.
For more information on enabling filters in
reports for workspaces, see the IBM Cognos
Report Studio User Guide.
Note: If you have disabled the select value
filter widget from listening to the data
values of a specific data item and you filter
on that data item, the data values will not
appear in the Select a data item to filter on
box. To solve this issue, select a different
data item to filter on or enable the select
value filter widget to listen to the data
values for that data item. For more
information, see “Widget to widget
communication” on page 46.
Tip: Pause the pointer over the widget title
to highlight the associated widget on the
workspace.
Use only the following values
Specifies the list of values associated with
the selected data item. By default, all of the
values for the item are selected. Clear the
values that you do not want shown in the
workspace.
After you close the properties dialog box,
the values that are filtered on display in the
information bar located in the upper-left
corner of the report widget.
Number of items that can be selected
40
IBM Cognos Express Version 10.1.0: Business Insight User Guide
Specifies whether you can select single or
multiple values in the widget.
Property
Description
Style
Specifies how the values display in the
widget. The options that are available
depend on whether you selected single or
multiple values. If you choose single value
for the number of items property, the
available options for the style property are
list, menu, and radio buttons. The default is
radio buttons. If you choose multiple values,
the available options are list and check
boxes. The default is check boxes.
Show descriptive text
Sets a text description for the widget. You
can use this text to provide instructions or
details on using the select value filter
widget.
Example
For example, your company has three product lines. Your workspace contains
several report widgets that list customers, sales, and locations according to these
three product lines. This is too much data to suit a workspace. Insert a select value
filter widget with radio buttons and view the data for one product line at a time.
Adding a slider filter widget
Use this widget to dynamically filter data in report widgets. Filtering removes
unwanted data from a report. For example, using the slider filter, you can retrieve
data for revenue that is between 10,000 and 20,000.
Depending on the properties set for the slider filter, content can display as single
values or value ranges.
Before you begin
If you add a slider filter to a blank workspace, or to a workspace that contains
widgets that cannot interact with the slider filter, no properties are available to set.
Click Cancel to close the dialog box.
Procedure
1. In the Toolbox tab, select the Slider Filter object and drag it onto the
workspace.
2. In the properties dialog box, set the properties as described in the following
table, and click OK.
For more information, see “Widget to widget communication” on page 46.
Chapter 3. Creating workspaces
41
Property
Description
Select a data item to filter on
Specifies the data items on which you can
filter. Beside each listed data item, a column
identifies the widgets on the workspace that
use the data item and that the slider filter
will affect.
Disabled data items are already listening to
a slider filter or select value filter on the
workspace. You cannot select the same data
item for more than one filter.
You might see data items that are not shown
in the report; however, you can filter on
them. For example, a chart on the workspace
shows revenue for regions, but not years.
When you add a slider filter, if the report
was authored to filter on years when
displayed in IBM Cognos Business Insight,
you will see years in the filter properties.
For more information on enabling filters in
reports for workspaces, see the Report
Studio User Guide.
Note: If you have disabled the select value
filter widget from listening to the data
values of a specific data item and you filter
on that data item, the data values will not
appear in the Select a data item to filter on
box. To solve this issue, select a different
data item to filter on or enable the select
value filter widget to listen to the data
values for that data item. For more
information, see “Widget to widget
communication” on page 46.
Tip: Pause the pointer over the widget title
to highlight the associated widget on the
workspace.
42
IBM Cognos Express Version 10.1.0: Business Insight User Guide
Property
Description
Use only the following values
If the data item that is selected is a numeric
value, such as quantity or revenue, you can
set a range of values to display on the slider
filter. The default behavior is to display the
lowest to the highest values; however, you
can set specific range of values to use. For
large or complex reports, lowest value to
highest value may display zeros. In this
case, enter the lowest to highest values
manually.
If the data item that is selected is a text
value, such as a product, year, or country or
region, a list of the values that are associated
with the item display. By default, all of the
values for the item are selected. Clear the
values that you do not want shown in the
workspace.
After you close the properties dialog box,
the values that are filtered on display in the
information bar located in the upper-left
corner of the report widget.
Style
Specifies if the slider filter operates on a
Range of values or a Single value of the
selected data item.
Display values as filter labels
Specifies whether to show the values as
filter labels on the slider filter scale. If you
do not select this option, only the lowest
and highest values display. However, the
value of the slider filter setting always
display in a tooltip above the slider filter
pointer.
Show descriptive text
Sets a text description for the widget. You
can use this text to provide instructions or
details on using the slider filter widget.
Adding a text widget
Use this widget to add text to a workspace.
Complete the following steps to add a text widget to the workspace and to edit the
widget properties.
Procedure
1. In the Toolbox tab, select the Text object and drag it onto the workspace.
2. Enter text, and use the formatting tools available on the toolbar to format the
text.
Chapter 3. Creating workspaces
43
Results
To edit the text, highlight text inside the text widget and make the required
changes to the text and formatting.
Adding a web page widget
Use this widget to insert a web page into a workspace. A URL address specifies
the web page.
The web page URL must be added to the trusted domain list as defined in the IBM
Cognos Configuration tool. For more information, see the IBM Cognos Business
Intelligence Installation and Configuration Guide or contact your system
administrator.
Complete the following steps to add a web page widget and to edit the widget
properties.
Procedure
1. In the Toolbox tab, select the Web Page object and drag it onto the workspace.
2. In the properties dialog box, in the HTML content field, specify the URL
address of the web page you want to display, and click OK.
Saving workspaces
Save a workspace to preserve your changes. You can also save an existing
workspace using a new filename or location as the basis of a new workspace.
When you save a workspace for the first time, a copy of each report widget is
created for the saved workspace. After you open and change the report (for
example, you apply a sort), the changes are saved in this copy. For information on
how to find the original report that was dragged onto the workspace, see
“Resetting report content” on page 74. For information on how to update the
workspace after the original report is modified, see “Opening a workspace with a
new version of a report” on page 74.
The data in a report widget is not saved with the workspace. If the report widget
is based on a live report, fresh data is retrieved from the data source when you
open the workspace. For more information, see “Viewing report versions” on page
84.
Save a workspace
Save a workspace to preserve your changes.
Procedure
on the application bar.
1. Click the save button
2. If you are saving the workspace for the first time, specify where you want to
save the workspace, type a file name, and click Save.
Save a workspace using a different name or location
You can save an existing workspace using a new filename or location as the basis
of a new workspace.
44
IBM Cognos Express Version 10.1.0: Business Insight User Guide
Procedure
1. On the application bar, click the Actions Menu button
.
2. Click Save As.
3. Specify a file name and location for the workspace, and click Save.
Editing widget properties
After you add a widget to a workspace, you can edit the widget properties.
Procedure
1. On the workspace, click the Widget Actions button
from the drop-down list, click Properties.
for the widget, and,
Note: After you add a widget to the workspace, the properties dialog box
contains two tabs: a Title tab and another content tab, depending on the
selected widget.
2. Click the Title tab and set the title properties, as described in the table below.
Note: If the widget only contains general properties, no tabs display.
Property
Description
Widget title
Specifies the title of the widget. If no title is
specified, the report name is used.
For translated versions of the workspace,
you can show this title on the widget for
other languages when the widget title is not
specified in the other language. To do so,
select the Use title as default for other
languages option.
Widget titles are only displayed on widgets
if you select the Show Titles option in the
Widgets tab of the Edit Workspace Style
dialog box or if you selected the Show title
on this widget option in the widget
properties. By default, widget titles are
disabled. For more information, see “Editing
the workspace style” on page 49.
For information on authoring workspaces
for use in multiple languages or locales, see
“Creating multilingual workspaces” on page
54.
3. Click the Content tab, set the properties, and click OK. For descriptions of the
widget properties, refer to the appropriate section in the “Adding tools” on
page 34 topic.
Note: The text widget only has the Widget title property.
Chapter 3. Creating workspaces
45
Configuring widget communication
Widgets communicate with each other by default. For example, content in report
widgets can interact with each other as well as the slider filter and select value
filter widgets. The slider filter and select value filter widgets dynamically filter
report data that is contained in associated report widgets.
When a widget is broadcasting information, it is a source widget. When a widget
is listening to one or more widgets, it is a target widget. The report widget can be
both a source and a target at the same time.
The results of actions in the source widgets are shown in the associated target
widget. For example, you can configure an image widget to broadcast a specified
URL in the Web page widget when the image is clicked. Or, if you have two report
widgets that contain content based on the same dimensionally-modelled data
source, when you drill on the data in one report, the second report is updated
based on your interactions in the first report. For more information, see
“Synchronizing drill up and drill down” on page 84.
Communication occurs between the following source and target widgets.
Note: Active Report widgets only communicate with each other and cannot
communicate other Report widgets.
Source widget
Target widget
Report
Report
Slider filter
Report
Select value filter
Report
Image
Web page
RSS feed
Web page
My Inbox
Web page
Widget to widget communication
The report, image, RSS feed, and My Inbox widgets automatically broadcast their
information to other widgets. The report and Web page widgets listen to the
broadcasting widgets.
For more information, see “Report content” on page 21, “Adding an image
widget” on page 35, “Adding an RSS feed widget” on page 37, “Adding a My
Inbox widget” on page 36, and “Adding a web page widget” on page 44.
Slider filter and select value filter widgets automatically read the data items that
are contained in the report widgets on a workspace. You can add multiple slider
filter and select value filter widgets to a workspace. Once configured, they
broadcast filter information to all associated report widgets. For more information,
see “Adding a slider filter widget” on page 41 and “Adding a select value filter
widget” on page 39.
46
IBM Cognos Express Version 10.1.0: Business Insight User Guide
Disabling widget communication
If you do not want a target widget to receive information from any or all source
widgets, you must disable the communication in the target widget.
You can also choose to disable some widget events while leaving other widget
events enabled. For example, you might want a widget to listen to drill events and
not listen to prompt events from another widget.
Widget events for some IBM Cognos Business Insight widgets have names, such as
Filter. Other widgets do not have event names, only unique identifiers. For
example, a unique identifier for an event could be com.ibm.bux.data.filter.
The following table lists the names of the widget events and a description of what
happens when they are disabled.
Widget event name
Type of widget that
broadcasts the event
Result of disabling the
widget event
Drill
Report
If disabled, communication
stops between synchronized
drill up and drill down and
other widgets.
Prompt
Report
If disabled, communication
stops between report
prompts in a report and
other widgets.
Filter
Slider filter or select value
filter
If disabled, communication
stops between a report
widget and a filter.
Get filter items from widgets Slider filter or select value
filter
If disabled, a report widget
will not receive this event
from the source (slider or
select value) filter. The
filterable items of the report
do not show up in the filter
properties dialog box.
Get filter values from
widgets
Slider filter or select value
filter
If disabled, a report widget
will not receive this event
from the source (slider or
select value) filter. The data
item values of the report do
not show up in the filter
properties dialog box.
Include data items from
widget
Report
If disabled in a slider or
select value filter, the filter
will not listen to this event.
The filterable data items
from the source report will
no longer display in the filter
properties dialog box.
Chapter 3. Creating workspaces
47
Type of widget that
broadcasts the event
Result of disabling the
widget event
Include data values from
widget
Report
If disabled in a slider or
select value filter, the filter
will not listen to this event.
The filterable data values
from the source report will
no longer display in the filter
properties dialog box.
Navigate
RSS Feed, My Inbox, and
Image
If disabled, communication
stops between a Web Page
widget and RSS Feed, My
Inbox, or Image widget.
Widget event name
Procedure
1. Select the target widget.
2. Click the Widget Actions button
Widget Events.
for the widget and click Listen for
3. In the Listen for Widget Events dialog box, clear the check boxes beside the
source widget names or widget events that you do not want the target widget
to receive information from, and click OK.
Tip: To see all the widget events that the widget is listening to, click Expand
All.
Modifying the workspace layout
When you place a widget on the workspace, the widget is automatically sized to
fit its content. As you interact with the widget, the content might change and the
widget will not be resized to properly display the content. This results in either
scrollbars or white space in the widget.
Resize individual widgets
You can resize widgets to fit content.
Procedure
1. On the widget toolbar for the widget you want to resize, click the widget
Actions Menu button
.
2. Click Resize to Fit Content.
Set the workspace layout
You can modify the layout of the widgets on a workspace.
As widgets are added, moved, manipulated, and removed, the layout of the
workspace might need to be corrected. IBM Cognos Business Insight provides the
following layout actions that automatically arrange widgets on the workspace.
v Fit All Widgets to Window
48
IBM Cognos Express Version 10.1.0: Business Insight User Guide
This layout action resizes all the widgets on the workspace to fit into the current
workspace window. Scroll bars might appear on the individual widgets,
depending on the number and size of the widgets. Widgets are resized
proportionally; all of the widget resizing is done relative to the other widgets on
the workspace.
v Arrange All Widgets to Fit Content
This layout action arranges all the widgets on the workspace to best fit the
content of each widget. Scroll bars might appear on the workspace, depending
on the number and size of the widgets. Widgets are repositioned after resizing to
prevent overlapping on the workspace.
Procedure
1. Click the Layout and Style menu button
on the application bar.
2. From the drop-down list, click either Fit All Widgets to Window or Arrange
All Widgets to Fit Content.
Results
The widgets are rearranged on the workspace according the layout action you
select.
Editing the workspace style
You can change the visual appearance of the workspace and widgets to customize
the look of your workspace.
For the workspace, you can change the appearance of the background.
For workspace widgets, you can change the appearance of the background, border,
and title bar. Widget customizations are applied to all widgets on the workspace.
Edit the workspace style
You can change the visual appearance of the workspace.
Complete the following steps to set style properties for a workspace.
Procedure
1. On the application bar, click the Layout and Style menu button
Edit Workspace Style.
and click
Tip: You can right-click a blank area on the workspace to access the Edit
Workspace Style option from the context menu. You can also select the option
from the workspace Actions Menu.
2. Click the Page tab.
3. Set the properties, as described in the following table, and click OK.
Chapter 3. Creating workspaces
49
Property
Description
Background
Specifies the workspace background.
Note: The background image URL must be
added to the trusted domain list as defined
in the IBM Cognos Configuration tool. For
more information see the IBM Cognos BI
Installation and Configuration Guide or contact
your system administrator.
The options for background are as follows:
v Color
The default is a very light blue-gray. To
change the background color, click Set
Color from the color list. In the Set Color
dialog box, you can choose from the
following two tabs:
– Palette
Use the Palette tab to choose a color
from the predefined palette.
– Custom
Use the Custom tab to set specific
colors.
v Image
The default is to display no background
image. To display a background image,
select Set Image from the image list. In
the Set Image dialog box, set the
properties for the image, and click OK.
The properties you can set are as follows:
– Image
The URL of the image.
– Tiling
The tiling options for the image.
– Position
The alignment position options for the
image.
Reset to default
Resets the workspace page style properties
to the initial default settings.
Edit all workspace widgets
You can change the appearance of all the workspace widgets at the same time.
Complete the following steps to set style properties globally for all widgets.
Procedure
1. On the application bar, click the Layout and Style menu button
Edit Workspace Style.
2. Click the Widgets tab.
3. Set the properties, as described in the following table, and click OK.
50
IBM Cognos Express Version 10.1.0: Business Insight User Guide
and click
Property
Description
Background
Specifies the background for the workspace
widgets.
The options for background are as follows:
v Color
The default is white. To change the
background color, click Set Color from the
color list. In the Set Color dialog box, you
can choose from the following two tabs:
– Palette
Use the Palette tab to choose a color
from the predefined palette.
– Custom
Use the Custom tab to set specific
colors.
v Image
The default is to display no background
image. To display a background image,
select Set Image from the image list. In
the Set Image dialog box, set the
properties for the image, and click OK.
The properties you can set are as follows:
– Image
The URL of the image.
– Tiling
The tiling options for the image.
– Position
The alignment position options for the
image.
Show Titles
Specifies to show or hide the title bar. The
default is to hide the title bar.
You can also specify the title bar font.
The options are as follows:
v Font
v Size
Chapter 3. Creating workspaces
51
Property
Description
Borders
Specifies to show or hide widget borders.
You can also specify the widget borders
formatting.
The options are as follows:
v Border
– Outside only
– Outside and under the title
– Under the title only
The default is Outside only.
v Width
The border width in pixels. The default is
1 pixel.
v Color
The default is light gray. To change the
border color, click Set Color from the
color list. In the Color dialog box, you can
choose from the following two tabs:
– Palette
Use the Palette tab to choose a color
from the predefined palette.
– Custom
Use the Custom tab to set specific
colors.
v Style
– Dashed
– Dotted
– Double
– Groove
– Inset
– Outset
– Ridge
– Solid
The default is Solid.
Reset to default
Resets the widget style properties to the
initial default settings.
Setting personal preferences
You can personalize the way data appears in IBM Cognos Business Insight by
changing your preferences. For example, you can set the product language and the
preferred output format of reports.
Changes take effect in the current session when the web browser is refreshed. The
preferences are stored and used for future sessions unless you change them.
52
IBM Cognos Express Version 10.1.0: Business Insight User Guide
Procedure
1. On the application bar, click the Actions Menu button
and click My
Preferences.
2. In the Set Preferences dialog box, select the appropriate settings as described in
the following table, and click OK.
Setting
Description
Enable accessibility support for reports
Determines if accessible report output is
generated. For more information, see
“Making reports accessible to users with
disabilities” on page 83.
Show the Getting Started Page at startup
Shows or hides the Getting Started page
when you launch Business Insight.
Product language
Specifies the language that the IBM Cognos
user interface uses. It applies to all IBM
Cognos components, such as IBM Cognos
Connection, IBM Cognos Viewer, and IBM
Cognos Report Studio.
For information on authoring workspaces
for use in multiple languages or locales, see
“Creating multilingual workspaces” on page
54.
Content language
Specifies the language used to view and
produce content in IBM Cognos, such as
names and descriptions of entries, or data in
reports.
Time zone
Specifies the time zone used. Select the
default server time zone set by your
administrator. For more information, see the
IBM Cognos Business Intelligence Installation
and Configuration Guide. Or you can select
another time zone.
Note: The time zone for time stamps on
comments is based on this setting.
Creating accessible workspaces
Creating accessible workspaces ensures access to information for all users, with all
levels of ability.
For example, people with a visual impairment might use screen reading
technology to access the information in a report.
The following are some design considerations for creating accessible workspaces:
v Use IBM Cognos report content that was created using accessibility principles.
v Avoid using visual cues, such as bold text or color, to convey important
information.
Chapter 3. Creating workspaces
53
v Avoid using pictures and OLE Objects, as these items are tagged as artifacts and
ignored by the screen reader.
v Avoid using conditional formatting to convey important information.
v Ensure that there is a table corresponding to display types that are rendered as
images because the screen reader ignores this information.
v Always ensure that there is a title on the widget or workspace.
v Understand how screen reading technology works so you can create workspaces
that are properly read by screen readers.
v Avoid spelling and grammar errors, as they cause the screen reading software to
misinterpret the information.
v Avoid using features like calendar boxes and up and down selections on time
controls. Using prompts such as check boxes, radio buttons, combo boxes, and
multi-select boxes is acceptable.
v Ensure that the target application is accessible when using embedded web
applications or drill-through paths.
v Avoid using large, complex tables. Displaying the information in multiple simple
tabular reports is more manageable for users of assistive technology.
IBM Cognos Business Insight has accessibility features that help users who have a
physical disability, such as restricted mobility or limited vision, to use information
technology products successfully. For more information, see “Accessibility features
in IBM Cognos Business Insight” on page 109.
Creating multilingual workspaces
In IBM Cognos Business Insight, you can create a single workspace that users can
consume in multiple languages or locales. This is also called localizing your
workspace.
Your workspace can include both content from a data source and widget content,
such as titles and images, that you manually added.
Data content, such as reports, can come from many different data sources, some of
which are unilingual and some of which are multi-lingual. Report authors and
modelers can use different techniques to localize their report contents.
You can localize the following categories of widget content:
v Fixed content, such as titles, static text, images, and web page references.
v Filter content, such as sliders and select value filters, as well as filters added in
the report widget.
v Other report content, such as list column headings and calculation names.
Some widgets contain only one type of content. For example, a text widget
contains only fixed content. Other widgets can contain more than one type of
content. For example, a report widget contains all three types of content.
When you add a widget to a workspace, the initial content in the widget
determines the default for all languages and locales until it is changed for a
particular language or locale. For example, if you author the initial workspace
object in French, the content in all other languages and locales is in French until
you customize it.
54
IBM Cognos Express Version 10.1.0: Business Insight User Guide
As a workspace author, you must do some initial configuration work to localize
the workspace. After you have configured the workspace for the required
languages and locales, a workspace consumer using that language and locale
should not need to do any further configuration work. They will see the content
that you localized in their preferred language and locale.
Procedure
1.
2.
3.
4.
Create the new workspace object in an initial language and locale.
Save the workspace.
Change the content locale of the workspace to a new locale.
Modify or configure the workspace object for the new locale and resave the
workspace for each locale.
You can modify fixed content, filter content, and report content. Saving after
each locale change updates the locale-specific information in the workspace.
Language and locale
IBM Cognos Business Insight allows you to create different content in the same
widget at both the language and locale level.
The locale, or regional designation, allows you to distinguish between different
regional dialects of a single language. For example, the French language has the
locales French (France) and French (Canada).
If you create content at the default language level, for example, by choosing the
French locale, that content becomes the default for all the locales within the French
language.
You override the default language by creating new content for a specific locale.
The following table shows examples of widget content affected by language
differences.
Widget content
Example
Maps
An image or Web page widget shows a map
of the area around a store. You localize the
image file or URL to show the street names
in the workspace consumer's language.
Company logos
A company logo might include text that is
different for each language.
The following table shows examples of widget content affected by locale
differences.
Widget content
Example
Maps
For a retail chain with stores in Canada,
USA, and the UK (all English-speaking
countries and regions), the locale will affect
which map is shown.
Chapter 3. Creating workspaces
55
Widget content
Example
Flags
An image in the workspace might contain a
country's or region's flag.
Currency
The reported currency might be different
and text on the workspace might indicate
"values reported in US Dollars" or "values
reported in Euros".
Localize fixed content
After you have created and saved the workspace in the initial language, you can
switch to the new locale and modify fixed content such as text, images, and URLs.
Procedure
1. On the application bar, click the Actions Menu button
Preferences.
and click My
2. Under Regional options, select the new Content language.
3. Modify the widget content as shown in the following table, and save the
workspace.
Fixed content
Action
Text widgets
Change the current text to the desired text
for the new language or locale.
Widget titles
Click the Widget Actions button
click Properties.
and
On the Title tab, under Widget title, edit the
title text.
These steps apply to any type of widget.
Descriptive text for slider and select value
filters
Click the Widget Actions button
click Properties.
and
On the Filter tab, edit the text in the Show
descriptive text.
Images and Web pages
Click the Widget Actions button
click Properties.
and
For images, on the Image tab, edit the image
URL, Alternate text, and Target URL.
For web pages, on the Web Page tab, edit
the URL for the language or locale.
56
IBM Cognos Express Version 10.1.0: Business Insight User Guide
Fixed content
Action
RSS feeds
Click the Widget Actions button
click Properties.
and
On the RSS Feed tab, edit the URL for the
language or locale.
Localize filter content
In some cases, slider and select value filters might correctly filter the data for a
new locale, it is best to configure these filters when you create a new locale for a
workspace.
Without proper configuration, you might encounter some of the following
problems when filtering across locales:
v The data might be filtered correctly but the information bar shows values in the
wrong language.
v The data might be unfiltered.
v The data might be completely filtered out and the information bar shows values
in the wrong language.
v Numeric formats or ranges might not be appropriate for the new locale. For
example, a range in dollars is not the same as a range in Euros.
Procedure
1. On the application bar, click the Actions Menu button and click My
Preferences.
2. Under Regional options, select the new Content language.
3. Modify the widget content as shown in the following table, and save the
workspace.
Chapter 3. Creating workspaces
57
Filter content
Action
Text slider and select value filter widgets
Click the Widget Actions button
click Properties.
and
On the Filter tab, select the items to filter for
this locale. Depending on how your data
was modeled, the same item might apply to
all locales or different items might apply to
different locales.
For filters that use numeric data items with
number formats or currencies, configure the
data items for each language or locale even
when similar values apply.
Note: Once configured, data items selected
for slider and select value filters are
independent for each language and locale.
For example, data items selected for English
Canada do not affect data items selected for
other languages and locales.
Filters in report widgets
in
Filters created with the filter button
a report widget are tied to a locale. When
you select a new locale, filters created in any
other locale are disabled. You must create
and save filters for each locale.
Note: Filters created outside of Business
Insight, in an authoring studio, and in IBM
Cognos Business Insight Advanced are
global. This means that they are not tied to a
locale. Depending on the data, they might
work correctly or might exhibit some of the
problems for multilingual filters listed
above.
Localize report content
You can edit reports to make them multilingual.
In IBM Cognos Business Insight, you can make some limited changes to the
following column and row headings in reports:
v Regular list column headings
v
v
v
v
v
58
Calculated list column headings
Summary rows or column headings in a crosstab
Crosstab measures
Crosstab calculations
Crosstab single members (only for dimensional reports)
IBM Cognos Express Version 10.1.0: Business Insight User Guide
The amount of editing that you can do to a report to make it multilingual is
limited in Business Insight. However, if a report was authored to be multilingual
or is against a multilingual data source, much of the content is automatically
localized.
Procedure
1. On the application bar, click the Actions Menu button
and click My
Preferences.
2. Under Regional options, select the new Content language.
3. In the report widget, double-click the report item and type a value for the new
language or locale.
4. Save the workspace.
Prompt controls
In certain applications, prompt controls and global prompts can be used
successfully in multilingual workspaces.
However, because prompt controls tend to be tied to specific data sources by
nature, they should be used as follows for multilingual workspaces:
v Created to use key items by advanced authors.
v Restricted to sets of widgets that use a specific data source, where keys are
consistent.
Chapter 3. Creating workspaces
59
60
IBM Cognos Express Version 10.1.0: Business Insight User Guide
Chapter 4. Viewing and interacting with workspaces
You can view and interact with IBM Cognos Business Insight workspaces for an
integrated business intelligence experience. As you monitor reports and perform
analysis, you can also collaborate and share information with colleagues.
The content that you can see in a workspace depends on your security
permissions. If you do not have permission to view report content in a workspace,
you will receive a message stating that you do not have permission to view the
report.
When you interact with workspace content, such as reports and report parts, the
changes you make are saved as part of the workspace, even if you make the
changes in Business Insight Advanced. The changes do not affect the original
report content that is saved in the content store. To make changes to the original
report content, you must open the report in the studio it was authored in.
Opening a workspace
You can open an existing workspace from the Getting Started page, the application
bar, the Actions menu, the Content tab, or IBM Cognos Connection.
Open a workspace from the Getting Started page
You can open a workspace from the Getting Started page.
Procedure
1. On the Getting Started page, click Open Existing.
2. Select the workspace you want to open and click Open.
Open a workspace from the application bar
You can open a workspace from the application bar.
Procedure
1. In the application bar, click the Open button
.
2. Select the workspace you want to open and click Open.
Open a workspace from the Actions menu
You can open a workspace from the Actions menu.
Procedure
1. On the workspace, click the Actions Menu button
and click Open.
2. Select the workspace you want to open and click Open.
Open a workspace from the Content tab
You can open a workspace from the Content tab.
© Copyright IBM Corp. 2010, 2012
61
Procedure
1. In the Content tab, select the workspace to open.
2. Right-click and, from the context menu, select Open.
Open a workspace from IBM Cognos Connection
You can open a workspace from IBM Cognos Connection.
Procedure
1. In IBM Cognos Connection, navigate to the workspace you want to open.
2. Click the hyperlink name of an existing workspace.
The selected workspace opens in the IBM Cognos Business Insight application.
Refreshing workspace widgets
You can refresh live data in all report widgets on a workspace, or in individual
widgets. Saved report versions do not have the option to refresh.
If you refresh or reload the workspace from the web browser, you will be
prompted to save the workspace if it has not been previously saved, or if you have
made changes since the last save.
Refresh all widgets
You can refresh live data in all report widgets on a workspace at the same time.
Procedure
On the workspace application bar, click the Refresh All button
.
Results
The data in all report widgets on the workspace is refreshed. For widgets that
contain prompted report data, the last saved prompt value is used for the refresh
action. The time stamp for the report data is updated to the time of the refresh.
Refresh a single widget
You can refresh live data in an individual widget.
Procedure
1. On the widget toolbar for the widget you want to refresh, click the widget
Actions Menu button
2. Click Refresh.
.
Results
If the widget contains prompted report data, the last selected or entered prompt
value is used for the refresh action. The time stamp for the report data is updated
to the time of the refresh.
62
IBM Cognos Express Version 10.1.0: Business Insight User Guide
Sharing workspaces
You can share a workspace with your colleagues by sending a URL to the
workspace in an email or by copying and pasting the URL into another document
or instant message.
The recipients of the shared workspace URL must have permission to view
workspaces, otherwise they cannot access it.
Procedure
1. Open the workspace that you want to share.
on the workspace application bar.
2. Click the Actions Menu button
3. Select Email Link or Copy Link to Clipboard.
Note: You are prompted to save the workspace if it has not been previously
saved.
If you select to email the link to the workspace, your default email client will
open with a new message that is populated with the workspace name in the
subject line and the link to the workspace in the message body.
Note: If IBM Lotus Notes® is the default email client, you must use version
7.0.4 or later to avoid truncation of the link in the body of the email.
If you select to copy the workspace link and you are using Microsoft Internet
Explorer, the URL is copied directly to the operating system clipboard. If you
are using Mozilla Firefox, the URL is displayed in the Copy Link to Clipboard
dialog and it is selected by default. Type Ctrl+C on the keyboard to copy the
URL to the operating system clipboard.
Note: Depending on the web browser you use, you might have to grant access
to the clipboard.
Displaying data in lists, crosstabs, and charts
After a report or report part has been added to the workspace, you can change the
display type for that item. For example, you can convert a column chart into a bar
chart.
Change the display type
You can change the display type for reports and report parts.
Procedure
1. Select the report widget and, from the widget toolbar, click the Change Display
. If the widget contains a report with more than one report
Type button
part, select the report part and click the Change Display Type button.
Tip: You can also right-click the report object and click Change Display Type
from the context menu.
2. From the drop-down list, select a display type or click More to show additional
display types.
3. In the Change Display dialog box, click the display type that you want to use,
and click OK.
Chapter 4. Viewing and interacting with workspaces
63
Results
The supported display types are described in the following table.
Display type
Description
Displays data in rows and columns
(crosstab) or in columns (list table).
Table
Displays data as vertical markers to compare
individual values and is useful to compare
discrete data or to show trends over time.
Column
Column charts can plot data using standard,
stacked, 100 percent stacked, and
three-dimensional configurations.
Bar
Displays data as horizontal markers to
compare individual values and is useful for
showing trends over time and for charts that
plot many data series.
Bar charts can plot data using standard,
stacked, 100 percent stacked, and
three-dimensional configurations.
Displays data at regular points connected by
lines and is useful for showing trends over
time and for charts with many data series.
Line
Line charts can plot data using standard,
stacked, 100 percent stacked, and
three-dimensional configurations.
Pie, Donut
Displays a single data series as segments of
a circle to show the relationship of parts to
the whole and is useful for highlighting
proportions.
Pie charts can plot data using standard,
donut, and three-dimensional configurations.
Area
Displays data like a line chart but the areas
below the lines are filled with colors or
patterns. An area chart is useful for
emphasizing the magnitude of change over
time. A stacked area chart is useful for
showing the relationship of parts to the
whole.
An area chart can plot data using standard,
stacked, 100 percent stacked, and
three-dimensional configurations.
64
IBM Cognos Express Version 10.1.0: Business Insight User Guide
Display type
Scatter, Bubble, Point
Description
A scatter chart uses data points to plot two
measures anywhere along a scale, not only
at regular tick marks, and is useful for
exploring correlations between different sets
of data.
A bubble chart, like a scatter chart, uses data
points and bubbles to plot measures
anywhere along a scale. The size of the
bubble represents a third measure, and the
color represents a fourth measure. It is
useful for representing financial data.
A point chart uses multiple points to plot
data along an ordinal axis. It is the same as
a line chart without the lines. Only the data
points are shown. A point chart is useful for
showing quantitative data in an uncluttered
fashion. To display a point chart, the report
object must contain at least one measure
(numeric value).
Gauge
Displays data using needles to show
information as a reading on a dial. The
value for each needle is easily read against
the colored data range.
A gauge chart is useful for comparing values
between a small number of variables, either
by using multiple needles on the same
gauge or by using multiple gauges.
Choose a display type and configuration for charts
Before choosing a display type, consider what you want the chart to illustrate.
Different display types and configurations emphasize different things.
Purpose
Display type or configuration
Show contributions of parts to a whole
Pie
Stacked configuration
100 percent stacked configuration
Show trends in time or contrast values
across different categories
Line
Area
Bar
Column
Compare groups of related information
against actual values
Standard configuration
Three-dimensional
Chapter 4. Viewing and interacting with workspaces
65
Purpose
Display type or configuration
Compare different kinds of quantitative
information
Column-line
Supported chart formats
IBM Cognos Business Insight supports two chart formats: default charts, and
legacy charts. The default chart format is specified by your system administrator. A
chart is displayed in Business Insight in the format it was authored in, either
default chart or legacy chart.
The default charts display format is used when you author charts in the current
version of IBM Cognos Report Studio and IBM Cognos Business Insight Advanced.
Charts authored in previous versions of Report Studio use the legacy chart format.
For more information about default and legacy charts, see the IBM Cognos Report
Studio User Guide or IBM Cognos Business Insight Advanced User Guide.
Sort and filter chart content
You can sort and filter chart content in reports.
If a filter or sort is applied to data in a table report that is changed to a chart, the
information bar displays the filter and sort information in the chart. However, it is
not possible to filter on chart data in the report widget by using the filter actions
from the report widget toolbar or context menu.
Procedure
To filter chart data, use the slider filter and select value filter widgets. For more
information see “Filtering with slider filter and select value filter widgets” on page
69.
Change the chart color palette
You can change the color palette for a chart on the workspace.
Procedure
1. Select the report widget that contains the chart that you want to change the
color palette for and click the chart you want to change.
2. On the toolbar, click the Change Color Palette button
palette from the drop-down list.
and click the color
Results
The chart is displayed with the new color palette.
Swap rows and columns
Swap rows and columns to look at information from a different perspective.
This may help you discover high and low points in the data that you had not
previously noted.
66
IBM Cognos Express Version 10.1.0: Business Insight User Guide
You can only swap rows and columns in a crosstab or chart. In a chart, you swap
the items on the legend with the items on the x-axis.
Procedure
1. If the widget contains more than one report, select the report that you want to
swap rows and columns on.
2. From the widget toolbar, click the swap rows and columns button .
Results
For a crosstab report, the rows become the columns and the columns become the
rows. For a chart, the items on the legend become the items on the x-axis and the
items on the x-axis become the items on the legend.
Filtering report data
Filtering removes unwanted data from a report. Data is retrieved from the
database and displayed in the report only if it meets the filter criteria.
In addition to prompts, report data in a workspace can also be filtered in the
following ways. You can use the filter action in the individual report widgets, or
you can use a slider filter or select value filter widget to filter one or more reports
at the same time.
The filter information is displayed in the information bar in the report widget.
Filtering in the report widget
Non-numeric values, such as "sleeping bag" or "tent", in lists and crosstabs are
filtered by using Include and Exclude conditions. In lists, you can select multiple
non-numeric values within the same column to filter on. In crosstabs, you can
select multiple non-numeric values in column or row headings. If you select
multiple values, they are all included in the filter condition.
When single values of numeric items, such as quantity or revenue, are selected,
lists and crosstabs can be filtered by using value comparison filters such as "greater
than" or "less than". If two numeric values are selected, the following filter
conditions are available:
v Between
v Not between
If the widget contains a compound report, which is a report that contains multiple
report parts, such as a list and a crosstab, the filter behavior depends on whether
the report parts share the same query. If the query is shared, a filter applied to one
report part is also applied to the other report part. If the query is not shared, the
filter is applied only to the selected report part within the report widget.
If you filter a report, then subsequently remove the column or row that the filter
was created on, the filter is still applied to the remaining report. For example, if
you have a list report with a column that contains country or region values, and
you select to filter "In Austria and Australia", the resulting report contains content
that is related to the selected countries or regions. If you then delete the Country
or Region column, the filter is still applied to the remaining columns.
Chapter 4. Viewing and interacting with workspaces
67
If you filter values that are floating-point numbers, you might encounter imprecise
filtering results due to rounding or data truncation. Floating-point numbers can
appear differently in the report than how they are stored in the data source. For
example, you want to filter a column in a table to show all values that are less
than 2.51. The value 2.51 might display even after you apply the filter because in
this scenario, 2.51 is a floating-point number; it is stored as 2.50999999 in the
underlying binary format. To ensure accurate results, your filter criteria should
account for any rounding issues.
To apply more detailed filtering to the report, click the Do More button
open the report in IBM Cognos Business Insight Advanced. For more
information,see the IBM Cognos Business Insight Advanced User Guide.
to
Note: To use the Do More options, Business Insight Advanced must be installed in
your environment and you must have the appropriate permissions. If you cannot
access Business Insight Advanced, contact your system administrator for assistance.
Filter report data
You can use the filter action in the individual report widgets to filter report data.
Procedure
1. Within a report, click the data value or values on which you want to filter.
2. On the toolbar, click the filter button
menu.
or click the filter item in the context
3. Select a filter condition from the list.
The filter is applied to the report. The filter details are displayed in the
information bar.
Remove individual filters using the information bar
You can use the information bar to remove filters from reports.
When the information bar is expanded, a delete icon appears beside the filters you
can remove.
Procedure
1. In the widget information bar, click the expand button
applied filters.
to display all of the
beside the filter you want to remove.
2. Click the delete button
Only filter conditions applied using the following methods can be removed
from the information bar:
v
v
v
v
The
The
The
The
filter button
filter context menu
slider filter
select value filter
, the filter cannot
If a filter condition appears in grey or it has a lock icon
be removed from the information bar.
For more information, see “Displaying filter and sort values in the information
bar” on page 72.
68
IBM Cognos Express Version 10.1.0: Business Insight User Guide
Remove all filters in a report widget
You can remove all the filters for a widget.
This action removes only the filter conditions that were applied by using the filter
or filter context menu in the report widget. Filters applied in IBM
button
Cognos Analysis Studio, IBM Cognos Query Studio, or IBM Cognos Report Studio
are not removed. Also, filters applied by prompt values or the slider filter or select
value filter widgets are not removed.
Procedure
1. On the widget toolbar, click the filter button
.
2. To remove all the filters in your report, click Remove all filters for this widget.
Filtering with slider filter and select value filter widgets
If the workspace contains a slider filter or a select value filter widget, you can use
it to filter table and chart data in the report widgets it communicates with.
Procedure
To use the slider filter widget to filter data, click and drag the range slider filter to
display or remove data items. To use the select value filter widget to filter data,
select or deselect the data items you want to display or remove, and click Apply.
Results
The report widgets that are communicating with the slider filter or select value
filter widget, will refresh to display the filtered data items you have selected.
The filter information is displayed in the information bar and it is updated as the
filter conditions are changed.
For more information see “Adding a slider filter widget” on page 41, “Adding a
select value filter widget” on page 39, and “Configuring widget communication”
on page 46.
Sorting data in lists, crosstabs, and charts
Sorting organizes your data in either ascending or descending alphabetical or
numerical order. For example, you can sort on a column that lists product sales
values in descending order to order product sales from the highest to the lowest.
In IBM Cognos Business Insight, you can sort lists, crosstabs, and charts. When a
sort is applied, the details of the sort are displayed in an information bar.
Sorting lists
You can sort items in a list report in ascending or descending order based on an
alphabetical or numeric value, such as employee name or revenue.
The information bar indicates the value or caption the sort was based on and
whether the direction of the sort is ascending or descending.
Chapter 4. Viewing and interacting with workspaces
69
Procedure
1. Within a list report, select a column to sort.
2. Click the sort button
and click Sort Ascending or Sort Descending.
Tip: You can also pause the pointer over the column heading and click on the
up or down arrow to sort in ascending or descending order.
Results
An arrow appears beside the data item to indicate the sort order.
Sorting crosstabs
You can sort items in a crosstab in ascending or descending order based on a label
or numeric value.
If sorting was applied to a crosstab report in IBM Cognos Report Studio, IBM
Cognos Business Insight Advanced, or IBM Cognos Query Studio, the sort
information is displayed in the information bar in the report widget. However, if
sorting was applied in IBM Cognos Analysis Studio, the sort information is not
displayed in the information bar.
The information bar indicates whether the sort was by label or value and whether
it is in ascending or descending order.
Note: Sorting in crosstab report objects is not maintained for IBM Cognos 8 Go!
Dashboard workspaces when upgrading to IBM Cognos Business Insight.
Sorting by label
You can sort sets of crosstab row and column headings based on their labels and
groupings.
A set can be defined as the values that are associated with a specific data item. For
example, if the data item "region" is used for the rows in a crosstab, the set of
values includes all of the values contained in region, such as "Europe", "North
America" and "Asia".
Using this example, if you select one of the values in the region set, click the sort
, and sort the regions within the set in descending alphabetical order,
button
the rows within the crosstab are reorganized in the following order: North
America, Europe, Asia.
Sorting by label is available in crosstabs when a set is selected. Sorting by label is
not available for summary rows or columns, nested measures, calculations, or rows
and columns based on single dimensional members.
Procedure
1. Within a crosstab, select a set of values to sort.
2. Click the sort button
Label - Descending.
70
and click Sort By Label - Ascending or Sort By
IBM Cognos Express Version 10.1.0: Business Insight User Guide
Sorting by value
Sorting by value is available in dimensional crosstabs when a column or row
heading is selected. Sorting by value is not supported on the outer edges of a
nested crosstab, or in relational crosstabs.
Sorting by value affects the measure values for a given row or column. For
example, a crosstab contains an "expense plan total" value in a column, region
values in the rows, and "course cost" as the measure. You select "expense plan
and sort by value in descending order. The
total", click the sort button
revenue values in the "expense plan total" column are sorted in descending order.
In nested crosstabs, items are sorted based on the values of the innermost nested
row or column of the opposite axis. For example, a crosstab contains years in the
columns and retailers nested within product line in the rows. The measure is sales
revenue. Select 2004, sort in descending order, and you see retailers listed from the
largest sales revenue value to the smallest value for each product line.
Procedure
1. Within a crosstab, select a member or measure to sort.
For example, to sort a set in the row axis, select a member or measure in the
column axis.
2. Click the sort button
Value - Descending.
and click Sort by Value - Ascending or Sort by
Sorting charts
You can sort items in a chart in ascending or descending order based on a label or
numeric value, such as employee name or revenue.
The information bar indicates the value or caption the sort was based on and
whether the direction of the sort is ascending or descending.
Sort a chart by label
You can sort items in a chart based on a label.
Procedure
1. Within a chart legend or category axis label, select a set of values to sort.
2. Click the sort button
Label - Descending.
and click Sort By Label - Ascending or Sort By
Chapter 4. Viewing and interacting with workspaces
71
Sort a chart by value
You can sort items in a chart based on a value.
Procedure
1. Within a chart legend or category axis label, select a member or measure to
sort.
2. Click the sort button
Value - Descending.
and click Sort by Value - Ascending or Sort by
Remove sorts with the sort button
You can use the sort button in the toolbar or context menu to remove sorts from
lists, crosstabs and charts.
Procedure
1. Within a list, crosstab or chart, select the set or column that was used to create
the original sort.
2. Click the sort button
and click Remove Sort.
Remove sorts using the information bar
You can use the information bar to remove sorts from lists, crosstabs and charts.
When the information bar is expanded, a delete icon appears beside the sorts you
can remove.
Procedure
1. Click the expand button
conditions.
2. Click the delete button
on the information bar to display the applied sort
beside the sort you want to remove.
Displaying filter and sort values in the information bar
The information bar displays the filter and sort details that are applied to a list,
crosstab, or chart. It is displayed at the top left side of each applicable report object
within the report widget when data is filtered or sorted.
by default. You can open it by clicking on
The information bar is collapsed
the collapsed information bar to expand and display the filter and sort details as
line items as shown in the following graphic.
72
IBM Cognos Express Version 10.1.0: Business Insight User Guide
To collapse the information bar, click anywhere on the heading of the information
bar.
If a widget that contains filter and sort information is printed or exported to a PDF
file or is exported to a Microsoft Excel file, the information contained in the
information bar is also printed or exported to the file. For more information, see
“Creating PDF files from workspace widgets” on page 80 and “Export a workspace
widget” on page 82.
Filters
The filter conditions that are displayed in the information bar include the
following:
v Filters applied in the report widget using the filter action from the widget
toolbar or context menu.
v Filters applied by responding to a prompt in a prompted report object.
v Filters applied to the report in IBM Cognos Analysis Studio, IBM Cognos Query
Studio, or IBM Cognos Report Studio.
v Filters applied to the report by using a slider filter or select value filter widget.
You can remove some filter conditions from the information bar if a delete button
is displayed beside the condition. For more information, see “Remove
individual filters using the information bar” on page 68.
, the filter cannot be
If a filter condition appears in grey or it has a lock icon
removed from the information bar. For example, if a report author applies a filter
using Report Studio or Analysis Studio, that filter cannot be removed from the
information bar. For more information, see “Filtering with slider filter and select
value filter widgets” on page 69.
Sorts
The sort conditions that are displayed in the information bar include the following:
v Sorts applied in the report widget by using the sort action from the widget
toolbar or context menu, or by clicking the sort arrows on a column heading
v Sorts applied to the report in Query Studio or Report Studio
Chapter 4. Viewing and interacting with workspaces
73
You can remove sort conditions from the information bar if a delete button
is
displayed beside the condition. For more information, see “Remove sorts using the
information bar” on page 72.
Changing the prompt values in a report
If a workspace contains a report with prompts, you can change the prompt values
to refocus the displayed report data. The report data is filtered and returned based
on the selected prompt values.
The prompt parameter is displayed as a locked filter condition in the information
bar.
Procedure
1. Select the report widget that contains the prompted report content.
2. Click the widget Actions Menu button
drop-down list.
and click Prompt Again from the
3. Select new prompt values from the prompt control.
Resetting report content
Resetting report content resets the report to the base report for a live report. Reset
is not available for saved output reports. Also, you can not reset the report if the
original report was deleted or disabled.
When the report content is reset, any changes you have made to the content are
lost.
Procedure
1. Select the report widget that contains the report content to reset.
2. Click the widget Actions Menu button
drop-down list.
and click Reset from the
Opening a workspace with a new version of a report
If original versions of reports or report parts were modified and you open a saved
workspace, report widgets display an information icon in the top right corner of
the report widget.
For example, a report author might modify a report using IBM Cognos Report
Studio. When you open the saved workspace that references the modified report,
indicates that a new
and you are the workspace owner, the information icon
version of the report is available. The icon is displayed only if the report or report
part is live. The icon is not displayed for saved output.
Procedure
1. Pause the pointer over the information icon
Get new version.
2. In the Reset dialog box, click Yes.
74
IBM Cognos Express Version 10.1.0: Business Insight User Guide
to see the tooltip and click
Adding simple calculations in lists and crosstabs
You can perform basic calculations for lists and crosstabs in IBM Cognos Business
Insight using data from one or more report items. For example, you can multiply
the values in two columns or multiply the values in a single column by a constant.
Calculation results are not stored in the underlying data source. Instead, IBM
Cognos Business Insight reruns the calculation each time the report is refreshed.
The results are always based on the current data in the data source.
Note: Depending on how the report was authored, calculations might be restricted
by the functions that are available in the data source.
The following operations are available when you create a calculation in IBM
Cognos Business Insight.
Arithmetic operations
Description
+ (sum)
Adds the values of the selected report items.
- (difference)
Subtracts the values of one selected report
item from another.
* (multiplication)
Multiplies the values of the selected report
items.
/ (division)
Divides the values of the selected report
items.
% Difference
Calculates the percentage difference between
the selected report items.
If only one report item is selected, you can perform arithmetic operations on that
item using a constant value. For example, you can multiply the values of a salary
column by 1.05 to see the results of a 5 percent increase.
Note: The available operations depend on the selected data. For example, if only
one row or column heading is selected, you can perform operations using a
constant. If two or more column or row headings are selected, you can perform
addition, subtraction, multiplication, division and percentage difference operations.
Add a simple calculation
You can perform basic calculations for lists and crosstabs in IBM Cognos Business
Insight using data from one or more report items.
Complete the following steps to add a simple calculation.
Procedure
1. Within a list or crosstab, select the headings of the report items you want to
include in the calculation.
.
2. On the toolbar, click the calculate button
3. In the drop-down list, click the operation you want to perform.
Chapter 4. Viewing and interacting with workspaces
75
Results
The calculated results appear in a new column or row. By default, the expression
used in the calculation is used as the heading name.
Tip: To make the name of the calculated row or column more meaningful,
right-click the heading name, click Rename from the context menu, and type a
new name.
to
To apply complex calculations to the report, click the Do More button
open the report in Business Insight Advanced. For more information see the IBM
Cognos Business Insight Advanced User Guide.
Delete a calculation
You can delete calculations.
Procedure
Within a list or crosstab, right-click any cell in the calculated column that you want
to remove and select Delete from the context menu.
Grouping identical values that are in a list report
If a column in a list report contains multiple instances of the same value, you can
group these identical values together.
Grouping reorders the rows of a selected report item so that identical values
appear together and the display of duplicates is suppressed.
Grouping and ungrouping might change the order of the report items as grouped
columns precede ungrouped columns. However you can reorder the list columns
to make the report more readable.
Each group displays summarized values for the identical report items if footer
summarization was enabled when the report was authored.
An example of grouping identical values is shown in the following report; the
duplicate country or region values are suppressed when grouped.
76
IBM Cognos Express Version 10.1.0: Business Insight User Guide
You cannot group numeric values. You can group only report items containing text
data or non-numeric data, such as years or order numbers.
Procedure
1. Within a list report or report part, click the column heading or data value of
the report item by which you want to group.
.
2. On the toolbar, click the group/ungroup button
The report suppresses duplicate values of the selected report item and
summarizes the values in each group.
Tip: To ungroup, click the original item heading and then, on the toolbar, click
the group/ungroup button
.
Reordering list columns
You can reorder list columns in a report widget to better organize the data.
Procedure
To reorder list columns, select the column that you want to move and drag it to
the new position. A flashing black bar indicates where you can drop the column.
You can also right-click the column and select Move, Left or Move, Right from the
context menu.
Renaming list columns
You can rename list columns in a report widget to a more meaningful column
name.
Chapter 4. Viewing and interacting with workspaces
77
Procedure
To rename a list column, select the name of the column that you want to rename,
select Rename from the context menu, and type a meaningful name. To see the
original name of a renamed column, select the column name, and select View
Original Label from the context menu. You can also pause your pointer over the
column name and a tooltip indicates the original label.
Providing quick access to your favorite workspaces and reports
If there are certain workspaces or reports that you refer to on a regular basis, you
can add them to your My Favorites list. Once a workspace or report is added to
My Favorites, it is displayed as a thumbnail image on the Getting Started page.
You can also filter the objects displayed in the Content tab to view all of the
workspaces and reports in your My Favorites list. For more information on
filtering in the Content tab, see “Viewing My Favorites.”
Adding a workspace or report to My Favorites
You can add a workspace to My Favorites from the application bar or the Content
tab. Reports can only be added to My Favorites from the Content tab.
Add a workspace to My Favorites from the application bar
You can add a workspace to My Favorites from the application bar.
Before you begin
To mark a new workspace as a favorite, you must save it first.
Procedure
1. Open the workspace in IBM Cognos Business Insight.
2. On the workspace application bar, click the My Favorites icon
.
Results
The My Favorites icon changes to yellow
as a favorite.
to indicate the workspace is marked
Add a workspace or report to My Favorites from the Content tab
You can add a workspace to My Favorites from the Content tab.
Procedure
1. In the Content tab, browse to and select the workspace or report to add to My
Favorites.
2. Right-click and, from the context menu, select Add to My Favorites.
Viewing My Favorites
After a workspace or report is added to My Favorites, it is displayed under the
Favorites heading on the Getting Started page.
78
IBM Cognos Express Version 10.1.0: Business Insight User Guide
The Getting Started page is displayed each time you log in to IBM Cognos
Business Insight and can be enabled and disabled from My Preferences. You can
also view your list of favorites by filtering on My Favorites in the Content tab.
Procedure
To view My Favorites, in the Content pane, click the Content tab, and select My
Favorites from the content category drop-down list. Only workspaces and reports
marked as favorites are displayed.
Opening a workspace or report from My Favorites
You can open a favorite workspace or report from the Getting Started page or the
Content tab.
Procedure
1. From the Getting Started page, click on a workspace or report from the
Favorites list.
2. From the Content tab, select My Favorites from the content category
drop-down list, then right-click the workspace or report and select Open from
the context menu.
Removing a workspace or report from My Favorites
If you no longer refer to a workspace or report, it can be easily removed from My
Favorites. You can remove a workspace from My Favorites from the Getting
Started Page, the application bar, or the Content tab. Reports can only be removed
from My Favorites from the Getting Started Page and the Content tab.
Remove a workspace from My Favorites by using the application
bar
You can remove a workspace from My Favorites from the application bar.
Procedure
1. Open the workspace in IBM Cognos Business Insight.
2. Click the My Favorites icon
on the workspace application bar.
Results
The My Favorites icon changes to white
longer a favorite.
to indicate the workspace is no
Remove a workspace or report from My Favorites by using the
Content pane
You can remove a workspace from My Favorites from the Content pane.
Procedure
1. In the Content tab, select My Favorites from the content category drop-down
list and select a favorite workspace or report.
2. Right-click and, from the context menu, select Remove from My Favorites.
Remove a workspace or report from My Favorites by using the
Getting Started page
You can remove a workspace from My Favorites from the Getting Started page.
Chapter 4. Viewing and interacting with workspaces
79
Procedure
Right-click a workspace or report in the Favorites list on the Getting Started page
and click Remove from My Favorites
Results
When a workspace or report is removed from My Favorites, it is not removed
from the content store and is still available in the Content tab.
Printing a workspace
You cannot print a workspace directly from IBM Cognos Business Insight.
However you can print a report widget to PDF format and then print the PDF file.
For more information, see “Creating PDF files from workspace widgets.”
Tip: Type Ctrl+P to use the web browser to print what is displayed on the screen.
Alternatively, if you have IBM Cognos for Microsoft Office installed in your
business intelligence environment, you can import a workspace into any of the
supported Microsoft applications and then print the workspace as a Microsoft
document. For more information, see the IBM Cognos for Microsoft Office User
Guide.
Creating PDF files from workspace widgets
You can print individual report widgets as PDF format.
Printing as PDF opens the widget in Adobe Reader to view the full data for the
widget and a preview of how it will appear if you print it. The PDF also includes
the total number of pages. Depending on your version of Adobe Reader, you
might be able to edit the PDF output before saving or printing it.
You must have execute permissions to use the print as PDF option.
Any sort and filter information (including filters applied by a slider filter, select
value filter, or prompt control) displayed in the information bar is also printed in
the PDF.
Alternatively, you can export widgets to PDF to view them in Adobe Reader. For
more information, see “Export a workspace widget” on page 82.
Procedure
1. Click the Actions Menu button
drop-down list, click Print as PDF.
for the report widget and, from the
2. In Adobe Reader, click the print icon from the toolbar or context menu to print
the report.
80
IBM Cognos Express Version 10.1.0: Business Insight User Guide
Exporting workspace widgets to different formats
You can export individual report widgets that contain report content to the
following formats: PDF, Microsoft Excel, CSV, and XML.
You must have execute permissions to use the export option.
When you run a report in an export format such as PDF, delimited text (CSV),
Microsoft Excel (XLS), the IBM Cognos report name is used as the exported file
name.
PDF
To save a snapshot of your data, you can create a PDF version of a report widget.
When you export to PDF, the widget appears in Adobe Reader, so you must have
Adobe Reader installed on your computer.
Any sort and filter information (including filters applied by a slider filter, select
value filter or prompt control) displayed in the information bar is also exported to
the PDF.
Note: Alternatively, you can print individual report widgets to PDF to view them
in Adobe Reader. For more information, see “Creating PDF files from workspace
widgets” on page 80.
Microsoft Excel 2007
Exporting to Microsoft Excel 2007 produces reports that you can view in Microsoft
Excel version 2007.
Microsoft Excel 2007 format renders output in native Excel XML format, also
known as XLSX. This provides a fast way to deliver native Excel spreadsheets to
users of Microsoft Excel 2002, Microsoft Excel 2003, and Microsoft Excel 2007. To
open and save these files, users of Microsoft Excel 2002 and Microsoft Excel 2003
must install the Microsoft Office Compatibility Pack. The output is similar to other
Excel formats, with the following exceptions:
v Charts are rendered as static images.
v Row height can change in the rendered report for better viewing of content.
v Column widths that are explicitly specified in reports are ignored in Microsoft
Excel 2007.
v Merged cells are used to improve the appearance of reports.
v The default size of worksheets is 65,536 rows by 256 columns.
Your IBM Cognos administrator can enable larger worksheets and change the
maximum number of rows in a worksheet - up to a maximum of 16,384 columns
by 1,048,576 rows - by using advanced server properties. For more information,
see the IBM Cognos Business Intelligence Administration and Security Guide.
Any sort and filter information (including filters applied by a slider filter, select
value filter or prompt control) displayed in the information bar is also exported to
Excel 2007.
Chapter 4. Viewing and interacting with workspaces
81
Microsoft Excel 2002
Exporting to Microsoft Excel 2002 produces reports that you can view in Microsoft
Excel versions earlier than 2007.
Microsoft Excel 2002 format offers the following benefits:
v Works with SSL protocol.
v Works with a single signon. Secure reports can be accessed without subsequent
signons because the system automatically identifies users and provides security
information.
v Works with Netscape 7.01.
v Spreadsheets are contained in a single file for reliable spreadsheet navigation.
v The maximum size of worksheets is 65,536 rows by 256 columns.
CSV
You can view list report widgets in CSV (Comma Separated Values) format. You
cannot view charts or crosstab report widgets in CSV format.
When you export to CSV, the widget appears in the application you have
associated with CSV format files.
To produce in CSV output:
v Charts must have at least one category or series.
v Reports must have only one query defined in the report, unless the additional
queries are used for prompts.
XML
XML outputs are useful if you want to use a report widget as a data source for
another report or widget, or if you use a database that cannot be read by
Framework Manager.
To produce in XML output:
v Charts must have at least one category or series.
v Reports must have only one query defined in the report, unless the additional
queries are used for prompts.
Export a workspace widget
You can export individual report widgets that contain report content to the
following formats: PDF, Microsoft Excel, CSV, and XML.
Procedure
Click the Actions Menu button
for the report widget and, from the
drop-down list, click Export to and then click a file type.
Results
The report content appears in the file format you chose.
82
IBM Cognos Express Version 10.1.0: Business Insight User Guide
For more information, see “Exporting workspace widgets to different formats” on
page 81.
Making reports accessible to users with disabilities
You can enable accessibility features in reports to ensure access of information to
all users, with all levels of ability. Accessible reports contain tags that allow users
with disabilities to access report content using assistive technologies, such as screen
readers.
When accessible reports are enabled, accessible report output is available in PDF,
HTML, and Microsoft Excel 2007.
Note: Accessible reports require more report processing and have a greater file
size than non-accessible reports and as a result, IBM Cognos Business Insight
performance might be reduced when this option is enabled.
Procedure
1. On the application bar, click the Actions Menu button
Preferences from the drop-down list.
and, click My
2. Select the Enable accessibility support for reports option.
To disable accessible report output, deselect this option.
3. Click OK to save the setting and close the dialog box.
Drilling to view related data
IBM Cognos Business Insight supports various drill operations so that you can
view related report data. You can perform drill operations in lists, crosstabs, and
charts.
Drilling up or drilling down
You can drill up or drill down within a report or report part.
In IBM Cognos Business Insight, for lists and crosstabs, drillable items are
identified by hyperlinks when the pointer pauses over the data item. In charts, the
pointer changes to a hand when you pause it over a drillable item, and a tooltip
indicates what you are drilling on.
If you drill on a report item that uses a slider filter widget to filter table and chart
data, the slider filter will not update to the new drill level. If you want the slider
filter to act on the new drill level, you must update the slider filter properties.
In Business Insight, drill up and drill down is available only when you are using
dimensionally structured data.
Procedure
1. Add a report or report part to the workspace.
2. Right-click the report item you want to drill on and click the Drill Up
Drill Down button
or
.
Chapter 4. Viewing and interacting with workspaces
83
Tip: You can also click the drillable report item twice to drill down. The first
click selects the cell in the list or crosstab and displays the down cursor, the
second click drills down. If only drill up is available on a selected item, the
drill up cursor is displayed and the second click drills up.
Synchronizing drill up and drill down
If two report widgets listen to each other, are based on the same
dimensionally-modelled data source, and the report contains items from the same
hierarchy, drilling in one report widget will affect a drill in the other report widget.
For example, when you drill down on the item 2005 in one report widget, all
reports in the workspace drill down on the same item and the data for the year
2005 appears in all reports.
By default, the communication between the report widgets is enabled. To turn off
communication between the two report widgets, see “Widget to widget
communication” on page 46.
Go to another target report
You can navigate from a report object to another target report.
You can go to the following targets:
v An IBM Cognos Query Studio report
v An IBM Cognos Report Studio report
v An IBM Cognos Analysis Studio analysis
v An IBM Cognos Series 7 report
v A Microsoft Analysis Services report
Before you can go to another target, a drill-through definition must be created in
the package. For more information, contact your administrator.
By default, drilling through from a package is enabled.
Procedure
1. Add a report or report part to the workspace.
2. Right-click the report item from which you want to navigate and click Go To
.
If there is only one possible target for the column, it appears in the studio
where the drill is authored to go to.
If there is more than one possible target for the column, the Go To page
appears, showing the available targets.
3. Click the target you want to navigate to.
The target appears in IBM Cognos Viewer.
Viewing report versions
If there are multiple report output versions saved in the content store, you can
view the saved report output versions or view the live version of the report. The
report is displayed using the latest saved output version by default.
84
IBM Cognos Express Version 10.1.0: Business Insight User Guide
To run saved report output versions, you must have execute permissions on the
report. If you do not, contact your system administrator for assistance.
Procedure
1. Click the widget Actions Menu button
for the widget, and from the
drop-down list, click Versions to display the list of saved output versions.
2. From the list, select the version that you want to view. To display the live
version of the report, select Live.
If there are more than five saved report versions, click More to display the
entire list.
Creating watch rules for specific conditions
You can set up a watch rule to send an alert when a specific condition in a saved
report is satisfied.
Before you begin
You must have read and traverse permissions to the report output to create watch
rules.
For information on enabling watch rules, see the IBM Cognos Connections User
Guide.
Procedure
1. In the report widget that contains a saved HTML report version, right-click a
numeric data item and then click Alert Using New Watch Rule.
2. In the Specify the rule - Alert Using New Watch Rule page, select Send an
alert when the report contains.
3. In the conditional expression, from the drop-down list, select the expression to
use for the watch rule, for example, >= (greater than or equal), and specify a
value in the box.
4. Under For the selected context, select the report items to which the rule
applies.
5. Click Next.
What to do next
You must now set up the alert details for the watch rule. For more information, see
“Defining alert details for watch rules” on page 86.
Creating watch rules for different condition status indicators
You can set up a watch rule to send different alerts depending on the performance
status (good, average, and poor) of a condition in a saved report.
To set up the watch rule, you use thresholds to map a range of numeric values to
performance status. When setting up your threshold boundaries, you must decide
whether low, medium, or high values are favorable for the condition. For example,
if you are setting up a condition to monitor sales figures for a product, you would
indicate that high values are favorable. This is known as the performance pattern.
Chapter 4. Viewing and interacting with workspaces
85
Watch rules can be created only in saved HTML reports. You cannot create watch
rules in other report formats.
Before you begin
To create watch rules, you must have read and traverse permissions to the report
output.
Procedure
1. In the report widget that contains a saved HTML report version, click a
numeric data item, right-click, and then click Watch New Versions, Alert Using
New Watch Rule.
2. In the report, click a numeric data item, right-click, and then click Alert Using
New Watch Rule.
3. In the Specify the rule - Alert Using New Watch Rule page, select Send an
alert based on thresholds.
4. In the Performance pattern box, select which range of values to associate with
"good performance" status.
5. In the Threshold boundaries box, specify the boundary values for the
condition.
Tip: For each boundary value, you can click the arrow attached to the numeric
value box to adjust them follows:
v To include the specified boundary value in the higher threshold, click the up
arrow.
v To include the specified boundary value in the lower threshold, click the
down arrow.
6. Under For the selected context, select the report items to which the rule
applies.
7. Click Next.
What to do next
You must now set up the alert details for the watch rule. For more information, see
“Defining alert details for watch rules.”
Defining alert details for watch rules
When you have defined the type of watch rule you are creating, you must define
the type of alert you want to generate.
You can choose one or more of the following options:
v
v
v
Send the report by email if you want to be alerted by email
Publish a news item if you want to be alerted by news item
Send a notification if you want to alert other users by sending notifications to
their task inbox
If you have set up a watch rule for different condition status indicators, you can
define multiple alerts, depending on performance. For example, for average or
poor performance, you could choose to be alerted by email as well as sending a
notification to the sales manager to review the sales figures. For good performance,
you could send a notification to the sales manager to distribute the figures to the
sales team.
86
IBM Cognos Express Version 10.1.0: Business Insight User Guide
Procedure
1. In the Specify the alert type - Alert Using New Watch Rule page, specify
which alerts to send when the rule is satisfied.
Tip: To change the details for an alert type, click Edit the options.
2. If you have defined a watch rule for different condition status indicators, select
the required check boxes to associate the alert with poor, average or good
performance.
Performance is defined by the performance pattern.
Click Next.
3. In the Specify a name and description - Alert Using New Watch Rule page,
specify a name, description, screen tip, and location for the watch rule.
Tip: You can organize watch rules in folders on the Rules tab of the My Watch
Items area of the portal.
4. Click Finish.
Viewing, modifying, or deleting a watch rule
Watch rules you create in saved reports can be edited and deleted in IBM Cognos
Business Insight.
For information about creating a watch rule, see “Creating watch rules for specific
conditions” on page 85, and “Creating watch rules for different condition status
indicators” on page 85.
You can also delete and edit watch rules from the My Watch Items area of the IBM
Cognos Connection portal.
Before you begin
To modify or delete a watch rule, you must have write access to the rule.
Procedure
1. Select the widget that contains a saved HTML report version on the workspace.
2. On the report widget toolbar, click Watch New Versions and, while hovering
over the watch rule, from the submenu click Modify to edit the watch rule.
The Set properties dialog box appears.
Tip: Click Delete to delete the watch rule.
3. Click the General tab to change properties, such as the language, name, and
description of the watch rule.
4. Click the Rules tab to edit the rules properties, such as the conditional
expression for the rule, the items to which the rule applies, and the alert type.
Results
Any changes you make to a watch rule in IBM Cognos Business Insight are also
made in the My Watch Items area of the IBM Cognos Connection portal.
Chapter 4. Viewing and interacting with workspaces
87
Viewing lineage information for a data item
You can view the lineage information of a report data item to see what the item
represents. Lineage information traces the metadata of an item back through the
package and the data sources used by the package. Lineage also displays any data
item filters that were added by the report author or that were defined in the data
model.
Lineage is available only after your administrator has configured it. For more
information, see the Administration and Security Guide
Note: Lineage is not supported in reports that are not linked to packages.
You can use the lineage tool that comes with IBM Cognos Business Intelligence, or
you can use another lineage tool by specifying the URL to the tool in IBM Cognos
Administration. Note that if the URL source is secured, the source must be able to
prompt users for a password because IBM Cognos BI does not pass security
information. IBM Cognos BI also supports the IBM Metadata Workbench as a
lineage tool. For more information about configuring other lineage tools, see the
Administration and Security Guide.
The IBM Cognos BI lineage tool
The IBM Cognos BI lineage tool includes two views: the business view and the
technical view.
The business view displays high-level textual information that describes the data
item and the package from which it comes. This information is taken from IBM
Cognos Connection and the Framework Manager model.
The technical view is a graphical representation of the lineage of the selected data
item. The lineage traces the data item from the package to the data sources used
by the package.
When you click an item, its properties appear below it. If you click an item in the
Package area, you see the model properties of the item. If you click an item in the
Data Sources area, you see the data source properties of the item.
View lineage information for a data item
You can view the lineage information of a report data item to see what the item
represents.
You cannot use lineage information to troubleshoot queries. For example, lineage
information will not explain why a data item is double counted.
Before you begin
Before you can access lineage information for a report, your administrator must
configure lineage in IBM Cognos Administration. Also, the administrator must
enable the lineage capability and grant read permission for you on the report.
The IBM Cognos BI lineage tool shows lineage on a report at its highest level. The
lineage does not change after you drill-down on a report. Because the selection
context used to launch lineage can be affected by drill-down operations, we
recommend that you always start lineage at the highest report level before drilling
88
IBM Cognos Express Version 10.1.0: Business Insight User Guide
down on the report. Otherwise, the lineage might not launch properly.
Procedure
1. Open a workspace that contains report content, or drag and drop a report or
report part onto the workspace.
2. In the report widget, right-click a report data item and click Lineage.
Tip: You can view lineage information for multiple data items at the same time
by first Ctrl+clicking the items. The IBM Metadata Workbench does not support
viewing lineage for multiple data items at once.
Results
The lineage tool opens showing the lineage information of the selected data item.
Viewing information cards
IBM Cognos Business Insight provides information cards that display high level
information about workspace content such as owner, contact information, and date
modified. Information cards also display a thumbnail view of the workspace or
report content.
By default, the information card feature is disabled. Complete the following steps
to enable or disable information cards and view information cards.
Procedure
1. Click the information card button
tab.
in the upper right corner of the Content
2. When information cards are enabled, pause the pointer over content in the
Content pane Content tab, or in the Open or Save As dialog boxes to see the
information card.
Accessing the IBM InfoSphere Business Glossary
Business glossaries help you manage and share an enterprise vocabulary and
classification system.
If you use the IBM InfoSphere® Business Glossary, you can access the glossary
from any of the following report data objects in a report widget:
v Query subject
v Query item
v Measure
v
v
v
v
v
v
v
Dimension
Hierarchy
Level
Property/attribute
Top node member
Member
Level item
Chapter 4. Viewing and interacting with workspaces
89
Procedure
1. Open a workspace that contains report content, or drag and drop a report or
report part onto the workspace.
2. In the report widget, right-click a report data object and click Glossary.
Results
The IBM InfoSphere Business Glossary appears.
90
IBM Cognos Express Version 10.1.0: Business Insight User Guide
Chapter 5. Collaborating with IBM Cognos Business Insight
Collaboration capabilities in IBM Cognos Business Insight provide a bridge
between using IBM Cognos Business Intelligence to discover a business problem
and acting to resolve it.
Decision making is often a team activity. Individuals create and receive reports,
perform analysis, and monitor workspaces. When the time comes to act on this
information, individuals come together with their colleagues to make decisions. As
well as collaborating through email, phone calls, and meetings, business users now
have the ability to collaborate while creating or viewing reports, performing
analysis, or monitoring workspaces.
You can collaborate using Business Insight comments or by using IBM Connections
activities. You can also use the additional enterprise social software capabilities in
IBM Connections to collaborate outside of a workspace.
Collaborating by using comments
Comments, also referred to as annotations, allow you to collaborate on the content
of a report on a workspace. You can add simple comments to a report so that other
users viewing the same report will have additional context or information about
the report. Those users can respond with further comments about the report.
This type of collaboration is useful, for example, to add a reminder to investigate
low sales figures for a particular product, or to explain an anomaly in the data that
could be a cause for concern.
To have a more detailed discussion about the workspace, involving other team
members, to set up activities related to the discussion, and to track the history of
that discussion in a single place, you can use the collaborative decision-making
facility provided through activities.
For more information, see “Collaborating by using IBM Connections activities” on
page 94.
You can add comments to live reports, and saved report output versions. When
you print a live report to PDF, or export it to PDF or Microsoft Excel spreadsheet
software, comments are included.
You can add, view, and edit comments on the following areas of the workspace:
v reports or report parts
v individual cells or data items in reports and report parts
Cell-based comments are available in lists and crosstabs only.
To add or edit comments, you must have execute access for live reports and read
and traverse access for saved output versions. Comments are visible to other
workspace users.
© Copyright IBM Corp. 2010, 2012
91
Comments are also available in IBM Cognos Viewer, but these are completely
separate from comments in IBM Cognos Business Insight and work in a different
way. For information, see "Comments in Saved Reports" in the IBM Cognos
Connection User Guide.
Adding comments
You can add comments to a report widget for all report display types. Within a list
or crosstab you can also add comments to individual cells.
A comment is specific to the context of the report, as well as the cell (if applicable)
and prompt value (if applicable). Suppose you select January as the prompt value
for the "month" prompt when you run a report. If "month" is included in the
report, when you apply a comment, the comment is specific to January. If you later
change the prompt value to February, the previous comment from January still
exists, but you will not see it on the report. You can, however, add a new comment
for February, if required.
When you add a cell-based comment, consider the following:
v The comment belongs to the cell, not to its value.
If the value of a cell changes after a report is refreshed, the previous comment
still exists and is visible.
v The value of the cell is included in the comment text by default.
If you include the value in the comment, and this value changes when the report
is refreshed, the original value still exists in the previous comment. However, if
you add another comment to the same cell, the updated value is included in the
new comment text.
v The comment is specific to the cell in the current report only.
If the same cell exists in another report, the comment is not linked.
Note: If you change the display type to a format that does not support comments,
the comments are not visible. You must change the display back to the original
format to view the comments again.
If you have read access to a report, you can add information to an existing
comment by editing it. The comment will show all content added by you and
other users. For more information, see “Editing or deleting comments” on page 93.
Before you begin
You must have read access to a report to add comments to it.
You must save the workspace before you can add comments. If the workspace is
not saved, you will be prompted to save it when you attempt to add a comment.
Procedure
1. Select the required report cell or report widget.
2. From the widget toolbar, click the Comment button
3. Click Add Comment.
4. In the pop-up box, type the required comment.
5. Click Done to save the comment.
92
IBM Cognos Express Version 10.1.0: Business Insight User Guide
.
Results
A red triangular marker appears in the top corner of the report widget or cell to
indicate that a comment has been added to it, as shown below in the return
quantity for personal accessories cell.
Viewing comments
Comments can be viewed by anybody who has read access to the report.
If there are multiple comments for the same cell or report widget, the comments
appear in reverse chronological order. For each comment, you can see the user's
name, date, and the time the comment was written.
The time stamp on a comment is based on the time zone set in the user's IBM
Cognos Business Insight personal preferences.
Procedure
To view comments, pause the pointer over the comment (indicated by a red
triangular marker).
Editing or deleting comments
You can edit or delete comments that you add during the current workspace
session.
When the workspace is closed, it is no longer possible to edit or delete comments
from that session. You can, however, add additional comments to the initial
comment using the Edit Comment action.
You cannot edit or delete comments added by other users at any time.
If you delete a report column or row containing cell-based comments, the
comments no longer appear. If you later restore the column or row using the Reset
action on the Widget Actions button
are also restored.
for the widget, the associated comments
When a report is refreshed, if a report column or row containing a comment has
been deleted from the data source, the comment no longer appears.
Procedure
1. Select the required report cell or report widget.
.
2. From the widget toolbar, click the Comment button
3. Do one of the following:
v To edit a comment, click Edit Comment, change the text, and click Done.
Chapter 5. Collaborating with IBM Cognos Business Insight
93
v To delete a comment, click Delete Comment.
Collaborating by using IBM Connections activities
Activities, part of IBM Connections, is a web-based collaboration service for
collecting, organizing, sharing, and reusing work related to a goal. Members of an
activity interact in an online location in which they create, collect, and share a set
of ideas and resources to support a goal. An activity is a way for you to organize
your work and collaborate with others in a shared web space. Because it is easy to
invite new members, you can quickly gather the right people and resources you
need to get the job done. You can post messages, share files and links to web sites,
and create and assign to-do items.
Activities are integrated with IBM Cognos Business Insight and form a key part of
it.
When individuals identify business problems and opportunities using IBM Cognos
Business Intelligence, they often need to collaborate to share information with
colleagues and to make team-based decisions. With activities, you can collaborate
on the content of an entire workspace and solve these problems in a faster and
more structured way.
For example, you may have previously collaborated with another colleague, using
comments to flag low sales figures for a particular product. You then decide that a
more detailed investigation about the sales figures is required to resolve the
problem. You can set up an activity that involves collaborating with other team
members, so that you can track the history and outcome of that activity in a single
place.
Using activities for collaborative decision-making can facilitate the whole
decision-making process. You can create activities in Business Insight for the
following reasons:
v To provide a single place to gather each participant's ideas and opinions.
v To include a link to the Business Insight workspace so that teams can conduct
further analysis as required.
v To provide a single historical record of how issues are resolved and how
decisions are reached.
v To track and audit decisions and initiatives.
v To include all stakeholders and interested parties in the decision-making process.
v To allow other people who join the activity after it has started to view the
activity and to quickly understand its history.
Starting a workspace activity
When you identify an issue related to a workspace, and you want to collaborate
with other team members to resolve it, you can start a workspace activity. This
creates an IBM Connections activity that is connected to the workspace.
After the activity is created, you can work with it in Connections. The activity
contains one entry named IBM Cognos Business Insight, which provides the URL
address for the workspace.
The URL address is pre-defined and should not be changed.
94
IBM Cognos Express Version 10.1.0: Business Insight User Guide
Before you begin
You must save the workspace before you can start a workspace activity. If the
workspace is not saved, you will be prompted to save it when you attempt to start
an activity.
Procedure
On the workspace application bar, click the Collaborate menu button
.
From the drop-down list, click Start an Activity.
In the Title box, type a brief description of the activity.
In the Activity goal box, type a description of what you want to achieve from
the activity.
5. In the Tags box, add tag terms that will allow users to search for the activity
in Connections. Separate each term using a comma.
For example, if the activity is related to sales figures for tents, you could add
"tents" and "camping equipment" as your tags.
6. If required, in the Due date box, enter the required completion date for the
activity.
1.
2.
3.
4.
7. To include team members in the activity, expand Member options.
Other users can only see the activity if they are added as members.
8. To add an individual user to the activity, first select the user role from the
drop-down list. The access level options for each role are defined as follows:
v Author - can view content and add entries (default).
Owner - can add content, view, and edit all entries.
When you start an activity, you are automatically added as an owner.
v Reader - cannot contribute to an activity; access is restricted to viewing
content only.
9. Type the user's name in the box adjacent to the user role, and then click Add
v
.
Repeat this step for each member you want to add.
Tip: If you are adding multiple members belonging to the same LDAP user
group, you can quickly add all members by typing the user group name.
Note: Users can only access the activity if they have been added to it. You can
change the activity membership in Connections after the activity has been
created.
10. To use a template for the activity, expand Template options.
11. Click Pick an Activity Template, and then select a template from the list.
Alternatively, if you do not want to use a template, select None from the list.
If you pick a template when creating an activity, your new activity is based on
another activity that already exists.
Templates are only available if they have been created in Connections. You can
create templates containing a standard set of steps or processes that you want
to follow. For example, a collaborative decision-making template could include
sections for evidence, objectives, proposals, and decision.
Tip: You can easily create a template in Connections by saving an existing
activity as a template.
Chapter 5. Collaborating with IBM Cognos Business Insight
95
12. Select Use members from template if you want to populate the member list
with the members defined in the selected template.
13. Click Save.
14. Select one of the following options:
v Open this activity
The activity opens in Connections. You can add additional members and
entries (with links and attachments) to the activity, add comments to it,
create to-do items, and assign them to team members as required.
v Return to Business Insight
You can continue working on the workspace.
Tip: You can return to the activity by the selecting View/Hide Workspace
Activities from the Collaborate menu button
drop-down list.
Accessing IBM Connections from IBM Cognos Business
Insight
You can access IBM Connections from IBM Cognos Business Insight in several
ways.
Access Connections from Business Insight using the following ways:
v From an existing workspace activity in the collaboration pane directly to the
activity in Connections.
v From the IBM Cognos Business Intelligence Welcome page.
v From the Launch menu in IBM Cognos Connection and IBM Cognos
Administration.
v From the Launch menu in the workspace Actions menu
.
When a workspace activity has been started, you can work with it in Connections.
You can complete the following tasks:
v
v
v
v
v
Add members to the activity.
Change the access for an activity.
Add sections to group together entries and to-do items.
Add entries.
Add to-do items and assign them to activity members.
v Complete to-do items.
v Add comments.
v Mark an activity as complete.
v Save an activity as a template for future activities.
v Tune out of or in to an activity.
There are other tasks you can perform for activities. For more information, see the
Connections Information Center http://publib.boulder.ibm.com/infocenter/
ltscnnct/v2r0/index.jsp.
Note: In Connections, you can view all activities for which you have access not
just those associated with a specific workspace.
96
IBM Cognos Express Version 10.1.0: Business Insight User Guide
Adding members to an activity
You can add further members to an activity so that they can access it in IBM
Connections.
If you add members to an activity who do not have access to the workspace in
IBM Cognos Business Insight, they cannot see the associated workspace.
Procedure
1.
2.
3.
4.
From Connections, in the Activities tab, click My Activities.
Click the activity to which you want to add a member.
Click Add Members in the navigation pane.
To add an individual user to the activity, first select the user role from the
drop-down list. The access level options for each role are defined as follows:
v Author - can view content and add entries (default).
v Owner - can add content, view, and edit all entries.
When you start an activity, you are automatically added as an owner.
v Reader - cannot contribute to an activity; access is restricted to viewing
content only.
5. Type the user's name in the box adjacent to the user role, and then click Add
.
Repeat this step for each member you want to add.
Tip: If you are adding multiple members belonging to the same LDAP user
group, you can quickly add all members by typing the user group name.
6. Click Save.
Changing the access for an activity
You can control whether access to an activity is public or private.
By default, when an activity is started in IBM Connections or created from IBM
Cognos Business Insight, the access is private, and available to the activity
members only. If you change the access to public, anyone in Connections can
access it. However, unless they are specifically given access to the associated
workspace in Business Insight, they cannot see the workspace.
Procedure
1. From Connections, in the Activities tab, click My Activities.
2. Click the activity to which you want to add a member.
3. In the Public Access section in the navigation pane, click Change.
4. Select one of the following options:
v Private (Default) - only invited members can see the activity.
v Public (Read Only) - anyone can find and view the content of the activity.
v Public - anyone can find, see, and add content to the activity.
5. Click Save.
Adding sections to an activity
You add sections to an activity to provide a hierarchical outline for an activity, and
to group together entries and to-do items.
Chapter 5. Collaborating with IBM Cognos Business Insight
97
Procedure
1.
2.
3.
4.
From IBM Connections, in the Activities tab, click My Activities.
Click the activity to which you want to add the section.
Click Add Section.
In the Section box, type a brief description of the section.
5. Click Save.
Adding entries to an activity
You add entries if you want to include content in an activity. For example, you can
add text, files, and bookmarks.
When you create an entry, you can add it to the activity or to a selected entry,
to-do item or section contained within the activity.
Procedure
1. From IBM Connections, in the Activities tab, click My Activities.
2. Click the activity and, if required, select the entry, to-do item, or section to
which you want to add the entry.
3. Click Add Entry.
4. In the Title box, type a brief description of the entry.
5. Add the following types of content as required:
v To attach a file, click Attach File
.
v To add a web address, click Add Bookmark
.
v To add a customized field, click Add Custom Fields
desired field type.
, and then click the
For more information on adding content, see the Connections
http://publib.boulder.ibm.com/infocenter/ltscnnct/v2r0/index.jsp.
6. In the Description box, add further detail about the entry or the content.
7. In the Tags box, add tag terms that will allow users to search for the entry in
Connections. Separate each term using a comma.
For example, if the entry is related to sales figures for tents, you could add
"tents" and "camping equipment" as your tags.
For more information on tags, see the Connections http://
publib.boulder.ibm.com/infocenter/ltscnnct/v2r0/index.jsp.
8. If required, in the Section drop-down list, select the section to which you
want to add this entry.
Note: A list of sections is only available if the sections have already been
added to the activity.
9. To hide the entry from other activity members, select Mark this entry private.
10. To notify activity members about this entry, select Notify people of this entry
and then select one of the following:
v To notify everyone, select All members of this activity.
v To notify specific members only, select each individual member.
Note: If an LDAP user group was used to add members to an activity, to
select a specific member of that group, you must add that person to the
activity as an individual.
98
IBM Cognos Express Version 10.1.0: Business Insight User Guide
For more information about selecting members, see the Connections
http://publib.boulder.ibm.com/infocenter/ltscnnct/v2r0/index.jsp.
11. In the Notify Message box, add a comment that will appear in the notification
that is sent to the selected members.
12. Click Save.
Working with to-do items in an activity
You can assign tasks to a group of activity members, or to specific members only,
by creating to-do items.
If an LDAP user group was used to add members to an activity, and you want to
assign a to-do item to a specific member of the group, you must add that person to
the activity as an individual.
When you have finished working on a task, you can mark the to-do item as
complete.
Creating to-do items for an activity
You add to-do items when you want to assign tasks to one or more activity
members.
When you create a to-do item, you can add it to the activity or to a selected entry,
to-do item, comment, or section contained within the activity.
Procedure
1. From IBM Connections, in the Activities tab, click My Activities.
2. Click the activity and, if required, select the entry, to-do item, comment, or
section to which you want to add the to-do item.
3. Click Add To Do Item.
4. In the To Do box, type a brief description of the task.
5. To include more information, expand More options.
6. To assign the item to a specific member only, click Choose a person, and then
select the member's name.
By default, the item is shared and can be undertaken by any activity member.
7. If required, in the Due date box, enter the required completion date for the
to-do item.
8. Add the following types of content as required:
v To attach a file, click Attach File
.
v To add a web address, click Add Bookmark
.
, and then click the
v To add a customized field, click Add Custom Fields
desired field type.
For more information on adding content, see the Connections Information
Center at http://publib.boulder.ibm.com/infocenter/ltscnnct/v2r0/index.jsp.
9. In the Description box, add further detail about the item or the content.
10. In the Tags box, add tag terms that will allow users to search for the item in
Connections. Separate each term using a comma.
For example, if the item is related to sales figures for tents, you could add
"tents" and "camping equipment" as your tags.
Chapter 5. Collaborating with IBM Cognos Business Insight
99
For more information on tags, see the Connections Information Center at
http://publib.boulder.ibm.com/infocenter/ltscnnct/v2r0/index.jsp.
11. If required, in the Section drop-down list, select the section to which you
want to add this entry.
Note: A list of sections is only available if the sections have already been
added to the activity.
12. To hide the entry from other activity members, select Mark this entry private.
13. To notify activity members about this entry, select Notify people of this entry
and then select one of the following:
v To notify everyone, select All members of this activity.
v To notify specific members only, select each individual member.
For more information about selecting members, see the Connections
Information Center at http://publib.boulder.ibm.com/infocenter/ltscnnct/
v2r0/index.jsp.
14. In the Notify Message box, add a comment that will appear in the notification
that is sent to the selected members.
15. Click Save.
Marking to-do items as complete
When you have finished working on a task, you can mark the to-do item as
complete.
Procedure
1. From IBM Connections, in the Activities tab, click My Activities.
2. Click the activity and find the to-do item related to the completed task.
Tip: To view a list of to-do items for the activity, click To Do Items in the
navigation pane.
3. Select the check box adjacent to the required to-do item.
Results
The to-do item now appears crossed out to indicate that it has been completed.
Adding comments to an activity
You add comments when you want to log a note against an entry or to-do item.
You can also respond to existing comments.
You can include content with the comment, for example, you can add files and
bookmarks.
Procedure
1. From IBM Connections, in the Activities tab, click My Activities.
2. Click the activity, and select the entry or to-do item to which you want to add
a comment.
Tip: To respond to a comment, select the required comment.
3. Click Add Comment.
4. Add the following types of content as required:
v To attach a file, click Attach File
.
v To add a web address, click Add Bookmark
100
IBM Cognos Express Version 10.1.0: Business Insight User Guide
.
For more information on adding content, see the Connections
http://publib.boulder.ibm.com/infocenter/ltscnnct/v2r0/index.jsp.
5. In the Comment box, add your comments.
6. To hide the entry from other activity members, select Mark this entry private.
7. To notify activity members about this entry, select Notify people of this entry
and then select one of the following:
v To notify everyone, select All members of this activity.
v To notify specific members only, select each individual member.
Note: If an LDAP user group was used to add members to an activity, and
you want to assign a to-do item to a specific member of the group, you must
add that person to the activity as an individual.
For more information about selecting members, see the Connections
http://publib.boulder.ibm.com/infocenter/ltscnnct/v2r0/index.jsp.
8. Click Save.
Marking activities as complete
When an activity's goal has been achieved, you can mark the activity as complete.
You must be the owner of an activity to mark it as complete.
Completed activities are not visible to activity members in My Activities in IBM
Connections or in IBM Cognos Business Insight. You can view them in
Connections by clicking Completed in the navigation pane.
Procedure
1. From Connections, in the Activities tab, click My Activities.
2. Click the required activity.
3. Click Mark Activity Complete in the title bar.
Saving an activity as a template
You can save an activity as a template to use as the basis for creating similar
activities in the future.
You access templates from the Activity Templates tab. Complete the following
steps to save and activity as a template.
Procedure
From IBM Connections, in the Activities tab, click My Activities.
Click the required activity.
Click More Actions in the title bar, and then click Copy As New Template.
In the Template box, type a name for the template.
In the About this template box, type a description for the template.
In the Tags box, add tag terms that will allow users to search for the template
in Connections. Separate each term using a comma.
For example, if the template is related to the sales team, you could add "sales
team" as your tag.
For more information on tags, see the Connections http://
publib.boulder.ibm.com/infocenter/ltscnnct/v2r0/index.jsp.
7. In the Starting page drop-down list, select the type of view to display by
default when a new activity is created using the template.
1.
2.
3.
4.
5.
6.
Chapter 5. Collaborating with IBM Cognos Business Insight
101
8. If you want to populate the template member list with the members defined
in the activity, select Use members from template.
9. To add further members to the template, expand Member options.
10. To add an individual member, first select the member's role from the
drop-down list, and then type the member's name in the box adjacent to the
role. The access level options for each role are defined as follows:
v
v
v
Author - can view content and add entries (default).
Owner - can add content, view, and edit all entries.
Reader - cannot contribute to an activity; access is restricted to viewing
content only.
11. Click Save.
12. Review the template and make changes to it as required.
Tuning out of or in to an activity
By default, when an activity is started using IBM Connections, its priority is set to
normal, and you are tuned in to it. If you tune out of an activity, you can no
longer see it, although it is still visible to other members.
Tuned out activities are not visible to activity members in My Activities in
Connections or in IBM Cognos Business Insight. You can view them in
Connections by clicking Tuned Out Activities in the navigation pane.
Once an activity is tuned out, you can reset the priority (normal, medium or high)
by tuning in to it again.
Note: When an activity is tuned out in Connections, it disappears from the activity
list in Business Insight. The activity re-appears if you tune in to it again.
Procedure
1. To tune out of an activity, do the following:
v From Connections, in the Activities tab, click My Activities.
v Click the required activity.
v Click More Actions in the title bar, and then click Mark as Tuned Out.
2. To tune in to an activity, do the following:
v From Connections, in the Activities tab, click Tuned Out Activities.
v Click the required activity.
v Click More Actions in the title bar, and then click the required priority.
Opening a workspace from IBM Connections
You can open the workspace to which an activity is connected directly from IBM
Connections. You can only view workspaces for which you have access.
Procedure
1. From Connections, in the Activities tab, click My Activities.
2. Click the activity for which you want to open the workspace.
3. Expand the entry named IBM Cognos Business Insight, and then click the
workspace link.
102
IBM Cognos Express Version 10.1.0: Business Insight User Guide
Viewing workspace activities
You can view a list of activities started by users with access to the workspace, and
open them in IBM Connections.
When a workspace has activities associated with it, a red flag appears on the
and the number of activities available is shown in
Collaborate menu button
brackets on the View/Hide Workspace Activities menu button.
Note: When an activity is tuned out or marked as complete in Connections, it
disappears from the activity list in Business Insight. The activity re-appears if you
tune in to it again.
You can refresh the activity list in the Collaboration pane by clicking the Refresh
button on the Collaboration pane toolbar.
You can close the Collaboration pane by clicking the Close button.
Before you begin
You can only view activities in IBM Cognos Business Insight which are associated
with the workspace that is open and for which you have access.
Procedure
1. On the workspace application bar, click the Collaborate menu button
.
2. From the drop-down list, click View/Hide Workspace Activities.
A list of all activities started for the workspace, for which you have access,
appears in the Collaboration pane.
For each activity shown you can see the activity title, the name of the user who
performed the last update, and the date and time of the update. The activity
priority and due date are also shown, if they have been set up.
If you expand an activity, by clicking More, you can see a summary of the last
three updates, and the activity goal.
3. Click an activity, or a specific entry within it, to open it fully in Connections.
Using IBM Connections to collaborate outside of a workspace
You can also use the additional enterprise social software capabilities provided by
IBM Connections to collaborate with colleagues independently of the workspace
environment.
For example, having used the collaboration capabilities on the workspace to
investigate low sales figures for a product, your team may conclude that a new
marketing campaign is required to promote the product. You decide to use
Connections to continue your collaborative discussions with a wider network of
colleagues.
Using Connections allows you to do the following:
v Develop, nurture, and remain in contact with your network of colleagues.
v Discuss and refine new creative ideas with communities of colleagues, partners,
and customers.
Chapter 5. Collaborating with IBM Cognos Business Insight
103
v Respond quickly to business opportunities by calling upon the expertise in your
network.
By allowing employees to easily connect with their networks, Connections can help
organizations achieve the following benefits:
v Tasks can be completed faster through quick access to relevant information from
an expanded network of professionals.
v Business decisions can be made with added confidence having consulted subject
matter experts from across an organization.
v Innovation in products and services can be fostered as a result of the experiences
and knowledge of communities of employees, partners and customers.
Connections provides the following services to help you draw upon the collective
knowledge of your professional network of colleagues, partners, and customers.
v The Home page service provides a consolidated view of your social data from
other Connections services.
v The Communities service allows you to stay in touch, share information,
exchange ideas, and collaborate on projects with other individuals who share a
common interest, responsibility or area of expertise.
v The Profiles service allows you to quickly find people by searching across your
organization for people with the expertise and project experience that match
your search keywords.
v The Activities service allows you to create online work areas where individuals
in your network can gather emails, chats, documents, messages, and other
information needed to accomplish a business objective.
v The Wikis service allows you to collaboratively enter, edit, and publish web page
content.
v The Blogs service allows you to present your ideas, obtain feedback, and learn
from the expertise and experience of others who blog.
v The Files service provides a convenient way to share documents, spreadsheets,
presentations, and other types of files without using email.
v The Bookmarks social bookmarking service allows you to save, organize, and
share bookmarks. It can also discover bookmarks that have been qualified by
other users.
For more information, see the Connections Information Center
http://publib.boulder.ibm.com/infocenter/ltscnnct/v2r0/index.jsp.
104
IBM Cognos Express Version 10.1.0: Business Insight User Guide
Chapter 6. Samples
Sample reports are included with IBM Cognos Business Intelligence. When
installed, you can find them in the Public Folders tab in IBM Cognos Connection.
The Sample Outdoors Company
The Sample Outdoors Company samples illustrate product features and technical
and business best practices.
You can also use them for experimenting with and sharing report design
techniques and for troubleshooting. As you use the samples, you can connect to
features in the product.
For examples related to different kinds of businesses, see the product blueprints at
http://publib.boulder.ibm.com/infocenter/cogic/v1r0m0/index.jsp. For
information about specific installation choices and environments, see the IBM
Cognos Business Intelligence Architecture and Deployment Guide, or the Proven
Practices and the IBM Cognos Implementation Roadmaps on http://
publib.boulder.ibm.com/infocenter/cogic/v1r0m0/index.jsp. For information about
audit samples, see the IBM Cognos Business Intelligence Administration and Security
Guide. For information about Mobile samples, see the IBM Cognos Mobile Installation
and Administration Guide.
The Sample Outdoors Company, or GO Sales, or any variation of the Sample
Outdoors name, is the name of a fictitious business operation whose sample data is
used to develop sample applications for IBM and IBM customers. Its fictitious
records include sample data for sales transactions, product distribution, finance,
and human resources. Any resemblance to actual names, addresses, contact
numbers, or transaction values, is coincidental. Unauthorized duplication is
prohibited.
Where to find the samples
The samples are included with the product and the samples for each studio are
described in the related user guide and online help. To use the samples, you must
install, set up, and configure them or contact your administrator to find out where
they are installed. For instructions on how to install the samples, see the IBM
Cognos Business Intelligence Installation and Configuration Guide. For instructions on
how to set up and configure samples, see the IBM Cognos Business Intelligence
Administration and Security Guide or the IBM Cognos Business Intelligence Installation
and Configuration Guide.
Samples outline
The samples consist of the following:
v Two databases that contain all corporate data, and the related sample models for
query and analysis
v Five samples cubes and the related models
v A metrics data source including associated metrics and a strategy map for the
consolidated company, and a model for Metric extracts.
v Reports, queries, query templates, and workspaces
© Copyright IBM Corp. 2010, 2012
105
To run interactive reports, scripts are required. To see all the reports included in
the samples packages, copy the files from the samples content installation into
deployment folder and then import the deployments into the IBM Cognos
Business Intelligence product.
Security
Samples are available to everyone. To implement security, see the IBM Cognos
Business Intelligence Installation and Configuration Guide.
Samples in the GO Data Warehouse (analysis) package
The following IBM Cognos Business Insight report is found in the GO Data
Warehouse (analysis) package.
Employee Satisfaction Workspace
This report shows different measures for employee satisfaction, such as investment
in training, employee survey results (by department and by topic, including a
comparison with the planned survey results), and a list of bonuses for employees,
sorted by country or region. The slider filter applies to the bonus list.
Samples in the GO Data Warehouse (query) package
The following IBM Cognos Business Insight workspaces are found in the GO Data
Warehouse (query) package.
Marketing workspace
This workspace shows the results of different promotional campaigns.
The select value filter for campaign name applies to the first two charts. The
product line select value filter applies to the advertising cost chart, and the year
slider filter applies to the advertising cost crosstab.
Recruiting workspace
This workspace shows the recruiting results (average number of days to fill
positions) for different indicators: by organization, department, branch, and year,
and detailed information about the success of different recruiting techniques.
Two select value filters control three of the widgets.
Revenue data workspace
This workspace shows the revenue by region, country or region, product type, and
order method.
The country or region and product type are controlled by a select value filter.
Sales By Year workspace
This workspace shows different sales indicators for a year range controlled by the
slider filter: profit margin, gross profit, product cost, quantity sold, revenue by
region, and a comparison between actual and planned revenue.
The slider filter controls all widgets.
106
IBM Cognos Express Version 10.1.0: Business Insight User Guide
Interactive samples
The following IBM Cognos Business Insight workspace is found in the Interactive
Samples folder.
Sales workspace
This workspace shows different aspects of sales: gross profit by month, region, and
product line, revenue by region, and the number of sales representatives that
contributed to the sales.
The source objects are based on the GO Data Warehouse (analysis) package and
the GO Data Warehouse (query) package. The Sales workspace is interactive: if you
move the mouse over any of the widgets, a pop-up window displays ideas about
how to improve the workspace.
Chapter 6. Samples
107
108
IBM Cognos Express Version 10.1.0: Business Insight User Guide
Appendix. Accessibility features
Accessibility features help users who have a physical disability, such as restricted
mobility or limited vision, to use information technology products successfully.
See the IBM Accessibility Center (http://www.ibm.com/able) for more information
about the commitment that IBM has to accessibility.
Accessibility features in IBM Cognos Business Insight
There are several accessibility features in IBM Cognos Business Insight.
The major accessibility features are described in the following list:
v You can use command keys, or shortcut keys, to navigate through Business
Insight. Shortcut keys directly trigger an action and usually make use of the Ctrl
keys. For example, to save a workspace, press Ctrl+S.
v Business Insight uses Web Accessibility Initiative—Accessible Rich Internet
Applications (WAI-ARIA). This means that people with limited vision can use
screen-reader software, along with a digital speech synthesizer, to listen to what
is displayed on the screen.
v Business Insight supports your system's display settings, such as high-contrast
display.
Note: To take full advantage of the accessible features of Business Insight, use
Mozilla Firefox version 3.6 and Freedom Scientific JAWS version 12.0.
Business Insight has the following accessibility features that you can use to fit your
individual needs:
v “Keyboard shortcuts”
v “Viewing a workspace in Microsoft Windows high contrast mode” on page 117
Keyboard shortcuts
A keyboard shortcut is an alternative way to invoke a command by pressing a
combination of keyboard keys.
IBM Cognos Business Insight uses both standard Microsoft Windows navigation
keys and application-specific keys.
The following tables list the keyboard shortcuts in IBM Cognos Business Insight
for each area of the user interface:
v
v
“General” on page 110
“Canvas” on page 112
v “Application bar” on page 113
v “Content pane” on page 114
v “Collaboration pane” on page 116
v “Lineage tool” on page 116
© Copyright IBM Corp. 2010, 2012
109
General
Applies to
Description
Keyboard shortcut
General
Perform the default action
for an active command
button.
Enter or Spacebar
General
Go to the first item or object. Ctrl+Home
General
Go to the last item or object.
Ctrl+End
Screen area
Move forward through the
open panes.
F6
Screen area
Move backward through the
open panes.
Shift+F6
Screen area
Move to a successively
higher toolbar, eventually
ending on the first item in
the top toolbar. For example,
you move from the widget,
to the widget toolbar, and
then to the application bar.
F10
General controls
Move forward to the next
control at the same level.
Tab
General controls
Move backward to the
previous control at the same
level.
Shift+Tab
Check boxes
Spacebar
Toggle a check box from
selected to cleared or cleared
to selected.
Tip: This shortcut also
applies to other settings that
can have an on or off state
(for example, information
card control).
Radio buttons
Move to the next radio
button and select it.
Right arrow
Move to the previous radio
button and select it.
Up arrow
Drop-down lists
Open and display the
drop-down list contents.
Alt+Down arrow
Drop-down lists
Close an open drop-down
list.
Alt+Up arrow
Radio buttons
110
IBM Cognos Express Version 10.1.0: Business Insight User Guide
Down arrow
Left arrow
Applies to
Description
Keyboard shortcut
Tree controls
Move to the first selectable
node below, or, if the node
below has child nodes and
the node is expanded, move
to the first child node.
Down arrow
Tree controls
Move to the first selectable
node above.
Up arrow
Tree controls
Expand the selected node or
move to the first selectable
child node.
Right arrow
Collapse the selected node,
move to the parent node, or
move to the first selectable
node above.
Left arrow
Tree controls
Move to the first node in a
tree control.
Home
Tree controls
Move to the last node in a
tree control.
End
Menus
Move to and select the next
available menu item.
Down arrow
Menus
Move to and select the
previous available menu
item.
Up arrow
Menus
Expand the child menu items Right arrow
and select the first available
child menu item.
Menus
Collapse the child menu
items.
Left arrow
Context menus
Open the context menu for
the selected item.
Shift+F10
Context menus
Close an open context menu. Esc
Scrolling
Scroll down.
Tree controls
or + (plus sign)
or - (minus sign)
Down arrow
Page down
Scrolling
Scroll up.
Up arrow
Page up
Appendix. Accessibility features
111
Canvas
112
Applies to
Description
Keyboard shortcut
Widget navigation
Move forward to the next
widget on the same level
within the canvas.
Tab
Widget navigation
Move backward to the
Shift+Tab
previous widget on the same
level within the canvas.
Widget navigation
Move to the first widget on
the same level within the
canvas.
Ctrl+Home
Widget navigation
Move to the last widget on
the same level within the
canvas.
Ctrl+End
Widget interaction
Move to the first report
element at the child level of
the current widget.
F12
Widget interaction
Move to the parent level of
the current widget.
Shift+F12
Within-widget navigation
Move forward to the next
Tab
report element in the widget.
Within-widget navigation
Move backward to the
previous report element in
the widget.
Shift+Tab
Within-widget navigation
Open the context menu for
the selected cell.
Shift+F10
Within-widget navigation
Move the focus to a
comment indicator (if
available).
Ctrl+Alt+'
Within-widget comment
navigation
Move the focus to the next
comment in the widget.
Tab
Within-widget comment
navigation
Move the focus to the
previous comment in the
widget.
Shift+Tab
Within-widget comment
navigation
Open the current comment
to get more information.
Enter or Space
Within-widget comment
navigation
Return the focus to the cell
that had focus before the
focus was moved to a
comment indicator.
Esc
IBM Cognos Express Version 10.1.0: Business Insight User Guide
Applies to
Description
Keyboard shortcut
Widget actions button
Move to the widget actions
button for the selected
widget.
F10
Tip: Pressing Esc returns to
the selected widget.
Widget properties
Open the properties for a
selected widget or object.
Alt+Enter
Widget modes
Activate the move mode for
the selected widget.
Ctrl+Shift+M
Widget modes
Move a widget.
Arrow keys
Use arrow keys to move the
widget (up, down, left, and
right); Ctrl+Arrow keys can
move the widget in larger
increments.
Ctrl+Arrow keys
Widget modes
Activate the resize mode for
the selected widget.
Ctrl+Shift+R
Widget modes
Resize a widget by moving
the bottom right corner of
the widget.
Arrow keys
Leave the move or resize
mode.
Enter
Applies to
Description
Keyboard shortcut
Application bar
Create a new workspace.
Ctrl+N
Application bar
Open a workspace.
Ctrl+O
Application bar
Save a workspace.
Ctrl+S
Application bar
Save a workspace as a new
workspace.
Ctrl+Shift+S
Application bar
Open the help
documentation.
F1
Application bar
Move forward to the next
Tab
control in the application bar.
Widget modes
Ctrl+Arrow keys
Esc
Application bar
Appendix. Accessibility features
113
Applies to
Description
Keyboard shortcut
Application bar
Move backward to the
previous control in the
application bar.
Shift+Tab
Application bar
Move forward through the
application bar controls.
Right arrow
Application bar
Move backward through the
application bar controls.
Left arrow
Applies to
Description
Keyboard shortcut
Navigation
Move to the search field.
Ctrl+F
If it is not already open, the
Content pane will display
the search results.
F3
Navigation
Close the Content pane and
return to the canvas.
Ctrl+F4
Toolbar
Move to the first item in the
toolbar within the Content
pane.
F10
Toolbar
Move forward through the
toolbar controls.
Tab
Toolbar
Move backward through the
toolbar controls.
Shift+Tab
Toolbar
Move forward through the
views and select a view.
Right arrow
Move backward through the
views and select a view.
Left arrow
Insert
Insert the selected item into
the canvas.
Ctrl+Shift+Enter
Paging
Move to the page controls.
Tab
Content pane
Toolbar
Down arrow
Up arrow
Shift+Tab
Paging
Go to the first page of the
Content tab.
Home
Ctrl+Shift+Page up
Ctrl+Shift+Up arrow
114
IBM Cognos Express Version 10.1.0: Business Insight User Guide
Applies to
Description
Keyboard shortcut
Paging
Go to the last page of the
Content tab.
End
Ctrl+Shift+Page down
Ctrl+Shift+Down arrow
Paging
Go to the next page in the
Content tab.
Right arrow
Go to the previous page in
the Content tab.
Left arrow
Content pane
Open or close the Content
pane.
Ctrl+Shift+B
Content pane tabs
Move forward through the
Content pane tabs.
Ctrl+Tab
Paging
Ctrl+Page down
Ctrl+Page up
This keyboard shortcut does
not work with Microsoft
Internet Explorer.
Content pane tabs
Move backward through the
Content pane tabs.
Shift+Ctrl+Tab
This keyboard shortcut does
not work with Microsoft
Internet Explorer.
Information card
Display the information card
as part of keyboard
navigation of the content
tree.
Shift+Alt+F9
Information card
Move focus to the first field
in the information card.
Shift+Alt+F9 (in combination
with the first Shift+Alt+F9
sequence)
Information card
Move forward and backward Tab
through the Information card
Shift+Tab
fields.
Information card
Enter
Follow a hyperlink in a
information card field. The
information card closes when
the link is accessed.
Information card
Close the information card
and return focus to the
Content tab.
Esc
Appendix. Accessibility features
115
Collaboration pane
Applies to
Description
Keyboard shortcut
Collaboration pane
Open or close the
Collaboration pane.
Ctrl+Shift+C
Collaboration pane
Move to the first item in the
toolbar within the
Collaboration pane.
F10
Activity list
Move up to the previous
activity.
Up Arrow
Activity list
Move down to the next
activity.
Down Arrow
Activity list
Select the first activity in the
list.
Home
Activity list
Select the last activity title in
the list.
End
Activity
Move forward to the next
item shown in the activity.
Tab
Activity
Move backward to the
previous item shown in the
activity.
Shift+Tab
Applies to
Description
Keyboard shortcut
View
Move focus to the next tab.
Tab
View
Move focus to the previous
tab.
Shift + Tab
Screen area
Scroll the window contents
up.
Up arrow
Screen area
Scroll the window contents
down.
Down arrow
Screen area
Scroll the window contents
to the left.
Left arrow
Screen area
Scroll the window contents
to the right.
Right arrow
Node navigation
Move the focus to the node
on the left of the current
node.
Ctrl+Left
Lineage tool
116
IBM Cognos Express Version 10.1.0: Business Insight User Guide
Applies to
Description
Keyboard shortcut
Node navigation
Move the focus to the node
on the right of the current
node.
Ctrl+Right
Node navigation
Move the focus to the node
above the current node.
Ctrl+Up
Node navigation
Move the focus to the node
below the current node.
Ctrl+Down
Node navigation
Move the focus to the
previous item within the
current node.
Alt+Up
Node navigation
Move the focus to the next
Alt+Down
item within the current node.
Viewing a workspace in Microsoft Windows high contrast mode
Microsoft Windows users with low vision can make IBM Cognos Business Insight
easier to view by enabling high contrast mode.
For more information, see the documentation for your operating system.
Appendix. Accessibility features
117
118
IBM Cognos Express Version 10.1.0: Business Insight User Guide
Notices
This information was developed for products and services offered worldwide.
IBM may not offer the products, services, or features discussed in this document in
other countries. Consult your local IBM representative for information on the
products and services currently available in your area. Any reference to an IBM
product, program, or service is not intended to state or imply that only that IBM
product, program, or service may be used. Any functionally equivalent product,
program, or service that does not infringe any IBM intellectual property right may
be used instead. However, it is the user's responsibility to evaluate and verify the
operation of any non-IBM product, program, or service. This document may
describe products, services, or features that are not included in the Program or
license entitlement that you have purchased.
IBM may have patents or pending patent applications covering subject matter
described in this document. The furnishing of this document does not grant you
any license to these patents. You can send license inquiries, in writing, to:
IBM Director of Licensing
IBM Corporation
North Castle Drive
Armonk, NY 10504-1785
U.S.A.
For license inquiries regarding double-byte (DBCS) information, contact the IBM
Intellectual Property Department in your country or send inquiries, in writing, to:
Intellectual Property Licensing
Legal and Intellectual Property Law
IBM Japan Ltd.
1623-14, Shimotsuruma, Yamato-shi
Kanagawa 242-8502 Japan
The following paragraph does not apply to the United Kingdom or any other
country where such provisions are inconsistent with local law: INTERNATIONAL
BUSINESS MACHINES CORPORATION PROVIDES THIS PUBLICATION "AS IS"
WITHOUT WARRANTY OF ANY KIND, EITHER EXPRESS OR IMPLIED,
INCLUDING, BUT NOT LIMITED TO, THE IMPLIED WARRANTIES OF
NON-INFRINGEMENT, MERCHANTABILITY OR FITNESS FOR A PARTICULAR
PURPOSE. Some states do not allow disclaimer of express or implied warranties in
certain transactions, therefore, this statement may not apply to you.
This information could include technical inaccuracies or typographical errors.
Changes are periodically made to the information herein; these changes will be
incorporated in new editions of the publication. IBM may make improvements
and/or changes in the product(s) and/or the program(s) described in this
publication at any time without notice.
Any references in this information to non-IBM Web sites are provided for
convenience only and do not in any manner serve as an endorsement of those Web
sites. The materials at those Web sites are not part of the materials for this IBM
product and use of those Web sites is at your own risk.
© Copyright IBM Corp. 2010, 2012
119
IBM may use or distribute any of the information you supply in any way it
believes appropriate without incurring any obligation to you.
Licensees of this program who wish to have information about it for the purpose
of enabling: (i) the exchange of information between independently created
programs and other programs (including this one) and (ii) the mutual use of the
information which has been exchanged, should contact:
IBM Software Group
Attention: Licensing
3755 Riverside Dr
Ottawa, ON K1V 1B7
Canada
Such information may be available, subject to appropriate terms and conditions,
including in some cases, payment of a fee.
The licensed program described in this document and all licensed material
available for it are provided by IBM under terms of the IBM Customer Agreement,
IBM International Program License Agreement or any equivalent agreement
between us.
Any performance data contained herein was determined in a controlled
environment. Therefore, the results obtained in other operating environments may
vary significantly. Some measurements may have been made on development-level
systems and there is no guarantee that these measurements will be the same on
generally available systems. Furthermore, some measurements may have been
estimated through extrapolation. Actual results may vary. Users of this document
should verify the applicable data for their specific environment.
Information concerning non-IBM products was obtained from the suppliers of
those products, their published announcements or other publicly available sources.
IBM has not tested those products and cannot confirm the accuracy of
performance, compatibility or any other claims related to non-IBM products.
Questions on the capabilities of non-IBM products should be addressed to the
suppliers of those products.
All statements regarding IBM's future direction or intent are subject to change or
withdrawal without notice, and represent goals and objectives only.
This information contains examples of data and reports used in daily business
operations. To illustrate them as completely as possible, the examples include the
names of individuals, companies, brands, and products. All of these names are
fictitious and any similarity to the names and addresses used by an actual business
enterprise is entirely coincidental.
If you are viewing this information softcopy, the photographs and color
illustrations may not appear.
120
IBM Cognos Express Version 10.1.0: Business Insight User Guide
Trademarks
IBM, the IBM logo, ibm.com, PowerPlay, TM1, Express, and Cognos are trademarks
or registered trademarks of International Business Machines Corp., registered in
many jurisdictions worldwide. Other product and service names might be
trademarks of IBM or other companies. A current list of IBM trademarks is
available on the Web at “ Copyright and trademark information ” at
www.ibm.com/legal/copytrade.shtml.
The following terms are trademarks or registered trademarks of other companies:
v Adobe, the Adobe logo, PostScript, and the PostScript logo are either registered
trademarks or trademarks of Adobe Systems Incorporated in the United States,
and/or other countries.
v Microsoft, Windows, Windows NT, and the Windows logo are trademarks of
Microsoft Corporation in the United States, other countries, or both.
Notices
121
122
IBM Cognos Express Version 10.1.0: Business Insight User Guide
Glossary
PDF and HTML reports and metrics.
Application tier components also pass
requests to Content Manager and render
the results that Content Manager retrieves
from the content store.
This glossary includes terms and definitions for
IBM Cognos Business Intelligence.
The following cross-references are used in this
glossary:
v See refers you from a term to a preferred
synonym, or from an acronym or abbreviation
to the defined full form.
v See also refers you to a related or contrasting
term.
To view glossaries for other IBM products, go to
www.ibm.com/software/globalization/
terminology.
“A” “B” “C” “D” on page 124 “E” on page 125
“F” on page 125 “G” on page 125 “H” on page
126 “I” on page 126 “J” on page 126 “L” on page
126 “M” on page 126 “N” on page 127 “O” on
page 127 “P” on page 127 “Q” on page 128 “R”
on page 128 “S” on page 128 “T” on page 129
“U” on page 129 “W” on page 129
attribute
In BI Modeling, a characteristic of an
entity which is descriptive rather than a
unique identifier or an aggregative
measure.
authentication
The process of validating the identity of a
user or server.
authentication provider
The communication mechanism to an
external authentication source.
Functionalities, such as user
authentication, group membership, and
namespace searches, are made available
through authentication providers.
B
A
burst
access permission
A privilege that permits the access or use
of an object.
accountability scorecard
A scorecard that Metric Studio
automatically builds for each user which
contains the metrics and projects they
own.
agent
alias
A process that performs an action on
behalf of a user or other program without
user intervention or on a regular
schedule, and reports the results back to
the user or program.
An alternative name used instead of a
primary name.
anonymous access
A type of access that allows users and
servers to access a server without first
authenticating with it.
application tier component
For installation, the set of processors that
access the query databases to gather
information and then render the results as
© Copyright IBM Corp. 2010, 2012
To create several report results by running
a single report once. For example, the
user can create a report that shows sales
for each employee, and run it once,
sending different results to regional
managers by bursting on region.
burst key
The dimension or level of a query in the
report specification that is used to create,
or burst, a set of report results.
C
CA
See certificate authority.
calculated member
A member of a dimension whose measure
values are not stored but are calculated at
run time using an expression.
canvas
An area within a dashboard or workspace
that users interact with to create, view,
and manipulate content and data.
capability
A group of functions and features that
123
can be hidden or revealed to simplify the
user interface. Capabilities can be enabled
or disabled by changing preference
settings, or they can be controlled through
an administration interface.
expressed in natural language text, in
mathematically formal notation, or in a
machine-readable language.
constraint
1. A security specification that denies one
or more users the ability to access a
model component or to perform a
modeling or authoring task.
cardinality
1. For relational data sources, a numerical
indication of the relationship between two
query subjects, query items, or other
model objects.
2. For OLAP data sources, the number of
members in a hierarchy. The cardinality
property for a hierarchy is used to assign
solve orders to expressions.
cascading prompt
A prompt that uses values from a
previous prompt to filter the values in the
current prompt or pick list.
certificate
In computer security, a digital document
that binds a public key to the identity of
the certificate owner, thereby enabling the
certificate owner to be authenticated. A
certificate is issued by a certificate
authority and is digitally signed by that
authority. See also certificate authority.
certificate authority (CA)
A component that issues certificates to
each computer on which components are
installed.
CGI
See Common Gateway Interface.
cipher suite
The combination of authentication, key
exchange algorithm, and the Secure
Sockets Layer (SSL) cipher specification
used for the secure exchange of data.
class style
A combination of formatting
characteristics, such as font, font size, and
border, that the user names and stores as
a set.
CM
See Content Manager.
Common Gateway Interface (CGI)
An Internet standard for defining scripts
that pass information from a web server
to an application program, through an
HTTP request, and vice versa.
condition
An expression that can be evaluated as
true, false, or unknown. It can be
124
2. A restriction on the possible values that
users can enter in a field.
contact
A named e-mail address to which reports
and agent e-mails can be sent. Contacts
are never authenticated.
content locale
A code that is used to set the language or
dialect used for browsers and report text,
and the regional preferences, such as
formats for time, date, money, money
expressions, and time of day.
Content Manager (CM)
The service that retrieves information
from the content store, and saves
information to the content store.
content store
The database that contains the data
needed to operate, such as report
specifications, published models, and
security rights.
credential
A set of information that grants a user or
process certain access rights.
cube
A multidimensional representation of data
needed for online analytical processing,
multidimensional reporting, or
multidimensional planning applications.
custom set
In Analysis Studio, a named object which
can include filter rules, calculations, and
sort rules. Custom sets can define a set of
members that is different from any set
originally defined in the cube model. See
also predefined set, set.
D
dashboard
A web page that can contain one or more
widgets that graphically represent
business data.
IBM Cognos Express Version 10.1.0: Business Insight User Guide
data source
The source of data itself, such as a
database or XML file, and the connection
information necessary for accessing the
data.
data source connection
The named information that defines the
type of data source, its physical location,
and any sign-on requirements. A data
source can have more than one
connection.
data tree
Within a studio, a structure that contains
objects such as query subjects, query
items, dimensions, levels, and members.
A data tree is used as a palette of the
available data that can be inserted into
calculations, filters, display areas, and
other authoring gestures.
deployment
The process of moving an application
(such as a report or model) to a different
instance. For example, reports are often
created in a test environment and then
deployed to production. When an
application is deployed, it is exported,
transferred, and imported.
deployment archive
A file used for deployment. A deployment
archive contains the data from the content
store that is being moved.
deployment specification
A definition of what packages to move
(deploy) between source and target
environments, the deployment
preferences, and the archive name.
Deployment specifications are used for
import and export.
derived index
A calculated metric that provides a status
and a score based on other metrics.
details-based set
A set based on an item and its immediate
details. See also set.
dimension
In Cognos BI and TM1, a broad grouping
of descriptive data about a major aspect
of a business, such as products, dates, or
locations. Each dimension includes
different levels of members in one or
more hierarchies and an optional set of
calculated members or special categories.
dimensional data source
A data source containing data modeled
using OLAP concepts, including
dimensions, hierarchies, and measures.
drill down
In a multidimensional representation of
data, to access information by starting
with a general category and moving
downwards through the hierarchy of
information, for example from Years to
Quarters to Months.
E
event
A change to a state, such as the
completion or failure of an operation,
business process, or human task, that can
trigger a subsequent action, such as
persisting the event data to a data
repository or invoking another business
process.
event key
A combination of data items that uniquely
defines an event instance. Identifying an
event instance enables the agent to
determine if it is new, ongoing or
stopped.
event list
The set of detected event instances
evaluated by the task execution rules to
determine which agent tasks should be
performed.
F
fact
See measure.
G
gateway
An extension of a web server program
that transfers information from the web
server to another server. Gateways are
often CGI programs, but may follow other
standards such as ISAPI and Apache
modules.
glyph The actual shape (bit pattern, outline) of a
character image. For example, italic A and
roman A are two different glyphs
representing the same underlying
character. Strictly speaking, any two
images which differ in shape constitute
different glyphs. In this usage, glyph is a
Glossary
125
synonym for character image, or simply
image (The Unicode Standard – Version
1.0).
group A collection of users who can share access
authorities for protected resources.
grouping
In reporting, the process of organizing
common values of query items together
and only displaying the value once.
H
hierarchy
The organization of a set of entities into a
tree structure, with each entity (except the
root) having one or more parent entities
and an arbitrary number of child entities.
I
information card
A display of high-level information about
dashboard, workspace, or report content,
such as owner, contact information, date
modified, and an optional thumbnail view
of the dashboard, workspace, or report.
information pane
In Analysis Studio, a pane that helps the
user to confirm their selection in the data
tree by displaying related information,
such as the level and attributes.
initiative
A task developed to achieve objectives or
close the gap between performance and
targets. Initiatives are associated with
individual objectives and often known as
projects, actions, or activities.
item
See member.
J
job
A group of runnable objects, such as
reports, agents, and other jobs that the
user runs and schedules as a batch.
job step
The smallest part of a job that can be run
separately. A job step can be a report or it
can be another job.
L
layout The arrangement of printed matter on a
screen or page, including margins, line
spacing, type specification, header and
footer information, indents, and more.
level
A set of entities or members that form
one section of a hierarchy in a dimension
and represent the same type of object. For
example, a geographical dimension might
contain levels for region, state, and city.
locale A setting that identifies language or
geography and determines formatting
conventions such as collation, case
conversion, character classification, the
language of messages, date and time
representation, and numeric
representation.
M
MDX
See Multidimensional Expression
Language.
measure
A performance indicator that is
quantifiable and used to determine how
well a business is operating. For example,
measures can be Revenue,
Revenue/Employee, and Profit Margin
percent.
member
A unique item within a hierarchy. For
example, Camping Equipment and 4 Man
tent are members of the Products
hierarchy.
metric A measure to assess performance in a key
area of a business.
metric extract
A set of mappings between an existing
Cognos data source and a Metric Studio
object or value. For example, a cube
measure named Revenue is mapped to a
Metric Studio metric named Revenue
Actual Value.
metric package
In Cognos Connection, a representation of
a Metric Studio application. A metric
package contains connection information,
reports, and metric management tasks for
that application. See also package.
metric store
A database that contains content for
126
IBM Cognos Express Version 10.1.0: Business Insight User Guide
metric packages. A metric store also
contains Metric Studio settings, such as
user preferences.
metric type
A category of metrics that defines the
business rules such as performance
pattern, units, and meaning of a group of
metrics. For example, Revenue can be a
metric type, and European Revenue and
North American Revenue would be
metrics of this type.
model A physical or business representation of
the structure of the data from one or more
data sources. A model describes data
objects, structure, and grouping, as well
as relationships and security. In Cognos
BI, a model is created and maintained in
Framework Manager. The model or a
subset of the model must be published to
the Cognos server as a package for users
to create and run reports.
multidimensional data source
See dimensional data source.
Multidimensional Expression Language (MDX)
The multidimensional equivalent of
Structured Query Language (SQL).
object extract
An extract that defines the metadata for a
Metric Studio object, such as a user
defined column, a scorecard, or a data
source.
P
package
A subset of a model, which can be the
whole model, to be made available to the
Cognos server. See also metric package.
page set
In Report Studio, a set of one or more
designed pages which repeat in the report
output for each instance of a chosen
query item. See also set.
passport
Session-based information, stored and
encrypted in Content Manager memory,
regarding authenticated users. A passport
is created the first time a user accesses
Cognos 8, and it is retained until a
session ends, either when the user logs off
or after a specified period of inactivity.
portlet
A reusable component that is part of a
web application that provides specific
information or services to be presented in
the context of a portal.
N
named set
See predefined set.
namespace
A part of the model in which the names
may be defined and used. Within a
namespace, each name has a unique
meaning.
news item
A single entry in a Really Simple
Syndication (RSS) compatible format. It
can include a headline, text, and a link to
more information. A news item task in an
agent can be used to create news items
for display in a Cognos Connection
portlet.
O
object In Report Studio, an empty information
container that can be dragged to a report
from the Toolbox tab and then filled with
data. Reports are made up of objects,
which include crosstabs, text items,
calculations, graphics, and tables.
predefined set
A set of members defined inside an OLAP
data source as a list or by an expression.
Predefined sets can be used in analysis
and report authoring. See also custom set,
set.
product locale
The code or setting that specifies which
language, regional settings, or both to use
for parts of the product interface, such as
menu commands.
project
1. In Metric Studio, a task or set of tasks
undertaken by a team and monitored on a
scorecard. A project tracks dates,
resources, and status.
2. In Metric Designer, a group of extracts.
Each extract contains the metadata that is
used to populate the Metric Studio data
store or to create applications.
Glossary
127
repeats values within itself with no
predefined internal structure.
prompt
A report element that asks for parameter
values before the report is run.
properties pane
Within a studio, a pane that provides an
overview of the properties for selected
data. The properties pane can also be
used to make several changes and apply
them at the same time, instead of
repeating several different commands.
publish
In Cognos BI, to expose all or part of a
Framework Manager model or
Transformer PowerCube, through a
package, to the Cognos server, so that the
data can be used to create reports and
other content.
Q
query The simple report specifications created
and edited by Query Studio.
query item
A representation of a column of data in a
data source. Query items may appear in a
model or in a report and contain a
reference to a database column, a
reference to another query item, or a
calculation.
query subject
A named collection of query items that
are closely functionally related. Query
subjects are defined using Framework
Manager to represent relational data and
form the set of available data for
authoring reports in Query Studio and
Report Studio. A query subject is similar
to a relational view in that it can be
treated as a table but does not necessarily
reflect the data storage.
repeater table
In Report Studio, a table-like container
that repeats cells across and down the
page or row in the associated query.
report A set of data deliberately laid out to
communicate business information.
report output
The output produced as a result of
executing a report specification against a
data set.
report specification
An executable definition of a report,
including query and layout rules, which
can be combined with data to produce a
report output.
report view
A reference to another report that has its
own properties, such as prompt values,
schedules, and results. Report views can
be used to share a report specification
instead of making copies of it.
response file
An ASCII file that can be customized with
the setup and configuration data that
automates an installation. The setup and
configuration data would have to be
entered during an interactive install, but
with a response file, the installation can
proceed without any intervention.
Rich Site Summary (RSS)
An XML-based format for syndicated web
content that is based on the RSS 0.91
specification. The RSS XML file formats
are used by Internet users to subscribe to
websites that have provided RSS feeds.
See also Really Simple Syndication.
RSS
R
1. See Really Simple Syndication.
Really Simple Syndication (RSS)
An XML file format for syndicated Web
content that is based on the Really Simple
Syndication specification (RSS 2.0). The
RSS XML file formats are used by Internet
users to subscribe to websites that have
provided RSS feeds. See also Rich Site
Summary.
2. See Rich Site Summary.
repeater
In Report Studio, a cell container that
128
S
score
A number or ranking that expresses
applicability in relation to a standard.
scorecard
A collection of metrics representing the
performance of one unit or aspect of an
organization.
IBM Cognos Express Version 10.1.0: Business Insight User Guide
scorecard structure
The hierarchy of scorecards that reflects
how an enterprise organizes its metrics.
security provider
See authentication provider.
selection-based set
A collection of individual items that the
user has explicitly selected. The items or
members may be selected from one or
more levels of the same hierarchy. See
also set.
session
The time during which an authenticated
user is logged on.
set
A collection of related items or members.
Members in a set may be specifically
chosen, or selected by one or more filter
rules. See also custom set, details-based
set, page set, predefined set,
selection-based set, stacked set.
stacked set
Two or more sets arranged one above
another in rows or side-by-side in
columns. See also set.
strategy
The overall plan of action (such as for a
brand unit, business unit, channel, or
company) to achieve a stated goal.
Strategies normally cover a period of
more than one year.
strategy map
In Metric Studio, a visual representation
of the strategy and the objectives of that
strategy for an organization. For example,
a strategy map may show employees how
their jobs are aligned to the overall
objectives of the organization.
summary
In reporting and analysis, an aggregate
value that is calculated for all the values
of a particular level or dimension.
Examples of summaries include total,
minimum, maximum, average, and count.
T
task
An action performed by an agent if the
event status meets the task execution
rules. For example, an agent can send an
e-mail, publish a news item, or run a
report.
task execution rule
A user-specified option within an agent
that determines which statuses and values
cause a task to be run. It determines
which tasks to execute for each event
instance.
template
In report authoring, a reusable report
layout or style that can be used to set the
presentation of a query or report.
thumbnail
An icon-sized rendering of a larger
graphic image that permits a user to
preview the image without opening a
view or graphical editor.
tuple
An ordered collection of two or more
members from different dimensions. For
example, the tuple (2007, Camping
Equipment, Japan) returns the value for
the intersection of the three members:
2007, Camping Equipment, and Japan.
Tuples can be used to filter and sort data,
and to create calculations.
U
union set
See stacked set.
user
Any individual, organization, process,
device, program, protocol, or system that
uses the services of a computing system.
user-defined column
In metric management, a column used to
represent a value other than the actual or
target. It may be an industry benchmark
or any other useful additional numerical
information for a period, including a
calculation based on the other values of
the metric. User-defined columns may be
different for each metric type.
W
watch list
A list of metrics that each user has chosen
to monitor closely. If notification is
enabled in Metric Studio, the user will
receive e-mail notification of changes to
these metrics. Users can also choose to
display their watch list as a portlet within
Cognos Connection.
watch rule
A user-defined condition that determines
Glossary
129
whether a report is delivered to the user.
When the rule is run, the output is
evaluated and, if it satisfies the condition
or rule, the report is delivered by e-mail
or news item. Watch rules limit report
delivery to those reports containing data
of significance to the user.
Web Services for Remote Portlets
A standard for creating
presentation-oriented web services so that
they can be easily integrated within other
applications, such as web portals.
widget
A portable, reusable application or piece
of dynamic content that can be placed
into a Web page, receive input, and
communicate with an application or with
another widget.
work area
The area within a studio that contains the
report, analysis, query, or agent currently
being used.
workspace
See dashboard.
130
IBM Cognos Express Version 10.1.0: Business Insight User Guide
Index
A
access
changing for an activity 97
enabling drill-through access 84
accessibility features 109
enabling for reports 53, 83
high contrast modes 117
keyboard shortcuts 109
workspaces 53
actions 12
Active Report content
adding to workspaces 26
activities
adding comments to 100
adding entries to 98
adding members to 97
adding sections to 98
adding to-do items to 99
changing the access for 97
creating templates from 101
IBM Connections 94
marking as complete 101
marking to-do items as complete 100
opening 102
overview 94
searching for 33
starting on the workspace 95
tuning in and out 102
viewing 103
working with in IBM Connections 97
adding
comments 92
TM1 content 28
alerts
watch rules 87
application bar 8
authentication
users 6
B
backgrounds
changing 49
browser
borders 5
chrome 5
limitation 5
Business Insight Advanced
charts (continued)
filtering 66
formats 66
sorting 66, 71
supported types 63
chrome
browser 5
collaboration
activities 94
capabilities 91
comments 91
IBM Connections 103
colors
changing in charts 66
columns
renaming in lists 78
reordering in lists 77
swapping with rows 67
comments
adding 92
adding to an activity 100
editing 93
overview 91
responding to 93
searching for 33
viewing 93
communications
between widgets 46
conditions
watch rules 85
content pane 9
creating
workspace 21
credentials 6
crosstabs
adding to workspaces 23
changing display types 63
sorting 70
CSV format
exporting widgets 81
cube views 28
D
22
C
calculations 75
advanced 22
canvas
keyboard shortcuts 112
charts
adding to workspaces 23
changing color palettes 66
changing display types 63
configurations 65
© Copyright IBM Corp. 2010, 2012
data
grouping in lists 77
dates
workspace modifications
difference calculations 75
division calculations 75
drilling through 84
drilling up or down 83
89
E
editing
comments 93
emailing
workspaces 63
131
entries
adding to an activity
exporting
widgets 81
lists (continued)
renaming columns 78
reordering columns 77
sorting 70
locales 55
logging off 6
logging on 6
98
F
favorites
adding 78
filtering
advanced 22
charts 66
displaying values in the information bar
report data 67
select value filters 69
slider filters 69
filters
multilingual 57
M
members
adding to an activity 97
Metric Studio
adding content to workspaces
metrics
adding to workspaces 24
Microsoft Excel format
exporting widgets 81
multilingual workspaces 55
multiplication calculations 75
My Favorites 78
My Folders 9
My Inbox widgets 36
72
G
Getting Started page 7
glossaries
accessing the IBM WebSphere Business Glossary
glossary 123
go to
drilling through 84
grouping
data in lists 77
H
home page
resetting to default
setting 14
14
I
IBM Cognos 8 Go! Dashboard
upgrading 14
IBM Cognos Navigator widgets 11, 30
IBM Cognos TM1 Contributor 28
IBM WebSphere Business Glossary 90
image widgets 35
multilingual 56
information bar
expanding 72
filters 73
sorts 73
information cards 89
information icons in widgets 74
interactive modes 61
L
languages 55
setting 53
layouts
widgets 10
workspaces 8, 48
lineage information 88
lists
adding to workspaces 23
changing display types 63
grouping data 77
132
24
90
N
new features
1, 14
O
opening
activities 102
Business Insight 5
favorite workspaces or reports
workspaces 61
owners
workspaces 89
78
P
PDF format
creating 80
exporting widgets 81
percentage calculations 75
PowerPlay content
adding to workspaces 27
PowerPlay widgets 11
printing
report widgets to PDF format
workspaces 80
prompts 22
changing values 74
multilingual 57, 59
properties
report widgets 25
toolbox widgets 34
Public Folders 9
R
refreshing
workspaces 62
renaming columns in lists 78
reordering columns in lists 77
report output versions 22
IBM Cognos Express Version 10.1.0: Business Insight User Guide
80
report outputs
Microsoft Excel 2007 3
report parts
adding to workspaces 21
report specifications
viewing 25
report widgets 11
filtering 67
properties 25
reports
accessibility 83
adding to workspaces 21
advanced editing 22
drilling through 84
drilling up or down 83
getting new versions 74
multilingual 59
prompts 22
setting properties 25
resetting
home page 14
report content 74
responding to
comments 93
rows
swapping with columns 67
rows per page
specifying maximum 25
RSS feed widgets 37
RSS feeds
multilingual 56
S
Sample Outdoors Company
samples 105
samples 105
IBM Cognos 105
saving
workspaces 44
scorecards
adding to workspaces 24
search types
Connections 32
create and explore 32
IBM Cognos 32
related results 32
suggested results 32
searching 32
performing 32
refining results 34
sections
adding to an activity 98
select value filter widgets 39
communications 46
select value filters 69
multilingual 57
selecting widget events 46
setting
home page 14
report properties 25
sizing
widgets 48
slider filter widgets 41
communications 46
slider filters 69
adding 41
slider filters (continued)
multilingual 57
sorting
advanced 22
charts 66, 71
crosstabs 70
displaying values in the information bar
lists 70
removing 72
report data 69
starting
activities 95
status indicators
watch rules 86
styles
workspaces 49
sum calculations 75
summaries
advanced 22
72
T
tables
adding to workspaces 23
targets
drilling through 84
templates
saving an activity as 101
text widgets 43
multilingual 56
time zones
setting 53
titles
adding to widgets 25, 45
multilingual 56
TM1 widgets 30
TM1 content
adding to workspaces 28
TM1 widgets 11
adding TM1 Websheet Viewer objects
titles 30
viewing TM1 Contributor 29
to-do items
adding to an activity 99
marking as complete 100
overview 99
toolbox widgets 11
tools
adding to workspaces 34
tuning
activities 102
29
U
upgrading
IBM Cognos 8 Go! Dashboard
interaction changes 18
limitations 17
URLs
sending workspace links 63
users
anonymous logon 6
14
Index
133
V
versions
reports 74, 85
viewing
activities 103
comments 93
workspaces 61
W
watch rules
alert details 87
creating for different condition status indicators
creating for specific conditions 85
modifying 87
web page widgets 44
Web page widgets
multilingual 56
websheets 28
WebSphere Business Glossary 90
widget communication
disable 46
widget events
listening 46
widgets 10
Active Report 26
adding content 21
adding from the toolbox 34
adding titles 25
communications 46
exporting 81
IBM Cognos Navigator 30
images 35
layouts 8
134
86
widgets (continued)
My Inbox 36
PowerPlay 27
printing to PDF format 80
properties 45
RSS feeds 37
select value filters 39
sizing 48
slider filters 41
text 43
TM1 28
web pages 44
workspaces 8
accessibility 53
content pane 9
creating 21
favorites 78
IBM Cognos samples 105
layouts 48
opening 61
printing 80
saving 44
sharing 63
styles 49
upgrading from IBM Cognos 8
user interface 7
viewing 61
widgets 10
X
XML format
exporting widgets
IBM Cognos Express Version 10.1.0: Business Insight User Guide
81
14