1
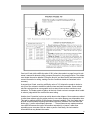
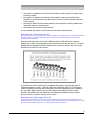
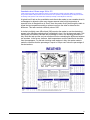
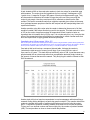
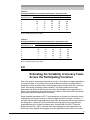
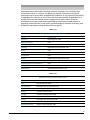
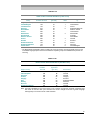
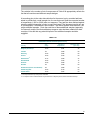
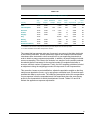
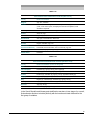
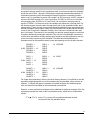
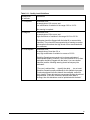
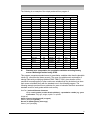
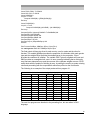
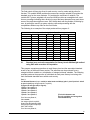
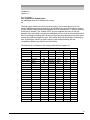
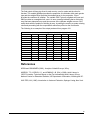
The mean deviation among the RP80s was 4.7, with a standard deviation of 15.3. This
means that the average variation among the RP80s for the literacy tasks was 4.7 points
on a 500-point scale, or less than 10 per cent of the 50 points making up a particular
literacy level. In addition, a small number of items had large deviations, accounting for a
significant percentage of this variation. Only 2 per cent of the deviations observed
account for about 35 per cent of the average deviation. In other words, 98 per cent of the
deviations have a mean of 3.0, or a 35 per cent reduction from the average of 4.7.
Table 4.4 shows the average deviation of the RP80s for each of the 24 country or
language groups; the average is seen to range from a low of 1.1 for the French-speaking
Swiss to 10.3 for Hungary.
Table 4.4
Average deviation of RP80 values by country or language group
Australia
Belgium (Flanders)
Canada (English)
Canada (French)
Chile
Czech Republic
Denmark
Finland
7.6
5.8
3.6
3.2
3.5
3.7
3.2
3.6
Germany
Great Britain
Hungary
Ireland
Italy
Netherlands
New Zealand
Northern Ireland
5.3
5.2
10.3
4.5
3.8
3.4
7.2
6.9
Norway (Bokmål)
Poland
Slovenia
Sweden
Switzerland (French)
Switzerland (German)
Switzerland (Italian)
United States
2.7
5.4
5.3
5.2
1.1
4.0
6.0
2.0
4.7
Conclusion
One of the goals of large-scale surveys is to provide information that can help policy
makers during the decision-making process. Presenting that information in a way that will
enhance understanding of what has been measured and the conclusions to be drawn
from the data is important to reaching this goal. This guide has offered a framework for
understanding the consistency of task responses demonstrated by adults from a number
of countries. The framework identifies a set of variables that have been shown to underlie
successful performance on a broad array of literacy tasks. Collectively, they provide a
means for moving away from interpreting survey results in terms of discrete tasks or a
single number, and towards identifying levels of performance sufficiently generalised to
have validity across assessments and groups.
The concept of test design is evolving. Frameworks such as the one presented here can
assist in that evolution. No longer should testing stop at assigning a numerical value; it
should assign meaning to that number. And, as concern ceases to centre on discrete
behaviours or isolated observations and focus is more on providing a meaningful score, a
higher level of measurement is reached (Messick, 1989).
39
Culture, Tourism and the Centre for Education Statistics