1
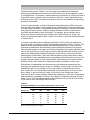
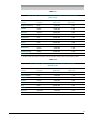
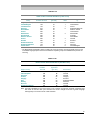
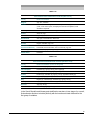
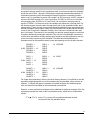
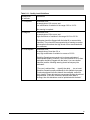
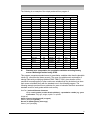
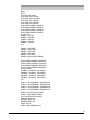
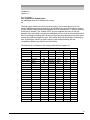
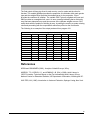
TABLE 5.1e
TOTAL NUMBER OF RESPONDENTS (FIRST AND SECOND CYCLES)
Survey cycle
Survey respondents aged 16–65
1
First
Second
36,533
25,736
Total
62,269
1. Includes records where age was not stated, under the assumption that they were part of the target population.
5.2
The LFS is a monthly household survey whose sample of
Sample Designs
The IALS required all countries to employ a probability sample representative of the
national population aged 16-65. No single sampling methodology was imposed due to
differences in the data sources and resources available in each of the participating
countries. A thorough review of the designs was conducted by Statistics Canada prior to
the data collection operations to ensure that countries met the required sampling criteria.
The second cycle required countries to supply more detailed sampling documentation. As
such, a more comprehensive review was possible. The sample designs used by the
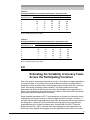
participating countries are described below. Numbers of survey respondents refer to the
full samples, see Tables 6.5a and 6.5b.
Sample Designs—First Cycle
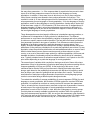
Belgium (Flanders): The designated area of Flanders was divided into statistical
sectors, from which 200 were selected with probability proportional to size. Then,
40 persons were chosen from a complete list of persons for each of these selected
sectors. Finally, in order to get an equal distribution of persons by education level, the
chosen persons were then selected into the final sample based on their level of
education. Those people who were not sampled due to their education level were given a
short questionnaire but these results were not included as part of the sample. This
procedure explains, in part, the relatively low response rate achieved for the final sample.
The total number of respondents was 2,261.
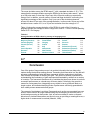
Canada: Two samples were combined. The main IALS sample was a sub-sample of the
May 1994 Canadian Labour Force Survey (LFS) file using probability sampling at all
stages. The sub-sample of 6,427 LFS respondents was stratified, with an over-sample of
certain target groups of policy interest. The sample yielded 4,703 respondents. The other
sample was a three-stage probability sample of Francophones from the province of
Ontario selected from the 1991 census. This sample resulted in 1,044 respondents. The
total number of respondents was 5,660.
44
Culture, Tourism and the Centre for Education Statistics