1
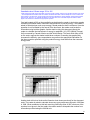
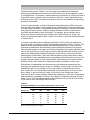
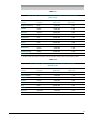
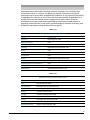
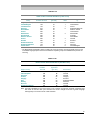
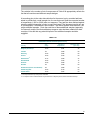
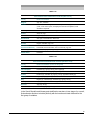
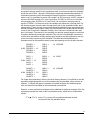
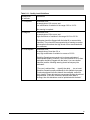
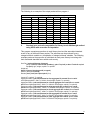
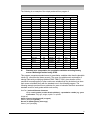
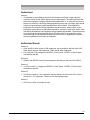
Table 4.2
Average probabilities of successful performance, document scale
Selected proficiency scores
Document Level
150
200
250
300
350
1
2
3
4
5*
40
20
7
4
<1
72
51
21
13
1
%
94
82
50
34
3
99
95
80
64
13
100
99
94
85
41
* Based on one task
Source: Adult Literacy Survey (1994).
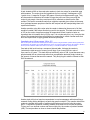
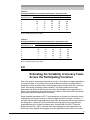
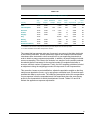
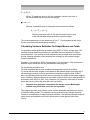
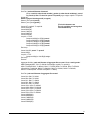
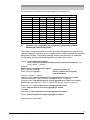
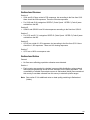
Table 4.3
Average probabilities of successful performance, quantitative scale
Quantitative level
150
1
2
3
4
5*
34
21
7
1
1
Selected proficiency scores
200
250
300
350
%
89
76
51
22
7
99
98
94
86
53
67
47
21
6
2
97
92
81
57
20
* Based on one task
Source: Adult Literacy Survey (1994).
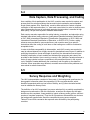
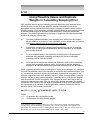
4.6
Estimating the Variability of Literacy Tasks
Across the Participating Countries
One of the goals in conducting international surveys is to be able to compare populations
on common scales. In this study, three literacy scales were used to compare both the
distributions of literacy skills and the relationships between literacy skills and a variety of
social, educational and labour market variables. The literacy tasks received item
parameters that define its difficulty and how well it discriminates among populations of
adults. These parameters were determined on the basis of how adults within and across
participating countries responded to each task.
Under standard assumptions of IRT, item parameters are thought to be invariant among
respondents and among countries as well as subgroups within countries. However, it
has been discovered through performing large-scale assessments that this assumption is
not always true. Yamamoto (1997) notes that some language/country populations do
respond differently to a subset of literacy tasks. As described in the IALS Technical
Report (Murray et al., 1997), individual items were dropped from the assessment if at
least seven of the original ten language or country populations were shown not to have
37
Culture, Tourism and the Centre for Education Statistics