
1
MapView
User Manual
Summer 2009
MapView User Manual
Table of Contents
1.
INTRODUCTION TO MAPVIEW ........................................................................................... 1
1.1. WHAT’S NEW IN MAPVIEW VERSION 6.0................................................................................. 2
1.2. MAPVIEW USER SUPPORT ..................................................................................................... 3
1.3. SETTING YOUR INTERNET EXPLORER SETTINGS ..................................................................... 3
2.
MAPVIEW BASICS................................................................................................................ 4
2.1. STARTING MAPVIEW .............................................................................................................. 4
2.2. GETTING MAPVIEW HELP ...................................................................................................... 7
2.3. MAPVIEW LAYOUT ................................................................................................................. 9
3.
NAVIGATION REVIEW........................................................................................................ 11
3.1.
3.2.
3.3.
3.4.
3.5.
3.6.
3.7.
3.8.
ZOOM IN ............................................................................................................................. 11
ZOOM OUT .......................................................................................................................... 11
ZOOM PREVIOUS ................................................................................................................. 11
ZOOM BC ........................................................................................................................... 12
PANNING ............................................................................................................................. 12
INDEX MAP.......................................................................................................................... 12
REFRESH MAP .................................................................................................................... 13
SCALE ................................................................................................................................ 13
4.
NAVIGATION TAB .............................................................................................................. 14
5.
LAYERS AND THE LAYER LIST........................................................................................ 22
5.1.
5.2.
5.3.
5.4.
5.5.
5.6.
5.7.
SCALE DEPENDENCIES ........................................................................................................ 22
LAYER WINDOW .................................................................................................................. 23
TURNING LAYERS ON AND OFF ............................................................................................ 23
MAKING A LAYER ACTIVE ..................................................................................................... 24
IDENTIFYING LAYERS ........................................................................................................... 25
METADATA .......................................................................................................................... 26
LAYER SYMBOLOGY............................................................................................................. 28
6.
LEGEND............................................................................................................................... 30
7.
DEFAULT TOOLS ............................................................................................................... 31
7.1. PRINT ................................................................................................................................. 31
7.2. EXTRACT MAP IMAGE .......................................................................................................... 33
7.3. SAVE SESSION TO SERVER .................................................................................................. 34
7.4. SAVE SESSION TO CLIENT ................................................................................................... 35
7.5. UPLOAD SAVED SESSION ..................................................................................................... 35
7.6. MEASURE DISTANCE ........................................................................................................... 36
7.7. MEASURE AREA .................................................................................................................. 36
7.8. IDENTIFYING LAYERS ........................................................................................................... 37
7.9. IDENTIFY RADIUS ................................................................................................................. 37
7.10. IDENTIFY VISIBLE ................................................................................................................. 38
7.11. LOCATION QUERY ............................................................................................................... 39
7.12. DRILLDOWN REPORT ........................................................................................................... 40
7.13. SELECT TOOL ..................................................................................................................... 41
7.14. SELECT BY RADIUS .............................................................................................................. 45
MapView User Manual
7.15. SELECT MENU ..................................................................................................................... 46
MARKUP TOOLSET............................................................................................................ 49
8.
8.1. POINT MARKUP ................................................................................................................... 49
8.2. LINE MARKUP ...................................................................................................................... 50
8.3. POLYGON MARKUP .............................................................................................................. 50
8.4. TEXT MARKUP ..................................................................................................................... 51
8.5. GRID MARKUP ..................................................................................................................... 51
8.6. ERASE MARKUP .................................................................................................................. 52
8.7. UPLOAD CSV GEOMETRY .................................................................................................... 52
8.8. UPLOAD A SHAPEFILE .......................................................................................................... 53
8.9. DOWNLOAD MARKUP AS SHAPEFILE ..................................................................................... 53
8.10. UPLOAD A GPS FILE ........................................................................................................... 54
8.11. CLEAR SELECTION .............................................................................................................. 54
SPATIAL OVERLAY ENGINE TOOLSET........................................................................... 55
9.
9.1. POINT ................................................................................................................................. 55
9.2. LINE ................................................................................................................................... 55
9.3. POLYGON............................................................................................................................ 55
10.
3D MAP VISUALIZATION ................................................................................................... 57
10.1. VIRTUAL EARTH BASICS....................................................................................................... 59
10.2. VIRTUAL EARTH TOOLBAR ................................................................................................... 61
10.3. VIRTUAL EARTH TABS .......................................................................................................... 63
11.
JOB TABS ........................................................................................................................... 65
12.
FSP....................................................................................................................................... 66
12.1. DISPLAY FSP MAP .............................................................................................................. 67
12.2. FEATURE SEARCH ............................................................................................................... 68
12.3. QUERY FEATURES ............................................................................................................... 69
12.4. IDENTIFY ............................................................................................................................. 70
12.5. ADD LAYERS TO THE MAP .................................................................................................... 72
13.
VEGETATION ...................................................................................................................... 74
13.1. DISPLAY FOREST COVER MAP ............................................................................................. 75
13.2. DISPLAY VEGETATION FULL LABELS ..................................................................................... 76
13.3. DISPLAY VEGETATION SHORT LABELS .................................................................................. 77
13.4. DISPLAY BIOGEOCLIMATIC LAYERS ....................................................................................... 78
13.5. QUERY FEATURES ............................................................................................................... 79
13.6. IDENTIFY ............................................................................................................................. 80
14.
TENURE............................................................................................................................... 83
14.1. DISPLAY TENURE MAP ......................................................................................................... 84
14.2. FEATURE SEARCH ............................................................................................................... 85
14.3. QUERY FEATURES ............................................................................................................... 86
14.4. IDENTIFY ............................................................................................................................. 87
14.5. PRODUCE MAP REPORT ...................................................................................................... 93
14.6. SELECT THEN REPORT ON ................................................................................................... 93
14.7. PERMIT REVIEW LAYERS ..................................................................................................... 95
15.
SILVICULTURE ................................................................................................................... 97
15.1. DISPLAY SILVICULTURE MAP ................................................................................................ 98
15.2. FEATURE SEARCH ............................................................................................................... 99
MapView User Manual
15.3. QUERY FEATURES ............................................................................................................. 100
15.4. IDENTIFY ........................................................................................................................... 102
15.5. SELECT THEN REPORT ON ................................................................................................. 104
16.
COMPLIANCE AND ENFORCEMENT ............................................................................. 106
16.1. DISPLAY C&E MAP ............................................................................................................ 106
16.2. NAVIGATION LINKS ............................................................................................................ 107
16.3. QUERY FEATURES ............................................................................................................. 109
16.4. IDENTIFY ........................................................................................................................... 111
MapView User Manual
1.
Introduction to MapView
This training manual offers an in-depth review of the MapView application. Each
tool will be described and the customized ‘Job Tabs’ will be explained in detail.
Included throughout the manual you will see this icon.
This symbol signifies handy hints or important tips about the
topic.
MapView has evolved though implementation of many versions since its original
development in the early 1990s. A major change in focus and one that separates
the application from many other Provincial Government Web Mapping tools is the
re-organization of the main screen to focus on jobs that need to be done, not the
computer tool to be used. This is achieved through the blue ‘Job Tabs’ found on
the function bar (see image in Section 2.3).
For example, if you are doing silviculture work you should conceptually find
everything you need for your routine silviculture work under the
‘Job Tab’.
The ‘Job Tabs’ have been implemented in the interest of maintaining simplicity of
use and to ensure that MFR is not duplicating the function of other government
software products. MapView focuses on the simpler kinds of analysis that are
done by a large number of people in the forestry business.
These ‘Job Tabs’ are explained in greater detail in the following sections:
• Section 11 – Job Tabs
• Section 12 – FSP
• Section 13 – Vegetation
• Section 14 – Tenure
• Section 15 – Silviculture
• Section 16 – C&E
If you are a government employee not focused on common forestry activities and
you need access to all of the layers in the Land and Resource Data Warehouse
(LRDW - http://www.lrdw.ca), you should look at iMapBC.
• iMapBC – Internal Government Use:
http://webmaps.gov.bc.ca/imfs/imf.jsp?site=imapbc
• iMapBC – External Use:
http://webmaps.gov.bc.ca/imfx/imf.jsp?site=imapbc
• Or explore other tools available from the GeoBC Gateway:
http://www.geobc.gov.bc.ca/
1 of 112
MapView User Manual
1.1.
What’s New in MapView Version 6.0
The new Job Tab
has been created that allows users to quickly do
Compliance and Enforcement tasks in MapView (Section 16).
New tools have been created:
• The Select Menu tool (Section 7.14)
• Upload Layer from GPS file (Section 8.10)
The 3D mode icon has been changed to
(section 10)
The following layers have been added in this release:
Agricultural Land Reserves - Colour Filled
Agricultural Land Reserves - Lines
Approved Identified Areas
Draft Forest Development Units
Draft Identified Areas
Experimental Plot - Pub
Pest Infestation 2007 Overview Data
Pest Infestation 2007 Point Data
Pest Infestation 2007 Polygonal Data
Previous Forest Development Units
RESULTS Forest Cover Inventory
RESULTS Forest Cover Reserve
RESULTS Forest Cover Silviculture
RESULTS Openings Free Growing
RESULTS Openings Not Free Growing
Submitted Identified Areas
Wildlife Management Units
The following layers have been changed in this release:
Approved Forest Development Units
BCGS Grid (1:10K)
Cadastre - private/crown (ICF and Survey
Parcels)
Non-Vegetated Land Cover - Colour Themed
Non-Vegetated Land Cover - Outlined
RESULTS Opening
RESULTS Planting
Submitted Forest Development Units
Ungulate Winter Range by Species
Vegetated Land Cover - Outlined
Vegetated Land Cover - Projected Age
Vegetated Land Cover - Projected Height
Vegetation Small Label
Wildlife Habitat Area by Species
The following Project Orthophotos have been added to the Layers List:
Arrow
Campbell River
Cariboo
Cascade
Chilcotin
Columbia
Dawson
Fort Nelson
Headwaters
James
Kalum
Kamloops
Kootenay
Mackenzie
Nadina
North Island
Okanagan
Peace
Prince George
Quesnel
Rocky Mountain
Skeena
Sunshine
Vanderhoof
The 2006 Natural Color UTM 11 layer has been added to the MR SID layer.
The Cut Block Search has been added under the Navigation tab (Section 4)
Numerous changes have been done to the FSP, Vegetation, Tenure, and
Silviculture Job tabs to the Feature Search, Query Features, Identify, and Select
then Report on functions.
2 of 112
MapView User Manual
The SOE report and Add to Acetate functions have been added to the Selection
Set window (Section 7.13).
1.2.
MapView User Support
Two forms of User Support are available for MapView
Email [email protected] for application problems or issues you
encounter.
Email [email protected] for general MapView assistance or to
request enhancements.
To access training exercises to familiarize you will commonly used MapView
tools go to: http://gww.for.gov.bc.ca/his/gis/training/iMapBC/selfserve.htm
1.3.
Setting Your Internet Explorer Settings
If you are using Internet Explorer 7 outside of a standard government Vista PC
you should follow the IE7 Security Settings link instructions under the Tutorial tab
prior to using MapView or the MapView application may not work as intended.
The user can click the IE7 Security Settings tab to open a separate document
instructing users how to configure their Internet Explorer 7 settings to work best with
MapView
Some functions that may not work in MapView using Internet Explorer 7 if you do
not change these settings include:
• Displaying custom maps (i.e. Display Silviculture Map)
• Status bar text (i.e. Cursor Coordinates)
3 of 112
MapView User Manual
2.
2.1.
MapView Basics
Starting MapView
Starting MapView through GeoBC
To start the MapView application through GeoBC, open a web browser and go to
the URL http://www.geobc.gov.bc.ca/.
Click the Forest, Grasslands & Wetlands link.
The GeoBC portal page has options to various government agencies
Next, click the Forest MapView link under the Dynamic Maps section.
Click the MapView link to launch the MapView application
4 of 112
MapView User Manual
If you are a government employee you will automatically be
able to access MapView without logging in as you are
already logged into your workstations.
If you are a BCeID user or you are a government worker
logging in from outside the government network, you will be
prompted to enter your login credentials. If you are a BCeID user,
enter your BCeID username and password into the window below
on the left. If you are a government worker logging in from outside
the government network, click the Government User button and
then enter your IDIR username and password.
The BCeID login screen on the left is for non-government users and the IDIR login
screen on the right is for government users who wish to log in from outside the
government network
MapView is also accessible directly by entering the following
address in your URL text box of your internet browser:
http://www.for.gov.bc.ca/mof/MapView.htm.
Once you login two windows will be opened, the Announcement Window and the
MapView Window.
The announcement window includes any application bulletins, known issues, and
help associated with MapView.
MapView announcement window
5 of 112
MapView User Manual
MapView will launch in the other window. The default map and layer list will load
with the extent of the Province of British Columbia in the map window.
MapView application window
Starting MapView through Forests and Range Key Applications List
Users can access MapView and other Forest and Range applications by
navigating to the Forest and Range Key Applications List page. This can be
done with either of the two sites below:
• http://www.for.gov.bc.ca/pscripts/his/apb/list.asp - External web site
• http://gww.for.gov.bc.ca/gscripts/his/apb/list.asp - Internal web site
Once you navigate to on of the sites above, scroll down the key application list
and click the External link for MapView under the Application column.
6 of 112
MapView User Manual
Users can click the External link for the MapView Application to launch MapView
2.2.
Getting MapView Help
There are a few help tools in place to assist you while using MapView.
ALT Tags - hover the mouse over any tool or tab to display a brief description of
its function.
Hover the mouse icon over a tool on the toolbar will display the name of the tool
Help Icon – located in the upper right hand corner of the function bar window,
the Help Icon lists descriptions for the tools and tabs in the information panel.
Click the Help button to get brief descriptions of each of the displayed tabs and
toolbars that are currently displayed in the function bar and toolbar
7 of 112
MapView User Manual
Tutorial Tab – an in-depth Help & Tutorial system with instructional tutorial is
available from the Tutorial tab on the function bar. These options are explained
below.
Click the Tutorial tab to display the Tutorial options in the information panel
What’s New – you can click the What’s New link to open the MapView
Application Page. This page is also displayed once the user logs into MapView.
The announcement window includes any application bulletins, known issues, and
help associated with MapView.
MapView announcement window
User Manual – you can click the User Manual link to open the current version of
the MapView User Manual.
8 of 112
MapView User Manual
IE7 Security Settings – you can click the IE7 Security Settings to open
instructions on how to configure IE7 when using MapView. If you are using
Internet Explorer 7 and are not on a standard government PC, you should follow
the IE7 Security Settings link instructions under the Tutorial tab prior to using
MapView or the MapView application will not work as intended.
About – this gives a brief description about the MapView application.
Disclaimer – this is the copyright and disclaimer information that users should
review prior to using MapView.
2.3.
MapView Layout
The MapView interface has 5 main sections.
Function Bar
Toolbar
Map
Window
Information
Panel
Status
Bar
The MapView window contains 5 sections, the Map Window, Toolbar, Function Bar,
Information Panel, and the Status Bar
1. Function Bar - consists of a series of tabs, which generally deal with the
entire mapping application.
These tabs contain specific functions
including the specific ‘Job Tabs’.
9 of 112
MapView User Manual
2. Toolbar - houses all the tools and buttons that you use to interact with the
map. The toolbar features 3 separate toolsets, from which the user can
select, plus the ability to create your own toolset.
3. Map Window - displays the image of the map, enclosed by a set of pan
bars.
4. Information Panel - is where you can enter information to refine searches
and queries. It is also where the results of your searches will be displayed
(some results may appear in a separate window).
5. Status Bar - at the bottom is where you will find the scale, selected tool,
and cursor location.
10 of 112
MapView User Manual
3.
3.1.
Navigation Review
Zoom In
The Zoom In tool can be used two different ways:
1. Point Click – click a point on the map in the map window. The map will
zoom in to half of the current scale and centre the view on the point.
2. Box – click and hold the mouse button down and drag your mouse to
draw a red box on the map window. The box outlines the extent of the
new view in the map window.
Using the Zoom In tool to draw a zoom in box
3.2.
Zoom Out
The Zoom Out tool will zoom the map out to twice the current scale.
3.3.
Zoom Previous
The Zoom Previous tool zooms you to the previous extent of the map. Similar to
a Back button on your browser window, the Zoom Previous tool takes you back
one extent.
11 of 112
MapView User Manual
3.4.
Zoom BC
The Zoom BC map will zoom the map window to the extent of the province of BC
boundary. This extent is not the full extent of the map, which means you can
select the zoom out tool and zoom the map out to include surrounding provinces.
The scale at the BC extent may vary depending on your
monitor size.
3.5.
Panning
The Pan tool is used to move the map in any direction at the current extent.
There are 2 ways to pan on the map using the Pan tool: You can click on a
location in the map to centre the map around the point you clicked. You can also
click and drag to move the map as you wish.
3.6.
Index Map
The Index Map tool is used for reference to locate your position in the map
window in comparison to the province. Located in the information panel, a red
box displays the current map window extent. You can click on the overview map
to jump to that area of the province without changing the scale. The index map is
dynamic so if you zoom in or out, the index map will be adjusted accordingly.
The Index map shows the extent of the map window for the current MapView project
If you zoom in far enough, the box will be replaced with a red
star.
12 of 112
MapView User Manual
3.7.
Refresh Map
The Refresh Map tool allows the user to refresh the map window. This can be
used after making a layer visible, or if the map window did not display properly.
3.8.
Scale
When you zoom in, the scale of the map increases - it gets larger. A large-scale
map covers a smaller land area than a small-scale map. A map that is zoomed in
to a small town is large scale, while a map of British Columbia is small scale.
The scale bar can be adjusted manually to define an exact extent
Explanation: Scale is a ratio 1:10 means that every unit on the map represents
ten units in the real world. Or in this case the map is one-tenth the size of the real
world. Because it is a ratio it doesn't matter if the units are centimetres, miles...
anything. If you have a 1:100,000 map, the map is 1/100,000 the size of the
actual place. 1/100,000 is a much smaller fraction, or ratio, with a scale of 1:10.
The map scale is located in the status bar below the map window. The scale
automatically adjusts as you zoom in and out on the map.
You can manually enter in a scale and click Go to zoom the map window in or
out to the specified scale.
Scale varies according to monitor, resolution, and size of the browser window.
Example, full extent scale might be approximately 1:12,000,000 on one monitor
and 1:7,600,000 on another monitor.
Small scale shows more area with less detail (image on left) while large scale shows
less area but more detail (right)
13 of 112
MapView User Manual
4.
Navigation Tab
The Navigation tab in the function bar is a useful and a quick way to locate
common interests. The list of common zoom functions that a MapView user may
use.
The options available under the Navigation tab
Display Base (Navigation) Map
Display Base (Navigation) Map will display the default layers that were originally
added to the MapView window. This is useful if you have added some layers
manually or if you have added layers using one of the Job functions to return to
the default map.
14 of 112
MapView User Manual
Zoom to Bookmark
Bookmarks allow you to store certain extents to refer back to at a later time. A
bookmark only saves the extent of the map window, it will not save what layers
were on or off, it will simply zoom you to the bookmark extent and display the
current layers. Click the red X to delete a bookmark.
A bookmark with the name Opening
Bookmarks will save the extent, not what layers are on or off.
Cut Block Search
Enter the Cut Block Licence you wish to search for and click Next. Enter a
Cutting Permit or click Get List to pick from a list of available options to select
and click Next. Enter a Cut Block number or click Get List to pick from a list of
available options to select and click Finish. The map will zoom to the selected
feature.
Find Feature
Select the feature type you wish to search for. Once you select the feature type,
you will need to enter in the feature identifiers to find the feature. If found, the
map will zoom to the feature. If more than one record is found, you will be asked
to pick the feature from a list before the map zooms to the selected feature.
This tool has been customized to search for many MFR specific features. Below
are some examples of MFR specific feature searches:
15 of 112
MapView User Manual
Tenure Cut Block:
A feature search for a Tenure Cut Block based on the Licence number and Cut Block
number
Opening ID
A feature search for an Opening ID based on an Opening ID number
16 of 112
MapView User Manual
Forest Development Units
A feature search for an Forest Development Units based on a FSP ID number
Find Place Name
Enter a name of a place you wish to locate and zoom to. Wild card searches are
permitted if you do not know the entire name. Enter an underscore (_) for a
single character and/or a percent (%) sign for multiple characters. Select the
distance (in KM) that you want the map window to display across. The search
will return a list of matching results. Click on the name to zoom to the area on
the map. Listed below the name is the map sheet number for your reference.
Search results for the place name Tofino
17 of 112
MapView User Manual
Zoom to Scale
Select a scale that is desired and click OK. The scale in the map window will
change to that scale.
The Zoom to Scale allows you to change the scale extent for the map window and
works the same as the fixed scale box located at the bottom left of the MapView
window
Zoom to BC Albers Coordinate
Enter a coordinate in BC Albers and select the map window zoom width to
display your point. The current centre coordinate will be filled in by default. For
example, the image below was zoomed in near Fort Nelson at a scale of
~1:100,000, depending on your screen resolution.
Enter new coordinates and select the width of the map to display
Zoom to Geographic Coordinate
Zoom to a specified area on the map by entering the latitude and longitude (in
DMS). Select the distance of the map window extent.
18 of 112
MapView User Manual
Zoom to UTM Coordinate
Zoom to a specified area on the map by entering an Easting and Northing with a
Zone number. Select the distance of the map window extent.
Zoom to Mapsheet
Enter a map sheet number. Note, you cannot enter subsections using slashes (/)
or dashes (-). Instead, you must use a decimal system. For example, the City of
Victoria is on map sheet 92B/6 but you would need to enter in 92B.06.
Zoom to Forest Region
Select a forest region from the list and click OK. This will zoom the map to the
extent of the forest region.
Zoom to Forest District
Select a forest district from the list and click OK. This will zoom the map to the
extent of the forest district.
Peace forest district is selected. Once you click OK the map will zoom to the Peace
Forest District area
Zoom to Land District
Select a Land District from the list and click OK. This will zoom the map to the
extent of the land district.
Zoom to Park or Protected Area
Select a Park or Protected Area from the list and click OK. This will zoom the
map to the extent of the park or protected area.
Zoom to Fire Centre
Select a Fire Centre from the list and click OK. This will zoom the map to the
Fire Centre.
19 of 112
MapView User Manual
Zoom to Fire Zone
Select a Fire Zone from the list and click OK. This will zoom the map to the
extent of Fire Zone.
Zoom to Timber Supply Area
Select a timber supply area from the list and click OK. This will zoom the map to
the extent of the timber supply area. The selection box remains in the information
panel so you can easily select another timber supply area.
Zoom to Tree Farm License
Select a Tree Farm License from the list and click OK. This will zoom the map to
the extent of the TFL.
Zoom to Water District
Select a Water District from the list and click OK. This will zoom the map to the
extent of the water district.
Zoom to Water Precinct
Select a Water Precinct from the list and click OK. This will zoom the map to the
extent of the water precinct.
Zoom to Assessment Area
Select an Assessment Area from the list and click OK. This will zoom the map to
the extent of the assessment area.
Zoom to Municipality
Select a Municipality from the list and click OK. This will zoom the map to the
extent of the municipality.
Zoom to Airport
Select an airport from the list and click OK. This will zoom the map to the
selected airport.
Zoom to Medevac Location
Select a Medevac Location from the list and click OK. This will zoom the map to
the selected Medevac location.
Zoom to Tanker Base
Select a tanker base from the list and click OK. This will zoom the map to the
selected tanker base.
Zoom to Waypoint
Select a waypoint from the list and click OK. This will zoom the map to the
selected waypoint.
20 of 112
MapView User Manual
Zoom to Lookout
Select a Lookout from the list and click OK. This will zoom the map to the
selected lookout.
Zoom to Weather Station
Select a weather station from the list and click OK. This will zoom the map to the
selected weather station.
Zoom to Ski Hill
Select a ski hill from the list and click OK. This will zoom the map to the selected
ski hill.
21 of 112
MapView User Manual
5.
Layers and the Layer List
Layers are what make GIS interactive maps unique compared to traditional paper
maps. Layers can have scale dependencies and can also be manually turned on
or off.
5.1.
Scale Dependencies
Scale dependencies are configured so that individual layers turn on and off at
specific scales. The layer symbology can also have specific scale dependencies,
or renders. For example, a city might be represented by a tiny polygon that looks
like a dot at a small scale, but at a larger scale the entire city boundary may have
an outline and fill colour.
Layer is unavailable at the current scale, noted by the greyed out checkbox and either
plus or minus sign; click on the plus/minus sign to zoom to the first available extent
Layers unavailable at the current scale have plus/minus sign adjacent to the
layer name. The checkbox in front of the layer name is greyed out if the layer is
unavailable at the current scale. To find out what scale the layer is available,
hover your mouse over the plus/minus sign and an ALT tag will pop-up with the
visible scale range. Click on the plus/minus sign to zoom the map to the nearest
scale at which the layer is visible.
The user can click the plus/minus sign to zoom in/zoom out to the scale where the
layer is visible
Clicking the plus/minus sign to zoom in/zoom out to a visible
scale for the layer will zoom you into the centre of the
current extent. This may or may not be an area on the map where
the layer has features.
22 of 112
MapView User Manual
5.2.
Layer Window
Layers in MapView are sorted into folders based on layers of similar type. These
layer folders that can be expanded and closed so that the Map Layer window is
more manageable. When new layers are added, they will get added to an
existing folder, or to a new folder. If a new folder is added, its name will reflect
the folder name from the add data window.
Turn on
all layers
in folder
Open
folder
Closed
folder
Turn off
all layers
in folder
Layout of Map Layers Window
5.3.
Turning Layers On and Off
Turn a layer on or off by checking the box in front of the layer name. A
checkmark means the layer is on and a blank box means the layer is off. A layer
is not available at the current scale if the checkbox is greyed out. All layers in a
folder can be turned off by clicking the
button to the right of the appropriate
folder. Once you have made a change to a layer in the information panel, you
must click the Refresh Map button for the changes to take place in the map
window.
Layer off
Layer on
Layer off and unavailable at current scale
Layer on but unavailable at current scale
Layer status defined
The Automatically Refresh Map will refresh the map each time a layer is added
to your layers list, or when layers in your layer list are turned on or off.
Normally the map does not automatically refresh when you add layers from the
add layers dialog box. As a result several layers can be added to the map at
once without the map being refreshed multiple times.
Check the Automatically Refresh box to update layer changes on the map on the fly
23 of 112
MapView User Manual
5.4.
Making a Layer Active
Before we can identify a feature on the map, you need to make the target layer
active.
The Recreation Trails layer is set to active, noted by the dark
identify icon.
Only one layer can be active at a time.
Defining an active layer is done on the layers page within the layer list. The icon
is adjacent to the layer name. Click on the greyed out icon to make it active. The
icon will change to dark black, making it the active identifiable layer.
Not all layers can be made active or inactive, only layers with the identify icon
(greyed out or black version) can be selected.
You can only have one layer active at a time. For example, only one layer can
have the black icon beside it, the rest remain greyed out. You do not need to
click on the active layer icon to turn it off; you can simply click on another layer’s
icon to activate it.
If you select the Identify tool without an active layer, the
status bar at the bottom will inform the user that there is no
active layer.
24 of 112
MapView User Manual
5.5.
Identifying Layers
The identify tool is used to view attribute information of features on the map.
Select the identify tool to activate it. The icon will have a red box around it when
it is active. Make sure you have set an active layer in the map layers list. Click
on the feature in the map window. The feature’s attributes will be displayed in
the information panel.
The attributes for the opening in the centre of the map window are listed in the
information panel
If no records were found:
1. Make sure the layer of the feature you are identifying is active,
2. Make sure you clicked on the feature (try zooming in to a larger scale)
The information panel will always list the coordinate position of your mouse click.
The one drawback to the identify tool is that it can become cumbersome if you
have several features from different layers you want to identify, since each layer
has to be set to active and the each feature identified individually.
Several layers from the LRDW only the feature code (FCODE) will be listed in the
layers attribute table. In order to look up the description for a particular feature
code the web site below can be used.
http://aardvark.gov.bc.ca/apps/fcq/jsp/index.jsp
25 of 112
MapView User Manual
5.6.
Metadata
Metadata is data about other data. MapView provides some simplified and
succinct explanations of LRDW layers visible in the application, Links to the
associated full detail Geographic Data Discovery Service Metastar record(s) are
provided as well in the window that opens up.
The user can click the blue layer link in the Layers tab to open the metadata about the
layer.
Layers with blue names have hyperlinks that you can click on to view the
metadata. The metadata page will open in a separate window and will give a
definition of the layer.
MapView metadata record for the Opening layer and below the description is the
Metastar metadata link
26 of 112
MapView User Manual
From this page, users can click the Metastar link to link to the Geographic Data
Discovery Service record. This metadata page should explain data uses,
limitations, distribution and pricing. Some are implicit and some are not, so when
in doubt check before sharing data with others.
Metastar metadata for Opening layer
Governance: Data Confidentiality and Protection
Please ensure that you are aware of the security level of the data you are
using. Is it proprietary or confidential? It is up to you to maintain the
appropriate level of protection when it comes to the use and distribution
of the data and making it available to others.
MapView users have the responsibility to respect distribution restrictions
of all datasets.
Metadata pages should explain data uses, limitations, distribution and
pricing. Some are implicit and some are not, so when in doubt check
before sharing data with others. The Freedom of Information and
Protection of Privacy Act has precise guidelines on distribution of
government information that must be followed by all employees.
27 of 112
MapView User Manual
Governance: Each Dataset has a Custodian
Every Data Custodian is a Director. The Director establishes provincewide policy, definitions, and rules for business information within their
mandate, to enable the Ministry to gain maximum value out of the
information.
The Data Custodian has the lead role in encouraging and regulating use
and sharing of the data for which they have custody throughout the
Ministry.
See:
http://www.for.gov.bc.ca/his/datadmin/DCGuidelinesForNRSector.pdf
5.7.
Layer Symbology
You can change the symbology of any layer on the map by clicking on the
rainbow pyramid at the end of the layer name in the layer list. If there is no
pyramid beside the layer, you will have to zoom in or out to a scale at which the
layer is visible or the option is not available for that layer (imported layers cannot
be changed).
An example of layer symbology properties for the Opening layer (the label symbology
is not shown)
28 of 112
MapView User Manual
Layers can have their point, line, or polygon symbology changed as well as their
labels. To specify a new colour for the fill, text, or outline of the layer, first click in
the colour box beside name (e.g., Fill Colour) and then click on a colour in the
colour selector.
Depending on the layer type, you can change such characteristics as line type,
width, point symbol, transparency, size and outline. For labels, you can select
what field you want to use as labels, select the font size and type, and set the
maximum scale it can be viewed at. For example, if you want to label minor
roads by their name, you would set a maximum scale of 1:20,000 so your map
won’t be cluttered.
29 of 112
MapView User Manual
6.
Legend
The Legend Tab found in the function bar displays the layer symbology. The
legend is dynamic, meaning it will only show symbology for layers that are turned
on and visible at the current scale.
The map legend in MapView can be set to display what layers are displayed in the
Legend view and printed on the map by clicking on the Settings link at the top right
You can adjust what layers display on the legend by clicking on the Settings link
at the top of the legend page, or under the Settings tab in the function bar.
Uncheck all the layers that you do not wish to display in the legend. This will
apply to the display in the information panel as well as maps that are printed.
30 of 112
MapView User Manual
7.
Default Tools
The default tools include the basic tools that are frequently used. It includes print
to PDF, extract map image, save session, save and download session, open
session, measure line, measure area, 4 identify tools, location query, and a
select tool. All of these tools are explained in-depth in this section.
The MapView toolbar
Also located on the toolbar are two hidden toolsets, the markup tools, and the
SOE tools. On the far right of the toolbar is the 3D mode tool. These are all
explained in further sections of this manual.
7.1.
Print
You can create a PDF map to either print or plot. Zoom to the extent on the map
you wish to print. If you would like, add any markup to the map that may be
relevant and click the Print PDF tool. In the Information Panel, a list of options
will be displayed and the Map extent box (shown in red) will be displayed in the
map window.
Select the template from the first pull-down menu. This contains a list of different
print formats and page sizes. Select the scale at which you want to print your
map. The current scale is the extent of the map window. If you select a different
scale, the map window will zoom in to the centre of the map extent to reach the
desired scale. The map extent box will be adjusted accordingly.
If you wish to use a specific scale, you should set up your
map window to a similar scale so you know what will be
displayed. If your map scale differs too greatly from your MapView
window, your map output may not display the information as
intended.
Enter a title for your map in the text box. The map will be created as a PDF that
you can then open or save to your local computer.
You can select if you want to add lat/long graticules option to add a latitude /
longitude grid to the output map. If left unchecked, no grid will be added to the
map.
When the settings have been defined, click the OK button to generate the map.
31 of 112
MapView User Manual
Landscape template for creating a PDF map
Printing large size can take several minutes to generate.
The red outline can be removed from the map window by
clicking the Clear Outline button.
The map can be opened by clicking the Open Map link.
Click the open map link to open the map PDF
32 of 112
MapView User Manual
The default PDF map includes the map and scale you specify and the title you
gave it. It also includes some defaults such as the British Columbia logo, a
legend of all the layers currently turned on (unless you have changed the layer
legend setting), a copyright/disclaimer, datum/projection, overview map, neatline,
and graticules.
The output PDF for the default template
7.2.
Extract Map Image
The Extract Map Image tool on the toolbar produces an image of the current map
image to a georeferenced image that can be used in products like ArcPad and
ArcMap. Choose the desired image format, then press the OK button.
A .zip file will be created containing an image file and a world file in the specified
format, and can be downloaded to your local computer.
The export image display
33 of 112
MapView User Manual
7.3.
Save Session to Server
The Save Session to Server tool on the toolbar produces a URL for the saved
session in the information panel. Saving your session will let you access the
same image, datasets, and session name used at a later date if you want to
return to your location. You can write the URL down or add it to your Internet
browser’s favourites. This link can be emailed to other users who have access to
MapView to allow them to access the MapView session.
It should be noted, however, that the save session has a few limitations. The
URL is automatically deleted if it remains unused for 90 days. When the session
is accessed, the 90 day count is reset. The link can be sent to other users, but
only people with an IDIR or valid BCeID account will be able to open the saved
session.
You can add the session link to your Internet browser’s bookmarks/favourites
34 of 112
MapView User Manual
7.4.
Save Session to Client
The Save and Download Session bundles up your entire session and saves it as
a Stored Session file (*.ssn). You can save this on your local computer and open
it at a later time or you can email the saved session file to another person who
has MapView access so they can view the MapView project. The file will save
your current map extent, layer list (including layers that you have uploaded), any
selection sets, and session name. Saving a session will NOT preserve any user
uploaded shapefile(s).
Any shapefiles that are saved are not saved in the session
and are only saved on the server. The Save and Download
Session simply references the location on the server where the
shapefile is saved. Shapefiles are only retained on the server for
30 days from when the shapefile is added. This timeframe is not
updated when the shapefile is accessed like the Save Session tool
(I.E. the shapefile is removed 30 days from when it is added, no
matter if it is accessed or not).
Click the blue link Save Session Now to download the session file
7.5.
Upload Saved Session
The Open Session tool simply opens a previously downloaded session. Click the
Open Session tool in the default toolbar and browse to the location of the Stored
Session file (*.ssn). Click the Open Session button to open the saved session.
In the Open Session window, click Browse and navigate to the location of the saved
session and click the Open Session button to open the saved session
35 of 112
MapView User Manual
In the past there have been issues with saved session
compatibility between versions.
7.6.
Measure Distance
The Measure Distance tool is handy to measure linear paths on the map. Click a
minimum of 2 points on the map to form a line segment. Each point will have its
coordinates recorded in the information panel. A distance and true course
measure will also be displayed for each segment and the running total is
displayed at the bottom. Click the Clear Points button when you are finished.
The measure line tool displays the length between two segments and the length of the
total line
7.7.
Measure Area
The Measure Area tool will measure the area of a defined polygon. Each point
will record the coordinate position. The area is measured using the metric
system and will adjust according to the scale of the map. For example,
measuring large areas at a small scale will use square kilometres. Measuring
areas at a large scale will use square hectares or meters.
36 of 112
MapView User Manual
The measure area tool used to measure a clearing on the orthophoto
7.8.
Identifying Layers
The identify tool is how you view attribute information of features on the map.
This is described in detail in Section 5.5.
7.9.
Identify Radius
The Identify Radius tool
is similar to the Identify tool
except you can
enter a distance to buffer around the location. This tool will find features that are
within the specified radius of the point clicked on the map.
This will identify all Tree Farm Licenses within 100 KM of the point clicked on the map
37 of 112
MapView User Manual
You do not need to set an active layer in order to use this tool. Simply select the
tool, click on the map to define center point, select the layer to identify features
on, enter the radius distance and units of measure, and click OK.
The map will zoom to the search area defined by a circle with a diagonal
crosshatch. The attributes of features that intersect with the circle are displayed
in the information panel.
The search radius is displayed in the map window (cross-hatched circle) and the
identify results are displayed in the information panel
7.10.
Identify Visible
The Identify Visible tool is an advanced Identify tool. When you click on a point
on the map, this tool drills down through all the layers that are currently turned on
and displays attribute information from all the features at that location. This is
convenient if you wish to generate a quick report since it does not require a layer
to be active. The drawback of this report is that it may return more information
than you require and it may take a few moments to find the information you are
looking for.
Attributes for each visible layer are displayed in the information panel, including
the coordinate position of the location identified on the map.
38 of 112
MapView User Manual
Attributes for all layers that are turned on for the point clicked on the map in are shown
in the information panel
7.11.
Location Query
The Location Query tool provides a quick report on the location that is selected.
The location query will provide the user with the coordinates, Forest Region,
Forest District, BCGS Grid (1:20K), and the Timber Supply Area in the
information panel for the location that was clicked. This is useful as the layers do
not need to be turned on for the Location Query Report to generate the results.
The Location Query Report for a location on the map
39 of 112
MapView User Manual
7.12.
Drilldown Report
The Drilldown Report tool generates a report of ALL the data associated with
the point you have chosen, visible and invisible layers, based on the Report Type
you select. The Report Options for the Drilldown Report are:
• Forest Tenure Drilldown
• Appraisal Drilldown
• Region and Compartments Drilldown
• Location Drilldown
• Results Drilldown
Once you have selected the appropriate Report Type click the Run Report
button to generate the report in the information panel for all appropriate results.
The Drilldown Report with the default search selected will search all of the MapView
layers
The results of the report will be returned in the information panel. The top of the
report will list the number of layers queried and the number of results returned.
40 of 112
MapView User Manual
7.13.
Select Tool
The Select tool is used to select features on the map. Unlike the Identify Tool,
which is primarily used for single features, selections are most useful for creating
sets of data.
Like the Identify Tool, you must first choose the layer from which you want to
select features from. Layers are only selectable if they have a select icon
beside the layer name in the layers list. The icon appears grayed out if the layer
is selectable but is currently not the active select layer.
To make a layer the active select layer, click on the select icon in the layer list.
The icon will become coloured when it is available and active.
It is important to note that one layer can be set to active (indicated by the black
identify icon) while another layer is set as selectable.
Click on the Select tool on the toolbar and click on a single point to select the
feature to create selection set within the one layer. The map window will refresh
with the selected feature(s) highlighted.
The selected tool has been used to select a feature in the map (outlined in yellow) and
the selection set is displayed in the information panel
41 of 112
MapView User Manual
Selection Set Summary
After you select a feature, the information panel will display the selection set
summary, which includes the name of the selection layer, how many features are
selected, and the options to generate a report. The options are defined below:
• Extract to Excel – creates an excel spreadsheet containing the selected
feature(s). You can then download the zip file or open the Excel file
directly.
• Extract to GML – creates a GML document containing the selected
features.
• Extract to Shape – creates a Shapefile containing the selected features.
• Zoom to Extent – this will zoom you to the extent of the selected features.
• SOE Report – generates a spatial overlay engine report in a new window.
The map window will refresh with the boundary highlighted on the map by
default. A user can choose to generate a report only or generate a report
and highlight the feature on the map.
• Default Report – generates a report in the information panel that lists the
selected features attributes. You can zoom to a specific feature from this
menu or go back to the selected set summary.
• Add to Acetate – adds the selected features to the acetate layer.
The selection set for the selected layer is shown in the information panel
42 of 112
MapView User Manual
Advanced Selection Sets
There are a number of ways you can modify your current selection. Selecting
more features allows you to add to your selection set, while selecting features
already in your selection set allows you to remove them.
With a selection set already in place, use the Select tool and select another
feature on the map. You will notice the options in the information panel differ
from when you only had one selection set.
Above is the advanced selection set for the 1:2,000,000 Major Cities Layer with 13
just selected features and 1 previously selected layer
The options for more than one selection set are defined below:
• New – clears any previous selection sets and makes the current selection
the new set. In the figure below, the first selection set, or previous set,
contains 3 points. The latest selection set in the red box contains 2 new
points. Clicking on the New option in the selection set dialogue will clear
the previous points and make the 2 new points the new, or active selection
set.
43 of 112
MapView User Manual
NEW selection set to the right of the arrow, marked by squares
•
Add – add the newly selected features to the previous selection set.
Below, the previous selection set contains 3 points. The latest selection
set contains 2 points in the red box. Clicking the Add option in the
selection set dialogue will add the two sets together to form a new
selection set containing 5 points.
ADD selection set to the right of the arrow, marked by squares
•
Subtract – if the new selection contains features that were previously
selected, the subtract button will remove the new selection from the
previous set. In the figure below, the previous selection set contains 5
points. The latest selection set in the red box contains 2 points that are
already part of the previous selection set. Clicking the Subtract option in
the selection set dialogue will remove the last selection of 2 points from
the previous selection of 5 points, leaving the new selection set with 3
points from the previous selection.
SUBTRACT selection set to the right of the arrow, marked by squares
•
Subset – is the opposite of subtract. Only the features just selected that
are part of the previous set are kept. All other features are discarded from
the set. Below, the previous selection set consists of 5 points. The latest
selection set in the red box contains 2 points that are already part of the
previous selection set. Clicking the Subset option in the selection set
dialogue will only select the latest points that were part of the previous
selection set. Therefore, the new selection set will consist of 2 points.
44 of 112
MapView User Manual
SUBSET selection set to the right of the arrow, marked by squares
•
Unchanged – leaves the selected set as it was, ignoring the selection that
you just made. In the figure below, the previous selection set consists of 3
points. The latest selection set consists of 2 points in the red box.
Clicking the Unchanged option in the selection set dialogue, the new
selection set will keep the previous selection set of 3 points and ignore the
latest selection set.
UNCHANGED selection set to the right of the arrow, marked by squares
•
Clear – unselects all the selected features in this layer. In the figure
below, the previous selection set consists of 3 points. The latest selection
set consists of 2 points in the red box. Clicking the Clear option in the
selection set dialogue, all selections will be cleared and no selection sets
will exist.
CLEAR selection set to the right of the arrow, removes all selections
7.14.
Select by Radius
The Select by Radius tool is used to select features that are a specific distance
from a point selected on the map. For this tool to function, you must first set the
layer you wish to select as the active selectable layer. Next, click on a point in
the map. In the information panel, set the distance that you wish to select
features from the point clicked on the map.
45 of 112
MapView User Manual
Set the distance you wish to select features from the point clicked on the map
Once you click OK in the information panel, the features that are within the
search distance will be selected and the search radius will be drawn on the map.
The search radius is shown on the map and the select results are displayed in the
information panel
7.15.
Select Menu
The select menu allows you to select features by various methods. If no features
are currently selected on the map, click a selection method to activate it.
You must have an active select layer to open the select
menu. To do this, click the Layers tab and make a layer the
active select layer.
46 of 112
MapView User Manual
Selected Sets
This will show all of the current selection sets. This lists all of the layers that
have features selected and how many features, or records, that are currently
selected within the layer.
To make a selection set active again, click on the layer name.
Select by Layer
With a selection set in place already, the Select by Layer feature allows you to
select all features on a specified layer that intersect with a previously selected
feature. For example, if we want to know how many Tenure roads intersect with
the Cut Block set, choose Tenure Roads layer as the layer to select features
from. Next, choose the Cut Blocks set from the drop down menu of selection
sets and click OK. All intersecting features will be selected.
Select using Query Builder
The query function is a powerful analysis tool. You can select records using a
logical expression called a SQL (Structured Query Language) query, which
selects records based on certain attribute criteria. This is essentially asking:
“Where are the features that have these specific attributes?” The Generate query
tool launches the query generator in a pop-up window.
To generate a query, first select the layer that you are interested in from the
drop-down menu. Step two is to choose the database field on which you are
interested in basing your selection. Select the logical expression from the dropdown menu and enter a value into the value box. You then click the Add to
Query String button. The query will now appear in the query text field.
;’
Click the Within Visible Extent box
to only search for records in the
current visible map window.
Click the Get Samples button if you
are not sure what field values are
available.
Check Case Sensitive box if you
want the query to perform this action.
Advanced users familiar with SQL can make changes to the
query string directly in the query text field.
47 of 112
MapView User Manual
When you execute the query or close the window and reopen it again, the query
builder will be repopulated with the last query string entered. This is useful if you
ran a query but did not return any results. Instead of entering the query again,
you can simply modify the query string and run it again.
Select by Attribute
You can choose a layer and then specify the specific information about the
feature to select it in the map window.
Select by Point
You can choose to select features on the map by point. You simply click on the
map where you wish to select features.
Select by Buffer
The buffer tool selects features around a previous selection set. You select the
layer you want to select features from, the distance to search, and the selection
set layer you wish to use for the select. Once run, a hash-marked area will
appear on the map showing the area of the search and any search result will
appear in the information panel.
You must have at least one selection set already defined to
use this tool.
Select by Box
You can choose to select features on the map by box. You simply click and drag
on the map for the area you wish to select features.
Select by Polygon
You can choose to select features on the map by polygon. You simply click on
the map where you wish to add each point for your polygon. Click Submit to
select features or click Clear to redraw your polygon.
Clear Selection Tool
The Clear Selection tool will list all the current selection sets on the map. Check
the sets you wish to remove and click OK.
48 of 112
MapView User Manual
8.
Markup Toolset
The markup toolset allows you to draw your own material on the map, uploading
a .csv file, upload a shapefile, save markups as a shapefile or clear selection.
The user must expand the Markup toolset by clicking the leftmost
toolbar.
icon on the
The Markup toolset
The toolset can be minimized by clicking the
8.1.
icon.
Point Markup
Click the Point Markup tool and then click on the map to draw a point. In the
information panel, choose the symbol colour, and enter a label for the point, if
you desire. You can automatically add either geographic (latitude and longitude)
coordinates by clicking either the Label with map coordinate or enter in your
own text description.
You can choose between a few colours and add a label if you want or label the point
with its geographic or UTM coordinate by clicking the blue text
49 of 112
MapView User Manual
8.2.
Line Markup
Click the Line Markup tool and click two or more points on the map to form a line
segment. A line segment can have as many vertices as you wish and the
segment can cross over itself numerous times. Click OK when you have finished
your segment and choose its symbology.
You can draw as many segments to your line as you want by adding points
8.3.
Polygon Markup
Click the Polygon Markup tool and click a minimum of 3 points on the map. Make
sure when you are adding points to the polygon that none of the line segments
cross each other. If you are happy with your shape, click OK; otherwise click the
Clear button to start again. Choose the symbology for your new polygon and
click OK to add it to the map.
Polygon markups can have as many points as you want, as long as none of the line
segments cross one another
50 of 112
MapView User Manual
8.4.
Text Markup
Click the Text Markup tool and then click a point on the map to add text. Type
your text in the textbox dialogue in the information panel. The text will be
positioned above and to the right of the point. You can select a background of
white or yellow so your text is more legible.
Add Text to Map label options allows you to add text to any location on the map
8.5.
Grid Markup
You can add a grid to the map using the Grid Markup tool. Select the tool and
then enter the number of horizontal and vertical cells you want to display.
The grid only covers the extent of the map window. If you
pan the map after you have drawn the grid, the grid will not
cover the new area in the map window.
Grid Markup allows you to specify how many grid lines show horizontally and
vertically.
51 of 112
MapView User Manual
8.6.
Erase Markup
The Erase Markup tool allows you to erase individual markup simply by selecting
the Erase Markup tool and clicking on the markup. Make sure you click on the
right item to erase because you are not prompted to confirm the deletion. To
erase more than one markup feature at one time, click and drag a box around the
features you wish to erase.
8.7.
Upload CSV Geometry
Uploading a Comma Separated Value (CSV) file will create a point graphics layer
on the map. You can upload a standard CSV file (with or without field names) up
to a maximum of 4MB. Select the tool and browse to the location of your CSV
file and click the Upload CSV File button.
In order to properly setup the CSV file, you need to specify a field for an X and Y
coordinates, the projection of your points, a title to display in the layers list, and the
colour of the symbol that will represent the points on the map
If the file was successfully uploaded, you now need to specify which of the fields
contain the X and Y coordinate values. Next, specify the projection of the source
file and add a title to your layer in order to easily identify it in the layer list.
Finally, choose a colour in which you want your CSV file to be represented by on
the map and click the Submit button.
If your CSV file does not upload, check to make sure your
data is in the proper CSV format.
52 of 112
MapView User Manual
You can use the identify tool to view attributes of each point providing the CSV
file contained attributes.
Green squares mark the uploaded CSV file points
8.8.
Upload a Shapefile
Click on the Upload Shapefile tool to open the dialogue in the information panel.
Browse to the shapefile attribute file (database file *.dbf) and then browse to the
shapefile spatial file (shapefile *.shp). Select the appropriate projection from the
pull-down menu. Any features that were created in MapView will be projected in
BCAlbers. Type in a name for the shapefile. This will be displayed in the layers
list. Choose a colour for the symbol and select where you want the layer to
display in the layer list. The maximum size for a shapefile that can be uploaded
into MapView is 52,428,800 bytes (52.4 Mb).
Shapefiles are only retained on the server for 30 days from
when the shapefile is added. This timeframe is not updated
when the shapefile is accessed like the Save Session tool (I.E. the
shapefile is removed 30 days from when it is added, no matter if it
is accessed or not).
8.9.
Download Markup as Shapefile
You can save the markups you made on the map as an individual layers. Click
the Download Markup to Shapefile tool. A zip file will be created and can be
opened and saved to either your local computer or network. The markup
consists of 4 files (.shp, .shx, .dbf, and .prj) for each type of geometry created:
point, line, and polygon. The markup can be then added as a shapefile in
ArcGIS or added as a layer to MapView.
Only Point, Line, and Polygon features can be downloaded
as a shapefile. Text features cannot be downloaded as a
shapefile.
53 of 112
MapView User Manual
Shapefiles use all four of the given files when they are used.
If you choose to rename or move one of the files, all files
must be changed in the same way or the shapefile will not work.
I.e., if you want to rename line134.shp to NewRoad.shp, you must
also relabel line134.prj, line134.shx, and line134.dbf to their correct
new labels: NewRoad.prj, NewRoad.shx, and NewRoad.dbf,
respectively.
8.10.
Upload a GPS File
Click on the Upload a GPS File tool to open the dialogue in the information panel
that will let you upload GPS data from a NMEA format data file. Click Browse
and navigate to the NMEA shapefile saved on your computer. You can select to
import the GPS data as a track or as a series of waypoints. Click Upload GPS
button to add the GPS data to the layer list and map window.
8.11.
Clear Selection
The Clear Selection tool will list all the current selection sets on the map. Check
the sets you wish to remove and click OK.
54 of 112
MapView User Manual
9.
Spatial Overlay Engine Toolset
A Spatial Overlay Engine report generates a list of all SOE configured layers and
features that intersect with your point, line, or polygon. The larger the area
drawn means the longer it will take to generate the report, but the report opens in
a new browser window so you can let it run in the background. Links to such
things as GATOR will take you directly to the record if you have the appropriate
permissions. The format options pull-down menu gives what will be searched
with the SOE tool. It is defaulted to the Full LRDW Warehouse but some custom
searches have been created and can be selected using the Format options pull
down menu.
9.1.
Point
Mark a point on the map and enter a buffer zone adjacent to the point. Click the
Submit button to generate the report.
9.2.
Line
Mark a line on the map and enter a line width and a buffer zone distance. Click
the Submit button to generate the report.
9.3.
Polygon
Mark a polygon on the map and enter a buffer zone distance. Click the Submit
button to generate the report.
A spatial overlay line drawn on the map to represent a proposed road; the road is 15m
wide and 10m buffer zone is added on each side
55 of 112
MapView User Manual
Spatial Overlay Engine report generated from the line drawn on the map
Fitness for Use
When using data give some thought to the information itself in terms of
the following topics, all of which can be looked up in the Land Information
BC Discovery Service:
-
Data quality: resolution, accuracy, measurement devices, software
and hardware used to gather the samples
-
Spatial referencing: coordinate systems, datum’s, projection system.
-
Timeliness of data: currency, frequency of collection, frequency of
change
-
Lineage: the collection agency,
methodology, processing methods,
See http://lrdw.bcgov/.
56 of 112
sampling
design,
sampling
MapView User Manual
10. 3D Map Visualization
The 3D Map Visualization tool allows the users to launch Virtual Earth in the
MapView map window. This will allow the users to view locations and
information in a 3D environment.
This function expects Microsoft Virtual Earth to be installed on your computer. If
it is not installed you will be prompted by the Virtual Earth Installer as to whether
you want to install the control.
To start, click the 3D map mode button. The Virtual Earth disclaimer will open.
The Virtual Earth disclaimer window will open once the 3D Visualization tool is
launched
1. If you are a BC Government employee, click Cancel as you will need to
make an iStore request to have Virtual Earth installed. If you need help
contact your iStore clerk and ask them to request a Microsoft Virtual
Earth3D installation for your workstation.
2. If you are not a BC Government employee you are advised to read the
licensing and installation requirements carefully. Please check with your
own IT department for advice on installing the control.
If you are having trouble getting this function to work, please visit
http://maps.live.com and verify that you can see the 3D view of the live maps
web site before reporting this as a problem to the government help desk.
57 of 112
MapView User Manual
Click the check box next to "Do not show this message again" if you have
already read this message and Virtual Earth is installed on your computer.
Once you have clicked Continue, Virtual Earth will open. The 3D Navigational
Help window will open for new Virtual Earth users.
The 3D Navigation Help window
Click Close if the 3D Navigational Help window is open to view the Virtual earth
window.
Virtual Earth opened in the MapView window
58 of 112
MapView User Manual
Users can get additional help with Virtual Earth by navigating
to the following URL: http://help.live.com/help.aspx?mkt=enca&project=wl_local&querytype=topic&query=WL_LOCAL_PROC_
3D_NavigateMap.htm
10.1.
Virtual Earth Basics
When Virtual Earth is launched, some of the basic MapView functions and tools
will be disabled. The Layer, Navigation and Tutorial tabs are still enabled. The
basic navigations tools are enabled (Zoom BC, Zoom In, Zoom Out, Pan, Zoom
Previous, Index Map, and Refresh Map tools) as is the Location Query tool. The
3D tool becomes the 2D tool which allows users to return to MapView in a
standard 2D environment.
When Virtual Earth 3D mode is enabled, the tools and tabs show above are still
available to the user
The scale box in the bottom left of the map window is still enabled, but will not
display the current scale (e.g. it will always be empty).
The bottom right of the map window will show the map information. This includes
the latitude, longitude, altitude, the scale bar, and a disclaimer.
The map information shown in the Virtual Earth environment
Zoom BC
Zooms the map window to the extent of the province of BC boundary and has the
same functionality as the basic MapView window.
Zoom In
The zoom in tool in Virtual Earth is only able to zoom in on the centre of the map.
Once selected, the map will zoom in on the centre of the map.
59 of 112
MapView User Manual
Zoom Out
The zoom out tool will zoom the map out from the centre of the map window.
Panning
The Pan tool is the active tool when in the Virtual Earth environment.
There are 2 methods to use the pan tool:
1. The user can click and drag to move the map as you do when using the
standard pan tool. The default icon on the map is displayed below.
The default pan icon in the Virtual Earth environment
2. The user can press and hold the CTRL key to switch the pan function to a
rotate map angle or change camera angle function. This icon on the map
is displayed below.
When the CTRL key is pressed and held, the icon changes to the icon above
The user can move the mouse from side to side to rotate the map or move
the mouse up and down to increase/decrease the map angle.
The same point is shown at the standard map view on the right and after the map has
been rotated and the camera angle changed
60 of 112
MapView User Manual
Zoom Previous
This tool zooms you to the previous extent of the map. Similar to a Back button
on your browser window, the Zoom Previous tool takes you back one extent.
This can only work for one extent where the regular MapView Zoom previous tool
will allow the user to zoom previous several times.
Index Map
The index map has the same functionality as MapView, except that the map
window will automatically be rotated North and the camera angle will be directly
overhead (no camera angle). The index map will be displayed in the information
panel.
Refresh Map
The Refresh Map tool allows the user to refresh the map window. This can be
used after making a layer visible, or if the map window did not display properly.
Location Query
The Location Query tool has the same functionality as MapView. It provides a
quick report on the location that is selected.
2D Visualization tool
The 2D Visualization tool will return the user to the standard MapView window.
10.2.
Virtual Earth Toolbar
The Virtual Earth map window contains a separate toolbar that is found on the
left hand side of the map window.
The Virtual Earth toolbar is found on the left hand side of the map window
61 of 112
MapView User Manual
More information on these tools can be found at:
http://help.live.com/help.aspx?mkt=en-ca&project=wl_local&
querytype=topic&query=WL_LOCAL_PROC_3D_NavigateMap.htm
Pan Compass
The pan compass has two functions.
The first function is that the Pan Compass acts similarly as pan bars. You can
click in any direction on the compass and the map will move in that direction.
The second function is that you can click the N to orientate the map to look north.
This is helpful if you have previously rotated the map window and wish to return
to standard map direction.
The Pan Compass allows the user to move the map in any direction or orientate the
map to look north
Zoom In
The zoom in tool in Virtual Earth is only able to zoom in on the centre of the map.
Once selected, the map will zoom in on the centre of the map.
62 of 112
MapView User Manual
Zoom Out
The zoom out tool will zoom the map out from the centre of the map window.
Decrease Altitude
The Decrease Altitude tool will decrease the visible altitude of the map window.
This is best when you wish to view the map at a lesser altitude. This only differs
from the zoom in tool when you are viewing the map with at least some camera
angle (e.g. you are not looking straight down).
Increase Altitude
The Increase Altitude tool will increase the visible altitude of the map window.
This is best when you wish to view the map at a greater altitude. This only differs
from the zoom out tool when you are viewing the map with at least some camera
angle (e.g. you are not looking straight down).
Rotate Camera Angle Clockwise
The Rotate Camera Angle Clockwise tool will allow you to rotate your map
window in a clockwise manner. You can click and hold to continuously rotate in
that direction.
Rotate Camera Angle Counter Clockwise
The Rotate Camera Angle Counter Clockwise tool will allow you to rotate your
map window in a counter clockwise manner. You can click and hold to
continuously rotate in that direction.
Tilt Down
The Tilt Down tool will change the camera angle to show more of a profile of the
landscape.
Tilt Up
The Tilt Up tool will change the camera angle to show less of a profile of the
landscape.
10.3.
Virtual Earth Tabs
The tabs available in the Virtual Earth environment work in a similar manner as
those in the MapView mode.
The only difference is under the layers tab. Users can add additional layers by
clicking the Layers Tab and then clicking [Add Layers].
This will allow users to add layers that are in a GeoRSS or KML file formats.
63 of 112
MapView User Manual
The MapView Add Vector Layers window allows the user to add a Vector layer to the
Virtual Earth map
The user must enter the layers URL, file type, Alias (what it will be named in
Layer List), and you can select if you want to zoom to the layer. When these
have been selected, click Add Layer to add the layer to the map window.
64 of 112
MapView User Manual
11. Job Tabs
In MapView, specific business processes (e.g. FSP, Vegetation, Tenure, and
Silviculture) are organized by broad forestry job categories into the Job Tabs.
The idea is to give you one stop shopping for all the tools you need to do your
job.
Each job related tab is designed to let you do all the things you need to do
without having to click between screens constantly. You can bring up a map with
the layers most commonly used for your job, find job specific map objects,
produce specific and in some cases specially customised Identify reports, select
groups of objects and report on them, produce special colour themed maps, and
show map objects like openings chosen by your own criteria.
While in any of the Job tabs you will continue to have
flexibility to add or remove any layers that exist in MapView.
These job tabs are found on the function bar.
The MapView Job Tabs are found on the MapView function bar
These tabs are explained in the following sections.
65 of 112
MapView User Manual
12. FSP
The FSP tab will contain all job related mapping functions for you to do Forest
Stewardship Planning.
Once the FSP tab is clicked, the information will be displayed with a list of
options related to Forest Stewardship Planning.
When the FSP tab is clicked the FSP job tools are displayed in the information panel
The tasks available under the FSP tab are described in the sections below.
66 of 112
MapView User Manual
12.1.
Display FSP Map
The Display FSP Map will refresh the map window with all of the relevant FSP
layers added to the map.
The Display FSP Map is displayed with the appropriate FSP layers added
The layers added by clicking the Display FSP Map option include the general
basemapping layers plus the layers in the following table.
Layer List
Folder
Base map
Base map
Base map
Admin
Boundaries
Planning
Forest Tenure
Other Tenure
Layer List Subfolder
Layer Name
Surface Features
Digital Roads Atlas – Paved Roads
Digital Roads Atlas – Unpaved
Park
Forest Development
Units
Tenure Roads
Approved Forest Development Units
Active Tenure Roads
Indian Reserves
67 of 112
MapView User Manual
12.2.
Feature Search
This tool allows you to highlight openings by searching for specific search
criteria. Each option allows you to set your desired search criteria.
Any fields with a * are mandatory fields and cannot be left
blank.
Forest Development Units
The Forest Development Units option allows you to search for a Forest
Development Unit by entering a FSP ID, and optionally entering an Amendment
Number and clicking Search.
Identified Areas
The Identified Areas option allows you to search for a Identified Areas by
entering a FSP ID, and optionally entering an Amendment Number and clicking
Search.
Tenure Cut Block
The Tenure Cut Block option allows you to search for a Tenure Cut Block by
entering a Licence number, a Cut Block number, and optionally entering a
Cutting Permit number and clicking Search.
Tenure Harvest Authority
The Tenure Harvest Authority option allows you to search for a Tenure Harvest
authority by entering a Licence number and optionally entering a Cutting Permit
ID and clicking Search.
Tenure Road
The Tenure Road option allows you to search for a Tenure Road by entering a
Licence number and optionally entering a Road Section number and clicking
Search.
Opening by ID
This allows you to search for an opening by entering an Opening ID number and
clicking Search.
Opening by Cut Block
This allows you to search for an opening by entering the Licence and Cut Block
numbers, optionally entering the Cutting Permit, and clicking Search.
68 of 112
MapView User Manual
12.3.
Query Features
The Query Features option provides you with a prebuilt method to highlight or
select specific FSP features using existing values.
One you have defined your query, you can click the Highlight Features button to
select the features in the map window, the Query Features button to show only
those features matching your query in the map window.
You can remove the highlighting by clicking the Clear Results button.
You can enter your Query selection in the Query Selection window
At least one parameter must be set before clicking the
Query Features button.
The query will only return results that are in the map
window.
Approved FDU Filter Query
This query allows you to highlight Approved Forest Development Units by setting
the Date and optionally setting the FSP ID, FSP Amendment, and FDU Name.
The more options selected, the more restrictive the query will be.
FDU Filter Query
This query allows you to highlight Forest Development Units by setting the Date
and optionally setting the FSP ID, FSP Amendment, and FDU Name. The more
options selected, the more restrictive the query will be.
69 of 112
MapView User Manual
12.4.
Identify
The Identify function assigns the identify layer from the layer selected bypassing
the need to set explicitly setting the identify layer via the Layers Function tab
(See Section 5.4).
To use, select the layer you want to identify in the information panel and then
click on a feature in the map window. The identify report will be generated in the
information panel.
You can select any of the options in the Identify list to indentify a map feature without
having to set it as the active identifiable layer in the Layer list.
If a layer is not turned on or not visible at a current scale, you
will see the following error. You will need to either turn the
layer on or zoom to a visible scale to identify one of these features.
Approved Forest Development Units
This option will allow you to identify features from the Approved Forest
Development Units layer. Once selected you can click on an Approved Forest
Development Unit feature in the map window to return the identify results in the
information panel.
70 of 112
MapView User Manual
Submitted Forest Development Units
This option will allow you to identify features from the Submitted Forest
Development Units layer. Once selected you can click on a Submitted Forest
Development Unit feature in the map window to return the identify results in the
information panel.
Draft Forest Development Units
This option will allow you to identify features from the Draft Forest Development
Units layer. Once selected you can click on a Draft Forest Development Unit
feature in the map window to return the identify results in the information panel.
Previous Forest Development Units
This option will allow you to identify features from the Previous Forest
Development Units layer. Once selected you can click on a Previous Forest
Development Unit feature in the map window to return the identify results in the
information panel.
Identified Areas
This option will allow you to identify features from the Identified Areas layer.
Once selected you can click on an Identified Area feature in the map window to
return the identify results in the information panel.
Submitted Identified Areas
This option will allow you to identify features from the Submitted Identified Areas
layer. Once selected you can click on a Submitted Identified Area feature in the
map window to return the identify results in the information panel.
Approved Identified Areas
This option will allow you to identify features from the Approved Identified Areas
layer. Once selected you can click on an Approved Identified Area feature in the
map window to return the identify results in the information panel.
Opening
This option will allow you to identify features from the Openings layer. Once
selected you can click on an Opening Feature in the map window to return the
identify results in the information panel.
Standard Unit
This option will allow you to identify features from the Standard Unit layer. Once
selected, you can click on a Standard Unit Feature in the map window to return
the identify results in the information panel.
71 of 112
MapView User Manual
Activity Treatment Unit
This option will allow you to identify features from the Activity Treatment Unit
layer. Once selected you can click on an Activity Treatment Unit Feature in the
map window to return the identify results in the information panel.
Forest Cover Inventory
This option will allow you to identify features from the Silviculture Forest Cover
Inventory layer. Once selected, you can click on a Silviculture Forest Cover
Inventory feature in the map window to return the identify results in the
information panel.
Forest Cover Silviculture
This option will allow you to identify features from the Silviculture Forest Cover
Silviculture layer. Once selected, you can click on a Silviculture Forest Cover
Silviculture feature in the map window to return the identify results in the
information panel.
12.5.
Add Layers to the Map
Under the Add Layers to the map is a series of options that allows the user to
add additional layers to the map window by automatically selecting the layer in
the layer list.
Using any of the options in the FSP tab under the Add Layers to the Map, any of
the following layers can be added:
Layer List Folder
Planning
Planning
Planning
Planning
Planning
Planning
Planning
Forest Tenure
Forest Tenure
Forest Tenure
Planning
Admin Boundaries
Layer List
Subfolder
Forest
Development Units
Forest
Development Units
Forest
Development Units
Forest
Development Units
Identified Areas
Identified Areas
Identified Areas
Harvest Authority
Harvest Authority
Harvest Authority
Layer Name
Approved Forest Development Units
Previous Forest Development Units
Draft Forest Development Units
Submitted Forest Development Units
Draft Identified Areas
Submitted Identified Areas
Approved Identified Areas
Active Harvest Authority
Pending Harvest Authority
Retired Harvest Authority
Landscape Units
Park Protected Area
72 of 112
MapView User Manual
Forest Tenure
Forest Tenure
Forest Tenure
Forest Tenure
Admin Boundaries
Admin Boundaries
Biogeoclimatic
Biogeoclimatic
Wildlife
Wildlife
Land Cover
Research
Tenure Roads
Tenure Roads
Tenure Roads
Tenure Roads
Active Tenure Roads
Pending Tenure Roads
Retired Tenure Roads
As Built Roads
BC Timber Sales
Timber Supply Area
Biogeoclimatic Zones
Biogeoclimatic Subzones - Variants
Ungulate Winter Range
Wildlife Habitat Area
Growth and Yield Active Status
Research
Installations
(adds
Experimental Plots – Pub)
Fisheries Sensitive Watersheds
73 of 112
MapView User Manual
13. Vegetation
The Vegetation tab will contain all job related mapping functions for you to do
Vegetation mapping.
Once the Vegetation tab is clicked, the information will be displayed with a list of
options related to Vegetation.
When the Vegetation tab is clicked the Vegetation job tools are displayed in the
information panel
The tasks available under the Vegetation tab are described in the sections below.
74 of 112
MapView User Manual
13.1.
Display Forest Cover Map
The Display Forest Cover Map will refresh the map window with all of the
relevant Forest Cover layers added to the map.
The Display Forest Cover Map is displayed with the appropriate Forest Cover layers
added to the map window
The layers added by clicking the Display Forest Cover Map option include the
general basemapping layers plus the layers in the following table.
Layer List
Folder
Base map
Base map
Base map
Admin
Boundaries
Land Cover
Forest Tenure
Forest Tenure
Forest Tenure
Other Tenure
Layer List Subfolder
Layer Name
Surface Features
Digital Road Atlas – Paved Roads
Digital Road Atlas – Unpaved
Park
Tenure Roads
Tenure Roads
Tenure Roads
Vegetated Land Cover
Pending Tenure Roads
Active Tenure Roads
Retired Tenure Roads
Indian Reserves
75 of 112
MapView User Manual
13.2.
Display Vegetation Full Labels
The Display Vegetation Full Labels Map will refresh the map window with the
Vegetation Full Labels added to the map.
The Vegetation Full Labels are displayed on the Forest Cover Map when the Display
Vegetation Full Labels is clicked
Only the Vegetation Full Label is added by clicking the Display Vegetation Full
Labels option.
The users should add the Forest Cover Map prior to
Displaying the Vegetation Full Labels or the labels will
appear without the Forest Cover layer.
76 of 112
MapView User Manual
13.3.
Display Vegetation Short Labels
The Display Vegetation Short Labels Map will refresh the map window with the
Vegetation Short Labels added to the map.
The Vegetation Short Labels are displayed on the Forest Cover Map when the
Display Vegetation Short Labels is clicked
Only the Vegetation Short Label is added by clicking the Display Vegetation
Short Labels option.
The users should add the Forest Cover Map prior to
Displaying the Vegetation Short Labels or the labels will
appear without the Forest Cover layer.
77 of 112
MapView User Manual
13.4.
Display Biogeoclimatic Layers
The Display Biogeoclimatic layers will refresh the map window with all of the
relevant Biogeoclimatic layers added to the map.
The Biogeoclimatic layers are displayed on the Forest Cover Map when the Display
Biogeoclimatic layers is clicked
Only the Biogeoclimatic Zones and Biogeoclimatic Subzones – Variant
layers are added by clicking the Display Biogeoclimatic layers option.
78 of 112
MapView User Manual
13.5.
Query Features
The Query Features option provides you with a prebuilt method to highlight or
select specific Vegetation features using existing values.
One you have defined your query, you can click the Highlight Features button to
select the features in the map window, the Filter Features button to show only
those features matching your query in the map window.
You can remove the highlighting by clicking the Clear Results button.
You can enter your Query selection in the Query Selection window
At least one parameter must be set before clicking the
Highlight Features button or the Query Features button.
The query will only return results that are in the map
window.
Vegetation Filter
This query allows you to highlight or select openings by setting the Projected Age
or Species Code. The more options selected, the more restrictive the query will
be.
79 of 112
MapView User Manual
13.6.
Identify
The Identify function assigns the identify layer from the layer selected bypassing
the need to set explicitly setting the identify layer via the Layers Function tab
(See Section 5.4).
To use, select the layer you want to identify in the information panel and then
click on a feature in the map window. The identify report will be generated in the
information panel.
You can select any of the options in the Identify list to indentify a map feature without
having to set it as the active identifiable layer in the Layer list.
If a layer is not turned on or not visible at a current scale, you
will see the following error. You will need to either turn the
layer on or zoom to a visible scale to identify one of these features.
Forest Cover
The Forest Cover identify option will return a report on the Vegetated Land Cover
layer.
80 of 112
MapView User Manual
When the Identify Forest cover is used, the attributes from the feature selected in the
map window are displayed in the information panel
Vegetation Label Report
When you click the Vegetation Label Report a separate window will open with
the MFR font to properly display symbols used in the Vegetation labels.
81 of 112
MapView User Manual
The Vegetation Label report opens in a separate window
If you do not have the Ministry of Forest font on your
computer, you must obtain it by clicking the Forestry Font
link at the top of the Vegetation Label Identify Report window.
Users can click the Forestry Fonts link to display the Vegetation Label Identify Report
with the proper fonts
82 of 112
MapView User Manual
14. Tenure
The Tenure tab will contain all job related mapping functions for you to do Forest
Tenure mapping.
Once the Tenure tab is clicked, the information will be displayed with a list of
options related to Forest Tenures.
When the Vegetation tab is clicked the Vegetation job tools are displayed in the
information panel
The tasks available under the Tenure tab are described in the sections below.
83 of 112
MapView User Manual
14.1.
Display Tenure Map
The Display Tenure Map will refresh the map window with all of the relevant
Forest Tenure layers added to the map.
The Display Tenure Map option will add all tenure related layers to the map window
The layers added by clicking the Display Tenure Map option include the general
basemapping layers plus the layers in the following table.
Layer List
Folder
Base map
Base map
Base map
Admin
Boundaries
Forest Tenure
Forest Tenure
Forest Tenure
Forest Tenure
Forest Tenure
Forest Tenure
Forest Tenure
Forest Tenure
Forest Tenure
Other Tenure
Layer List Subfolder
Layer Name
Surface Features
Digital Road Atlas – Paved Roads
Digital Road Atlas – Unpaved
Park
Harvest Authority
Harvest Authority
Harvest Authority
Cut Blocks
Cut Blocks
Cut Blocks
Tenure Roads
Tenure Roads
Tenure Roads
Pending Harvest Authority
Active Harvest Authority
Retired Harvest Authority
Pending Cut Blocks
Active Cut Blocks
Retired Cut Blocks
Pending Tenure Roads
Active Tenure Roads
Retired Tenure Roads
Indian Reserves
84 of 112
MapView User Manual
14.2.
Feature Search
This tool allows you to highlight map objects of a specific feature type by
selections you have made based on your designated search criteria. Each
option allows you to set your desired search criteria.
Any fields with a * are mandatory fields and cannot be left
blank.
Tenure Harvest Authority
The Tenure Harvest Authority option allows you to search for a Tenure Harvest
authority by entering a Licence number and optionally entering a Cutting Permit
ID and clicking Search.
Tenure Cut Block
The Tenure Cut Block option allows you to search for a Tenure Cut Block by
entering a Licence number, a Cut Block number, and optionally entering a
Cutting Permit number and clicking Search.
A feature search for a Tenure Cut Block will zoom to the extent of the returned
feature(s)
Tenure Road
The Tenure Road option allows you to search for a Tenure Road by entering a
Licence number and optionally entering a Road Section number and clicking
Search.
85 of 112
MapView User Manual
14.3.
Query Features
The Query Features option provides you with a prebuilt method to highlight or
Filter select specific Tenure features using existing values.
One you have defined your query, you can click the Highlight Features button to
select the features in the map window or the Filter Features button to show only
those features matching your query in the map window.
You can remove the highlighting by clicking the Clear button.
You can enter your Query selection in the Query Selection window
At least one parameter must be set before clicking the
Highlight Features button or the Filter Features button.
The query will only return results that are in the map
window.
Tenure Cut Block Filter
This query allows you to highlight or filter tenure cut blocks by setting the Layer
Type or Licence number. The more options selected, the more restrictive the
query will be.
86 of 112
MapView User Manual
14.4.
Identify
The Identify function assigns the identify layer from the layer selected bypassing
the need to set explicitly setting the identify layer via the Layers Function tab
(See Section 5.4).
To use, select the layer you want to identify in the information panel and then
click on a feature in the map window. The identify report will be generated in the
information panel.
You can select any of the options in the Identify list to indentify a map feature without
having to set it as the active identifiable layer in the Layer list.
87 of 112
MapView User Manual
If a layer is not turned on or not visible at a current scale,
you will see the following error. You will need to either turn
the layer on or zoom to a visible scale to identify one of these
features.
Run Drill Down Report
The Run Drill Down Report option will allow the user to use the Drill down report
option. This is explained completely in section 7.12.
Forest Region
The Forest Region option will allow the user to identify Forest Region features in
the map window.
Forest District
The Forest District option will allow the user to identify Forest District features in
the map window.
Provincial Forest
The Provincial Forest option will allow the user to identify Provincial Forest
features in the map window.
Detailed Provincial Forest: Provincial Forest
The Detailed Provincial Forest: Provincial Forest option will allow the user to
identify Provincial Forest features in the map window.
Detailed Provincial Forest: Provincial Forest Addition
The Detailed Provincial Forest: Provincial Forest Addition option will allow the
user to identify Provincial Forest Addition features in the map window.
Detailed Provincial Forest: Provincial Forest Deletion
The Detailed Provincial Forest: Provincial Forest Deletion option will allow the
user to identify Provincial Forest Deletion features in the map window.
Detailed Provincial Forest: Provincial Forest Exclusion
The Detailed Provincial Forest: Provincial Forest Exclusion option will allow the
user to identify Provincial Forest features in the map window.
88 of 112
MapView User Manual
Timber Supply Area
The Timber Supply Area option will allow the user to identify Timber Supply Area
features in the map window.
The Identify TSA option will return results for the appropriate feature selected in the
information panel
Public Sustained Yield
The Public Sustained Yield option will allow the user to identify Public Sustained
Yield features in the map window.
Tree Farm License: Tree Farm License
The Tree Farm License: Tree Farm Licence option will allow the user to identify
TFL features in the map window.
The Identify Tree Farm Licence: Tree Farm Licence option will return results for the
appropriate feature selected in the information panel
89 of 112
MapView User Manual
Tree Farm License: TFL Schedule A
The Tree Farm License: TFL Schedule A option will allow the user to identify TFL
Schedule A features in the map window.
Tree Farm License: TFL Additions
The Tree Farm License: TFL Additions option will allow the user to identify TFL
Additions features in the map window.
Tree Farm License: TFL Deletions
The Tree Farm License: TFL Deletions option will allow the user to identify TFL
Deletions features in the map window.
Harvest Authority: Approved Harvest Authority
The Harvest Authority: Approved Harvest Authority option will allow the user to
identify Approved Harvest Authority features in the map window.
Harvest Authority: Pending Harvest Authority
The Harvest Authority: Pending Harvest Authority option will allow the user to
identify Pending Harvest Authority features in the map window.
Harvest Authority: Retired Harvest Authority
The Harvest Authority: Retired Harvest Authority option will allow the user to
identify Retired Harvest Authority features in the map window.
Cut Block: Approved Cut Block
The Cut Block: Approved Cut Block option will allow the user to identify Approved
Cut Block features in the map window.
Cut Block: Pending Cut Block
The Cut Block: Pending Cut Block option will allow the user to identify Pending
Cut Block features in the map window.
Cut Block: Retired Cut Block
The Cut Block: Retired Cut Block option will allow the user to identify Retired Cut
Block features in the map window.
SP Exempt Block
The SP Exempt Block option will allow the user to identify SP Exempt Block
features in the map window.
Range: Active Range
The Range: Active Range option will allow the user to identify Active Range
features in the map window.
90 of 112
MapView User Manual
The Identify Active Range: Range option will return results for the appropriate feature
selected in the information panel
Range: Pending Range
The Range: Retired Range option will allow the user to identify Retired Range
features in the map window.
Range: Retired Range
The Range: Retired Range option will allow the user to identify Retired Range
features in the map window.
Range: Range Intensive Grazing
The Range: Range Intensive Grazing option will allow the user to identify Range
Intensive Grazing features in the map window.
Pulpwood: Pulpwood Area
The Pulpwood: Pulpwood Area option will allow the user to identify Pulpwood
Area features in the map window.
Pulpwood: Pulpwood Agreement
The Pulpwood: Pulpwood Agreement option will allow the user to identify
Pulpwood Agreement features in the map window.
Roads: Active Tenure Roads
The Roads: Approved Tenure Roads option will allow the user to identify
Approved Tenure Road features in the map window.
91 of 112
MapView User Manual
Roads: Pending Tenure Roads
The Roads: Pending Tenure Roads option will allow the user to identify Pending
Tenure Road features in the map window.
Roads: Retired Tenure Roads
The Roads: Retired Tenure Roads option will allow the user to identify Retired
Tenure Road features in the map window.
Roads: As Built Roads
The Roads: As Built Roads option will allow the user to identify As Built Road
features in the map window.
Other Tenure: Survey Parcel
The Other Tenure: Survey Parcel option will allow the user to identify Survey
Parcel features in the map window.
Other Tenure: Active Interest Parcel
The Other Tenure: Active Interest Parcel option will allow the user to identify
Active Interest Parcel features in the map window.
Other Tenure: Inactive Interest Parcel
The Other Tenure: Inactive Interest Parcel option will allow the user to identify
Inactive Interest Parcel features in the map window.
Other Tenure: Administrative Area
The Other Tenure: Administrator Area option will allow the user to identify
Administrator Area features in the map window.
Other Tenure: Well Site
The Other Tenure: Well Site option will allow the user to identify Well Site
features in the map window.
Other Tenure: Indian Reserve
The Other Tenure: Indian Reserve option will allow the user to identify
Administrator Area features in the map window.
Mineral Tenure: Mineral Tenure
The Mineral Tenure: Mineral Tenure option will allow the user to identify Mineral
Tenure features in the map window.
Heritage Trail Non-OIC
The Heritage Trail Non-OIC option will allow the user to identify Heritage Trail
Line features in the map window.
92 of 112
MapView User Manual
Land Use
The Land Use option will allow the user to identify Land Use features in the map
window.
Special Protection Areas
The Special Protection Areas option will allow the user to identify Special
Protection Area features in the map window.
Community Watershed
The Community Watershed option will allow the user to identify Community
Watershed features in the map window.
Park
The Park option will allow the user to identify Park features in the map window.
14.5.
Produce Map Report
Currently you can only generate this report by using the SOE tools from the
toolbar. This will likely change in future versions of this product when other uses
of this very powerful tool are invented.
14.6.
Select then Report On
Use the Select and then Report on function here to assign the selection layer
bypassing the need to switch to the Layers Tab and make that layer active to
select.
You can only select a single feature using this method. If
you want to select multiple features, use the Select tool as
described in the Select Tool section of this manual.
After you select a feature, the information panel will display the selection set
summary, which includes the name of the selection layer, how many features are
selected, and the options to generate a report. The options are defined below:
• Extract to Excel – creates an excel spreadsheet containing the selected
feature(s). You can then download the zip file or open the Excel file
directly.
• Extract to GML – creates a GML document containing the selected
features.
• Extract to Shape – creates a Shapefile containing the selected features.
• Zoom to Extent – this will zoom you to the extent of the selected features.
• SOE Report – generates a spatial overlay engine report in a new window.
The map window will refresh with the boundary highlighted on the map by
default. A user can choose to generate a report only or generate a report
and highlight the feature on the map.
93 of 112
MapView User Manual
•
•
Default Report – generates a report in the information panel that lists the
selected features attributes. You can zoom to a specific feature from this
menu or go back to the selected set summary.
Add to Acetate – adds the selected features to the acetate layer.
Pending Harvest Authority
This option will allow you to select a Pending Harvest Authority feature so it can
be used to generate a report or extract information about the feature.
Active Harvest Authority
This option will allow you to select an Active Harvest Authority feature so it can
be used to generate a report or extract information about the feature.
Retired Harvest Authority
This option will allow you to select a Retired Harvest Authority feature so it can
be used to generate a report or extract information about the feature.
Pending Cut Block
This option will allow you to select a Pending Cut Block feature so it can be used
to generate a report or extract information about the feature.
Active Cut Block
This option will allow you to select an Active Cut Block feature so it can be used
to generate a report or extract information about the feature.
The Select and then Report on an Active Cut Block selects the cut block clicked in the
map window and allows you to run a report using any of the selection set options
94 of 112
MapView User Manual
Retired Cut Block
This option will allow you to select a Retired Cut Block feature so it can be used
to generate a report or extract information about the feature.
Pending Tenure Roads
This option will allow you to select a Pending Tenure Roads feature so it can be
used to generate a report or extract information about the feature.
Active Tenure Roads
This option will allow you to select an Active Tenure Roads feature so it can be
used to generate a report or extract information about the feature.
Retired Tenure Roads
This option will allow you to select a Retired Tenure Roads feature so it can be
used to generate a report or extract information about the feature.
14.7.
Permit Review Layers
The Permit Review Layers allows you to review permit applications by being able
to turn layers individually to see if any conflicts exist for each layer, one at a time.
Display Permit Review Layer Map
The Display Permit Review Layer Map will refresh the map window with all of the
other layers removed except for the Forest Tenure Roads layer.
The Display Permit Review Layer Map turns off all layers except for Forest Tenure
Roads so the individual layers can be turned on or off one at a time
95 of 112
MapView User Manual
Show Permit Review Layer
Under the Show Permit Review layer you have a list of individual layers that can
be turned on by clicking the radio button. You can only select a single layer and
when another layer is selected, the previous layer is turned off.
You can use this to cycle through the layers to see if any layers conflict with the
permit application.
The Active Harvest Authority layer is turned on in the Permit Review Layer Map
96 of 112
MapView User Manual
15. Silviculture
The Silviculture tab will contain all job related mapping functions for you to do
Silviculture mapping and reporting. The following is a brief overview of all the
functionality in this tab but specific materials have been developed for staff
carrying out silviculture work by the Results program.
This section covers all of the functionality available within the
silviculture tab. In addition to this material the Results
Business Area has developed detailed training materials with more
in depth background on the meaning and use of the information
accessed under this tab. To access these in depth training
materials go to:
http://www.for.gov.bc.ca/his/results/trainingMaterials.htm and click
the ‘RESULTS and MapView’ link near the bottom of the web
page.
Once the Silviculture tab is clicked, the information will be displayed with a list of
options related to Silviculture.
When the Vegetation tab is clicked the Vegetation job tools are displayed in the
information panel
The tasks available under the Tenure tab are described in the sections below.
The RESULTS (Reporting Silviculture Updates and Land
status Tracking System) layers contain locations of the
97 of 112
MapView User Manual
managed forest land where there are silviculture activities or basic
silviculture obligations.
An "opening" represents the administrative area that is being
tracked.
Some openings have no spatial line work and cannot be displayed
in MapView. As of July 2006, 71% of openings have their spatial
line work available in either opening or forest cover layers. This will
improve over time through routine updates. Users should be aware
that when using MapView for making business interpretations they
are potentially looking at incomplete information.
For more details about RESULTS business documentation and
spatial layers go here: http://www.for.gov.bc.ca/his/results/
15.1.
Display Silviculture Map
The Display Silviculture Map will refresh the map window with all of the relevant
Silviculture layers added to the map.
The Silviculture layers are added to the map window when the Display Silviculture
Map is clicked
The layers added by clicking the Display Silviculture Map option include the
general basemapping layers plus the layers in the following table.
98 of 112
MapView User Manual
Layer List
Folder
Base map
Base map
Base map
Forest Tenure
Silviculture
Silviculture
Silviculture
Silviculture
Other Tenure
15.2.
Layer List Subfolder
Tenure Roads
Layer Name
Surface Features
Digital Road Atlas – Paved Roads
Digital Road Atlas – Unpaved
Active Tenure Roads
Opening
Activity Treatment Unit
Standards Unit
Forest Cover Silviculture
Indian Reserves
Feature Search
This tool allows you to highlight openings by searching for specific search
criteria. Each option allows you to set your desired search criteria.
Any fields with a * are mandatory fields and cannot be left
blank.
Opening by ID
This allows you to search for an opening by entering an Opening ID number and
clicking Search.
The Feature Search by Opening ID will search and zoom to the selected feature as
specified by the query selection
99 of 112
MapView User Manual
Opening by Opening Number
This allows you to search for an opening by entering the Mapsheet Grid,
Mapsheet letter, Mapsheet Square, and Opening Number, and clicking Search.
Opening by Cut Block
This allows you to search for an opening by entering the Licence and Cut Block
numbers, optionally entering the Cutting Permit, and clicking Search.
Opening by Timber Mark
This allows you to search for an opening by entering the Timber Mark and
optionally entering the Cut Block number and then clicking Search.
Vegetation Opening
This allows you to search for an opening by entering the Map ID and the Opening
Number and then clicking Search.
15.3.
Query Features
The Query Features option provides you with a prebuilt method to highlight or
select specific Silviculture features using existing values.
One you have defined your query, you can click the Highlight button to display
the feature(s) in the map window that match your criteria or click the Select
Features button to select the features in the map window.
If you select features you are able to extract information on the selected features
or run a report based on the selected features.
You can remove the highlighting by clicking the Clear Highlight button.
You can enter your Query selection in the Query Selection window
100 of 112
MapView User Manual
At least one parameter must be set before clicking the
Highlight or Select Features button.
The query will only return results that are in the map
window.
Opening Category
This query allows you to highlight or select openings by setting the Opening
Category Code, Licence Number, Client Number, and/or the disturbance
start/end date. The more options selected, the more restrictive the query will be.
Users can view the opening Category Code descriptions by clicking the
Descriptions link in the Opening Category Query window.
The highlighted openings are shown in yellow for the defined query
Silviculture Treatments
This query allows you to highlight or select openings by setting the Silviculture
Base Activity, Technique, Method, Funding Source, Opening Category Code,
and/or the completion/planned start/end date.
The ministry accepts only valid combinations of
base/technique/ method activities. If you are not familiar
with ministry codes or valid combinations, please refer to:
http://www.for.gov.bc.ca/hfp/publications/00026/fs708-14appendix_d.htm
101 of 112
MapView User Manual
Users can view the opening Category Code descriptions by
clicking the Descriptions link in the information panel.
Planting by Seedlot / Veglot
This query allows you to highlight or select openings by setting the Opening
Category Code, Silviculture Tree Species Code, Seedlot number, and/or the
completion start/end date.
Users can view the opening Category Code descriptions by
clicking the Descriptions link in the information panel.
Forest Stand Conditions
This query allows you to highlight or select openings by setting the Stocking
Status, Forest Cover Layer, Primary Tree Species, Damage Agent, Site Index,
Total Stems per Ha, Well Spaced Stems per Ha, Surveyed Average Age, and/or
Current Average Age.
Users can view the opening Damaged Agent descriptions by
clicking the Descriptions link in the information panel.
Openings with Free Growing Declaration Past Due
This query is designed to show any openings that have not been declared that is
past due. This design is opening-based so that all SUs must be declared
Declaration Past Due prior to be highlighted. There are no parameters
associated with this query. It is to demonstrate simple thematic mapping that can
be pre-set in MapView.
15.4.
Identify
The Identify function assigns the identify layer from the layer selected bypassing
the need to set explicitly setting the identify layer via the Layers Function tab
(See Section 5.4).
To use, select the layer you want to identify in the information panel and then
click on a feature in the map window. The identify report will be generated in the
information panel.
102 of 112
MapView User Manual
You can select any of the options in the Identify list to indentify a map feature without
having to set it as the active identifiable layer in the Layer list.
For RESULTS, the majority of data is shown in the opening
layer however, it can be very long list and requires lots of
scrolling. As such, you have the ability to see only the business
area of interest (e.g. activity, standards unit vs. forest cover).
If a layer is not turned on or not visible at a current scale,
you will see the following error. You will need to either turn
the layer on or zoom to a visible scale to identify one of these
features.
Opening
This option will allow you to identify features from the Openings layer. Once
selected you can click on an Opening Feature in the map window to return the
identify results in the information panel.
Standard Unit
This option will allow you to identify features from the Standard Unit layer. Once
selected, you can click on a Standard Unit Feature in the map window to return
the identify results in the information panel.
103 of 112
MapView User Manual
Activity Treatment Unit
This option will allow you to identify features from the Activity Treatment Unit
layer. Once selected you can click on an Activity Treatment Unit Feature in the
map window to return the identify results in the information panel.
Forest Cover Inventory
This option will allow you to identify features from the Forest Cover Inventory
layer. Once selected, you can click on a Forest Cover Inventory feature in the
map window to return the identify results in the information panel.
Forest Cover Silviculture
This option will allow you to identify features from the Forest Cover Silviculture
layer. Once selected, you can click on a Forest Cover Silviculture feature in the
map window to return the identify results in the information panel.
15.5.
Select then Report On
Use the Select and then Report on function here to assign the selection layer
bypassing the need to switch to the Layers Tab and make that layer active to
select.
You can only select a single feature using this method. If you want
to select multiple features, use the Select tool as described in the
Select Tool section of this manual.
After you select a feature, the information panel will display the selection set
summary, which includes the name of the selection layer, how many features are
selected, and the options to generate a report. The options are defined below:
• Extract to Excel – creates an excel spreadsheet containing the selected
feature(s). You can then download the zip file or open the Excel file
directly.
• Extract to GML – creates a GML document containing the selected
features.
• Extract to Shape – creates a Shapefile containing the selected features.
• Zoom to Extent – this will zoom you to the extent of the selected features.
• SOE Report – generates a spatial overlay engine report in a new window.
The map window will refresh with the boundary highlighted on the map by
default. A user can choose to generate a report only or generate a report
and highlight the feature on the map.
• Default Report – generates a report in the information panel that lists the
selected features attributes. You can zoom to a specific feature from this
menu or go back to the selected set summary.
• Add to Acetate – adds the selected features to the acetate layer.
104 of 112
MapView User Manual
Opening
This option will allow you to select an Opening feature so it can be used to
generate a report or extract information about the feature.
Standard Unit
This option will allow you to select a Standard Unit feature so it can be used to
generate a report or extract information about the feature.
Activity Treatment Unit
This option will allow you to select an Activity Treatment Unit feature so it can be
used to generate a report or extract information about the feature.
Forest Cover Inventory
This option will allow you to select a Forest Cover Inventory feature so it can be
used to generate a report or extract information about the feature.
Forest Cover Silviculture
This option will allow you to select a Forest Cover Silviculture feature so it can be
used to generate a report or extract information about the feature.
105 of 112
MapView User Manual
16. Compliance and Enforcement
The C&E tab will contain all job related mapping functions for you to do
Compliance and Enforcement mapping.
Once the C&E tab is clicked, the information will be displayed with a list of
options related to Compliance.
When the C&E tab is clicked the Compliance and Enforcement job tools are displayed
in the information panel
The tasks available under the Tenure tab are described in the sections below.
16.1.
Display C&E Map
The Display (C&E) Map will refresh the map window with all of the relevant
Silviculture layers added to the map.
106 of 112
MapView User Manual
The Compliance and Enforcement layers are added to the map window when the
Display (C&E) Map is clicked
The layers added by clicking the Display (C&E) Map option include the general
basemapping layers plus the layers in the following table.
Layer List
Folder
Base map
Base map
Base map
Base map
Other Tenure
16.2.
Layer List Subfolder
Layer Name
Surface Features
Digital Road Atlas – Paved Roads
Digital Road Atlas – Unpaved
Elevation
Indian Reserves
Navigation Links
The Navigation links allow you to quickly jump to specific areas without leaving
the C&E screen.
Zoom to UTM Coordinate
Zoom to a specified area on the map by entering an Easting and Northing with a
Zone number. Select the distance of the map window extent.
Zoom to Geographic Coordinate
Zoom to a specified area on the map by entering the latitude and longitude (in
DMS). Select the distance of the map window extent.
107 of 112
MapView User Manual
Find Place Name
Enter a name of a place you wish to locate and zoom to. Wild card searches are
permitted if you do not know the entire name. Enter an underscore (_) for a
single character and/or a percent (%) sign for multiple characters. Select the
distance (in KM) that you want the map window to display across. The search
will return a list of matching results. Click on the name to zoom to the area on
the map. Listed below the name is the map sheet number for your reference.
Search results for the place name Tofino
Find Feature
Select the feature type you wish to search for. Once you select the feature type,
you will need to enter in the feature identifiers to find the feature.
The user can search for a specific feature using the Feature Search option
108 of 112
MapView User Manual
16.3.
Query Features
The Query Features option provides you with a prebuilt method to highlight or
select specific C&E features using existing values.
One you have defined your query, you can click the Highlight button to display
the feature(s) in the map window that match your criteria or click the Select
Features button to select the features in the map window.
If you select features you are able to extract information on the selected features
or run a report based on the selected features.
You can remove the highlighting by clicking the Clear Highlight button.
You can enter your Query selection in the Query Selection window
At least one parameter must be set before clicking the
Highlight or Select Features button.
The query will only return results that are in the map
window.
Opening Category
This query allows you to highlight or select openings by setting the Opening
Category Code, Licence Number, Client Number, and/or the disturbance
start/end date. The more options selected, the more restrictive the query will be.
Users can view the opening Category Code descriptions by clicking the
Descriptions link in the Opening Category Query window.
109 of 112
MapView User Manual
The highlighted openings are shown in yellow for the defined query
Declared Free Growing Openings
This query is designed to show all openings that have been declared free
growing. This design is opening-based so that all SUs must be declared Free
Growing prior to be highlighted. There are no parameters associated with this
query. It is to demonstrate simple thematic mapping that can be pre-set in
MapView.
Openings with no Free Growing
This query is designed to show all openings that have been declared as no free
growing. This design is opening-based so that all SUs must be declared No Free
Growing prior to be highlighted. There are no parameters associated with this
query. It is to demonstrate simple thematic mapping that can be pre-set in
MapView.
Declaration Past Due
This query is designed to show any openings that have not been declared that is
past due. This design is opening-based so that all SUs must be declared
Declaration Past Due prior to be highlighted. There are no parameters
associated with this query. It is to demonstrate simple thematic mapping that can
be pre-set in MapView.
110 of 112
MapView User Manual
16.4.
Identify
The Identify function assigns the identify layer from the layer selected bypassing
the need to set explicitly setting the identify layer via the Layers Function tab
(See Section 5.4).
To use, select the layer you want to identify in the information panel and then
click on a feature in the map window. The identify report will be generated in the
information panel.
You can select any of the options in the Identify list to indentify a map feature without
having to set it as the active identifiable layer in the Layer list.
If a layer is not turned on or not visible at a current scale, you
will see the following error. You will need to either turn the
layer on or zoom to a visible scale to identify one of these features.
Approved Cut Blocks
This option will allow you to identify features from the Approved Cut Blocks layer.
Once selected you can click on an Approved Cut Block feature in the map
window to return the identify results in the information panel.
111 of 112
MapView User Manual
Pending Cut Blocks
This option will allow you to identify features from the Pending Cut Blocks layer.
Once selected you can click on a Pending Cut Block feature in the map window
to return the identify results in the information panel.
Retired Cut Blocks
This option will allow you to identify features from the Retired Cut Blocks layer.
Once selected you can click on a Retired Cut Block feature in the map window to
return the identify results in the information panel.
Opening
This option will allow you to identify features from the Openings layer. Once
selected you can click on an Opening feature in the map window to return the
identify results in the information panel.
112 of 112

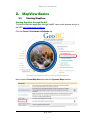
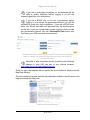
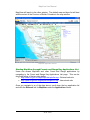
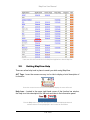
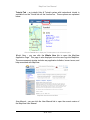
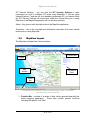
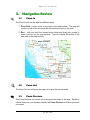
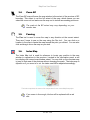
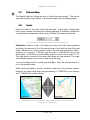
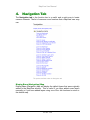
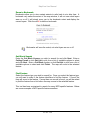
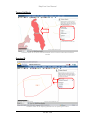
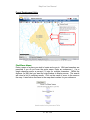
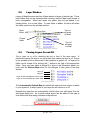
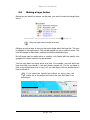
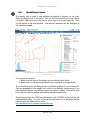
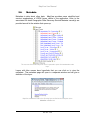
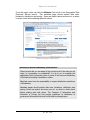
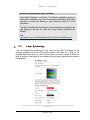
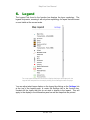
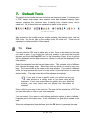
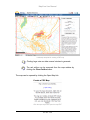
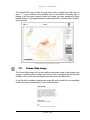
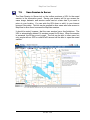
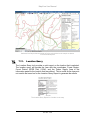
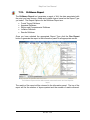
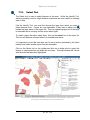
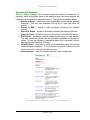
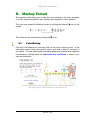
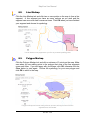
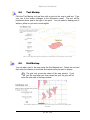
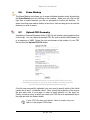
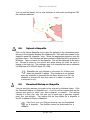
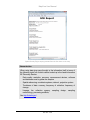
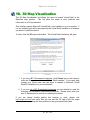
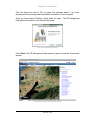
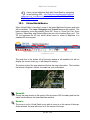
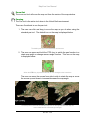
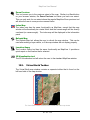
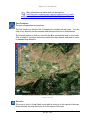
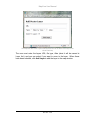
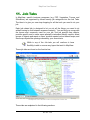
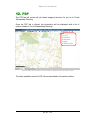
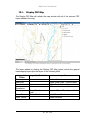
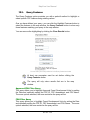
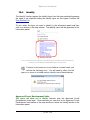
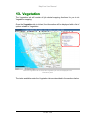
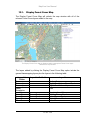

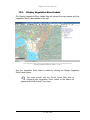
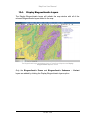
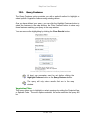
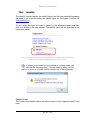
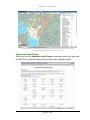
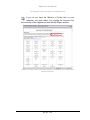
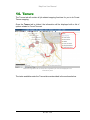
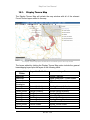
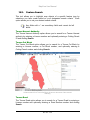
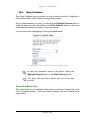
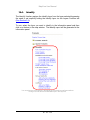
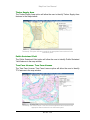
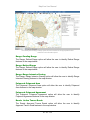
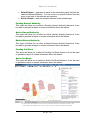
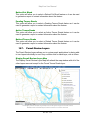
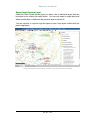
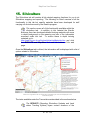
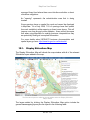
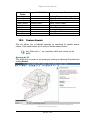
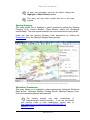
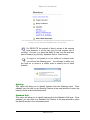
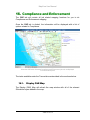
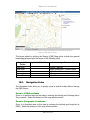
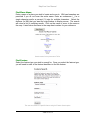
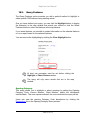
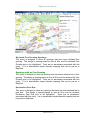
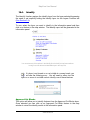


![000 CASORT [9].book](http://vs1.manualzilla.com/store/data/005753997_1-6c1117a0f29b8b2731a0aa33cfc5a43b-150x150.png)