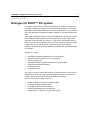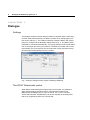
1
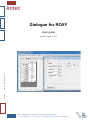
Dialogue for ROXY User guide Antec .... Proven Performance! 210.7017, Edition 2, 2011 Antec, Industrieweg 12, 2382 NV Zoeterwoude, The Netherlands T: +31 71 5813333, F: +31 71 5813334, E: [email protected], W: www.myantec.com CHAPTER 1 Table of contents 1 Copyright ©2011 Antec Leyden. All rights reserved. Contents of this publication may not be reproduced in any form or by any means (including electronic storage and retrieval or translation into a foreign language) without prior agreement and written consent from the copyright of the owner. The information contained in this document is subject to change without notice. ROXY Potentiostat, DECADE (I), INTRO, Sencell, Flexcell, Reactor, ISAAC, HyREF, LINK, ADF, DECADE Dialogue, ROXY Potentiostat Dialogue are trademarks of Antec Leyden BV. Whatman™ (word and device) and Whatman™ (word only) are trademarks of Whatman lnternational Ltd. SOLVENT IFD™ and AQUEOUS IFD™ are trademarks of Arbor Technologies, Inc. Clarity®, DataApex® are trademarks of DataApex Ltd. Microsoft® and Windows™ are trademarks of Microsoft Corporation. The information provided herein is believed to be reliable. Antec Leyden shall not be liable for errors contained herein or for incidental or consequential damages in connection with the furnishing, performance, or use of this manual. All use of the hardware or software shall be entirely at the user‟s own risk. 2 Dialogue for ROXY user guide, ed. 2 Table of contents Table of contents 2 Dialogue for ROXY™ EC system 3 Installation guide 4 System requirements 4 Installation 4 Running Dialogue software 5 Dialogue 6 Settings 6 The ROXY Potentiostat control 6 Cell control 7 Devices 7 Events 8 Operational modes 9 DC mode 9 Scan mode 10 Pulse mode 11 Events programming 12 Using DC mode to create MS Voltammograms 12 3-D MS Voltammogram 13 2-D MS Voltammogram 15 Using DC mode for the sample oxidation (Phase I) 16 Using DC mode for the sample oxidation and conjugation (Phase II) 17 Using scan mode to create MS Voltammograms 17 Using scan mode for the sample oxidation 19 Using pulse mode to clean the electrode 20 CHAPTER 1 Dialogue for ROXY™ EC system C H A P T E R 1 Dialogue for ROXY™ EC system The ROXY™ EC system is delivered with Dialogue™ software for ROXY (p/n 210.9005). Dialogue for Windows is a multi-functional program to control the DECADE II electrochemical detector and ROXY potentiostat. It runs simultaneously with Windows-compatible integration software or any other Windows program. The software package contains a set of event table files (*.evt) for the automated recording of mass voltammograms and parametric control of the events (detection mode, potential, flow rate, etc.). The set of pre-programmed event tables can be used as a starting point for your own research and can be easily modified to suit your specific needs. This document provides detailed background information about the supplied event table files and relevant Dialogue settings. Dialogue is a tool for: controlling all operational parameters incl. syringe pump programming timed events in one run or sequence scanning voltammetry potentiostat firmware upgrades using the FW upgrade wizard creating and transmitting time files PQ measurements noise measurement There are no tools for further data analysis, therefore Dialogue cannot be considered as fully featured chromatography software package. The free demo version of this program has already functionality implemented. The free version for the SDC is used for: firmware upgrades using the FW upgrade wizard controlling all operational parameters controlling IO ports for external devices creating, transmitting and running time files control of the LC 100 HPLC pump (isocratic mode) 3 4 Dialogue for ROXY user guide, ed. 2 C H A P T E R 2 Installation guide IMPORTANT: You must have ADMINISTRATOR rights to install Dialogue and the USB drivers. Windows 7 and Vista Dialogue is compatible with Windows 7 and Vista. Since Windows Vista it is not possible to write data in the C:\Program Files\Dialogue directory without changing security permissions. Therefore all data is now stored in the common applications directory for Windows, which is: Win 7 & Vista: C:\ProgramData\Dialogue Win XP: C:\Documents and Settings\All Users\Application Data\Dialogue Since Dialogue 201.786: Dialogue data & templates are located in 'My Documents' directory. System requirements Requirements 'demo' mode: PC with Windows 98 or higher (incl. NT, 2000, XP, Vista and 7). Microsoft Excel 2000 (or higher) Requirements 'real' mode: ROXY Potentiostat and syringe pump PC with Windows 98 or higher (incl. NT, 2000, XP, Vista and 7). free com ports for potentiostat and syringe pump USB port for license dongle Factory supplied serial cable (regular serial cables don't work!). Microsoft Excel 2000 (or higher) Installation Run setup file to install the Dialogue software Connect potentiostat and syringe pump with PC using factory supplied serial cables Switch on devices CHAPTER 2 Installation guide Run Dialogue software from Start menu (in 'Antec Leyden software') AFTER running Dialogue (which installs dongle drivers), insert the license dongle and restart software If no detector is present, Dialogue software will continue running in 'demo' mode. Running Dialogue software Run the Dialogue software from Windows start menu under 'Antec Leyden software'. If a detector is connected it is automatically detected. Otherwise the DEMO mode is activated. See Help file for further details. Log in password For first time users use the following name to log in: Admin Exactly like this (A = uppercase). No password required. Connect ROXY trigger cable to the potentiostat and to MS to enable trigger MS acquisition (MS should be in the “remote” mode and enable external trigger). Contact your MS supplier for the details. 5 6 Dialogue for ROXY user guide, ed. 2 C H A P T E R 3 Dialogue Settings The Dialogue software controls both the ROXY EC System and the mass spectrometer (start data-acquisition), the latter by means of an analog trigger (contact closure, RELAY 1). The COM port settings of both the ROXY and syringe pump are configured in the Dialogue settings menu (Fig. 1). The ROXY potentiostat will be connected automatically. The syringe pump must be connected by user to the proper port if the port number is not listed, the number can be entered manually. Once, the devices are connected click “fixed” to avoid scanning all ports when starting Dialogue for the next time. Fig. 1. Dialogue settings window (OptionsSettingsRS232). The ROXY Potentiostat control When ROXY Potentiostat and syringe pump are connected, it is possible to apply desired settings to ReactorCell or µ-PrepCell and syringe pump. Main window of Dialogue (Fig. 2) open access to Cell 1; Cell 2, Devices, Events and Data tabs. All parameters can be set manually in the designated tabs or by programming them in the Events tab. CHAPTER 3 Dialogue Fig. 2. Dialogue main window. Cell control tab in the DC mode. Cell control Most important parameter for EC/MS measurements is the cell on/off selector and the potential setting. Parameters are set in the Cell control window (Fig. 2) If data acquisition is used the range, filter, offset and run time can be set. Output range should be set to 200µA (It is default value since Dialogue 201.786). Devices In figure 3 the devices settings tab is shown. In this window all relevant syringe pump settings can be configured such as syringe volume, syringe diameter, flow rate and flow direction (infuse/withdraw). By means of the start/stop buttons the pump can be activated with the configured settings. Fig. 3. Dialogue syringe pump settings window. 7 8 Dialogue for ROXY user guide, ed. 2 Events The ‘Events’ tab in Dialogue (figure 4) offers the possibility to compose an event table for the execution of an automated sequence of parametric control events. It is used for the automated recording of for instance a mass voltammogram with the ROXY EC system (see next paragraph). The event table consists of a series of data lines in which settings of the ROXY potentiostat or infusing pump can be changed with 0.01 min (0.6 s) time resolution. To start the execution of the command: Press “Start” in the Events tab. If data acquisition is required: Check the box “Start/Stop with run” Go to pull down menu OptionsStart run (data in excel file will be saved). Check the box “Repeats” to repeat the program if required, type the number of repeats in the appropriate box. The events can be opened and saved in File pull down menu. The list of available programs and details about MS Voltammograms acquisition are described in the further sections of this user guide. Fig. 4. Dialogue Events window. CHAPTER 3 Dialogue 9 Table 1. Commands used in events programming. Parameter Value Description Syr Flow Rate 0.1 - 1000µL/min Setting the flow rate of the syringe pump Syr Pump Start/Stop Start/Stop of the syringe pump Cell on/off ON/OFF Turn on/off of the Cell Ecell DC -4.9/+4.9V Applying voltage on the Cell Output A relay1 Starting run on the MS Output A Inactive Switching relay off for next trigger signal Scan E1..2, rate, type 0.00,1.00, 20, c Set the scan parameters (coma separated): E1, E2, scan rate: 1,2,5,10,20, 50mV/s, scan type: h(alf); f(ull); c(ontinuous) Scan ON/OFF Start/Stop Start/Stop of the scan Pulse E1..3, t1..3, ts 2.00, -2.00, 0.00, 300, 200, 200, 20 Set the pulse parameters (coma separated): E1, E2, E3, t1, t2, t3 (0-2000ms), ts (multiple of 20 ms) EC Conditions Current/from file Load the currently used EC conditions or saved in file (range, EC, ) Operational modes Three operational modes are available: DC, pulse and scan and can be set in “Select mode” after acknowledgement by 'OK'. Changing mode will set the cell to 'off' and all operational parameters are queried. Fig. 5. Select mode window (Options Detection mode). DC mode In DC mode a constant potential is applied. It can be used in EC/MS for MS Voltammograms recording and potential optimization as well as for continuous synthesis of specific metabolites with the highest yield. Changing parameters in DC mode will have immediate effect, unless an 'Apply' button is present (Cell and Acquisition parameters). Cell potential 'E' in DC mode and status 'Cell' can be set and confirmed ('Apply'). The ' I cell' (current) is queried every second. If the current is in overload a message appears. If cell is off background colour is orange. E aux is potential measured on auxiliary electrode and is usually 50 - 500 mV different from E cell. 10 Dialogue for ROXY user guide, ed. 2 Auto zero will set the output (V out) to zero or off set voltage. Selecting Auto zero 'off' releases the offset voltage. Fig. 2 shows the cell control window in DC mode. Scan mode In the scan mode after starting a scan the potential is ramped between two extremes (E1, E2). In the resting state E1 is applied. Before starting, the scan speed is set and the type of scan (half, full or continuous). In EC/MS the scan mode is used for fast MS Voltammogram acquisition (less than 3 min is possible) and for continuous metabolite synthesis or compound oxidation with range of potentials what can result in the set of metabolites formation. In the figure 6 the scan mode is explained. Fig. 6. Operation principle of scan mode. Parameters: E1: scan starting potential E2: scan maximum potential Rate: scan rate 1 - 50 mV/s Scan: scan cycle half, full or continuous If a half or full scan starts, the 'Acquisition time' is adjusted automatically To start the scanning go to OptionsStart run. CHAPTER 3 Dialogue 11 Fig. 7. Scan mode configuration window. Pulse mode In the Pulse mode the potential follows a triple step block potential. In contrast to the scan mode, the pulse is applied immediately and continuously when switching on the cell. In EC/MS the pulse mode is used for example the regeneration of the electrode if the performance of the cell decrease without cell disassembly. Parameters in pulse mode (Fig. 8): E1: measuring potential E2: cleaning potential, oxidative E3: cleaning potential, reductive ts: sampling time, multiples of 20 ms t1: delay + sampling time t2: time of oxidative cleaning step (0 - 2000 ms, 10 ms steps) t3: time of reductive cleaning step (0 - 2000 ms, 10 ms steps) Fig. 8. Operation principle of pulse mode. 12 Dialogue for ROXY user guide, ed. 2 C H A P T E R 4 Events programming A number of example event files is installed in the „templates‟ directory with the Dialogue software.(see Table 2). Table 2. List of the programs supplied with Dialogue. Event name Description 3D_MS_Voltammogram_100_ 3-D MS Voltammogram, for each potential 2000mV mass spectra are saved in separate data files. Suitable for GC electrode. 3D_MS_Voltammogram_100_ 3-D MS Voltammogram, for each potential 3000mV mass spectra are saved in separate data files. Suitable for MD electrode. 2D_MS_Voltammogram_100_ 2-D MS Voltammogram, the data are 2000mV saved in one file. Suitable for GC electrode. 2D_MS_Voltammogram_100_ 2-D MS Voltammogram, the data are 3000mV saved in one file. Suitable for MD electrode. Phase2 Method used for oxidation of the sample at 800mV and conjugation of the oxidation products with another compound. Cleaning_pulse_mode Program for the electrochemical cleaning of the electrode. Applicable for MD and GC electrodes. Note that the supplied programs are exemplary and may need further optimization. Using DC mode to create MS Voltammograms An MS Voltammogram is obtained using a syringe pump with continuous infusion of analyte (FIA) through the ReactorCell to the MS. The potential is incremented in a couple of steps and mass spectra are collected. Event files are available to automate this procedure. The Dialogue controls the syringe pump, the potentiostat and triggers the acquisition of mass spectra at CHAPTER 4 Events programming 13 the designated cell potentials. A three dimensional MS voltammogram (Fig. 9) visualizes the ion abundance versus m/z as a function of applied potential to the electrochemical cell. With a mass voltammogram the optimal potential can be determined for electrochemical generation of the desired metabolite for further research, e.g., NMR. Furthermore, the 2-D version of MS Voltammogram can be recorded and the data can be saved in one MS file, as presented in the figure 11. This plot can be quickly generated with any of MS software. 3-D MS Voltammogram In the figure 9, the 3-D MS voltammogram of amodiaquine is shown. To oxidized Amodiaquine was oxidized with 400mV to its dehydrogenated metabolite (m/z 354). To form the other two metabolites (m/z 299 and 326) the higher potential was required (1200mV). For each cell potential mass spectra are recorded and saved in separate data files. It simplifies data handling and the construction of the MS Voltammogram. Fig. 9. 3-D MS Voltammogram of Amodiaquine. The plot is reconstructed from the separate mass spectra saved for each potential value. The plot was made using Origin. To acquire data for 3-D Voltammogram the supplied event program can be used (e.g. 3D_MS_Voltammogram_100_2000mV or 3D_MS_Voltammogram _100_ 3000mV). The programs start with the measurement with switching on the Cell, and subsequently the Cell potential is ramped from 100 – 2000 mV (or 3000mV) with incremental steps of 100 mV every 0.5 minute. For each cell potential mass spectra are recorded for 0.45 minute and saved in separate data files (21 files (or 31 files, respectively) in total (including the measurement with the Cell off)). 14 Dialogue for ROXY user guide, ed. 2 The first acquisition of a mass spectrum starts after 1.5 minute delay and will contain data for the Cell off. The delay is calculated based on the following parameters (delay time > Vd/F): The dead volume Vd between ReactorCell and the ion source of the mass spectrometer. For p/n 180.0219 “ROXY outlet assembly 2, MS” this volume is 12.7 µL (1 meter red PEEK tubing ID 127µm, see reference 1) The flow rate F of the syringe infusion pump, in this case is 10 µL/min. A slightly longer delay time is taken than based on the calculation to compensate for the tolerance in tubing inner diameter (affects volume) and dilution in the tubing (Poiseuille flow profile). The dalay time depends on the tubing type and length (dead volume) and flow rate. Calculate the delay time when different than supplied tubing is used or the flow rate is changed. Adjust the programms if required. The start of the mass spectrometer run is triggered by means of RELAY 1. The run duration is set to 0.45 minutes in the mass spectrometer data-acquisition software, and each MS analysis will stop after 0.45min (MS analysis time was set to 0.45min in the MS software). The operation principle is shown graphically in the figure 10. Fig. 10. Operation principle of mass voltammogram acquisition. MS – mass spectrometer. Red labeled time indicates the potential change; black labeled time corresponds to beginning and end of the MS acquisition. Details see text. To execute the program for 3-D Voltammogram: 1. Go to pull down menu: File Open Events and choose the program: e.g. 3D_MS_Voltammogram_100_2000mV (for GC electrode). 2. Go to events tab and press Start CHAPTER 4 Events programming 15 2-D MS Voltammogram Additionally, 2-D MS Voltammogram can be recorded and the data can be saved in one MS file, as presented in the figure 11. This plot can be quickly generated with data analysis software of any MS. Fig. 11. 2-D MS Voltammogram of Amodiaquine. The mass spectra are saved in one file for whole analysis. EIC are representing the changes in oxidation of the Amodiaquine with respect to the potential applied. Dialogue contains two additional programs that allow to acquire 2-D MS Voltammograms: 2D_MS_Voltammogram_100_2000mV and 2D_MS_Voltammo gram_100_3000mV. The first event table, is based on the program for the acquisition of a mass voltammogram in the voltage range of 100 – 2000 mV with 100 mV steps (See Table 2) but the data will be saved in one MS file. The second program has the potential range up to 3000mV. Mass spectrometry allows the sample identification (determining the elemental composition, structure elucidation) and all ions having specific m/z ratios are plotted in the mass spectrum. Mass spectrometry data can be presented in form of mass chromatogram, e.g., the extracted ion chromatogram (EIC) in which a specific metabolites/oxidation products are monitored throughout the entire run, and a particular analyte's mass-to-charge ratios are plotted at every point during the analysis. The optimal potential can be estimated from EIC plots. 16 Dialogue for ROXY user guide, ed. 2 Data can be presented as extracted ion chromatogram (figure 11) of desired m/z ratio value, in case of amodiaquine m/z of 356; 354; 326 and 299 are traced. With help of the figure 11, where EICs are presented, it is easy to estimate the potential range in which the desired metabolite will have the highest abundance. E.g., for metabolite at m/z 354 the best will be potential 300-400 mV, however to form the metabolites 326 and 299 the higher value of potential (1200 mV) should be applied. To execute the program for 2-D Voltammogram: 1. Go to pull down menu: File Open Events and choose the program: e.g. 2D_MS_Voltammogram_100_2000mV (for GC electrode) 2. Go to Events tab and press “Start”. Using DC mode for the sample oxidation (Phase I) Phase I metabolites are oxidation reaction products of drug candidates. Continuous infusion of analyte (FIA) through the ReactorCell is used to mimick the Cytochrome P450 reaction in the liver. After estimating the potential using MS Voltammogram the sample can be oxidized in DC mode by applying the optimal potential. The simplest way is just to set the value in the cell control window and click “Apply”. Figure 12 shows the example of applying different potentials in the DC mode. The potential was applied as follow: 1. Cell OFF (no metabolites observed*) 2. 300mV (metabolite at m/z of 354) 3. 1200mV (metabolites at m/z of 299 and 326) 4. Cell OFF (no metabolites observed) *Metabolite at m/z of 354 was observed in solution with cell OFF, but applying the potential shows clearly its abundance increase. CHAPTER 4 Events programming 17 Fig. 12. Example of sample oxidation in DC mode. The potential changes can be automated by programming the desired steps in the events tab. Using DC mode for the sample oxidation and conjugation (Phase II) Phase II metabolite studies are based on conjugation of oxidation products with a substrate molecule, such as glutathione for example. In the conjugation experiments (phase II) the adduct formation of reactive metabolite(s) with reagents like glutathione can be analyzed. Dialogue is supplied with the example of event program for the acquisition of conjugation experiment. The program run time is 15.10 minutes in total. The acquisition of mass spectrum start after 5.0 minute delay and will contain data for Cell OFF. Subsequently, for 5 minutes the mass spectra are collected with the Cell at an applied potential of 800mV (the value is set is program and can be adjusted). All mass spectra are stored in one file. Using scan mode to create MS Voltammograms Scan mode can be used for sample oxidation and for creating the MS Voltammograms. Continuous infusion of analyte (FIA) through the ReactorCell is used in combination with continuous scanning of potential. The resulting oxidation products are measured in MS. The E1 and E2 must be specify in the range the MS Voltammogram will be acquired. Set the scan rate to desired value (e.g. 10mV/s). Set the scan type to half and start the run (the data will be saved in excel document). 18 Dialogue for ROXY user guide, ed. 2 1. Set the wide potential window, e.g., set E1 to 0 V and E2 to 2 V for GC electrode. 2. Turn ON cell 3. Go to OptionsStart run (Excel file will be saved) 4. Calculate the dead volume between ReactorCell and the ionization source of the mass spectrometer and recalculate the potentials to corresponding analysis time points (Fig. 7). 5. Estimate the potential value where the best results were obtained and desired product was formed with the highest yield (follow the EIC of the m/z ratio of the selected compound) (Fig. 8). 6. Check neighbouring potentials if the estimation made in point 5 was accurate. E.g. from figure 7 the optimal potential is between 1050 mV to 1250 mV. 1100 mV was chosen to further tests, but also 1200 mV and 1000mV were checked. 7. Use the potential established in points 5 and 6 to oxidize the sample to give the desired products in DC mode or range of potential in the scan mode (for details how to use the scan mode for compound oxidation see further section of this user manual). Fig. 13. Scanning voltammetry of 10 mol/l amodiaquine at a glassy carbon working electrode, at a scan speed of 10 mV/s and E1=0 and E2 = 1500mV. The m/z ratios of different metabolites of Amodiaquine are plotted (see legend). CHAPTER 4 Events programming 19 Fig. 14. Scanning voltammetry of 10 mol/l amodiaquine at a glassy carbon working electrode, at a scan speed of 10 mV/s and E1=0 and E2 = 1500mV. The m/z of 326 is plotted. The shadow area shows the optimum potential range, 1050 – 1250mV. Using scan mode for the sample oxidation The scan mode can be used for efficient sample oxidation. The advantage of scan over the DC mode is that the electrode surface is being regenerated during scanning and the cleaning of the electrode is required on the less frequent base. Additionally, using the scan mode it is possible to generate the set of metabolites that are formed within the scanned range, however, higher metabolites yield can be achieved for some of the compounds in the DC mode. Figure 15 shows the example of scanning experiment. 10µM of Amodiaquine was scanned in range of 300-1200mV, since the optimal potential for formation of the metabolite at m/z of 354 was 300mV and metabolites at m/z of 326 and 299, the potential was 1100 and 1200mV, respectively. It is clearly seen that metabolite 354 can be formed at higest yield when DC potential of 300 mV was applied, however in scan mode all metabolites are detected. In the DC mode the metabolite 354 is not seen at higher potentials (See Fig. 6). 20 Dialogue for ROXY user guide, ed. 2 Fig. 15. Scanning for sample oxidation (Amodiaquine). E1=300 mV; E2 = 1200 mV; scan rate was 50 µA/s, continuous. It is possible to program scanning in the Events table. Using pulse mode to clean the electrode This cleaning procedure is suitable for both MD and GC electrodes. 1. Refill the syringe with the mobile phase containing the supporting electrolyte, e.g., the same mobile phase used for oxidation of the sample and start the flow rate (20-50µL/min). 2. Go to the Options pull down menu and choose “Detection mode”. 3. Select Pulse mode and click OK. 4. Set the parameters in the cell control window (Fig. 19; Table 3). It is recommended to set the Output Range to 200 µA. 5. Set Run time value to 5 min and turn on the cell. 6. Go to Options pull down menu and click Start Run (Fig. 20). Program will ask to save the data (The excel file will be created). And start the acquisition. 7. After the cleaning procedure turn OFF the cell and leave the flow for additional 1-2min. Table 3. Cleaning pulse parameters. CHAPTER 4 Events programming Parameter 21 Value E1 +2V E2 -2V E3 0V t1 1000 ms t2 1000 ms t3 0 ms ts 20 ms Output range 200µA Fig. 16. The cell settings in the pulse mode for MD electrode cleaning. The cleaning procedure is available also as a program (Cleaning_Pulse_Mode_rev01.evt) and can be executed automatically via events window. The method can be found in My Documents and in the subfolders: Dialogue\Templates. Note that to start pulsing using the Events program you need to change detection mode to Pulse first. In case that no significant improvement of the cell performance is seen: 1. For MD electrode use the additional procedure described the Chapter Maintenance Magic Diamond electrode of the relevant Cell user manual. 2. For GC electrode you can polish the electrode manually as described in the Polishing of the GC electrode chapter of the relevant Cell user manual. Manual numbers: 204.0010 (µ-PrepCell) and 201.7014 (ReactorCell). 22 Dialogue for ROXY user guide, ed. 2