1
09 - Batch
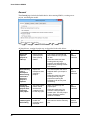
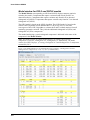
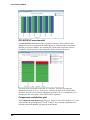
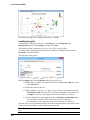
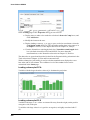
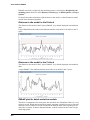
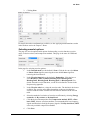
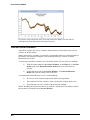
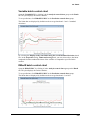
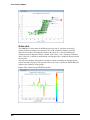
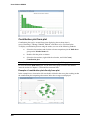
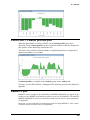
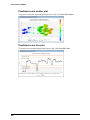
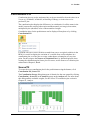
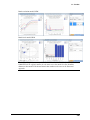
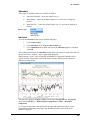
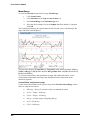
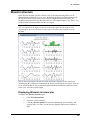
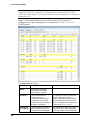
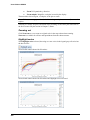
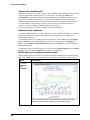
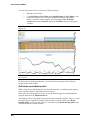
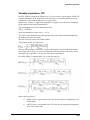
Variable batch control chart
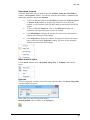
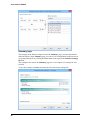
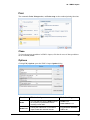
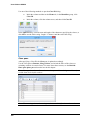
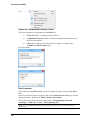
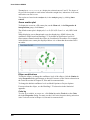
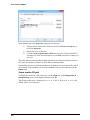
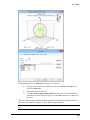
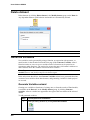
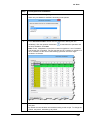
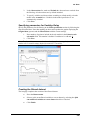
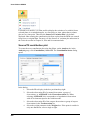
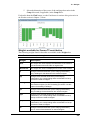
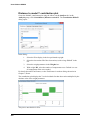
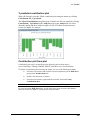
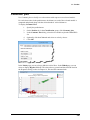
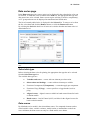
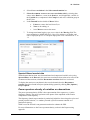
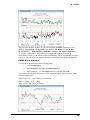
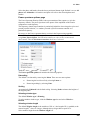
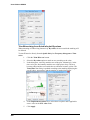
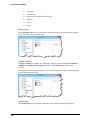
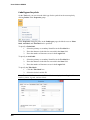
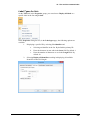
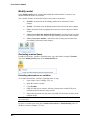
Open the Variable BCC by clicking it in the Analysis control chart group on the Batch
tab. This plot displays the workset batches.
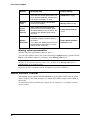
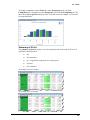
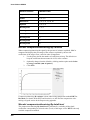
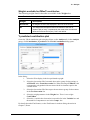
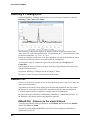
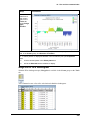
To see predictions, click DModX PS BCC in the Prediction control chart group.
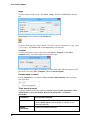
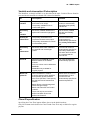
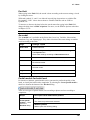
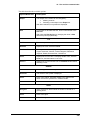
The limits that are displayed by default are the Average batch and -3 and +3 standard
deviations.
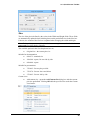
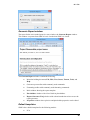
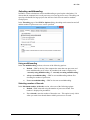
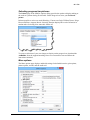
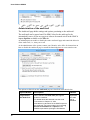
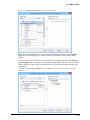
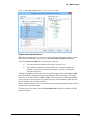
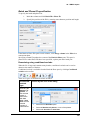
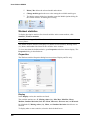
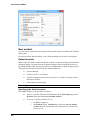
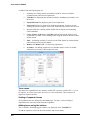
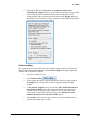
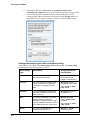
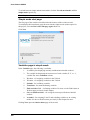
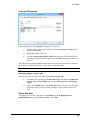
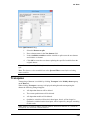
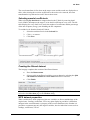
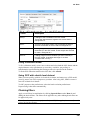
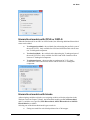
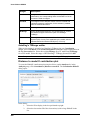
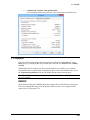
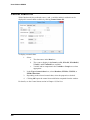
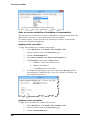
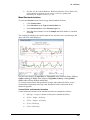
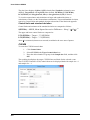
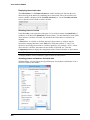
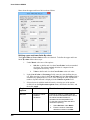
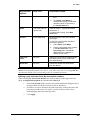
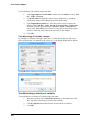
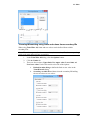
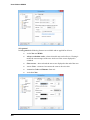
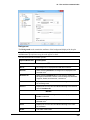
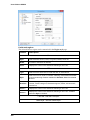
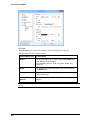
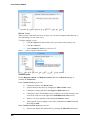
By selecting the Display steady state limits using the overall standard deviation check
box, in the Properties dialog, Limits and averages tab, you can select to have the limits
computed from the standard deviation of the variable as computed or specified in the
workset.
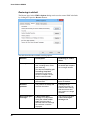
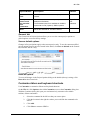
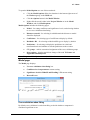
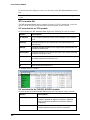
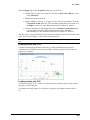
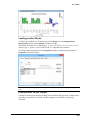
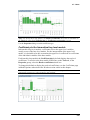
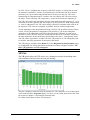
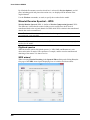
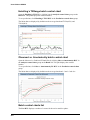
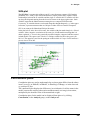
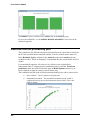
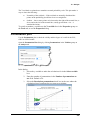
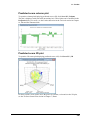
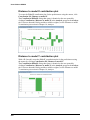
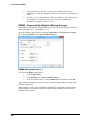
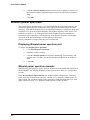
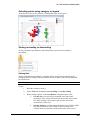
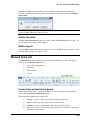
DModX batch control chart
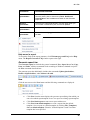
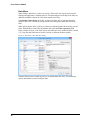
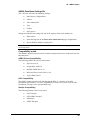
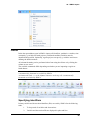
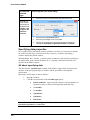
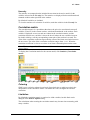
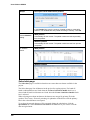
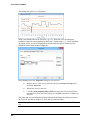
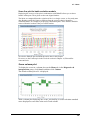
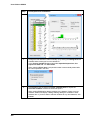
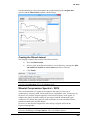
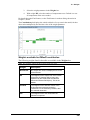
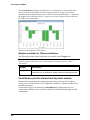
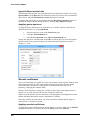
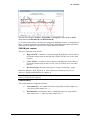
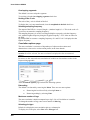
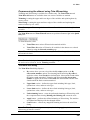
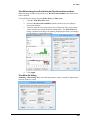
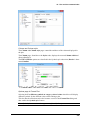
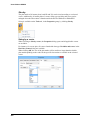
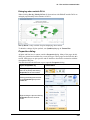
Open the DModX BCC by clicking it in the Analysis control chart group on the Batch
tab. This plot displays the workset batches.
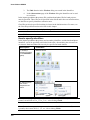
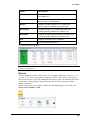
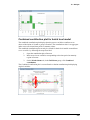
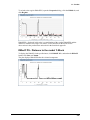
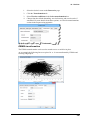
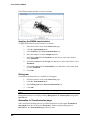
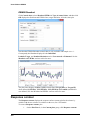
To see predictions, click DModX PS BCC in the Prediction control chart group.
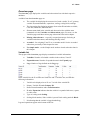
The limits that are displayed by default are the Average batch and +3 std. dev.
273