1
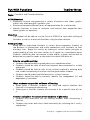
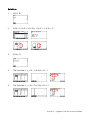
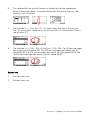
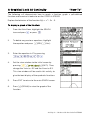
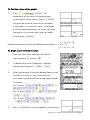
CASIO Education Workbook Series
ACTIVITY SAMPLES
with the
CASIO fx-9750GII
WHAT’S INSIDE:
• Algebra I: Fun with Functions
• Algebra II: Saving for a Rainy Day
• Geometry: Quite the Quadrilateral
• Statistcs: The Cost of Car Insurance
• Pre-Calculus: Area of a Triangle and Circular Sector
• Calculus: A Graphical Look at Continuity
Fun With Functions
Teacher Notes
Topic: Functions and Function Notation
NCTM Standard:
• Represent, analyze, and generalize a variety of patterns with tables, graphs,
words, and, when possible, symbolic rules.
• Relate and compare different forms of representation for a relationship.
• Identify functions as linear or nonlinear and contrast their properties from
tables, graphs, or equations.
Objective
The student will be able to use the Casio fx-9750GII to input data relating to
functions as well as to evaluate functions using function notation.
Getting Started
Being able to understand functions in various forms empowers students to
see patterns in relationships and make connections with functions to their
everyday lives. Begin this activity by looking at various tables and gain an
understanding of how that data relates to its graph on a coordinate plane.
Students should be able to examine a table and/or a graph and be able to
determine any specific trends or characteristics about that data set.
Prior to using this activity:
• Students should be able to graph points on a coordinate plane.
• Students should be able to read and interpret data presented in a table
and graph.
• Students should be familiar with all key strokes involved in entering data
into a table and entering a function into the graph editor window.
• Students should understand the formula for a linear function.
• Students should be able to correctly identify the independent (x) and
dependent (y) variables.
Ways students can provide evidence of learning:
• When given a function, students can state and explain whether that
function is increasing or decreasing.
• When given a function, students can evaluate it for a specific value of x or
y.
Common calculator or content errors students might make:
• Students may incorrectly set the viewing window when showcasing a
function.
• Students may enter data into a table incorrectly by switching the x- and ycoordinates.
Activity 4 • Algebra I with the Casio fx-9750GII
Fun With Functions
“How To”
The following will demonstrate how to store a value for a variable, input a function
to generate a table, and enter data into a table to construct a graph with the Casio
fx-9750 GII.
To store a value for a variable:
1.
To store 5 for the variable x, input:
5bfl.
To input a function and generate a table:
1.
From the Main Menu, highlight the TABLE icon
and press l or 5.
2.
To enter a function such as 3x – 1,
input: 3f-1l.
3.
The equal sign to the right of Y1: is
highlighted to indicate this function is active.
4.
To generate a table of values for the selected
function, press u(TABL).
The default x-values for the table menu is x
starts 1, ends at 5 and increases by steps of 1.
5.
To navigate through the table, use the replay pad
!$BN.
To adjust the values in a table:
1.
Use d to return to the TABLE home screen. Press
y(SET) to change the default table values.
Enter 0 for the start value, 20 for the end value
and a step value of 1, pressing l after each entry.
Activity 4 • Algebra I with the Casio fx-9750GII
2.
Press d then u(TABL) to display the
table.
3.
To display a corresponding y-value for a specific
x-value, highlight any x-value and enter the desired
value.
To display the corresponding y-value when
x = 18, input 18l.
Note: You do not need to change the tables
settings; you could just enter all given x-values
and create a custom table.
To enter data into a list and graph the data:
1.
From the Main Menu, highlight the STAT icon
and press l or 2.
2.
In List 1, input: 1l2l3l.
3.
Press $ to move the cursor to List 2.
4.
In List 2, input: 3l5l7l.
5.
Press q(GRPH), then q to select Graph 1
(the default graph type is a scatterplot).
6.
Press q(CALC) for regression options.
7.
Since the data appears linear, press w(X)
to calculate linear regression (line of best fit).
8.
Press q(ax +b) for slope-intercept form of a
line. Substitute the a- and b-values displayed
into the given formula.
When the correlation coefficient, r, equals 1,
you have a perfect regression.
Activity 4 • Algebra I with the Casio fx-9750GII
Fun With Functions
Activity
Functions help establish various types of numeric patterns, based upon whether
those functions are linear, quadratic, cubic, etc. Building a strong foundation in
Algebra includes a comprehensive study of linear functions. Functions are a rule
used to calculate values. Functions are written using a specific notation called
function notation. Each function has an independent and a dependent variable. The
independent variable is the value you get to choose or control. The dependent
variable is the value created when the independent variable is plugged into the
function. Another name for the independent variable is the “input” and for the
dependent variable is the “output”. We will define a series of coordinate points as a
relation.
In this activity, we will explore how to assign a single value to a variable and
evaluate a given function. We will also explore how to input a function and
generate a table of values as well as enter points in a data set and determine the
function.
Functions can be expressed in these different forms:
1.
The Slope-Intercept Form of a Line is defined as y = mx + b; where m
represents the slope of the line, b represents the y-intercept, x represents the
independent variable and y represents the dependent variable.
2.
The Standard Form of a Line is defined as Ax + By = C where A, B, and C
are integers and x represents the independent variable while y represents the
dependent variable.
3.
f(x) is often described as function notation. In this example, where
f(x) = 5x – 3, x represents the independent variable and f(x) is synonymous
with y, representing the dependent variable.
Remember when graphing a function, it must pass the Vertical Line Test. A function
is defined as a relation where for every one x-value, there is one and only one yvalue. When looking at the graph, if any two points appear directly above each
other, the graph fails the vertical line test and thus, the relation is not a function.
Activity 4 • Algebra I with the Casio fx-9750GII
Questions
1.
Given the function f(x) = 3x + 7, evaluate the function at f(4).
_________________________________________________________________
2.
Given the function f(x) = -2x – 5, evaluate the function where -5 < x < -1.
(Let x = set of integers)
_________________________________________________________________
3.
Given the function f(x) = 2x2 + 6x – 5, evaluate the function at f(-2).
_________________________________________________________________
4.
Enter the data into the calculator and determine the linear function.
List 1
List 2
1
2
2
3
5
8
4
11
_________________________________________________________________
5.
Enter the data into the calculator and determine the linear function.
List 1
List 2
1
−1
2
5
17
32
8
47
_________________________________________________________________
Activity 4 • Algebra I with the Casio fx-9750GII
6.
Enter the data into the calculator and determine the linear function.
List 1
List 2
0
8
2
5
6
3
2
0
_________________________________________________________________
7.
Lauren works as a babysitter to earn some extra money. She charges her
customers seven dollars an hour. Write a function to determine the amount
of money Lauren will earn if she works x hours. How much money will she
earn if she works 4 hours? 7 hours? 11 hours?
_________________________________________________________________
_________________________________________________________________
8.
A cell phone company charges its customers $30 per month for phone calls
plus an additional charge of seven cents per text message after the first 50
text messages. Write a function that accurately models how much money
you will spend per month with this plan. How much money will you spend if
you send 50 text messages per month? 100 text messages per month? 225
text messages per month? 500 text messages per month?
_________________________________________________________________
_________________________________________________________________
_________________________________________________________________
Extension
1.
Create a data set that models a function which is non-linear.
_________________________________________________________________
_________________________________________________________________
2.
Write a non-linear function and evaluate that function where -5 < x < 5.
_________________________________________________________________
_________________________________________________________________
Activity 4 • Algebra I with the Casio fx-9750GII
Solutions
1.
f(4) = 19
2.
f(-5) = 5, f(-4) = 3, f(-3) = 1, f(-2) = -1, f(-1) = -3
3.
f(-2)= -9
4.
The function is: y = 3x – 1 or f(x) = 3x – 1
5.
The function is y = 5x + 7 or f(x) = 5x + 7
Activity 4 • Algebra I with the Casio fx-9750GII
6.
This relation fails the vertical line test as evident by the two coordinates
directly above each other. Since the relation fails the vertical line test, the
relation is not a function.
7.
The function is y = 7x or f(x) = 7x. If Lauren works four hours, she will earn
$28. If Lauren works seven hours, she will earn $49. If Lauren works 11 hours,
she will earn $77.
8.
The function is y = .07(x - 50) + 30 or f(x) = .07(x - 50). For 50 text messages
per month, you will spend $30. For 100 text messages per month, you will
spend $33.50. For 225 text messages per month, you will spend $42.25 and
for 500 text messages per month, you will spend $61.50.
Extensions
1.
Answers may vary.
2.
Answers may vary.
Activity 4 • Algebra I with the Casio fx-9750GII
Saving for a Rainy Day
Teacher Notes
Topic Area: Patterns and Functions – Algebraic Thinking
NCTM Standard:
• Understand patterns, relations, and functions by interpreting representations
of functions of two variables using symbolic algebra to explain mathematical
relationships.
Objective
Given a set of formulas, the student will be able to use the GRAPH Menu and
G-Solve Function to solve problems involving the investment of money.
Getting Started
Discuss the importance of saving money and the difference between simple
and compound interest.
Prior to using this activity:
• Students should have a working knowledge of using the calculator to enter
various formulas and display the corresponding graph.
• Students should be able to use the G-Solve Function to find specific x- and
y-values.
Ways students can provide evidence of learning:
• The students will be able to discuss the results of the activity and justify
their answers to specific questions.
• The students will be able to discuss how the graphical results correlate to
their answers.
Common calculator or content errors students might make:
• When there are multiple formulas used, students could utilize the wrong
formula or substitute the incorrect information for a particular variable.
Definitions
• Interest & Compound Interest
• Principal
• Rate of Interest
• Future value
Formulas
[
]
P
(1 + i)n − 1
i
log(1 + iF ÷ P)
Number of Payments: N =
log(1 + i)
Future Value of an Annuity: A =
Monthly Payment for a Desired Future Value: P =
[Note: Variables
defined in Activity]
iF
(1 + i)n − 1
Activity 2 • Algebra II with the Casio fx-9750GII
Saving for a Rainy Day
“How To”
The following will demonstrate how to enter a given formula into the GRAPH
module the Casio fx-9750GII, graph the data, and use G-Solve to find x- and yvalues.
Example Formulas:
⎛1+ r⎞
A = P⎜
⎟
⎝ n ⎠
A = nP
(1+r)n
n
where n = 4, P = 100, and r = x
where n = x, P = 1000, and r = 0.05
Steps for using the GRAPH Menu:
1.
From the Main Menu, press 3 for the GRAPH icon.
2.
Enter the first formula into Y1: by entering:
1000(1+fz4)^4l.
3.
Enter the second formula into Y2: by inputting:
(fm1000)M((
1+.05)^f)l.
To select the viewing window for the graph of this data:
1.
Press the B once, then press q to deselect Y2:
2.
Press u to display the graph of YI:.
3.
Press Lw(V-Window), theny(AUTO).
4.
To see only the first quadrant, press Le0l
N three times, 0thenl three times.
Activity 2 • Algebra II with the Casio fx-9750GII
Steps for using G-Solve:
1.
Press Ly(G-Solv), u( > )and q(Y-CAL).
2.
To find the y-value when x = 0.1, input the following:
.1l.
3.
Press Ly(G-Solv), u( > ) and w(X-CAL).
4.
To find the x-value when y = 2000, input the
following: 2000l.
Activity 2 • Algebra II with the Casio fx-9750GII
Saving for a Rainy Day
Activity
Investing for the future is usually the last thing on a person’s mind when they are
just entering the workforce. Paying bills, buying groceries, and purchasing a home
are usually at the top of the list. However, putting money away in some form of
savings should be the number one priority of every budget. Social security and
retirement plans are often not enough to allow a person to continue to afford their
current lifestyle.
In this activity, you will investigate how much a single investment will earn, calculate
the balance of an account with a given monthly payment, and determine the
investment amount that is needed to reach a specific financial goal.
Questions
The future value of an annuity can be calculated using the following formula:
A=
P
i
[(1 + i) − 1]
n
Where A is the ending balance, P is the principal, i is the rate of interest, and n is the
number of times the interest is calculated.
1.
What would be the future value of an annuity if $1000 is invested yearly for 5
years at 2.5% APR?
_________________________________________________________________
2.
What would be the future value of an annuity if $1000 is invested yearly for 5
years at 4% APR?
_________________________________________________________________
3.
What would be the future value of an annuity if $1000 is invested yearly for 5
years at 10% APR?
_________________________________________________________________
4.
What would be the future value of an annuity if $10,000 is invested yearly for
5 years at 2.5% APR?
_________________________________________________________________
Activity 2 • Algebra II with the Casio fx-9750GII
5.
What would be the future value of an annuity if $10,000 is invested yearly for
5 years at 4% APR?
_________________________________________________________________
6.
What would be the future value of an annuity if $10,000 is invested yearly for
5 years at 10% APR?
_________________________________________________________________
7.
For a principal amount of $10,000, what is the difference between the amount
of income earned at 2.5% and the amount of income earned at 10%?
_________________________________________________________________
8.
How long would it take for an investment of $500, earning 4% APR,
compounded annually, to earn $1,000?
_________________________________________________________________
9.
How long would it take for an investment of $500, earning 4% APR,
compounded annually, to earn $2,000?
_________________________________________________________________
10.
How long would it take for an investment of $500, earning 4% APR,
compounded annually, to earn $3,000?
_________________________________________________________________
11.
How long would take to earn $5,000?
_________________________________________________________________
The formula for finding the number of payments, at a given percent, for a particular
annual investment, to reach a specified goal is:
N=
log(1 + iF ÷ P)
log(1 + i)
Where N is the number of payments, i is the interest rate, F is the future value of the
investment, and P is the monthly amount invested.
Activity 2 • Algebra II with the Casio fx-9750GII
12.
Calculate the future value of an investment of $100 a year, at 5% APR, for 10
years.
_________________________________________________________________
13.
Calculate the future value of an investment of $100 a year, at 5% APR, for 30
years.
_________________________________________________________________
14.
Calculate the difference between question 12 and question 13.
_________________________________________________________________
15.
Calculate the future value of an investment of $500 a month, at 5% APR, for
10 years.
_________________________________________________________________
16.
Calculate the future value of an investment of $500 a month, at 5% APR, for
30 years.
_________________________________________________________________
17.
Calculate the difference between question 15 and question 16.
_________________________________________________________________
The smart move is to start investing early and put aside a set amount each year.
The formula for finding the amount of money earned from an annual investment at a
given rate is:
P=
iF
(1 + i)n − 1
Where P is the annual amount invested, i is the rate of interest, n is the number of
times the interest is calculated, and F is the future value of the investment.
18.
Calculate the annual investment needed at 10% APR to earn $100,000 in 10
years.
_________________________________________________________________
Activity 2 • Algebra II with the Casio fx-9750GII
19.
What is the difference between the investment for 10 years and the
investment at 30 years?
_________________________________________________________________
20.
What is the benefit of starting to invest early?
_________________________________________________________________
_________________________________________________________________
Extension
1.
Credit cards charge interest, however, that interest is compounded daily.
What changes would need to be made to the compound interest formula to
be able to calculate credit card interest that is compounded daily? Explain
your thinking.
_________________________________________________________________
_________________________________________________________________
_________________________________________________________________
_________________________________________________________________
_________________________________________________________________
Activity 2 • Algebra II with the Casio fx-9750GII
Solutions
1.
$5256.33
2.
$5416.32
3.
$6105.10
4.
$52,563.28
5.
$54,163.22
6.
$61,051.00
7.
$8,487.72
8.
1.9 years
9.
3.8 years
10.
5.5 years
11.
Answers will depend on student experience
12.
$1,257.79
13.
$6,643.88
14.
$5,386.09
15.
$6,288.95
16.
$33,219.42
17.
$26,930.47
18.
$627.45
19.
$566.66
20.
Answers will vary depending on student experience but should involve the
fact that the longer money is invested, the more money you will have.
Extension Solution
1.
Answers will vary. Things of note would be the interest rate is being charged
not received and that n would be changed to a compounded daily rate.
Activity 2 • Algebra II with the Casio fx-9750GII
Quite the Quadrilateral
Teacher Notes
Topic Area: Properties of Parallelograms
NCTM Standards:
• Use geometric ideas to solve problems in, and gain insights into, other
disciplines and other areas of interest such as art and architecture.
• Use Cartesian coordinates and other coordinate systems, such as navigational,
polar, or spherical systems, to analyze geometric situations.
• Investigate conjectures and solve problems involving two- and threedimensional objects represented with Cartesian coordinates.
Objective
The student will be able to use algebra and statistics to prove that a
quadrilateral is a parallelogram, demonstrate that the opposite sides are
equal, demonstrate that the diagonals bisect each other, and prove that the
opposite angles are equal.
Getting Started
As a class, review the meaning of slope and the slope-intercept form of an
equation; include in the discussion the relationship of the slopes between
parallel lines and perpendicular lines. Review methods of proving triangles
congruent using the Side-Side-Side method.
Prior to using this activity:
• Students should be able to find the xy-line for a pair of coordinates using a
graphing calculator.
• Students should be able to perform calculations involving square roots,
ratios, and parentheses using a graphing calculator.
• Students should know the formula for finding the distance between two
points.
Ways students can provide evidence of learning:
• The student will be able to write conjectures pertaining to a parallelogram.
• The student will be able apply the properties of a parallelogram to real-life
problems.
Common mistakes to be on the lookout for:
• Students may confuse the x and y values in the calculations.
• Students may enter the problem incorrectly into the calculator.
Definitions
• Parallelogram
• Perpendicular
• Endpoint
• Slope
•
•
•
•
Diagonal
Intersection
Midpoint
Congruent
•
•
Hypotenuse
Leg
Activity 7 • Geometry with the Casio fx-9750GII
Quite the Quadrilateral
“How-To”
The following will demonstrate how to enter a set of coordinates into two lists using
the Statistics mode of the Casio fx-9750GII. After the list is set up, you will find the
slope of a line containing the points, save the equation in the Graph mode, and find
the intersection of two lines. You will then find the length of a segment.
Line segment AB has endpoints at (−5, -2) and (3, 6) and segment CD has endpoints
at (−6, 4) and (3, −7). Find the slope for each line segment, the coordinates of their
intersection, and the length of AB .
To enter values into a list and find the line of best fit:
1.
From the Main Menu, highlight the Statistics icon
and press l or press 2.
2.
To label the first column, highlight the space below
List 1 and press a+(X)l.
3.
To label the second column, highlight the space
below List 2 and press a-(Y)l.
4.
Enter the x-values into List 1 and the y-values into
List 2. Be sure to press l after each value.
5.
To view the points, press q(GRPH)u(Set)
Nq(GPH1)Nw(XY)Nq(List)1N
q(List)2lq(GPH1).
6.
Press d and q(GPH1) to view the graph.
7.
Press q(Calc)w(X)q(ax+b) to find the line
of best fit.
8.
Press y(Copy)l to copy the equation into
the graph function.
9.
Repeat the same steps to find the equation for the second segment.
Activity 7 • Geometry with the Casio fx-9750GII
To graph the two equations and find the intersection:
1.
From the Main Menu, highlight the Graph icon and
press l or press 3.
2.
To graph the two equations, highlight each
equation and press q (Sel) to turn the function
on; when the equal signs are highlighted, you know
the equation is selected. Then press u(Draw).
3.
While viewing the graph, press y(G-Solv)
y(ISCT) to find the intersection of the two
equations.
4.
The coordinates are displayed at the bottom of
the screen.
To find the length of AB :
1.
Using the distance formula,
d=
(x 2 − x 1 )2 + ( y 2 − y 1 )2 , press Ls(j
3-n5ks+j6-n2k
skl to find the length of AB .
Activity 7 • Geometry with the Casio fx-9750GII
Quite the Quadrilateral
Activity
The parallelogram is a special quadrilateral with special properties that is used in a
variety of areas, especially in design. In this activity, we will explore the properties
and then solve some problems using those properties.
Questions
The diagram at the right shows Quad ABCD.
By definition, a parallelogram is a quadrilateral
with both pairs of opposite sides parallel.
1.
(6, 6) C
(-2, 4) B
Find the equation of a line that contains the
following points:
a.
points B and C
_____________________________________
D (3, 0)
A (-5, -2)
b.
points A and D
_____________________________________
2.
What is the slope for each line?
_________________________________________________________________
3.
Find the equation of a line that contains the following points:
a.
points A and B
_________________________________________________________________
b.
points D and C
_________________________________________________________________
4.
What is the slope for each line?
_________________________________________________________________
5.
Are the opposite sides parallel?
_________________________________________________________________
Let us see what else we can find out about the sides of a parallelogram.
6.
Find the length for the following segments to the nearest tenth.
BC : ________________________________________________________
a.
b.
AD : _______________________________________________________
Activity 7 • Geometry with the Casio fx-9750GII
7.
Find the length for the following segments to the nearest tenth.
a.
AB : _______________________________________________________
b.
8.
DC : ________________________________________________________
What can you conclude about the opposite of a parallelogram?
_________________________________________________________________
Draw the two diagonals for the figure. We are now going to look at their properties
in relation to quadrilaterals.
9.
Find the equation for the following segments.
a.
AC : _______________________________________________________
b.
BD : ________________________________________________________
10.
Find the coordinates for the intersection of the two diagonals. Draw it on the
diagram and label it E.
_________________________________________________________________
11.
Find the length of the following segments to the nearest tenth.
a.
AE : _______________________________________________________
b.
12.
CE : ________________________________________________________
Find the length of the following segments to the nearest tenth.
a.
BE : ________________________________________________________
b.
DE : ________________________________________________________
13.
What conclusion can be made about the diagonals of a parallelogram?
_________________________________________________________________
14.
Using the information above, determine the reason why each of the following
pairs of triangles are congruent.
a.
ΔABC ≅ ΔADC by _____________________________________________
b.
15.
ΔABD ≅ ΔCDB by _____________________________________________
Since the two pairs of triangles are congruent, then give two pairs of angles
that are equal.
______________________________ and ______________________________
Activity 7 • Geometry with the Casio fx-9750GII
16.
What conclusion can be made about angles in a parallelogram?
_________________________________________________________________
One method of demonstrating vector addition is by creating a parallelogram. The
sum is the coordinates of the fourth vertex of the parallelogram.
17.
Given the diagram below and using the properties of parallelograms, find the
sum of v1 and v2.
_________________________________________________________________
18.
The magnitude of a vector is equal to its length. Find the magnitudes of v1, v2,
and the resulting vector to the nearest hundredth.
a.
v1
_________________________________________________________________
b.
v2
_________________________________________________________________
v1, + v2
c.
_________________________________________________________________
v 2(2, 6)
v 1 (7, 2)
(0, 0)
Activity 7 • Geometry with the Casio fx-9750GII
Solutions:
1.
a.
y = 0.25x + 4.5
b.
y = 0.25x − 0.75
2.
The slope of each line is 0.25.
3.
a.
y = 2x + 8;
b.
y = 2x − 6
4.
The slope of each line is 2.
5.
The opposite sides are parallel.
6.
a.
b.
7.
a.
b.
8.
(6 − −2)2 + (6 − 4)2 = 8.2
(3 − −5)2 + (0 − −2)2 = 8.2
(− 2 − −5)2 + (4 − −2)2 = 6.7
(6 − 3)2 + (6 − 0)2 = 6.7
Opposite sides of the parallelogram are equal.
Activity 7 • Geometry with the Casio fx-9750GII
9.
a.
y = 0.36x + 3.81
b.
y = −0.8x + 2.4
10.
(0.5, 2)
11.
a.
b.
12.
a.
b.
(0.5 − −5)2 + (2 − −2)2 = 6.8
(0.5 − 6)2 + (2 − 6)2 = 6.8
(0.5 − −2)2 + (2 − 4)2
(0.5 − −5)2 + (2 − 4)2
= 3.2
= 3.2
13.
The diagonals bisect each other.
14.
a.
b.
15.
∠ ABC ≅ ∠ CDA & ∠ BAD ≅ ∠ DCB
16
Opposite angles of a parallelogram are equal.
17.
v1, + v2 = 9,8
18.
a.
v1 =
2 2 + 6 2 = 6.32 units
b.
v2 =
7 2 + 2 2 = 7.28 units
c.
v1, + v2 =
SSS Congruency
SSS Congruency
v1(2, 6)
v2 (7, 2)
(0, 0)
9 2 + 8 2 = 12.04 units
Activity 7 • Geometry with the Casio fx-9750GII
The Cost of Car Insurance
Teacher Notes
Topic: Data Analysis and Probability
NCTM Standard(s)
• For univariate measurement data, be able to display the distribution,
describe its shape, and select and calculate summary statistics.
Objective:
Given a set of data, the student will be able to enter data into the statistics
menu of the Casio 9750 GII, graph the data using a median box-and-whisker
graph, and calculate the measures of central tendency.
Getting Started
Have the students work in pairs or small groups and come up with examples
of using one-variable data, what kind of information can be obtained from
one-variable data and what types of graphs can be used to represent onevariable data.
Prior to using this activity:
• The student should be able to calculate basic statistics.
• The students should be familiar with interquartile values.
Ways students can provide evidence of learning:
• Given a set of data, the student should be able to create a box and whisker
plot.
• The student should be able to answer questions about the range of a set of
data.
Common mistakes to be on the lookout for:
• Students may pick a measure of central tendency that does not best
describe the situation.
• Students may not understand the effect that outliers have on the set of
data.
Definitions:
• Mean
• Median
• Mode
• Standard Deviation
• Interquartile Range
• Central tendency
Activity 4 • Statistics with the Casio fx-9750GII
The Cost of Car Insurance
“How-To”
The following will demonstrate how to enter a set of data into the Casio fx-9750GII,
graph the data using a Box and Whisker Plot and find important information from
the graph.
Scores on the First Math Test
55
60
75
80
90
65
75
60
50
80
70
95
100
Scores on the Second Math Test
75
90
85
60
95
85
80
To enter the data from the table in the problem:
1.
From the Main Menu, highlight the STAT icon
and press l or 2.
2.
To clear previous data lists press:
u (>) r(DEL-A)q(Yes).
3.
Enter the data by typing each number, pressing
l after each entry.
4.
The display should look like the screen shot on
the right when completed.
To select the type of graph for this data:
1.
Press q(GRPH) and u(SET) to set the
type of graph for StatGraph1.
2.
Press N to highlight Graph Type.
3.
There are five choices: Scat, XY, NPP, Pie, and (>) .
Selecting u (>) will provide more graph choices.
Activity 4 • Statistics with the Casio fx-9750GII
4.
Press w(Box) for a box-and-whisker plot.
5.
Make sure that the XList is List 1 and a
Frequency of 1. If not, scroll down and press
q to select a frequency of 1.
6.
Press d, then q(GPH1) to view the graph.
7.
Pressing q will display the statistical data
from the list.
To graph multiple sets of data:
1.
Press d to go back one screen.
2.
Press u(SET) and w(GPH2) to set the
type of graph for StatGraph 2.
3.
Press w(Box) for a box-and-whisker plot,
then press N to change the XList to List 2.
4.
Press r(SEL) to select the graphs to be
displayed.
5.
Arrow down to the graphs that you would
like to see drawn and press q(On).
Then, press u(DRAW).
Activity 4 • Statistics with the Casio fx-9750GII
To perform a 2 variable statistic analysis of the data:
1.
d twice until you are at the main stat screen.
2.
Press w(CALC), then w(2VAR) for a
two-variable analysis.
3.
Scroll down to see the data.
Activity 4 • Statistics with the Casio fx-9750GII
The Cost of Car Insurance
Activity
For many years, actuaries have kept track of the driving records of car insurance
policy holders. These statistics compare males and females and those under or
above 21 years old. This data is used to determine the amount paid for car
insurance premiums. In this activity, you will compare the cost of car insurance
premiums that resulted from the analysis of this data.
Female < 21
Female ≥ 21
Male < 21
Male ≥ 21
Company A
$2,046
$1,520
$3,041
$2,108
Company B
$1,825
$1,239
$2,617
$1,514
Company C
$2,152
$1,637
$2,946
$1,701
Company D
$1,773
$1,129
$2,459
$1,477
Company E
$2,381
$1,748
$3,291
$2,439
Insurance Co.
Questions
1.
What is the range of costs for car insurance for a female under 21?
_________________________________________________________________
What is the mean cost?
_________________________________________________________________
2.
What is the range of costs for car insurance for a male under 21?
_________________________________________________________________
What is the mean cost?
_________________________________________________________________
3.
What is the difference between the mean costs of a female and male driver
under 21?
_________________________________________________________________
4.
Can you think of some reasons why the cost is so different for male and
female drivers under the age of 21?
_________________________________________________________________
_________________________________________________________________
_________________________________________________________________
Activity 4 • Statistics with the Casio fx-9750GII
5.
6.
Use your Casio 9750GII to graph a box and whisker for each of the age and
gender groups. Draw a sketch of each graph. Be sure to label the
interquartile values for each age and gender group.
Female < 21
Female ≥ 21
Male < 21
Male ≥ 21
What is the range of costs for car insurance for females over 21 years old?
_________________________________________________________________
What is the mean cost?
_________________________________________________________________
7.
What is the range of costs for car insurance for males over 21 years old?
_________________________________________________________________
What is the mean cost?
_________________________________________________________________
8.
What is the difference between a male driver over 21, and a female driver over
21 years old?
_________________________________________________________________
_________________________________________________________________
_________________________________________________________________
Activity 4 • Statistics with the Casio fx-9750GII
9.
10.
Looking at the data overall, compare the mean and median costs for all the
data sets, and find the best insurance company and the yearly rate each
would pay for the following:
Male, 17 years old
___________
Amount paid
____________
Female, 18 years old
___________
Amount paid
____________
Male, 76 years old
___________
Amount paid
____________
Female, 35 years old
___________
Amount paid
____________
Do you think that this is fair? Why or why not?
_________________________________________________________________
_________________________________________________________________
_________________________________________________________________
Extensions
Speak with some of your local insurance companies and get rate quotes for
someone your age, but for different types of vehicles, like a sports car, a truck, a
compact car or an old Caprice.
Activity 4 • Statistics with the Casio fx-9750GII
Solutions
1.
Range = $2381 - $1773 = $608
Mean = $2035.40
2.
Range = $3291 - $2459 = $8732
Mean = $2870.80
3.
$2870.80 - $2035.40 = $835.40
4.
Answers will vary
5.
Female < 21
Female ≥ 21
Male < 21
Male ≥ 21
Activity 4 • Statistics with the Casio fx-9750GII
6.
Range = $1748 - $1129 = $619
Mean = $1456.60
7.
Range = $2439 - $1477 = $962
Mean = $1847.80
8.
$1847.80 – $1456.60 = $391.20
9.
Male, 17 years old:
Female, 18 years old:
Male, 76 years old:
Female, 35 years old:
10.
Answers will vary
Company D
Company D
Company D
Company D
Amount paid: $2,459
Amount paid: $1,773
Amount paid: $1,477
Amount paid: $1,129
Activity 4 • Statistics with the Casio fx-9750GII
Area of a Triangle and Circular Sector
Teacher Notes
Topic Area: Trigonometric Applications
NCTM standards:
• Develop fluency in operations with real numbers using technology for morecomplicated cases.
• Understand functions by interpreting representations of functions.
Objective
To calculate the area of a triangle and a circular sector using trigonometry.
Getting Started
In this activity, the student will learn how to calculate the area of a triangle
and a circular sector using trigonometry. The area of a triangle is defined to
be one-half the product of the lengths of the two sides (a, b) and the sine of
angle (C) included between those two sides. The formula looks like:
area =
1
•a•b•sin C
2
a
C
b
Another useful formula for finding the area of a triangle is Heron’s formula In
this formula the students need to know the lengths of the three sides (a, b, c)
to find the area of the triangle. Heron’s formula is:
area =
s(s − a)(s − b)(s − c) where s =
1
(a + b + c)
2
c
a b The area of a circular sector is defined to be one-half of the product of the
radius (r) squared and the central angle. The formula is:
area =
1 2
•r • θ
2
or
θ θ r r Activity 8 • Pre-Calculus with the Casio fx-9750GII
Prior to using this activity:
• Students should understand the difference between right triangles and nonright triangles.
• Students should know the difference between degrees and radians as angle
measurements.
Ways students can provide evidence of learning:
• Students will be able to calculate the area of any triangle.
• Students will be able to calculate the area of a circular sector.
Common mistakes to be on the lookout for:
• Students may forget to switch between degree and radian mode on the
calculator.
• When using Heron’s formula, students may incorrectly calculate s (or not
calculate it at all).
Definitions
• arc
•
sector
•
circular sector
•
degree
•
radian
Activity 8 • Pre-Calculus with the Casio fx-9750GII
Area of a Triangle and Circular Sector
“How-To”
The following will demonstrate how to enter the data into the Casio fx-9750GII and
interpret the results.
To set the calculator to calculate in degrees:
1.
From the Main Menu, highlight the RUN•MAT
icon and press l or 1.
2.
Make sure the calculator is in degree mode by
pressing Lp, move the cursor down to Angle.
Press q(Deg) to change it into degrees, thend.
To solve equations including trigonometric functions:
1
For this example, use the equation for area = a•b•sin C.
2
Let a = 2, b = 4, and C = 30o
1.
To calculate the area with the given parameters,
press: .5m2m4mh30l.
The area is 2.
To use the Solver feature:
For this example, we will use the equation for kinetic energy, KE = 0.5 mv2.
Let m = 10 kg, v = 25
1.
m
.
sec2
From the Main Menu, highlight the EQUA
icon and press l or 8, then press e(SOLV).
2.
To input the equation, press:
a,L..5a7a2sl
Note: k is used to represent KE.
Activity 8 • Pre-Calculus with the Casio fx-9750GII
3.
Enter 10 for M and 25 for V, and then highlight K.
4.
Press u(SOLV).
6.
Kinetic energy for this example is 3125 kg•
7.
To use the Solver to find m , input values for
K and V, highlight M and press u to find the
value for M. Use this same method to find V.
m
.
sec 2
Activity 8 • Pre-Calculus with the Casio fx-9750GII
Area of a Triangle and Circular Sector
Activity
Introduction
In this activity, you will learn how to calculate the area of a triangle and a circular
sector using trigonometry. The area of a triangle is defined to be one-half of the
product of the lengths of the two sides (a, b) and the sine of angle (C) included
between those two sides. The formula looks like:
area =
a
1
•a•b•sin C
2
C
b
Another useful formula for finding the area of a triangle is Heron’s formula In this
formula you need to know the length of the three sides (a, b, c) to find the area of the
triangle. Heron’s formula is:
area =
s(s − a)(s − b)(s − c) where s =
c
a 1
(a + b + c)
2
b The area of a circular sector is defined to be one-half of the product of the radius ®
squared and the central angle. The formula is:
area =
1 2
•r • θ
2
θ or
θ r r Questions
1.
Find the area of the following triangles for the given values using one of the
following formulas:
area =
1
•a•b•sin C
2
area =
1
•a•c•sin B
2
area =
a. a = 5, b = 7, C = 35o
area = __________
b. b = 10, c = 8, A = 28o
area = __________
c. a = 16, c = 4, B = 40o
area = __________
1
•c•b•sin A
2
Activity 8 • Pre-Calculus with the Casio fx-9750GII 2.
3.
Find the area of the following triangles for the given values using Heron’s
formula and the Solve feature.
a. a = 5, b = 7, c = 10
area = __________
b. a = 10, b = 8, c = 6
area = __________
c. a = 6, b = 4, c = 8
area = __________
Find the area of the following circular sectors for the given values using the
formula in the Solve feature.
a. r = 8, θ =
π
5
b. r = 10, θ =
c. r = 7, θ =
2π
3
4π
9
area = __________
area = __________
area = __________
Activity 8 • Pre-Calculus with the Casio fx-9750GII Solutions
1.
a. area = 10.0376 units2
b. area = 18.7789 units2
c. area = 7.7135 units2
2.
a. area = 16.2481 units2
b. area = 24 units2
c. area = 11.6190 units2
3.
Note that angles are given in radians for this question.
changed over to radian mode before proceeding.
Calculator must be
a. area = 20.1062 units2
b. area = 104.7198 units2
c. area = 34.2085 units2
Activity 8 • Pre-Calculus with the Casio fx-9750GII A Graphical Look At Continuity
Teacher Notes
Topic: Continuity
NCTM Standard
• Organize
and
consolidate
their
mathematical
thinking
through
communication; communicate their mathematical thinking coherently and
clearly to peers, teacher, and others.
Objectives
The student will be able to develop a visual understanding of how limits and
continuity relate and be able to understand and communicate what it means
for a function to be continuous at a point.
Getting Started
This activity will have students explore the concept of continuity at a point. It
will also allow them to discover that simply having a limit at a point will not
guarantee that the function is also continuous. It also explores the idea that
having a limit is a necessary, but not a sufficient condition to determine the
continuity of a function at a point, and through all points.
Prior to using this activity:
• Students should be able to produce and manipulate graphs of functions
manually and a graphing calculator.
• Students should be able to produce split-defined (or piecewise) functions.
• Students should have a basic understanding of the language of limits.
Ways students can provide evidence of learning:
• Students should be able to produce graphs of functions and communicate
symbolically, graphically and verbally the relationship between having a
limit and being continuous.
Common mistakes to be on the lookout for:
• Students may produce a graph on the calculator and not be able to
communicate the concept of a split-defined function because the window
chosen may produce the appearance of a single unbroken formula.
• Students may confuse the pixel values with the actual function values.
Definitions:
• Asymptote
• Continuity
• Discontinuity
• Limit
• Parabola
• Vertex
Activity 4 • Calculus with the Casio fx-9750GII
A Graphical Look At Continuity
“How-To”
The following will demonstrate how to graph a function, graph a split-defined
function and examine its behavior on the CASIO fx-9750GII.
Explore the behavior of the function f(x) = −x2 + 3x − 5.
To display a graph of the function:
1.
From the Main Menu, highlight the GRAPH
icon and press l or press 3.
2.
To delete any previous equations, highlight
the equation and press w(DEL)q(Yes.)
3.
Enter the equation in Y1 by pressing
nfs+3f-5l.
4.
Set the view window to the initial screen by
pressing Le(V-Window)q(INIT). Then,
change the Ymin to −9.3 and the Ymax to 9.3.
This view window will be used in this activity to
give the best display of the quadratic functions.
5.
Press EXIT to return to the main GRAPH screen.
6.
Press u(DRAW) to view the graph of the
function.
Activity 4 • Calculus with the Casio fx-9750GII
To find the vertex of the graph:
1.
Press Ly(G-Solv)w(MAX). The
coordinates of the vertex will be displayed
at the bottom of the screen. [Note: w(MAX)
was pressed since the vertex of this parabola
is the highest, or maximum, point. If the graph
of the parabola opened up, the vertex would be
the lowest, or minimum, point and you would
have chosen e(MIN).]
⎧− x2 + 3x − 5, x < 1.5
⎪
Explore the behavior of the split-defined function g(x) = ⎨− 4, x = 1.5
.
⎪− x2 + 3x − 5, x > 1.5
⎩
To graph a split-defined function:
1.
From the Main Menu, highlight the GRAPH
icon and press l or press 3.
2.
To delete any previous equations, highlight
the equation and press w(DEL)q(Yes.)
3.
Enter each branch of the split-defined (piece-wise)
function in its own Y= slot, then create the
restrictions by putting the lower and upper bounds
in brackets.
For Y1, press nfs+3f-5,L
+n10,1.5L-l.
For Y2, press n4,L+1.5,1
.5L-l.
For Y3, press nfs+3f-5,
L+1.5,10L-l.
4.
Press u(DRAW) to view the graph of the functions.
Activity 4 • Calculus with the Casio fx-9750GII
A Graphical Look At Continuity
Activity
This activity will have you explore the concept of continuity at a point. It will also
allow you to discover that simply having a limit at a point will not guarantee that the
function is also continuous. Using the CASIO fx-9750GII, you will be working in
pairs or small groups.
Questions
Explore the behavior of the function f(x) = x2 − x − 6 around the vertex.
1.
Graph the function using the initial view window, changing Ymin to −9.3 and
Ymax to 9.3, and copy on the axes below.
2.
Find and record the vertex of the function.
_________________________________________________________________
3.
Trace to the vertex and zoom in, record what you see.
_________________________________________________________________
_________________________________________________________________
_________________________________________________________________
4.
What does the value of lim f ( x ) appear to be? Explain how you arrived at
x → 0.5
that answer.
_________________________________________________________________
_________________________________________________________________
_________________________________________________________________
Activity 4 • Calculus with the Casio fx-9750GII
5.
Explore the behavior of the following split-defined function:
⎧x 2 − x − 6, x < 0.5
⎪
g(x) = ⎨− 6, x = 0.5
⎪x 2 − x − 6, x > 0.5
⎩
Use the same viewing window as before. Record what you see below.
6.
What does the value of lim g( x ) appear to be?
x → 0.5
_________________________________________________________________
7.
How does it compare to the lim f ( x ) ?
x →0.5
_________________________________________________________________
_________________________________________________________________
8.
Now trace to a value where x = 0.5 and zoom in. Describe and record what
you see.
_________________________________________________________________
_________________________________________________________________
_________________________________________________________________
Activity 4 • Calculus with the Casio fx-9750GII
9.
Find the following limits:
a.
b.
c.
10.
lim g(x)
____________________
lim g(x)
____________________
lim g(x)
____________________
x → 0.5 +
x → 0.5 −
x → 0.5
Find g(0.5). How does this compare to your answer for lim g( x ) ?
x →0.5
_________________________________________________________________
_________________________________________________________________
_________________________________________________________________
11.
Draw a conclusion about the relationship between limits and continuity.
_________________________________________________________________
_________________________________________________________________
_________________________________________________________________
Activity 4 • Calculus with the Casio fx-9750GII
Solutions
1.
2.
(0.5, −6.25)
3.
Nothing unusual should be seen. The function is continuous.
4.
The limit is -6.25, the vertical value of the vertex. Answer will vary; care
should be taken to point out that simply tracing to a value is not confirmation
enough and can be tricky. Direct substitution is a valid explanation. A good
answer might also include a mention of “passing through” or even a mention
of continuity.
5.
[Note: The discontinuity will not be immediately apparent.]
6.
The limit is −6.25.
7.
Answers may vary as students begin to get the idea that the change in the
definition of the function may be creating some problems, although not with
the limit. This is a good checkpoint for the understanding of what it means to
be a “limit.”
8.
[Note: the point becomes more visible.]
9.
All three limits are −6.25, although some students may try to refine the
answers to longer decimals. This provides another good opportunity to stress
the idea of “limit” as the value the function approaches.
10.
g(0.5) = −6, a value different from the limit.
Activity 4 • Calculus with the Casio fx-9750GII
11.
Answers will vary; a good answer will include the fact that the function has a
gap or a hole or a jump at the point of discontinuity. The idea is to have the
students begin to think about the fact that simply having a limit does not
guarantee the continuity of a function.
Activity 4 • Calculus with the Casio fx-9750GII