1
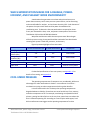
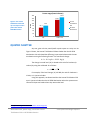
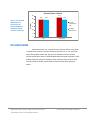
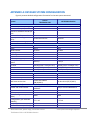
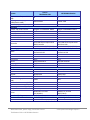
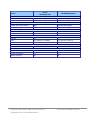
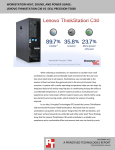
WORKSTATION HEAT, POWER USAGE, AND SOUND: LENOVO THINKSTATION C30 VS. HP Z620 WORKSTATION When selecting a workstation, it’s important to consider how it will contribute to a reliable and comfortable work environment for the user and how much electricity it will require. Workstations vary considerably in the amount of heat and noise they generate and in the amount of power they consume. A system with a cooler operating temperature helps you two ways: by being less likely to fail and by requiring less air conditioning to keep the office at a comfortable temperature. A quieter system provides a more pleasant user experience and a more power-efficient system lowers your electric bill by using less electricity and running cooler, which reduces the amount of cooling required. In our labs, Principled Technologies (PT) tested the Lenovo ThinkStation C30 and the HP Z620 Workstation. We found that the Lenovo workstation was less power-hungry than the HP workstation and had lower surface temperatures while idle and while under load. These findings show that the Lenovo ThinkStation C30 could contribute to a reliable user experience and a comfortable office environment and save on electricity costs. NOVEMBER 2012 A PRINCIPLED TECHNOLOGIES REPORT Commissioned by Lenovo WHICH WORKSTATION MAKES FOR A RELIABLE, POWEREFFICIENT, AND PLEASANT WORK ENVIRONMENT? A workstation that generates more heat and noise and uses more power than necessary can be more prone to system failure, can be distracting and uncomfortable for workers , and can boost electricity bills—both because of the power the system itself draws and the power that additional air conditioning uses. To determine how two workstations compared on these fronts, we measured the heat, noise, and power consumption of the Lenovo ThinkStation C30 and the HP Z620 Workstation. We performed the tests while the two systems were idle and again while they were running a heavy workload that consisted of two benchmarks stressing each system’s hard disk, processor, and memory. Figure 1 presents highlights of our test results. Lenovo ThinkStation C30 Heat (degrees Celsius above room temperature) Rear system fan 3.9 exhaust (idle) Average of 5 internal 9.4 locations (idle) Power usage (watts) Idle 68.1 Under load 128.7 HP Z620 Workstation Comparison 4.5 15.4% cooler 11.5 22.3% cooler 85.0 149.1 Uses 19.9% less power Uses 13.7% less power Figure 1: Test result summary. Lower numbers are better. For detailed specifications of our test systems, see Appendix A. For details of our testing, see Appendix B. COOL UNDER PRESSURE The operating temperatures of computers vary considerably. While one advantage of a cooler workstation is obvious—no one wants a hot office— workstations running at cooler temperatures also bring other benefits. It is well known within the IT industry that operating temperatures degrade hardware reliability. Excess heat can cause hard drives, CPUs, memory, and other components to fail. For example, overheating can expand hard drive platters, causing hard drive failure. At the very least, excess heat can reduce the drive’s effective operating life. According to a recent Fujitsu white paper, hard disk manufacturers now suggest cooler operating temperatures for drive Workstation heat, power usage, and sound: Lenovo ThinkStation C30 vs. HP Z620 Workstation A Principled Technologies report 2 enclosures.1 Because many users fail to back up their data on a regular basis, adequate ventilation and cooling in a workstation goes a long way to avoiding problems such as catastrophic data loss due to hard drive failure. Many workers are not fortunate enough to have control over the climate in their offices. Not only do workstations with higher operating temperatures place extra wear on hardware, but they can make an already warm office even more uncomfortable. With system reliability and user comfort in mind, we measured the temperature of several key internal and external spots on the two workstations while they were idle and while they were running a heavy workload. However, given that most workstations run 24 hours a day, we believe the most appropriate measure of thermal performance is the temperature of the air exiting the rear exhaust when the workstation is idle. For each of the locations, we measured the temperature three times and noted the number of degrees Celsius each measurement deviated from the ambient room temperature. Because the ambient temperature varied throughout our testing, the temperature difference between the ambient temperature and the surface temperature we recorded for each system makes the fairest comparison. LESS POWER USED IS BETTER A workstation that uses less power saves you money when the electric bill comes. As Figure 2 shows, the Lenovo ThinkStation C30 used less power than the HP Z620 Workstation—19.9 percent less when the systems were idle and 13.7 percent less when they were under load. We used an Extech® Power Analyzer to measure power consumption while the systems were idle and under load. 1 http://www.fujitsu.com/downloads/COMP/fcpa/hdd/sata-mobile-ext-duty_wp.pdf Workstation heat, power usage, and sound: Lenovo ThinkStation C30 vs. HP Z620 Workstation A Principled Technologies report 3 Power usage (lower is better) 149.1 160 128.7 140 120 Watts Figure 2: The Lenovo ThinkStation C30 used up to 19.9 percent less power than the HP Z620 Workstation. 100 80 Lenovo ThinkStation C30 85.0 68.1 HP Z620 Workstation 60 40 20 0 Idle Under load QUIETER IS BETTER Any user, given a choice, would prefer a quiet system to a noisy one. As Figure 3 shows, the Lenovo ThinkStation C30 was louder than the HP Z620 Workstation. We calculated the difference in perceived volume with the two workstations using the following formula2 for sound level change: The change in sound level (L) is related to the ratio for loudness (or volume) by using the calculated L as follows: For example, if the level change (L) is 0.2dB, the ratio for loudness is 1.014x, or 1.4 percent louder. Using this approach, we determined that the Lenovo ThinkStation C30 was 1.4 percent louder than the HP Z620 Workstation when the systems were idle and 21.4 percent louder when they were under load. 2 http://www.sengpielaudio.com/calculator-levelchange.htm Workstation heat, power usage, and sound: Lenovo ThinkStation C30 vs. HP Z620 Workstation A Principled Technologies report 4 Acoustics (lower is better) 30 25 Figure 3: The HP Z620 Workstation was quieter than the Lenovo ThinkStation C30 both when idle and when under load. 27.7 24.8 24.6 24.9 Lenovo ThinkStation C30 Decibels 20 15 HP Z620 Workstation 10 5 0 Idle Under load IN CONCLUSION A workstation that runs in a quiet and cool manner and uses less power is a great boon to workers and the companies they work for. In our tests, both when idle and when under load, the Lenovo ThinkStation C30 ran at lower surface temperatures than the HP Z620 Workstation and used less power. These findings make the Lenovo ThinkStation C30 an excellent choice for those who want to provide a reliable, comfortable work environment while using less power. Workstation heat, power usage, and sound: Lenovo ThinkStation C30 vs. HP Z620 Workstation A Principled Technologies report 5 APPENDIX A: DETAILED SYSTEM CONFIGURATION Figure 4 presents detailed configuration information for the two systems we tested. Lenovo ThinkStation C30 System General Number of processor packages Number of cores per processor Number of hardware threads per core Total number of system threads System power management policy Processor power-saving option CPU Vendor Name Model number Stepping Socket type Bus/Core Ratio Core frequency (GHz) Intel QuickPath Interconnect Speed L1 cache L2 cache L3 cache Platform Vendor Motherboard model number Motherboard chipset BIOS name and version HP Z620 Workstation 2 4 2 4 1 1 8 8 ThinkCentre Default Balanced EIST EIST Intel® Xeon® E5-2603 M1 LGA2011 18 1.80 Intel Xeon E5-2603 M1 LGA2011 18 1.80 6.4 GT/s 6.4 GT/s 256 KB (32 KB + 32 KB per core) 1 MB (256 KB per core) 10 MB (shared) 256 KB (32 KB + 32 KB per core) 1 MB (256 KB per core) 10 MB (shared) Lenovo Lenovo Intel C602 Lenovo A1KT39AUS (08/10/2012) HP 158A Intel C602 HP J61 v01.14 (07/17/2012) Memory module(s) Vendor and model number Type Speed (MHz) Speed running in the system (MHz) Timing/Latency (tCL-tRCD-tRPtRASmin) Size (MB) Number of memory module(s) Micron® MT9JSF25672PZ1G6M1FE PC3-12800 1600 Nanya® NT2GC72B89G0NF-DI PC3-12800 1600 1600 1600 7-7-7-19 7-7-7-19 2048 4 2048 4 Workstation heat, power usage, and sound: Lenovo ThinkStation C30 vs. HP Z620 Workstation A Principled Technologies report 6 Lenovo ThinkStation C30 System Total amount of system RAM (GB) Chip organization (singlesided/double-sided) Channel (single/dual/quad) Hard disk Vendor and model number Number of disks in system Size (GB) Buffer size (MB) RPM Type Controller Driver Operating system Name Build number Service Pack File system Kernel Language Microsoft DirectX version Graphics Vendor and model number Type Chipset BIOS version Total available graphics memory (MB) Dedicated video memory (MB) System video memory (MB) Shared system memory (MB) Resolution Driver Sound card/subsystem Vendor and model number Driver HP Z620 Workstation 8 8 Double-sided Double-sided Quad Quad Seagate® ST500DM002-1BD14 1 500 16 7,200 SATA 6.0Gb/s Intel C600 Series Chipset SATA RAID Controller Intel 3.2.0.1126 (06/20/2012) Seagate ST500DM002-1BD14 1 500 16 7,200 SATA 6.0Gb/s Intel C600 Series Chipset SATA RAID Controller Intel 3.1.0.1068 (03/15/2012) Microsoft® Windows® 7 Professional x64 7601 1 NTFS ACPI x64-based PC English 11 Microsoft Windows 7 Professional x64 7601 1 NTFS ACPI x64-based PC English 11 NVIDIA® Quadro® 600 Discrete Quadro 600 70.8.7c.0.1 NVIDIA Quadro 600 Discrete Quadro 600 70.8.88.0.7 4,839 4827 1,024 0 3,815 1,280 x 1,024 NVIDIA 8.17.12.7642 (12/10/2011) 1024 0 3803 1280 x 1024 NVIDIA 8.17.12.9670 (04/27/2012) Realtek™ High Definition Audio Realtek 6.0.1.6581 (02/29/2012) Realtek High Definition Audio Realtek 6.0.1.6449 (08/30/2011) Workstation heat, power usage, and sound: Lenovo ThinkStation C30 vs. HP Z620 Workstation A Principled Technologies report 7 Lenovo ThinkStation C30 System Ethernet #1 Vendor and model number Driver Ethernet #2 Vendor and model number Driver Optical drive(s) Vendor and model number Type USB ports Number Type Other IEEE 1394 ports Number Monitor Type Screen size (inches) Refresh rate (Hz) HP Z620 Workstation Intel 82579LM Gigabit Intel 11.15.16.0 (01/11/2012) Intel 82574L Gigabit Intel 11.14.48.0 (10/13/2011) N/A N/A Intel 82579LM Gigabit Intel 11.15.16.0 (01/11/2012) LG DH40N DVD-ROM HP DH16ACSHR DVD-RW 12 10 x USB 2.0, 2 x USB 3.0 Serial port 9 5 x USB 2.0, 4 x USB 3.0 DisplayPort 0 2 ViewSonic VG730m 17 60 ViewSonic VG730m 17 60 Figure 4: System configuration information. Workstation heat, power usage, and sound: Lenovo ThinkStation C30 vs. HP Z620 Workstation A Principled Technologies report 8 APPENDIX B: DETAILED TEST METHODOLOGY Measuring surface temperature Test requirements Fluke® 2680A Data Acquisition System PassMark BurnInTest Professional Linpack benchmark Measuring system temperature and power while idle Setting up the test 1. Set the power plan to the manufacturer’s default setting. Set the display brightness to 100 percent: a. Click Start. b. In the Start menu’s quick search field, type Power Options c. Move the Screen brightness slider all the way to the right. 2. Set the remaining power plan settings as follows: Dim the display: Never Turn off the display: Never Put the computer to sleep: Never 3. Disable the screen saver. 4. Place the workstation, mouse, keyboard, and display in a windowless, climate-controlled room. 5. Attach a Type T thermocouple to the exterior of the workstation at the following locations: Front center Top Side opposite the motherboard Side closest to the motherboard Back in center of power supply exhaust 6. Attach a Type T thermocouple to the following locations inside the case: On the hard drive On the CPU heatsink On the VRM FET On the chipset heatsink On one DIMM 7. Close the case. 8. Configure the Fluke 2680A Data Acquisition System to take measurements from the temperature probes and one ambient temperature probe using the Fluke DAQ software. a. Connect the Type T thermocouples to channels in the Fluke Fast Analog Input module (FAI). b. In the Fluke DAQ software, click each surface temperature channel, select Thermocouple from the list of Functions, and choose T from the list of ranges. c. Label each channel with the location associated with each thermocouple. d. In the Fluke DAQ software, click the ambient temperature channel, select Thermocouple from the list of Functions, and choose T from the list of ranges. e. Label this channel Ambient. 9. While running each test, use a Fluke 2680A Data Acquisition System to monitor ambient and temperature at each interior and exterior point. Workstation heat, power usage, and sound: Lenovo ThinkStation C30 vs. HP Z620 Workstation A Principled Technologies report 9 10. Connect the power cord from the workstation to the Extech Instruments 380803 Power Analyzer’s DC output load power outlet. 11. Plug the power cord from the Power Analyzer’s DC input voltage connection into a power outlet. 12. Connect a separate host computer to the Power Analyzer using an RS-232 cable. This computer will monitor and collect the power measurement data. 13. Turn on the Extech Power Analyzer by pressing the green On/Off button. 14. Turn on the host computer. 15. Insert the Extech software installation CD into the host computer, and install the software. 16. Once installed, launch the Extech Power Analyzer software, and configure the correct COM port. Running the test 1. Boot the system and bring up an elevated command prompt: Select Windows Start orb. Type cmd and press Control-Shift-Enter. 2. Type Cmd.exe /c start /wait Rundll32.exe advapi32.dll,ProcessIdleTasks Do not interact with the system until the command completes. 3. After the command completes, wait 15 minutes before running the test. 4. Start the Fluke 2680A data logger using the Fluke DAQ software, and begin recording power with the Extech Power Analyzer. 5. Allow the workstation to sit idle for 1 hour. 6. After 1 hour, stop the Fluke 2680A data logger using the Fluke DAQ software, and the Power Analyzer data logger. 7. Export the thermal measurements to a CSV file. The Power Analyzer creates a CSV file as it collects that data. 8. Use the thermal measurement CSV file to find and report the highest temperature measured at each location during the test. 9. Use the Power Analyzer CSV to calculate the average power draw in watts during the test. 10. Power the workstation off for 1 hour, and allow it to return to room temperature. 11. Repeat steps 1 through 9 two more times. Measuring system temperature and power while under load Setting up the test 1. 2. 3. 4. 5. 6. 7. 8. 9. 10. 11. 12. Download PassMark BurnInTest Professional 7.0 from http://www.passmark.com/products/bit.htm. Double-click bitpro_x64.exe to run setup. At the Welcome screen, click Next. Accept the license agreement, and click Next. At the Choose Install Location screen, accept the default location of C:\Program Files\BurnInTest, and click Next. At the Select Start Menu Folder screen, click Next. At the Ready to Install screen, click Install. At the Completing the BurnInTest Setup Wizard screen, deselect View Readme.txt, and click Finish to launch BurnInTest. At the Purchasing information screen, copy and paste the Username and key, and click Continue. At the Key accepted screen, click OK. Select Test selection and duty cycles from the Configuration menu item. Select CPU, 2D Graphics, 3D Graphics, and Disk(s), and deselect all other subsystems. Workstation heat, power usage, and sound: Lenovo ThinkStation C30 vs. HP Z620 Workstation A Principled Technologies report 10 13. Set load to 100, and click OK. 14. Select Test Preferences from the Configuration menu item and set or verify the following by clicking on each tab: Disk: select C: drive Logging: select Turn automatic logging on 2D Graphics: select All available Video Memory 3D Graphics: use defaults CPU: use defaults 15. Unpack the Linpack benchmark and adjust the number of instances, problem size, and leading dimension size so that the CPU is at 100% utilization, and the memory is as close to 100% utilization as possible. We used a batch file to run the number of instances we determined for each workstation. Running the test 1. Boot the system and launch PassMark BurnInTest by double-clicking the desktop icon. 2. Bring up an elevated command prompt: a. Select Windows Start orb. b. Type cmd and press Control-Shift-Enter. 3. Type Cmd.exe /c start /wait Rundll32.exe advapi32.dll,ProcessIdleTasks Do not interact with the system until the command completes. 4. After the command completes, wait 15 minutes before running the test. 5. Click Start Selected Tests in the BurnInTest V7.0 Pro screen, and double-click the Linpack benchmark batch file. 6. Start the Fluke 2680A data logger using the Fluke DAQ software, and begin recording power with the Extech Power Analyzer. 7. After 1 hour, stop the Fluke 2680A data logger using the Fluke DAQ software, and the Power Analyzer data logger. 8. Export the thermal measurements to a CSV file. The Power Analyzer creates a CSV file as it collects that data. 9. Use the thermal measurement CSV file to find and report the highest temperature measured at each location during the test. 10. Use the Power Analyzer CSV to calculate the average power draw in watts during the test. 11. Power the workstation off for 1 hour, and allow it to return to room temperature. 12. Repeat the steps 1 through 11 two more times. Measuring acoustics Test requirements Extech SDL600 Sound Level Meter/Datalogger with SD card PassMark BurnInTest Professional Measuring acoustics of the workstation while idle Setting up the test 1. Place the workstation, mouse, keyboard, and display in a windowless, sound-proofed professional sound booth. Workstation heat, power usage, and sound: Lenovo ThinkStation C30 vs. HP Z620 Workstation A Principled Technologies report 11 2. Set the Extech SDL600 on a tripod so that it is 3 feet in front of, and 2 feet above the workstation. Running the test 1. Boot the system and bring up an elevated command prompt: Select Windows Start orb. Type cmd and press Control-Shift-Enter. 2. Type Cmd.exe /c start /wait Rundll32.exe advapi32.dll,ProcessIdleTasks Do not interact with the system until the command completes. 3. After the command completes, wait 5 minutes before running the test. 4. Start the Extech SDL600 Sound Level Meter/Datalogger and allow the workstation to sit idle for 1 hour. 5. After 1 hour, stop the Extech SDL600. 6. Power the workstation off for 10 minutes. 7. Copy the log file from the Extech SDL600 SD card. 8. Repeat steps 1 through 7 two more times. Measuring acoustics of the workstation while under load Setting up the test Ensure that PassMark BurnInTest Professional 7.0 and the Linpack benchmark are set up on your system. Running the test 1. Boot the system and launch PassMark BurnInTest by double-clicking the desktop icon. 2. Bring up an elevated command prompt: Select Windows Start orb. Type cmd and press Control-Shift-Enter. 3. Type Cmd.exe /c start /wait Rundll32.exe advapi32.dll,ProcessIdleTasks Do not interact with the system until the command completes. 4. After the command completes, wait 15 minutes before running the test. 5. Click Start Selected Tests in the BurnInTest V7.0 Pro screen, double-click the Linpack benchmark batch file, and start the Extech SDL600 Sound Level Meter/Datalogger. 6. After 1 hour, stop the Extech SDL600. 7. Power the workstation off for 10 minutes. 8. Copy the log file from the Extech SDL600 SD card. 9. Repeat steps 1 through 8 two more times. Measuring power consumption To record each workstation’s power consumption during each test, we used an Extech Instruments (www.extech.com) 380803 Power Analyzer/Datalogger. We connected the power cord from the server under test to the Power Analyzer’s output load power outlet. We then plugged the power cord from the Power Analyzer’s input voltage connection into a power outlet. Workstation heat, power usage, and sound: Lenovo ThinkStation C30 vs. HP Z620 Workstation A Principled Technologies report 12 We used the Power Analyzer’s Data Acquisition Software (version 2.11) to capture all recordings. We installed the software on a separate Intel processor-based PC, which we connected to the Power Analyzer via an RS-232 cable. We captured power consumption at one-second intervals. We then recorded the power usage (in watts) for each system during the testing at 1-second intervals. To compute the average power usage, we averaged the power usage during the time the system was producing its peak performance results. Workstation heat, power usage, and sound: Lenovo ThinkStation C30 vs. HP Z620 Workstation A Principled Technologies report 13 ABOUT PRINCIPLED TECHNOLOGIES Principled Technologies, Inc. 1007 Slater Road, Suite 300 Durham, NC, 27703 www.principledtechnologies.com We provide industry-leading technology assessment and fact-based marketing services. We bring to every assignment extensive experience with and expertise in all aspects of technology testing and analysis, from researching new technologies, to developing new methodologies, to testing with existing and new tools. When the assessment is complete, we know how to present the results to a broad range of target audiences. We provide our clients with the materials they need, from market-focused data to use in their own collateral to custom sales aids, such as test reports, performance assessments, and white papers. Every document reflects the results of our trusted independent analysis. We provide customized services that focus on our clients’ individual requirements. Whether the technology involves hardware, software, Web sites, or services, we offer the experience, expertise, and tools to help our clients assess how it will fare against its competition, its performance, its market readiness, and its quality and reliability. Our founders, Mark L. Van Name and Bill Catchings, have worked together in technology assessment for over 20 years. As journalists, they published over a thousand articles on a wide array of technology subjects. They created and led the Ziff-Davis Benchmark Operation, which developed such industry-standard benchmarks as Ziff Davis Media’s Winstone and WebBench. They founded and led eTesting Labs, and after the acquisition of that company by Lionbridge Technologies were the head and CTO of VeriTest. Principled Technologies is a registered trademark of Principled Technologies, Inc. All other product names are the trademarks of their respective owners. Disclaimer of Warranties; Limitation of Liability: PRINCIPLED TECHNOLOGIES, INC. HAS MADE REASONABLE EFFORTS TO ENSURE THE ACCURACY AND VALIDITY OF ITS TESTING, HOWEVER, PRINCIPLED TECHNOLOGIES, INC. SPECIFICALLY DISCLAIMS ANY WARRANTY, EXPRESSED OR IMPLIED, RELATING TO THE TEST RESULTS AND ANALYSIS, THEIR ACCURACY, COMPLETENESS OR QUALITY, INCLUDING ANY IMPLIED WARRANTY OF FITNESS FOR ANY PARTICULAR PURPOSE. ALL PERSONS OR ENTITIES RELYING ON THE RESULTS OF ANY TESTING DO SO AT THEIR OWN RISK, AND AGREE THAT PRINCIPLED TECHNOLOGIES, INC., ITS EMPLOYEES AND ITS SUBCONTRACTORS SHALL HAVE NO LIABILITY WHATSOEVER FROM ANY CLAIM OF LOSS OR DAMAGE ON ACCOUNT OF ANY ALLEGED ERROR OR DEFECT IN ANY TESTING PROCEDURE OR RESULT. IN NO EVENT SHALL PRINCIPLED TECHNOLOGIES, INC. BE LIABLE FOR INDIRECT, SPECIAL, INCIDENTAL, OR CONSEQUENTIAL DAMAGES IN CONNECTION WITH ITS TESTING, EVEN IF ADVISED OF THE POSSIBILITY OF SUCH DAMAGES. IN NO EVENT SHALL PRINCIPLED TECHNOLOGIES, INC.’S LIABILITY, INCLUDING FOR DIRECT DAMAGES, EXCEED THE AMOUNTS PAID IN CONNECTION WITH PRINCIPLED TECHNOLOGIES, INC.’S TESTING. CUSTOMER’S SOLE AND EXCLUSIVE REMEDIES ARE AS SET FORTH HEREIN. Workstation heat, power usage, and sound: Lenovo ThinkStation C30 vs. HP Z620 Workstation A Principled Technologies report 14