1
Handbook
Release 10.1
December 2007
WEST
Carbon dioxide flux meter
Continuous Monitoring
ITA
LY
FOGO, FURNAS, TERCEIRA, MAMMOTH Horseshoe Lake, San MIGUEL, San VINCENTE, San SALVADOR, Santa ANA, MOUNUN , NYOS.
Açores University, Université Libre de Bruxelles, University of Florida, Consiglio Nazionale delle Ricerche, Colima University, University of Michigan, Santorini Volcano Observatory
SERVING VOLCANIC COMMUNITY WORLDWIDE
USU SAN, MASAYA, POAS, TEIDE, CUMBRE VEJA, ETNA, STROMBOLI, CAMPI FLEGREI, VESUVIUS, SANTORINI.
Tokyo University, Kyoto University, PennState University, U.S.G.S., ITER, Istituto Nazionale di Geofisica e Vulcanologia, Osservatorio Vesuviano
Systems
If your equipment requires maintenance in Italy:
BEFORE YOU SHIP THE INSTRUMENT BACK TO ITALY REMEMBER:
!When you ask your shipping agent to send the instrument to Italy check
that on the Air Waybill the Airport of destination is PISA. Any other
airport of destination creates a lot of problems in delivering the items
(delay, costs, custom problems etc.)
!Check that the Company your shipping agent chooses lands in Galileo
Galilei Airport in Pisa. If not, ask your shipping agent to change the
Company or send the items by DHL or UPS or FedEx.
!Mark each item with a serial number, if not already present, and write
this number on the document (proforma or original invoice or item
list) where you list the parts you are sending back to Italy.
!Specify a correct value of the parts you are sending back in the
documents mentioned above.
Pay attention to these rules because Custom law in Italy is very
complicated and probably different from your Country.
If you follow these suggestions everything will be easier for you and for
us.
West Systems Srl
INDEX
INDEX
Page
List of the components
Safety Information
Hints
4
WEST Systems
5
6
Site selection
Shelter and piquets kit
Power supply
Solar cell charge regulator
Connections
Installation of the Acc. Chamber
Connection resume
A.Chamber tubes
2.1
2.2
2.3
2.4
2.5-2.9
2.10
2.11
2.12
Pump
Tubing / Fittings / Filters
3.1-3.2
3.3-3.4
Polytron IR CO2
Barometric pressure
Pumping flow and filter status
Soil Water content
Soil temperature
4.1-4.2
4.3
4.4
4.5
4.6
Pneumatic circuit
Sensors
Accumulation chamber
A little theory
The factor AcK
Table for grams/sm/day
Table for moles/sm/day
Flux curves examples
Drawings
Cables / scheme
Proximity switches
Resume of AC connections
5.1
5.2
5.3
5.4
5.5
5.6
5.7-5.8
5.9
5.10
Palmtop operations
Connecting the PDA
SetStation application
FluxStation parameters
Additional features
Channels parameters
CO2 full scale value
6.1
6.2-6.4
6.5-6.8
6.9
6.10-6.11
6.12-6.14
Portable flux meter handbook
Release 7.00 -FluxManager- July 2007
3
On Field installation
WEST Systems
2
1.1
1.2
1.3
www.westsystems.com
Chapter Argument
1
INDEX
INDEX
7
Running FluxStation
General considerations
SD memory card
StandBy and Running
www.westsystems.com
8
Portable flux meter handbook
Release 7.00 -FluxManager- July 2007
Calibration
General considerations
8.1
Polytron IR CO2 gas calibration
8.2-8.6
Polytron IR CO2 4-20mA calibration 8.7-8.8
Flux meter calibration
8.10-8.14
9
Databases structure
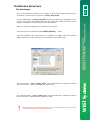
General considerations
scada_log.mdb
scada_data.mdb
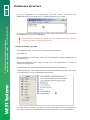
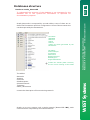
stations
phisicalchannels
channels
telemetry
10
WEST Systems
7.1-7,2
7.3-7.4
7.5-7.6
Scada suite
Scada
Scada color codes
Scada alarms
Scada communication log
11
9.1-9.2
9.2
9.3
9.4-9.5
9.6
9.7
9.8-9.9
10.1-10.4
10.5
10.7
10.8
Scada suite
Flux revision
Monitor
Query
A
Air Box
Meteorological sensors
C
Cables
Cables schematics
F
SSR24 Telemetry
S
Soil Box
Z
Software installation
11.1-11.5
11.7
11.9-11.10
Soil sensors
PDA Software installation
PC Software installation
Z.1-Z.2
Z.3-Z.4
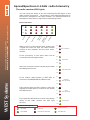
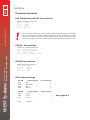
The package contents
Shelter
Feet
Piquets
Telemetry
Backfire antenna
Coax 3 meter N-N
Coax 10 meter N-N
SSR24 Slave
SSR24 Master
Quantity Check
1
1
1
1
WIND00075
1
Pluvio116
1
1
CS6161_21
1
1
C714
1
1
1
4
12
2427581
2
1
1
1
1
AC
Accumulation chamber
AC.Box
1
1
P.Supply
Solar cell regulator
12V 40A/h battery
Solar cell
1
1
1
FluxStation FluxStation
AC Board
PowerBoard
CPU Board
PAGE
Shelter
S/n
DRGEEX02
C1130006
www.westsystems.com
Description
Polytron IR CO2
Vaisala Pt100
AirBox
SoilBox
WindSonic
RainGauge
ThermoHygrometer
TDR CS616
Pt100 Soil temperature
AWM3300
dP gauge
1
1
1
1
Pump KNF/ST
1
Tools
Piquet-prolongue
Wrench kit : 13/17
Hexagonal wrench
Tie kit
1
1
1
1
Spares
Spare filters 1"
Spare filters 2"
Spare rilsan tube
mt silicon tube
4
2
1
2
WEST Systems
Goods
Sensors
1.1
WEST Systems
www.westsystems.com
PAGE
1.2
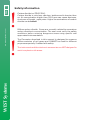
Safety information
!
!
Carbon dioxide is a TOXIC GAS,
Carbon dioxide is colorless, odorless, tastless and is heavier than
air. Air concentration higher than 5000 ppm can cause dizziness,
shortness of breath, rapid pulse. Higher concentrations of carbon
dioxide can be lethal.
Diffuse carbon dioxide fluxes are normally related to anomalous
carbon dioxide air concentration. The user must verify the safety
conditions before entering dangerous areas using specific and
approvated instrumentation.
The Fluxmeter described in this manual is designed to measure
diffuse emission of soil gases and CANNOT be used for different
purposes expecially if related with safety.
The instrument and the electronic accessories are NOT designed to
work in explosion risk areas.
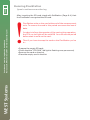
About installation
Before to start the installation of the FluxStation is better to install the Master
center telemetry systems and to setup the Scada software suite on the
computer.
1.1
PAGE
Hints
The onfield installation is described on chapter 2.
The FluxStation clock can be not synchronized with the computer one; then,
since the telemetry is normally off, to save the battery energy, except for a 5
minute period after the station analisys cicle, a synchronization is necessary,
else when the computer will try to call the FluxStation, via telemetry, the remote
telemetry system will be off.
To perform the synchronization:
1) Set the PDA (PalmTop computer) clock with the time you’d like to use (Local /
GMT , ect.);
www.westsystems.com
Fluxstation & computer clocks synchronization
2) After the FluxStation installation set the clock of the FluxStation using
SetStation on the PDA;
3) Set the computer clock.
About carbon dioxide flux
WEST Systems
The flux phenomena can be perturbated by the installation, because digging the
soil, hammering , placing the collar ect..
The “normal” regime will be restored in few days.
WEST Systems
www.westsystems.com
PAGE
1.2
On-Field Installation
Continuous monitoring device handbook
www.westsystems.com
Release 10.1 November 2007
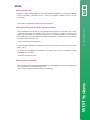
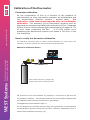
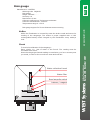
Select the installation site after a carbon dioxide flux survey. The best location is
in the middle of an anomalous efflux area with an homogeneous flux
distribution.The optimal flux value is in the range from 2 to250 moles per
square meter per day. For the choice of the site it is necessary to take into
account that the solar panel has to be oriented toward in the correct direction
and that it must be exposed to sunbeams at least for 4-6 hours per day.It is
necessary to take into account also the functioning of the telemetry system.
In case you are using GSM telemetry please verify the coverage and the signal
strenght using a mobile telephone with a SIM card of the provider you choose for
data transmission. In case you use a SSR24 telemetry from the selected site you
must have a very good direct visibility of the Master Center or of the site where
you will install the radio repeater bridge if necessary.
Moreover it is necessary to evaluate the soil stability and the possibility of
flooding.
If besides the carbon dioxide emission also strong water vapour emission are
present it is necessary to evaluate the possibility of installation of a water
condensing system along the gas sampling line.
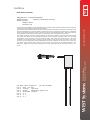
Install the box wit the solar panel orienteded by means of a compass. Fix the
sensors and antenna poles , the different sensors, the accumulation chamber
and then the station. Following the instructions described in the next pages
connect the different devices.
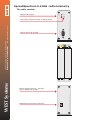
1300 mm
Continuous monitoring device handbook
www.westsystems.com
Release 10.1 November 2007
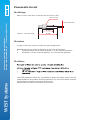
Installation
PAGE
2.1
100 mm
SOIL
!
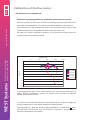
The base of the shelter must be 10 - 15 cm far from the soil, else the
lenght of the accumulation chamber cables could be not enough.
The 10 cm distance allows a good circulation of atmospheric air in the
accumulation chamber area, else the entire shelter become a big
accumulation chamber....
WEST Systems
WEST Systems
800 mm
On-Field Installation
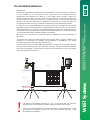
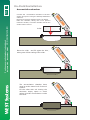
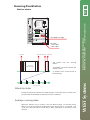
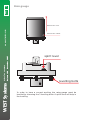
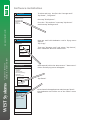
In the drawing the top view of the protection box (DHW), the sensor are not
showed.
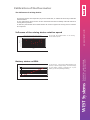
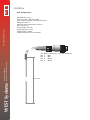
To place the piquets: Unscrew the bolts and lift at the maximum elevation the shelter:
After the installation of piquets down to the shelter at 10 cm distance from soil.
lift
Bolts
Use the piquet-prolongue to hammer the
piquets
Soil
Hit hardly here to block the 3 piquets
WEST Systems
WEST Systems
Continuous monitoring device handbook
www.westsystems.com
Release 10.1 November 2007
900 mm
Continuous monitoring device handbook
www.westsystems.com
Release 10.1 November 2007
PAGE
2.2
2.3
Continuous monitoring device handbook
www.westsystems.com
Release 10.1 November 2007
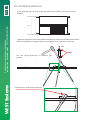
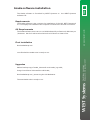
In the picture one of the four stand with the 3 piquets. The soil on the picture
is not exactly a “soft” soil...
In the picture the “chair” for the FluxStation case that must be mounted on
the right part of the shelter to put the fluxstation in a accessible position.
In the picture the accumulation chamber connection box, that must be
mounted on the shelter close to the accumulation ch.
WEST Systems
WEST Systems
Continuous monitoring device handbook
www.westsystems.com
Release 10.1 November 2007
PAGE
On-Field Installation
WEST Systems
WEST Systems
Continuous monitoring device handbook
www.westsystems.com
Release 10.1 November 2007
Continuous monitoring device handbook
www.westsystems.com
Release 10.1 November 2007
PAGE
2.4
On-Field Installation
2.5
PAGE
Amp. 6+T Male
Amp. 6+T Female
from Solar Cell
Amp. 6+T Female
Battery -
Battery +
Aux.2
Aux.1
CE
WEST Systems
RS485/1
RS485/2
RS485/3
Battery
Power supply cable
Pin
Function Color
1
+12V
Red
2
Gnd
Black
3
n.c.
T
n.c.
Solar cell cable
Pin
Function Color
1
n.c.
2
Gnd
Black
3
+12V
Red
T
n.c.
CH 4/5
CH 2/3
www.westsystems.com
FL-I007
WEST Systems
Acc.Ch.
Antenna
Continuous monitoring device handbook
www.westsystems.com
Release 10.1 November 2007
10
Continuous monitoring device handbook
www.westsystems.com
Release 10.1 November 2007
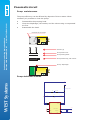
Power supply
PAGE
2.6
On-Field Installation
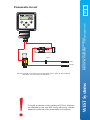
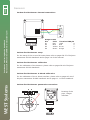
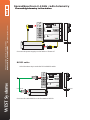
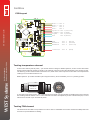
Solar cell charge regulator
+
-
+
-
+
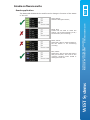
The LED light is:
Green when the battery is full
Yellow normal charge
Red when the battery is empty
Continuous monitoring device handbook
www.westsystems.com
Release 10.1 November 2007
10
Continuous monitoring device handbook
www.westsystems.com
Release 10.1 November 2007
The LED light is ON when the solar cell is exposed to sunlight
10 Ampere fuse (car type)
If the battery voltage fall down to 11.1 Volt the charge regulator turn off the load (the
flux station) in order to save the battery against the overdischarge.
WEST Systems
WEST Systems
If the battery voltage fall down to 11.1 Volt the charge regulator turn off the load (the
flux station) in order to save the battery against the overdischarge. The load will be
reconnected when the battery voltage grows up to 12.6 Volt.
On-Field Installation
2.7
PAGE
Connections
A
B
Power A
CH3
WEST
RS232
CPU
CPU
RUN
MMC-SD
ASF THOMAS ASF THOMAS
CH1
CH0
WEST
Pump
Brombach
CH2
POWER
POWER ON
PULL AND SWITCH
POWER OFF
+12 +24
bp_fff007
ON
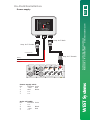
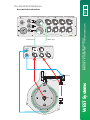
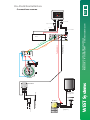
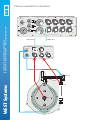
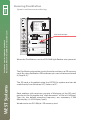
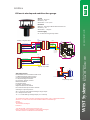
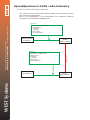
All electrical and pneumatic connections to the flux station are on the left side
panel.
Acc.Ch.
RS485/1
RS485/2
RS485/3
Battery
Antenna
Aux.2
Aux.1
CH 4/5
CH 2/3
www.westsystems.com
FL-I007
Follow the instruction on the next pages for the connection of the detectors
and devices to the flux station.
WEST Systems
PTB100A
R47xxxxx
800-1060 hPa
0-5 VDC
10~30VDC
P2
AWM3300V
CE
WEST Systems
MODEL
SERIAL NO
RANGE
OUTPUT
SUPPLY
PRESSURE TRANSMITTER
Pump
Continuous monitoring device handbook
www.westsystems.com
Release 10.1 November 2007
EXT.TRIG
AGND
GND
SUPPLY
VOUT
Battery
P1
Continuous monitoring device handbook
www.westsystems.com
Release 10.1 November 2007
pin-007
www.westsystems.com
RS485
Connection
panel
On-Field Installation
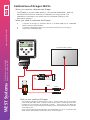
The external sensors connections:
The FluxStation is supplied with several meterological and soil parameters
sensors:
The FluxStation is supplied with several meterological and soil parameters
sensors:
Some of them are managed by the AirBox:
!Air temperature and relative humidity;
!Wind speed and direction;
!Rain fall gauge;
and the others by the SoilBox:
!Soil temperature;
!Soil water content;
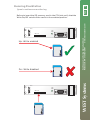
SoilBox and AirBox , described in detail in the Appendix S and Appendix A, are
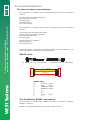
connected with the FluxStation using a RS485 cable:
RS485 cable
Ja Amphenol 6 + T Pin Female
Ja
1
2
3
4
5
6
7
Female
Jb Amphenol 6 + T Pin Female
Gnd
RS485 A
RS485 B
12V Switched
RS485 Cable
Pin
Function
1
Gnd
2
RS485 A
3
RS485 B
4
n.c.
5
n.c.
6
+12V
T
n.c.
Jb
1
2
3
4
5
6
7
Female
Color
Blue
Yellow
Green
Red
The FluxStation RS485 connectors
The FluxStation is equipped with 3 RS485 connectors , marked as
RS485/2, RS485/3;
RS485/1, 2 and 3 have the same pin-out and the same function.
RS485/1,
WEST Systems
WEST Systems
Continuous monitoring device handbook
www.westsystems.com
Release 10.1 November 2007
!Air temperature and relative humidity;
!Wind speed and direction;
!Rain fall gauge;
!Soil temperature;
!Soil water content;
Continuous monitoring device handbook
www.westsystems.com
Release 10.1 November 2007
PAGE
2.8
On-Field Installation
2.9
PAGE
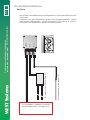
Meteorological detectors: AirBox
To FluxStation RS485/1 connector,
using a RS485 cable.
To Rain Gauge
See page A.2
Continuous monitoring device handbook
www.westsystems.com
Release 10.1 November 2007
Continuous monitoring device handbook
www.westsystems.com
Release 10.1 November 2007
The air box is a new interface described in detail in the appendix A that
allows the use of the new sonic wind speed and direction gauge as well as
the new air temperature and relative humidity digital probe.
A rain gauge can be connected to the AirBox.
WEST Systems
Rain.G
GILL
To Gill Anemometer
using the Gill cable
(page A.3)
WEST Systems
RS485
PAGE
2.10
On-Field Installation
Soil.box
Continuous monitoring device handbook
www.westsystems.com
Release 10.1 November 2007
HUB-04
Soil temperature probe (Page 4.8)
WEST Systems
To FLuxStation RS485/2 connector,
using a RS485 cable (see page 2.6)
www.westsystems.com
OUT
IN-B
IN-A
Soil water content CS616 (Page 4.7)
Pt100
TDR
WEST Systems
SoilBox (Appendix S)
RS485
Continuous monitoring device handbook
www.westsystems.com
Release 10.1 November 2007
The Soil.Box, described in deep in the appendix S, is the new interface for the
soil sensors..
A platinum 100 Ohm temperature probe and a Campbel Scientific CS616
Time Domain Reflectometer can be connected to the soil.box in order to
measure the soil temperature and the soil water content.
On-Field Installation
2.11
PAGE
Accumulation chamber
Acc.Ch.
RS485/1
RS485/2
RS485/3
Battery
Aux.2
CH 4/5
Aux.1
CE
Cable AC2
CH 2/3
www.westsystems.com
FL-I007
Cable AC1
To Aux 1
To Acc. Ch.
CloseSw
Fan
Aux
Linak
OpenSw
Continuous monitoring device handbook
www.westsystems.com
Release 10.1 November 2007
Continuous monitoring device handbook
www.westsystems.com
Release 10.1 November 2007
Antenna
sot-07
Fan
CloseSw
WEST Systems
Linak
sop-05
WEST Systems
OpenSw
On-Field Installation
04
TEN
VV
Place the collar and fill again the hole ,
taking care off the sealing of the collar.
VV
NE
-T
40
1_rf
2_rf
br-05
1_rf
2_rf
The accumulation chamber base
must be at the same level of the soil
surface.
Fill the collar with soil leaving the
minimum empty space to avoid
carbon dioxide accumulation inside
the collar.
br-05
1_rf
2_rf
WEST Systems
br-05
Continuous monitoring device handbook
www.westsystems.com
Release 10.1 November 2007
04
TEN
VV
Collar
VV
NE
-T
40
WEST Systems
Continuous monitoring device handbook
www.westsystems.com
Release 10.1 November 2007
Connect the accumulation chamber to the fluxstation and open it using the PalmTop SetStation
software.
Dig an hole of 35 cm diameter and 10 cm depth.
Place the chamber, taking care of its position
inside the shelter, avoid the chamber touchs the
shelter when it moves.
VV
NE
-T
40
Accumulation chamber
04
TEN
VV
PAGE
2.12
On-Field Installation
2.13
PAGE
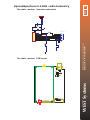
Connections resume
10
from Solar Cell
Amp. 6+T Female
Battery -
Battery +
Acc.Ch.
RS485/1
RS485/2
RS485/3
Battery
Antenna
Battery
Aux.2
Aux.1
CE
x1
Au
To Acc. Ch.
CloseSw
Fan
Aux
Linak
www.westsystems.com
FL-I007
To RS485/2
To
To Aux 1
CH 2/3
h.
.C
c
Ac
To RS485/1
To
CH 4/5
OpenSw
OpenSw
Linak
sop-05
Fan
CloseSw
Soil temperature probe (Page 4.8)
Soil water content CS616 (Page 4.7)
TDR
Pt100
RS485
WEST Systems
Soil.Box
SoilBox (Appendix S)
To Rain Gauge
See page A.2
Air.Box
RS485
Rain.G
GILL
To Gill Anemometer
using the Gill cable
(page A.3)
WEST Systems
sot-07
Continuous monitoring device handbook
www.westsystems.com
Release 10.1 November 2007
Amp. 6+T Female
Continuous monitoring device handbook
www.westsystems.com
Release 10.1 November 2007
Amp. 6+T Male
PAGE
2.14
On-Field Installation
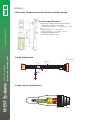
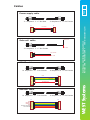
Accumulation chamber tubes
Acc.Ch.
RS485/1
RS485/2
RS485/3
Battery
Aux.1
CH 4/5
CE
CH 2/3
www.westsystems.com
FL-I007
Red 6x4 Rilsan Tube
Connect the accumulation chamber to the
FluxStation respecting the InLet / OutLet.
The InLet must be protected with the 2 inches
filter mounted on the accumulation chambe base.
Black 6x4 Rilsan Tube
Filter
Continuous monitoring device handbook
www.westsystems.com
Release 10.1 November 2007
Silicon Tube
Linak
sot-07
Fan
CloseSw
WEST Systems
Aux.2
sop-05
WEST Systems
Continuous monitoring device handbook
www.westsystems.com
Release 10.1 November 2007
Antenna
3.1
Pump
Brombach
Outlet
ASF THOMAS ASF THOMAS
>
Pump
>
Brombach
Inlet
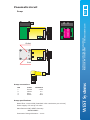
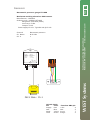
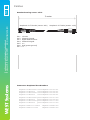
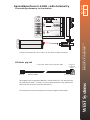
Pump connections
Pin
1
2
3
4
Color
Brown
White
Blue
Black
Function
+12V
n.c.
n.c.
Gnd
Pump specifications
Rated flow: 1000 SCCM (Standard cubic centimeter per minute)
Power supply 150 mA @ 12 Volts
Manufacturer KNF, WEST Germany
NMP830KNDC
Pneumatic fittings diameter : 4 mm
DC/DC
ASF THOMAS ASF THOMAS
9..12/12V
+
WEST Systems
Pump
Continuous monitoring device handbook
www.westsystems.com
Release 10.0 November 2007
PAGE
Pneumatic circuit
PAGE
3.2
Pneumatic circuit
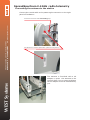
Pump maintenance
!
!
!
Disassemble the pumping head
Clean the diaphragm, the washer, and the valves using a compressed
air flow.
Reassemble the head.
ASF THOMAS ASF THOMAS
V
Unscrew the 4 screws
Pump
V
Brombach
Screws (4)
Pump head cover
Pump head gasket
Pump head body, with valves
Pump diaphragm
ASF THOMAS ASF THOMAS
Continuous monitoring device handbook
www.westsystems.com
Release 10.0 November 2007
The pump efficiency can be affected by deposits of dust or water. When
necessary it's possible to clean the pump:
Pump
Brombach
Pump stabilizer scheme
WEST Systems
Gnd
+VIN
F1
Fusibile Rip. 500mA
D1
18V 600W
C1
-VIN
+VIN_prot
1uF
2
3
9
11
-Vin
-Vin
Com
-Vout-d
TEN3-1212
+Vin
+Vin
Com / -Vout-s
+Vout-s/d
DC1
23
22
-Pump
16
14
C2
1uF
+Pump
3.3
P1
P2
Pump
Brombach
>
>
AWM3300V
A
B
Filter
Inlet
ASF THOMAS ASF THOMAS
Outlet
Continuous monitoring device handbook
www.westsystems.com
Release 10.0 November 2007
PAGE
Pneumatic circuit
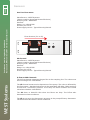
!
To avoid problems on the reading of P.Flow, that can
be affected by the new KNF pump efficiency, please
adopt this schema in the pneumatic connections.
WEST Systems
All the internal connections are made with silicon tube 8 mm external
diameter 3.3 mm internal diameter;
PAGE
3.4
Pneumatic circuit
The fittings
WEST Systems Tube fitting for RILSAN 6x4 and Silicon tubes
M10 x 1mm
WEST Systems
Continuous monitoring device handbook
www.westsystems.com
Release 10.0 November 2007
2.8 mm Diameter
25 mm
Material : Chromed brass
44 mm
The tubes
3 types of tube are used to realize the gas sampling line:
!RILSAN tube 6 mm external diameter 4 mm internal diameter;
!
SILICON tube 8 mm external diameter 3.3 mm internal diameter;
!
SILICON 12.5 mm external diameter 4.3 mm internal diameter.
The filters
The PTFE membrane filters are permeable to gases and water vapour and are
impermeable to liquid water and dust particles. The use of the filters protects
the gas detectors and the other pneumatic parts.
Please check the status of the filters every month.
4.1
PAGE
Sensors
Carbon dioxide detector
DRAGER Polytron IR CO2 Specifications
!Accuracy 3% of reading for > 350 ppm
!Signal noise: 1% of reading pk-pk noise Out 4~20 mA linearized.
!IP63 Case with anti spray protection IP65.
!Operating temperature : between -20 and +65 °C.
!Air relative humidity 0~95%.
Release 10.0 November 2007
!Power supply 14-24 Volt DC Typical 300mA @ 24V
DB 9 Male : Ch.0
Channel CO2
Ch. Name CO2 ppm
Ch. number 0
WEST Systems
!Full scale :Range 2000 ppm ~ 100% configurable by the operator.
Continuous monitoring device handbook
www.westsystems.com
Release 10.0 November 2007
Working principles: Double beam IR Detector with solid state sensor
compensated in temperature, without moving parts.
Sensors
Carbon dioxide detector internal connections
K1
K2
K3
K4
Drager Cable
Pin
Color
K1
Red
K2
Blue
K3
Yellow
K4
Green
Function DB9 pin
+24V
9
Gnd
5
S.Low
7
S.High
2
Carbon dioxide detector setup
For the setup of the correct full scale please refer to pages 56-57 of Polytron
transmitter IR CO2 handbook and to page 3.4 of this manual.
Carbon dioxide detector calibration
For the calibration of the detector please refer to pages 38-42 of Polytron
transmitter IR CO2 handbook
Carbon dioxide detector 4-20 mA calibration
Carbon dioxide detector pneumatic connections
2 x M5
50.0
WESTSystems
Systems
WEST
For the calibration of the 4-20mA interface please refer to pages 43-44 of
Polytron transmitter IR CO2 handbook and to page 11.1 of this handbook.
Drawing of the
pipe - Drager
interface.
Release 10.0 November 2007
9 8 7 6
5 4 3 2 1
Continuous monitoring device handbook
Release 10.0 November 2007www.westsystems.com
PAGE
4.2
4.3
PAGE
Sensors
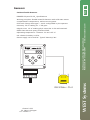
Barometric pressure gauge PT100B
Barometric pressure
B.Pr. HPa
1
PRESSURE TRANSMITTER
MODEL
SERIAL NO
RANGE
OUTPUT
SUPPLY
PTB100A
R47xxxxx
800-1060 hPa
0-5 VDC
10~30VDC
EXT.TRIG
AGND
GND
SUPPLY
VOUT
9 8 7 6
5 4 3 2 1
DB 9 Male : Ch.1
Vaisala Cable
Pin
Color
Supply
Red
Gnd
Blue
AGnd
Yellow
VOut
Green
Function DB9 pin
+12V
4
Gnd
5
S.Low
7
S.High
2
WEST Systems
Release 10.0 November 2007
Channel
Ch. Name
CH. #
Continuous monitoring device handbook
www.westsystems.com
Release 10.0 November 2007
Maximum working elevation 4000 meters
Manufatcurer : VAISALA
Ordering code :VAISALA-PT100B
Range 600-1060 HPa (mBar)
Accuracy 0.5 HPa
Outpu 0-5 Volt
Power supply 12 Volt Typical 4 mA @ 12 Volt
PAGE
4.4
Sensors
Gas line flow meter
Flow direction (P1 to P2)
P1
P2
A
B
AWM3300V
dP Channel
Manufatcurer : WEST Systems
(Sensor made by Honeywell-SensorTechnics)
Ordering code :AWM3300
Gas flow
Range 0 to 1300 SCCM
Accuracy 2% of F.S.
Power supply 10 Volt Typical 30 mA @ 24 Volt
WESTSystems
Systems
WEST
P.flow and dP Channels
The P.Flow channel measures the gas flow in the sampling line. The value must
be in the range 700-1450 SCCM.
The dP channel measures the depression of the pump. The value is affected by
the filter status. Standard values are in the range 800-950 HPa. (When working
at sea-level: Carometric pressure 1013 HPa). At these condition the P.Flow
value has to be 800-1450 SCCM.
The dP down to 600-650 HPa when the filters are dirty. The P.Flow also
decreases in these conditions.
The dP grows up to the barometric pressure is the pump efficiency decreases.
The P.Flow also decreases in these conditions.
Release 10.0 November 2007
Continuous monitoring device handbook
Release 10.0 November 2007 www.westsystems.com
Manufatcurer : WEST Systems
(Sensor made by Honeywell-SensorTechnics)
Ordering code :AWM3300
Gas flow
Range 0 to 1300 SCCM
Accuracy 2% of F.S.
Power supply 10 Volt Typical 30 mA @ 24 Volt
Manufatcurer : Campbell Scientific
Ordering code : . . . CS616 / CS615 (Out of stock)
Water content
Range 5-50 %
Accuracy 3%
Release 10.0 November 2007
The CS616 (CS615) Water Content Reflectometer measures the volumetric water content of porous
media using time-domain measurement methods.
The Water Content Reflectometer consists of two stainless steel rods connected to a printed circuit
board. A shielded four-conductor cable is connected to the circuit board to supply power, enable the
probe, and monitor the pulse output. The circuit board is encapsulated in epoxy. The probe rods can
be inserted from the surface or the probe can be buried at any orientation to the surface.
The CS616 (CS615) response is dependent on the dielectric constant of the material surrounding
the probe rods. Water is the principal contributor to the dielectric constant value, but the solid
constituents such as quartz, clay and organic matter also affect the measurement. The same
calibration of volumetric water content to probe output signal period may not apply to all soils.
Accuracy can be optimized by using calibrations derived for a specific soil. Accuracy of ± 2.0% over
the entire water content range and for a wide range of soil types is routinely obtained in our
laboratory. Applying the general calibrations from the operating manual provides accuracy of ±
3.0%.
6+T
Pin
Pin
Pin
Pin
Pin
Pin
Pin
Male cable connector
(To the SoilBox)
1 : Red +12 Volt
2 : Orange
Ignition
3 : Green
Frequency signal out
4 : Black+Sh. Ground
5 : n.c.
6 : n.c.
T : n.c.
WEST Systems
Soil water content
Continuous monitoring device handbook
www.westsystems.com
Release 10.0 November 2007
Sensors
PAGE
4.5
Sensors
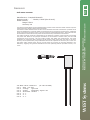
Soil temperature
Manufatcurer : RS
Ordering code :RS 321-6090
Type : Pt100 DIN IEC 751 Class B 4 wires
Range 0 to 200 °C
Max operating temperature 200°C
Accuracy 0.3°C
Probe length 300 mm
Probe diameter 6 mm
Cable length 3 Meter
Cable PTFE and silicon insulated
3+T
Pin
Pin
Pin
Pin
Male connector (to the SoilBox)
1 : RED
2 : RED
3 : White
T : White
WESTSystems
Systems
WEST
300 mm
The meteorological sensors are described in the Appendix A.
Release 10.0 November 2007
Continuous monitoring device handbook
Release 10.0 November 2007www.westsystems.com
PAGE
4.6
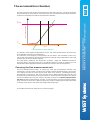
The flux is proportional to the concentration increase ratio ppm/sec. The proportionality
factor depends on the chamber volume/surface ratio as well as the barometric pressure
and the air temperature inside the accumulation chamber.
5.1
PAGE
The accumulation chamber
Time
Concentration increase ppm/sec
The station, in the default configuration record and store the barometric pressure, the
air temperature and the soil temperature.
The variation of few degrees of temperature do not affect the evaluation of flux very
much, then it's possible to use the air temperature instead of the temperature of the gas
mixture into the accumulation chamber.
The instrument measures the barometric pressure, using the VAISALA barometric
pressure gauge, with a good accuracy. A platinum Pt100 it's used to measure the soil
temperature and a digital solid state based device measure the air temperature.
Choosing the flux measurement unit
The first measurements made, 10 years ago, with the accumulation chamber was
expressed in cm/sec which is a speed, the speed of carbon dioxide flowing out from the
soil. During the last ten years several units have been used by volcanologist and by
geochemistry researchers. The most common unit is grams/squaremeter per day, but
using the same instrument for two gas species to express the flux using this unit means
to have two different conversion factors. Actually we use the unit moles/squaremeter
per day that has two advantages: A single conversion factor for every gas specie and an
easy conversion of the flux in grams/sm per day simply multiplying the result expressed
in moles/sm per day for the molecular weight of the target gas.
The Scada-suite the flux using the unit "moles/mq/day"
Continuous monitoring device handbook
www.westsystems.com
Release 10.0 November 2007
Gas concentration
C Air
WEST Systems
WEST Systems
Continuous monitoring device handbook
www.westsystems.com
Release 10.0 November 2007
C Soil
PAGE
5.2
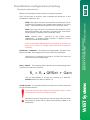
The accumulation chamber
The accumulation chamber factors
86400 P
10
6
R Tk
V
A
Where
!
!
!
!
!
P is the barometric pressure expressed in mBar (HPa)
R is the gas constant 0.08314510 bar L K-1 mol-1
Tk is the air temperature expressed in Kelvin degree
V is the chamber net volume in cubic meters
A is the chamber inlet net area in square meters.
The dimensions of the A.c.K. are
In the table the conversion factors vs temperaure and barometric pressure
Accumulation Chamber Type A and B are reported.
for the
An example:
If the slope of the flux curve is 2.5 ppm/sec, the barometric pressure is 1011 mBar (HPa)
and the air temperature is 23 °C.
From the table (Page 5.7) get the value that correspond to the barometric pressure and
temperature. In this case I get the value computed for 25°C and 1013 mBar : 0.440
Then the flux is: 2.5 x 0.440 = 1.10 moles per square meter per day.
WEST Systems
WEST Systems
Continuous monitoring device handbook
www.westsystems.com
Release 10.0 November 2007
K=
Continuous monitoring device handbook
www.westsystems.com
Release 10.0 November 2007
Here following the formula used to compute the A.c.K.:
The accumulation chamber
-10
0.499
0.484
0.470
0.456
0.443
0.430
0.417
0.405
0.393
0.382
0.371
0.360
0.349
0.339
0.329
0.320
0.310
-5
0.489
0.475
0.461
0.448
0.435
0.422
0.410
0.398
0.386
0.375
0.364
0.353
0.343
0.333
0.323
0.314
0.305
0
0.480
0.466
0.453
0.440
0.427
0.414
0.402
0.390
0.379
0.368
0.357
0.347
0.337
0.327
0.317
0.308
0.299
5
0.472
0.458
0.445
0.432
0.419
0.407
0.395
0.383
0.372
0.361
0.351
0.340
0.331
0.321
0.312
0.302
0.294
Air.T. °C
10
15
0.463
0.455
0.450
0.442
0.437
0.429
0.424
0.417
0.412
0.404
0.400
0.393
0.388
0.381
0.377
0.370
0.366
0.359
0.355
0.349
0.345
0.339
0.334
0.329
0.325
0.319
0.315
0.310
0.306
0.301
0.297
0.292
0.288
0.283
20
0.448
0.435
0.422
0.410
0.398
0.386
0.375
0.364
0.353
0.343
0.333
0.323
0.314
0.304
0.296
0.287
0.279
25
0.440
0.427
0.415
0.403
0.391
0.379
0.368
0.358
0.347
0.337
0.327
0.318
0.308
0.299
0.291
0.282
0.274
30
0.433
0.420
0.408
0.396
0.384
0.373
0.362
0.352
0.341
0.331
0.322
0.312
0.303
0.294
0.286
0.277
0.269
35
0.426
0.413
0.401
0.390
0.378
0.367
0.356
0.346
0.336
0.326
0.317
0.307
0.298
0.290
0.281
0.273
0.265
Continuous monitoring device handbook
www.westsystems.com
Release 10.0 November 2007
Bar. Pressure
Hpa (mbar)
1013
983
955
927
900
873
848
823
799
776
753
731
710
689
669
649
630
WEST Systems
WEST Systems
Continuous monitoring device handbook
www.westsystems.com
Release 10.0 November 2007
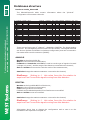
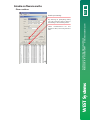
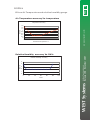
In the following table the factors for the conversion from ppm/sec slope to
moles m-2 day-1 are reported
PAGE
5.3
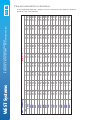
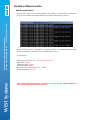
-10
21.94
21.30
20.68
20.07
19.49
18.92
18.37
17.83
17.31
16.80
16.31
15.84
15.37
14.92
14.49
14.06
13.65
-5
21.53
20.90
20.29
19.70
19.12
18.57
18.02
17.50
16.99
16.49
16.01
15.54
15.09
14.65
14.22
13.80
13.40
WEST Systems
Bar. Pressure
Hpa (mbar)
1013
983
955
927
900
873
848
823
799
776
753
731
710
689
669
649
630
WEST Systems
0
21.14
20.52
19.92
19.34
18.77
18.23
17.69
17.18
16.67
16.19
15.71
15.26
14.81
14.38
13.96
13.55
13.15
15
20.04
19.45
18.88
18.33
17.80
17.28
16.77
16.28
15.81
15.34
14.90
14.46
14.04
13.63
13.23
12.84
12.47
20
19.70
19.12
18.56
18.02
17.49
16.98
16.49
16.00
15.54
15.08
14.64
14.21
13.80
13.40
13.01
12.63
12.26
25
19.37
18.80
18.25
17.72
17.20
16.70
16.21
15.74
15.28
14.83
14.40
13.98
13.57
13.17
12.79
12.41
12.05
Continuous monitoring device handbook
www.westsystems.com
Release 10.0 November 2007
5
20.76
20.15
19.56
18.99
18.44
17.90
17.38
16.87
16.37
15.90
15.43
14.98
14.54
14.12
13.71
13.31
12.92
Air T. °C
10
20.39
19.80
19.22
18.66
18.11
17.58
17.07
16.57
16.09
15.62
15.16
14.72
14.29
13.87
13.46
13.07
12.69
Continuous monitoring device handbook
www.westsystems.com
Release 10.0 November 2007
30
19.05
18.49
17.95
17.43
16.92
16.42
15.94
15.48
15.02
14.59
14.16
13.75
13.34
12.95
12.58
12.21
11.85
PAGE
5.4
The accumulation chamber
In the following table the factors for the conversion from ppm/sec slope to
grams m-2 day-1 are reported
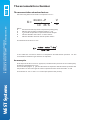
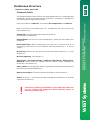
C02
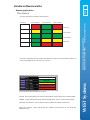
4.8 ppm, 85 s
2500 ppm
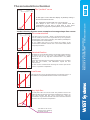
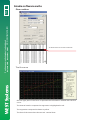
Flux:50.6 ppm/s , r 0.999
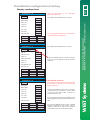
The "perfect" curve
5.5
PAGE
The accumulation chamber
For clearness only the CO2 flux curve is shown.
The shape of the curve is quite perfect and the
computation of the flux is done with a very good
accuracy: r (regression quality factor) very close to 1.
200 ppm
100
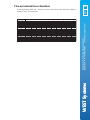
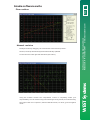
In the following figures some examples of strange shape flux curves:
C02
4.8 ppm, 85 s
2500 ppm
Flux:32.6 ppm/s , r 0.815
Air contamination
The flux curve is no longer "linear", the linear best fit curve do
not fit exactly the flux curve as pointed out by the regression
quality factor (0.815 in the example). This effect is probably due
to atmospheric air contamination.
If you obtain this kind of curve check the sealing of the
accumulation chamber with the soil or check that tubes, filters
and pump are intact.
200 ppm
100
C02
4.8 ppm, 85 s
2500 ppm
Flux:32.6 ppm/s , r 0.815
Gas stratification
This shape of curve indicates that the concentration of the target in
air, close to the soil, is very high. This stratification is quite
common in case of very high flux combined with a very stable
atmosphere.
In this case clean the gas line making a measure in air, one meter
above the soil surface, and afterwards repeat the flux
measurement.
200 ppm
100
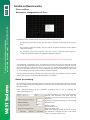
C02
4.8 ppm, 85 s
2500 ppm
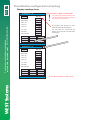
Flux:0.6 ppm/s , r 0.925
You can use the measurement choosing the second part of the
curve for regression computation.
Low fluxes
Continuous monitoring device handbook
www.westsystems.com
Release 10.0 November 2007
Continuous monitoring device handbook
www.westsystems.com
Release 10.0 November 2007
In the figure on the left the display of palmtop during a
flux mesurement is shown.
200 ppm
100
C02
4.8 ppm, 85 s
250000 ppm
Flux:600.9 ppm/s , r 0.925
Very high flux
The first part of the curve is not linear. The problem is due to the
combined effect of the high flux and the sampling line cleaning. To
avoid this increase the flux curve record time until the
concentration of gas reachs the full scale value and select the last
part of the curve for the flux computation.
200 ppm
100
This effect is due to the
cleaning of the sampling
line dead volumes
WEST Systems
WEST Systems
This type of curve is normal when the flux is low and the "noise" of
the detector is comparable with the increase of concentration.
WEST Systems
04
T-
Continuous monitoring device handbook
www.westsystems.com
Release 10.0 November 2007
sot-07
br-05
1_rf
2_rf
WEST Systems
EN
VV
VV
NE
-T
40
Continuous monitoring device handbook
www.westsystems.com
Release 10.0 November 2007
480
sop-05
PAGE
5.6
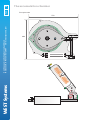
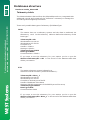
The accumulation chamber
Foot print size
570
The accumulation chamber
PAGE
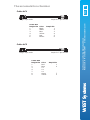
5.7
Cable AC1
Color
Black
White
Blue
Yellow
Red
Brown
Amph Pin
1
2
3
4
5
6
Cable AC2
Bulgin 9 pin male
Cable AC2
Bulgin Pin
1
2
3
4
7
8
9
Amph 3+T pin female
Color
Red
Blue
n.c.
n.c
n.c
Green
Yellow
Amph Pin
1
2
Continuous monitoring device handbook
www.westsystems.com
Release 10.0 November 2007
Cable AC1
Bulgin Pin
1
2
3
4
5
6
Amph 6+T pin female
T
3
WEST Systems
WEST Systems
Continuous monitoring device handbook
www.westsystems.com
Release 10.0 November 2007
Bulgin 6 pin male
SA1
M1
J9
7
6
5
4
3
2
1
F_LINAK
J10
7
6
5
4
3
2
1
F_FAN
J2
7
6
5
4
3
2
1
FAN
FAN+
R3
1K
D2
FAN
BYT03
D1
R1
1K
R2
1K
EnB
D3
D4
AC_Blue AC_Brown
Continuous monitoring device handbook
www.westsystems.com
Release 10.0 November 2007
EV6
FAN+
VDC
EnBlue
EnBrown
FAN+
VDC
EnBlue
EnBrown
EV6
EnBlue
L2
10W 12V RS579219
Continuous monitoring device handbook
www.westsystems.com
Release 10.0 November 2007
J3
7
FAN+
6
VDC
5
EnBlue
4
EnBrown
3
EV6
2
1
OPZIONALE
J1
7
6
5
4
3
2
1
LINAK
WEST Systems
FAN
+
LINAK
A
WEST Systems
-
EV6
FAN+
VDC
EnB
J11
1
2
3
4
5
6
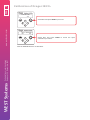
PAGE
5.8
The accumulation chamber
To Station Acc.Ch. (See chapter 2)
Type: inductive proximity;
Model: IM020BM60TB8
Range: 2mm- Shielded;
Protection grade: IP67;
Made by Wenglor
Thread: M8
LED Light - On/Off
IM020BM60TB8 real size
Cables:
Type: Nano change;
Part #:403001I03M020
Brand: Brad Harrison
PAGE
WEST Systems
WEST Systems
Continuous monitoring device handbook
www.westsystems.com
Release 10.0 November 2007
Two proximity switches control the full opening and full closing of the
accumulation chamber.
5.9
Continuous monitoring device handbook
www.westsystems.com
Release 10.0 November 2007
The accumulation chamber
The accumulation chamber
PAGE
5.10
Acc.Ch.
RS485/1
RS485/2
RS485/3
Battery
Aux.2
CH 4/5
Aux.1
CE
Cable AC2
CH 2/3
www.westsystems.com
FL-I007
Cable AC1
To Aux 1
To Acc. Ch.
CloseSw
Fan
Aux
Linak
OpenSw
Continuous monitoring device handbook
www.westsystems.com
Release 10.0 November 2007
Continuous monitoring device handbook
www.westsystems.com
Release 10.0 November 2007
Antenna
sot-07
Fan
CloseSw
WEST Systems
Linak
sop-05
WEST Systems
OpenSw
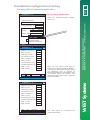
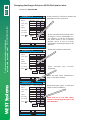
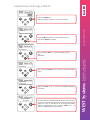
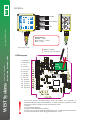
Flux Station configuration/testing
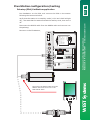
Palmtop (PDA) SetStation application
Run SetStation on the PDA, and connect the PDA to the station
following the instruction below.
PAGE
6.1
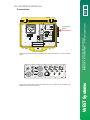
Now turn on the FluxStation,
pin-007
PTB100A
R47xxxxx
800-1060 hPa
0-5 VDC
10~30VDC
MODEL
SERIAL NO
RANGE
OUTPUT
SUPPLY
PRESSURE TRANSMITTER
EXT.TRIG
AGND
GND
SUPPLY
VOUT
www.westsystems.com
Battery
Pump
P1
P2
A
B
Power A
AWM3300V
CH3
WEST
RS232
CPU
CPU
RUN
MMC-SD
CH2
CH0
WEST
CH1
POWER
POWER ON
PULL AND SWITCH
POWER OFF
ON
+12 +24
Continuous monitoring device handbook
www.westsystems.com
Release 10.0 November 2007
Disconnect the RS232 cable from the SSR24 radio and connect it to
the palmtop;
RS485
Continuous monitoring device handbook
www.westsystems.com
Release 10.0 November 2007
Verify that the station is in stand.by mode (+12V and +24V led light
off) , else wait that the station finished the analisys cicle, then turn it
off.
Disconnect the RS232 cable from the
SSR24 radio and connect it to the
PDA RS232 cable.
n300
WEST Systems
WEST Systems
acer
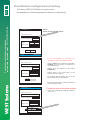
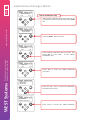
Flux Station configuration/testing
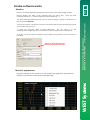
Palmtop (PDA) SetStation application
SetStation 1.2
Select :
COM1 Serial Cable on COM1
Communication port
Connected Station IP
Status
Station Date
Get All
Set All
File
Parameters
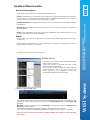
SetStation 1.2
If the communication is successful the
information on the screen will be updated.
Communication port
>
COM1 Serial Cable on COM1
Status: Idle when the station is in StandBy /
running when the station is performing a
mesurement clicle;
0.1
Connected Station IP
Station IP is the address of the station
Default 0.1;
idle
Status
Continuous monitoring device handbook
www.westsystems.com
Release 10.0 November 2007
Run SetStation on the PDA (Installation instruction on Appendix Z)
>
Continuous monitoring device handbook
www.westsystems.com
Release 10.0 November 2007
PAGE
6.2
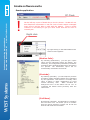
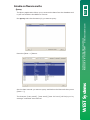
refresh
Station Date 06/12/07 12:34:36
Station Date is the actual value of the
Date/Time clock of station.
By pressing Refresh button the clock and
status information will be updated.
Set All
Parameters
SetStation 1.2
Get All will download all setting parameters
from the station to PDA.
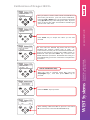
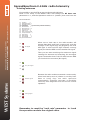
Checking and immediate actions
Select the {Parameters}{Display readings}
menu voice.
Communication port
COM1 Serial Cable on COM1
Connected Station IP
Status
idle
>
WEST Systems
File
0.1
refresh
Station Date 06/12/07 12:34:36
Flux Analisys
Data Logger
readings
GetDisplay
All
Set
All
Program timings
Channels parameters
File
Parameters
WEST Systems
Get All
Flux Station configuration/testing
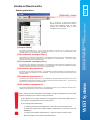
Display readings form
Now the infromation
channels is displayed.
SetStation 1.2
of
the
analogical
PAGE
6.3
Digital
CO2 ppm
350.45
1013.45
Ch.2 mA
0.00
Ch.3 mV
0.00
Ch.4 mV
0.00
Ch. 5 mV
0.00
dP. mBar
1013.45
P.Flow SCCM
4.05
Pump On
RS485 scan
AC Up
Format SD
Set Clock
AC down
SD Status
Radio On
Sample now
SetStation 1.2
The readings are updated every second;
Digital >>
TDR %
50.45
TDR raw uSec
134.45
6B13 °C
32.00
0.00
6B13 RAW Ohm
AirRH %
96.00
Air.T. °C
29.00
WindSpeed m/s
3.45
Wind.Dir °N
134.05
Pump On
RS485 scan
AC Up
Format SD
Set Clock
AC down
SD Status
Radio On
Sample now
Immediate actions
SetStation 1.2
WEST Systems
Digital
CO2 ppm
Bar.P.mBar
If the list of digital sensors can’t fit in a single
page a cursor will appear to list the missing
channels.
350.45
By pressing [Pump On] button the pump will
be activated. It will be on up to [Pump Off]
button is pressed.
1013.45
Ch.2 mA
0.00
Ch.3 mV
0.00
Ch.4 mV
0.00
Ch. 5 mV
0.00
dP. mBar
1013.45
P.Flow SCCM
4.05
Pump On
RS485 scan
AC Up
Format SD
Set Clock
AC down
SD Status
Radio On
Sample now
Same considerations for the other commands
, except the AC Up / AC Down , where a time
out will stop the action after a while. (To
protect the AC motor);
By pressing [Set Clock] the FluxStation clock
will be updated using the clock information of
PDA.
By pressing [RS485 Scan] the list of digital
sensors connected to the station will be
updated. Perform this action if you added a
new digital sensor, as Soil.Box and Air.Box;
WEST Systems
Analog
By pressing [Digital] button the information
of digital channels is displayed..
Continuous monitoring device handbook
www.westsystems.com
Release 10.0 November 2007
Continuous monitoring device handbook
www.westsystems.com
Release 10.0 November 2007
Bar.P.mBar
The readings are updated every second;
Flux Station configuration/testing
Display readings form
SD memory card commands.
SetStation 1.2
Digital
CO2 ppm
350.45
Bar.P.mBar
Continuous monitoring device handbook
www.westsystems.com
Release 10.0 November 2007
!
SD Ok
1013.45
Ch.2 mA
0.00
Ch.3 mV
0.00
Ch.4 mV
0.00
Ch. 5 mV
0.00
dP. mBar
1013.45
P.Flow SCCM
By pressing [SD Status] an short
report about the SD card appear;
The “SD Card Ok” means that the
station found the SD card and that’s
working fine.
4.05
Pump On
RS485 scan
AC Up
Format SD
Set Clock
AC down
SD Status
Radio On
Sample now
ok
SetStation 1.2
Digital
SD Ok
CO2 ppm
Bar.P.mBar
By pressing [Format SD] button the
SD card will be formatted, loosing all
the data stored on the card.
350.45
1013.45
Ch.2 mA
0.00
Ch.3 mV
0.00
Ch.4 mV
0.00
Ch. 5 mV
0.00
dP. mBar
1013.45
P.Flow SCCM
4.05
Pump On
RS485 scan
AC Up
Format SD
Set Clock
AC down
SD Status
Radio On
Sample now
Continuous monitoring device handbook
www.westsystems.com
Release 10.0 November 2007
PAGE
6.4
WEST Systems
WEST Systems
Press OK to go back to main form .
Flux Station configuration/testing
6.5
Flux analisys parameters
SetStation 1.2
Select the {Parameters}{Flux
menu voice.
Communication port
idle
refresh
Station Date 06/12/07 12:34:36
Flux Analisys
Data Logger
readings
GetDisplay
All
Set
All
Program timings
Channels parameters
File
Parameters
ok
SetStation 1.2
Analisys every (sec)
0
Warm up (sec)
0
Cleaning time (sec)
0
AC closing time (sec)
0
Num of samples #
0
Delta T (msec)
0
AC opening time (sec)
0
2nd cleaning time (sec)
0
Radio on (sec)
0
Radio off (sec)
0
Get
Set
Advanced
Ok
ok
WEST Systems
SetStation 1.2
Analisys every (sec)
3600
Warm up (sec)
120
Cleaning time (sec)
30
AC closing time (sec)
15
Num of samples #
Delta T (msec)
120
1500
AC opening time (sec)
15
2nd cleaning time (sec)
30
Radio on (sec)
600
Radio off (sec)
900
Get
Set
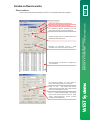
When the form appear press [Get] to
download the data for FluxStation. Modify, is
necessary, the parameters and press [Set].
The [Advanced] menu is reserved for
advanced programming of FluxStation when
not standard actions are necessary. The
advanced programming is quite complicate
and not adviceable.
Advanced
Ok
See next pages to
parameters meaning.
understand
the
WEST Systems
0.1
Connected Station IP
Continuous monitoring device handbook
www.westsystems.com
Release 10.0 November 2007
Continuous monitoring device handbook
www.westsystems.com
Release 10.0 November 2007
analisys}
>
COM1 Serial Cable on COM1
Status
PAGE
Palmtop (PDA) SetStation application
Flux Station configuration/testing
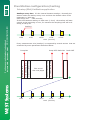
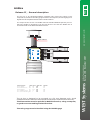
Analisys every time It's the interval between analisys. Normally the
station makes an analisys every hour and then the default value of the
parameter is 3600 sec;
Valid range 300 .. 7200 seconds;
If the time between analisys is 3600 secs (1 hour) the analisys will start
exactly at the beginning of hour, for instance the sampling time will be 8
sharp, 9 sharp ect.
Analisys
8:00
9:00
10:00
11:00
12:00
time (hh:mm)
Every measurement cicle (analisys) is composed by several actions that are
scheduled by some parameters described below.
8:00
9:00
10:00
2nd Line Cleaning time
Flux record
See next pages
Open acc.chamber time
Pump OFF Radio ON
Close acc.chamber time
Line Cleaning time
Warm UP time
Pump ON
11:00
time (hh:mm)
12:00
Radio OFF
Continuous monitoring device handbook
www.westsystems.com
Release 10.0 November 2007
Palmtop (PDA) SetStation application
WEST Systems
WEST Systems
Continuous monitoring device handbook
www.westsystems.com
Release 10.0 November 2007
PAGE
6.6
Flux Station configuration/testing
6.7
PAGE
Palmtop (PDA) SetStation application
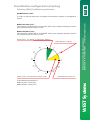
Set RADIO On/OFF:
RADIO Off time (sec)
The telemetry system will be turned OFF after every analisys starting from the
time,expressed in minutes, you set.
Green sector : the station is making the analisys
Radio ON time: 600 sec
0
55
50
5
45
20
40
15
Continuous monitoring device handbook
www.westsystems.com
Release 10.0 November 2007
RADIO On time (sec)
The telemetry system will be turned ON after every analisys starting from the
time,expressed in minutes, you set.
10
35
25
Continuous monitoring device handbook
www.westsystems.com
Release 10.0 November 2007
In order to reduce the power consuption the telemetry system is managed as
follow:
30
In the drawing a example of
Radio On time = 600 (sec)
Radio Off time = 900 (sec)
Radio OFF time: 900 sec.
WEST Systems
WEST Systems
Yellow sector : the telemetry system is ON
Flux Station configuration/testing
Palmtop (PDA) SetStation application
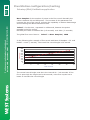
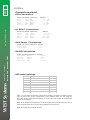
Delta T.: Is the time , expressed in millisecond, between the points
sampled in the flux record.
Normally the value is between 500 (0.5 seconds) and 3000 ( 3 seconds)
The global flux record time is : Delta T. x Num. Samples/ 1000
CO2 ppm
In the following plot a sample of flux record with Num of Samples = 32 and
DeltaT. = 1000 (1 second). The overal flux record lenght is 32 second.
900
800
700
600
500
400
300
200
100
0
0
5
10
15
20
25
30
35
Time seconds
The normal record lenght must be in the interval 90 .. 240 seconds. If the
flux is quite high the lenght can be 90 seconds, is the flux is quite low is
better to increase the record lenght
WEST Systems
WEST Systems
Continuous monitoring device handbook
www.westsystems.com
Release 10.0 November 2007
Num. Samples: Is the number of points in the flux record. Normally the
value is between 32 and 256 points. The increase of this parameter will
increase the size of the record, reducing the capability of station data storage
and increasing the data transmission time.
Continuous monitoring device handbook
www.westsystems.com
Release 10.0 November 2007
PAGE
6.8
Flux Station configuration/testing
6.9
Data Logger parameters
Communication port
idle
0.1
refresh
Station Date 06/12/07 12:34:36
Flux Analisys
Data Logger
readings
GetDisplay
All
Set
All
Program timings
Channels parameters
File
Parameters
The fluxstation can works as Data Logger, but in this modality it don’t
measure the flux, then this modality is not described here.
Program Timings
SetStation 1.2
Select the
{Parameters}{Program Timings}
menu voice.
Communication port
COM1 Serial Cable on COM1
Connected Station IP
Status
idle
0.1
refresh
Station Date 06/12/07 12:34:36
WEST Systems
!
>
Continuous monitoring device handbook
www.westsystems.com
Release 10.0 November 2007
Status
>
COM1 Serial Cable on COM1
Logger}
Flux Analisys
Data Logger
readings
GetDisplay
All
Set
All
Program timings
Channels parameters
File
Parameters
!
The Program Timings menu allow the modification of
critical parameters of the station. In the normal use there
is not necessity to access this form.
WEST Systems
Select the {Parameters}{Data
menu voice.
Continuous monitoring device handbook
www.westsystems.com
Release 10.0 November 2007
SetStation 1.2
Connected Station IP
PAGE
Palmtop (PDA) SetStation application
PAGE
6.10
Flux Station configuration/testing
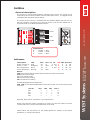
Channels parameters
Channels parameters
Continuous monitoring device handbook
www.westsystems.com
Release 10.0 November 2007
idle
refresh
Station Date 06/12/07 12:34:36
Flux Analisys
Data Logger
readings
GetDisplay
All
Set
All
Program timings
Channels parameters
File
Parameters
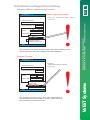
You’ve to access this menu when you’ve to change:
1) the full scale value of the DRAGER CO2 detector;
2) the analog channels configuration;
3) the number of flux curves.
ok
SetStation 1.2
Channel #0 sec
Get completed!
Name
CO2 ppm
Get
Set
Conf (Hex)
FF06
Get
Set
Gain
1
Get
Set
Offset
0
Get
Set
Full scale
20000
Get
Set
Low scale
0
Get
Set
Get
Set
Track
WEST Systems
0.1
Connected Station IP
Status
>
COM1 Serial Cable on COM1
On
Off
Get All
<< Previous
Ok
Set All
Press [Get All] to read from station the
parameters of the Channel 0
If you want to modify the configuration
of channel 2 you’ve to press twice the
[Next >>] button to access the page of
Channel #2 then press [Get All] to get
the configuration from fluxstation.
Next >>
On the next page the discussion about the parameters of the channels.
WEST Systems
Select the
{Parameters}{Channels Parameters}
menu voice.
Communication port
Continuous monitoring device handbook
www.westsystems.com
Release 10.0 November 2007
SetStation 1.2
Channels parameters
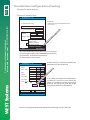
Name: is a description of the channel, to help the operator.
6.11
PAGE
Flux Station configuration/testing
FF06: the output of sensor connected to the channel is 4-20
mA and the fluxstation will consider 4mA equal to the “Low
Scale” value and the 20 mA equal to the “Full Scale” value.
FF05: the output of sensor connected to the channel is 0-5V
and the fluxstation will consider 0 V equal to the “Low Scale”
value and the 5 V equal to the “Full Scale” value.
FF0F: special Conf.
reserved to the P.Flow sensor
(AWM3300). A special trasfer function is applied to this
channel to linearize the answer.
Since an hardware adjustement is necessary to change the
input from current to voltage these field must considered
read only.
FullScale / LowScale : see the previous paragraph. Except for the
Polytron IR CO2 the changement of these value is not allowed.
Instructions to change the Polytron IR CO2 full scale are
reported in the following pages .
Gain / Offset : The reading of the channel can be scaled using these
2 values as result of the formula:
Ro = Ri
Continuous monitoring device handbook
www.westsystems.com
Release 10.0 November 2007
Continuous monitoring device handbook
www.westsystems.com
Release 10.0 November 2007
Conf: Is the type of channel, and it change the behaviour of the
FluxStation. Valid Conf. are
OffSet + Gain
Track On/Off : If you select Track=On a flux curve will be acquired
for the selected channel.
!
The Track must be set to ON for the Channel #0 CO2, in order
to have a flux curve for the carbon dioxide.
Normally the other channels are set with track off to save SD
card memory space and to reduce the quantity of data to be
trasmitted.
WEST Systems
WEST Systems
Use the Gain/Offset to correct the answer of a detector.
Default values are Gain=1 Offset = 0.
Changing the Drager Polytron IR CO2 full scale value.
Select the Channel #0
ok
SetStation 1.2
Get completed!
Name
CO2 ppm
Get
Set
Conf (Hex)
FF06
Get
Set
Gain
1
Get
Set
Offset
0
Get
Set
Full scale
20000
Get
Set
Low scale
0
Get
Set
Get
Set
Track
On
Off
Get All
<< Previous
Ok
Set All
Next >>
ok
SetStation 1.2
Channel #0 sec
CO2 ppm
Get
Set
Conf (Hex)
FF06
Get
Set
Gain
1
Get
Set
Offset
0
Get
Set
Full scale
20000
Get
Set
Low scale
0
Get
Set
Get
Set
On
Off
Get All
<< Previous
Ok
WEST Systems
Channel #0 sec
Next >>
Get completed!
CO2 ppm
Get
Set
Conf (Hex)
FF06
Get
Set
Gain
1
Get
Set
Offset
0
Get
Set
Get
Set
Get
Set
Get
Set
40000
Track
On
0
Off
Get All
<< Previous
Ok
the
“virtual”
Write the new value, espressed in
ppm, in the field: 40000
ok
Name
Low scale
Then activate
keyboard
Set All
SetStation 1.2
Full scale
Select the FullScale value field.
Get completed!
Name
Track
In the example the Full Scale value
of Drager is set to 20000ppm. If ,
for instance, you’d like to put the
full scale value of 4% of carbon
dioxide you’ve to set it on both
FluxStation and Drager Polytron IR
detector.
Set All
Next >>
Press the button [Set] to write the
value on the FluxStation.
Now you’ve to set the same
value on the Drager Polytron IR
CO2 detector.
WEST Systems
Continuous monitoring device handbook
www.westsystems.com
Release 10.0 November 2007
Channel #0 sec
Press [Get All] to read from station the
parameters of the Channel 0
Continuous monitoring device handbook
www.westsystems.com
Release 10.0 November 2007
PAGE
6.12
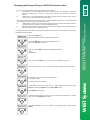
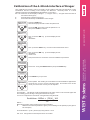
To change the full scale value of the carbon dioxide detector turn on the detector by running
SetStation from the PDA.
PASSWORD?
2
Press the enter key,
then the display will ask to enter the password
Press the DN key twice to set the password = 2
then press enter to confirm
MENU:
CONFIGURATION:
Now press the DN key twice the display will show
MENU:
CONFIGURATION:
MENU:
CONFIGURATION:
Now press the enter key to enter in the configuration menu
CONFIGURATION:
GAS CONFIGURATION
CONFIG.: 2.0 VOL%
CO2
Now press the Enter key to enter in the gas configuration procedure
The display shows the actual configuration :
2.0 VOL% CO2
WEST Systems
Press Enter key to proceed
MEASUREMENT UNIT ?
VOL%
If you plan to set a full scale value > than 9999 ppm select the unit
VOL% else select ppm using the UP / DN arrows.
Press Enter to proceed.
MEASUREMENT RANGE?
4.0 VOL%
Set the full scale value you want to use, taking account that 1%=10000
ppm, then press Enter to proceed
MEASUREMENT RANGE
4.0 VOL%
Y/N
Now the DRAGER ask you to confirm by selecting Yes and pressing
Enter
WEST Systems
Continuous monitoring device handbook
www.westsystems.com
Release 10.0 November 2007
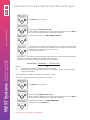
Also if it's possible to set the full scale value in a big range we advise you to use a full scale
value between 10,000 (1%) and 300,000 (30%).
!
When the full scale value is less than 10,000 ppm the linearity of Drager detector
reduces and you'll obtain no very well shaped curves;
!
When the full scale is more than 30% the accuracy of detector is reduced and you
can have a big error evaluating the flux.
PAGE
You've to change the full scale value of the detector when:
Low Fluxes: You can't appreciate the carbon dioxide concentration variations
because masked by the "noise". In this case you've to decrease the full scale
value;
!
High fluxes : The concentration reach the full scale value in few seconds. In this
case you've to increase the full scale value;
!
6.13
Continuous monitoring device handbook
www.westsystems.com
Release 10.0 November 2007
Changing the Drager Polytron IR CO2 full scale value.
Changing the Drager Polytron IR CO2 full scale value.
PAGE
6.14
Press Enter key to proceed
!
Press Esc twice and Enter to come back at the measurement.
Remember now to set the same value on the flux
station, if not already done
Continuous monitoring device handbook
www.westsystems.com
Release 10.0 November 2007
CONFIGURATION:
GAS CONFIGURATION
WEST Systems
WEST Systems
Continuous monitoring device handbook
www.westsystems.com
Release 10.0 November 2007
NEW CONFIGURATION
STORED!
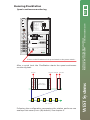
Running FluxStation
7.1
PAGE
Quasi-continuous monitoring
Pump
A
B
Power A
AWM3300V
CH3
WEST
RS232
CPU
CPU
RUN
MMC-SD
CH2
WEST
CH0
POWER ON
PULL AND SWITCH
POWER OFF
ON
+12 +24
To turn on the FluxStation Pull up and switch on the power switch..
After a quick boot the FluxStation starts the quasi-continuous
monitoring task.
8:00
9:00
10:00
nd
Open acc.chamber time
Flux record
See next pages
Radio OFF
2 Line Cleaning time
Pump OFF Radio ON
Close acc.chamber time
Line Cleaning time
Pump ON
Warm UP time
Release 10.0 November 2007
CH1
POWER
11:00
12:00
time (hh:mm)
Following the configuration parameters the station performs one
analisys cicle eevery hour (By default). See chapter 6.
WEST Systems
PTB100A
R47xxxxx
800-1060 hPa
0-5 VDC
10~30VDC
MODEL
SERIAL NO
RANGE
OUTPUT
SUPPLY
PRESSURE TRANSMITTER
EXT.TRIG
AGND
GND
SUPPLY
VOUT
Battery
P2
Continuous monitoring device handbook
www.westsystems.com
Release 10.0 November 2007
pin-007
www.westsystems.com
RS485
P1
PAGE
7.2
Running FluxStation
Quasi-continuous monitoring
pin-007
PTB100A
R47xxxxx
800-1060 hPa
0-5 VDC
10~30VDC
MODEL
SERIAL NO
RANGE
OUTPUT
SUPPLY
PRESSURE TRANSMITTER
Pump
Power A
P2
A
CPU RUN Led light
B
AWM3300V
CPU
CH3
WEST
RS232
CPU
RUN
MMC-SD
CH0
WEST
CH1
POWER
POWER ON
PULL AND SWITCH
POWER OFF
ON
+12 +24
When the FluxStation runs the CPU RUN light flashes every second.
.
The FluxStation stores the result of analisys cicles on a SD memory
card. By using SetStation PDA software you can initialize and check
it (Page 6.4).
The SD card is formatted using the FAT32 file system and can be
read directly from Windows XP / Vista on a PC..
Each analisys cicle requires a couple of kilobytes on the SD card,
but due to the file system the “disk dimension” of file is 16 KBytes.
Then for the default sampling frequency are necessary 0.384
MBytes/day (140 M.Bytes /year).
We advise to use 512 MByte SD memory card.
Release 10.0 November 2007
CH2
Continuous monitoring device handbook
Release 10.0 November 2007www.westsystems.com
Battery
WESTSystems
Systems
WEST
EXT.TRIG
AGND
GND
SUPPLY
VOUT
www.westsystems.com
RS485
P1
Running FluxStation
7.3
PAGE
Quasi-continuous monitoring
CPU
RUN
MMC-SD
Dn: Write disabled
CPU
WEST
Release 10.0 November 2007
Up: Write enabled
CPU
RUN
MMC-SD
WEST Systems
WEST
CPU
Continuous monitoring device handbook
www.westsystems.com
Release 10.0 November 2007
Before to insert the SD memory card in the CPU slot verify that the
Write On/Off swicth of the card is in the enabled position.
PAGE
7.4
Running FluxStation
Quasi-continuous monitoring
After inserting the SD card check with SetStation (Page 6.4) that
the FluxStation recognized the SD card.
!
WESTSystems
Systems
WEST
In order to inform the operator of the next writing operation,
the CPU run led light will be solid ON for a 60 second period
before start to write on the card.
Then if you have to swap the card on the FluxStation you’ve
to:
!Prepare the empty SD card;
!Check that the “CPU RUN” led light is flashing once per second;
!Remove the card on the slot;
!Place the empty card in the slot.
Release 10.0 November 2007
Continuous monitoring device handbook
Release 10.0 November 2007 www.westsystems.com
FluxStation write on the card at the end of the measurement
cicle. To remove the card in this period can cause the loss of
data.
Running FluxStation
7.5
PAGE
Station status
pin-007
Pump
P2
A
B
Power A
AWM3300V
CH3
WEST
RS232
CPU
CPU
RUN
MMC-SD
CH2
CPU RUN Led light
CH1
CH0
WEST
POWER
POWER ON
PULL AND SWITCH
POWER OFF
ON
+12 +24
2 Line Cleaning time
Radio OFF
The station
states:
has
two
working
1) StandBy: the time between the
analisys cicles;
nd
Flux record
See next pages
Open acc.chamber time
Pump OFF Radio ON
Close acc.chamber time
Line Cleaning time
Pump ON
Warm UP time
2) Analisys cicle (Yellow boxes in
the drawings).
8:00
9:00
10:00
11:00
12:00
time (hh:mm)
Stand-by state
During the stand-by state the CPU RUN led light, on the CPU board, flashes once
per second and the ON light on the Power board is solid ON.
Analisys running state
While the analisys cicle is running the CPU RUN led light, on the CPU board,
flashes once per second and the ON light on the Power board is solid ON. The
+12V and +24V led light are solid ON (or OFF) depending on the phase of the
analisys.
WEST Systems
Release 10.0 November 2007
On light
+12V Light
+24V Light
Continuous monitoring device handbook
www.westsystems.com
Release 10.0 November 2007
PTB100A
R47xxxxx
800-1060 hPa
0-5 VDC
10~30VDC
MODEL
SERIAL NO
RANGE
OUTPUT
SUPPLY
Battery
PRESSURE TRANSMITTER
EXT.TRIG
AGND
GND
SUPPLY
VOUT
www.westsystems.com
RS485
P1
WESTSystems
Systems
WEST
Release 10.0 November 2007
Continuous monitoring device handbook
Release 10.0 November 2007www.westsystems.com
PAGE
7.6
General discussion
The subjects regarding calibration of your instrument for the measurement of diffuse flux
will be discussed in this chapter.
8.1
PAGE
Calibrations
As explained previously the flux measurement is proportional to the slope of the
concentration curve versus time. The proportionality factor depends on the
volume/surface ratio of the accumulation chamber used for the measurement, as well
as, the barometric pressure and air temperature at the moment of making the
measurement.
This aspect allows us to simplify the control of the response of the gas sensors utilised.
To simplify the explanation see the following example:
Calibration control example:
Before verifying the calibration turn on the detectors using the PDA and SetStation
(Chepter 6) and leave it on for a minimum of 2 minutes to warm up.
Step1: Verifying the zero:
www.westsystems.com
www.westsystems.com
The most important aspect to understand is that the flux is proportional to the gradient of
concentration over time: ppm/second.
Fill the Tedlar gas bag with nitrogen, or synthetic air and connect it to the inlet port of the
instrument, turn on the pump (using SetStation) and read the concentration of carbon
dioxide on the Polytron Display. Obviously, it is important that the mixture not contain
carbon dioxide. In the absence of a standard mixture with these caracteristics you can
intake atmospheric air trapping the carbon dioxide with soda lime or a drager tube for
carbon dioxide.
Fill the tedlar gas bag with a standard mixture containing approximately a concentration
of carbon dioxide equal to the 70% (between 50% up to 95%) of the full scale value of
the Drager and check the response of the instrument.
If the full scale value of Drager is set to 20000 ppm (1.5%) you can use a standard with a
concentration of CO2 in the range 10000 .. 19000 ppm. If the concentration is less than
the 50% of the full scale value you will increase the calibration error.
Let's suppose that the check performed gave the following results:
Injecting a mixture at zero concentration of carbon dioxide the CO2 detector returns a
reading of 10 ppm.
Injecting a mixture containing a 10,000 ppm concentration of carbon dioxide the CO2
detector returns a reading of 9940 ppm.
At a variation of concentration set at 10,000 ppm the instrument has a slightly different
response: 9930 ppm (=9940-10 ppm). The evaluation error is of about 70 ppm, which in
percentage points over the span corresponds to 0.6% less
The error in evaluating the increment in concentration manifests as a systematic
error in the evaluation of flux and, therefore, must be corrected by calibrating the
instruments when it is too high (> 5%).
Full scale and calibration
When you change the full scale of the detector, to reach the maximum of accuracy a recalibration could be necessary.
!
In our experience, if the changement is not so drastic, the detector is still calibrated also
after the changement of full scale.
Drastic / not drastic....
If you change the FS from 2% to 4% you can consider the Drager still calibrated. If you
change the full scale from 1% to 30% you have to recalibrate the detector.
Portable flux meter handbook
Release 10.0 December 2007
Step2: Verification of the span:
WEST Systems
WEST Systems
Portable flux meter handbook
Release 10.0 December 2007
The method for injecting standard gas mixtures is explained in detail in the following
pages.
PAGE
8.2
Calibration of Drager IR CO2
When you need to calibrate the Drager
The Drager is a quite stable detector, the thermal stabilization features
allows the instrument to maintain it calibration for long periods. The
calibration is necessary only when there is a drastical change in the
barometric pressure.
What you need to calibrate the Drager
!
!
A cylinder of nitrogen or synthetic UPP Air, or a SODA LIME trap or a DRAGER
PIPE to trap the carbon dioxide.
A cylinder of standard mixture of 1% of carbon dioxide in air (or nitrogen);
A five liters TEDLAR gas bag.
www.westsystems.com
www.westsystems.com
!
A
B
Filter
Pump
Brombach
Inlet
ASF THOMAS ASF THOMAS
Outlet
Note on the reading of Drager
The reading of Drager is affected by a "noise" that normally do not exceed the
0.5% of the full scale value: if the full scale value is set to 20000 ppm the noise
normally do not exceed 100 ppm peak to peak.
This noise do not affect the
evaluation of flux except when the increasing of the concentration due to the flux
is less than noise...
If you cannot appreciate the variation of concentration you've to reduce the full
scale value of your Drager. Please have a look of the chapter 3.
WEST Systems
AWM3300V
>
www.westsystems.com
Portable flux meter handbook
Release 10.0 December 2007
P2
Portable flux meter handbook
Release 5.39 December 2005
P1
>
WEST Systems
Portable flux meter handbook
Release 10.0 December 2007
Five liter tedlar gas bag
8.3
PAGE
Calibration of Drager IR CO2
PASSWORD?
2
Press the DN key twice to set the password = 2
then press enter to confirm
www.westsystems.com
www.westsystems.com
Press the enter key,
then the display will ask to enter the password
MENU:
MEASUREMENT:
Now press the enter key to enter in the maintenace
menu
MAINTENANCE:
CALIBR. ZERO
Press the enter key to enter in the ZERO calibration
procedure
APPLY NITROGEN
TO SENSOR!
Be sure that the TEDLAR bag filled with CO2 free gas
mixture is connected to the inlet port of instrument and
Start the pump of instrument by pressing the START
button on PalmFLUX. Then press the enter key to
start the ZERO calibration procedure
Portable flux meter handbook
Release 10.0 December 2007
MENU:
MAINTENANCE:
WEST Systems
WEST Systems
Portable flux meter handbook
Release 10.0 December 2007
Now press the DN key up to the display shows
MENU:
MAINTENANCE:
PAGE
8.4
Calibration of Drager IR CO2
VALUE CONSTANT?
0.00
Y/N
VALUE CONSTANT Step
NEW CALIBRATION
FACTOR STORED!
Press the Enter key to proceed.
VALUE OK?
0.00
www.westsystems.com
www.westsystems.com
Wait that the reading is stable then select Y by
pressing the left arrow key then press the enter
key.
Y/N
Y/N
Select Yes to finish the ZERO calibration
procedure
MAINTENANCE:
CALIBR. ZERO
Press the DN key to select the calibration
sensitivity menu voice
MAINTENANCE:
CALIBR. SENSITIVITY
Press enter to access the SPAN calibration
Portable flux meter handbook
Release 10.0 December 2007
VALUE OK?
0.00
WEST Systems
WEST Systems
Portable flux meter handbook
Release 10.0
5.39 December 2007
2005
If the reading is OK select Yes to proceed else
select No to come back
to the VALUE
CONSTANT step.
Be sure that the TEDLAR bag filled with the CO2
standard gas mixture (18100 ppm of CO2)
is
connected to the inlet port of instrument and Start the
pump of instrument by pressing the START button on
PalmFLUX. Then press the enter key to enter in the
SPAN calibration procedure. Remember that using a 5
liter TEDLAR bag you have 4-5 minutes to complete the
procedure.
Portable flux meter handbook
Release 10.0
5.39 December 2007
2005
VALUE CONSTANT?
1.67 VOL% Y/N
VALUE CONSTANT Step
When the value is constant select Yes, using the
Left/Right keys , and then press Enter key to
proceed.
NEW CALIBRATION
FACTOR STORED!
Press the Enter key to proceed.
VALUE OK?
1.80
Y/N
If the reading is OK select Yes to proceed else select
No to come back to the VALUE CONSTANT step.
www.westsystems.com
Press Enter key to accept the value you set and
proceed
Portable flux meter handbook
Release 10.0 December 2007
CALIBR. GAS CONC.?
1.81 VOL%:
APPLY TO SENSOR
1.81 VOL%:
WEST Systems
Now you have to set the value of the concentration of
CO2 in the gas mixture you'll use for the calibration.
Using the Left / Right keys you can select the digit and
using Up/Dn keys you can change the value. If you're
using a 18100 ppm CO2 concentration standard gas
you've to set: 1.81 %Vol
WEST Systems
www.westsystems.com
CALIBR. GAS CONC.?
0.00 VOL%:
8.5
PAGE
Calibration of Drager IR CO2
Calibration of Drager IR CO2
PAGE
8.6
STOP GAS FLOW?
Y/N
VALUE < ALARMLIMIT?
1.80
Y/N
Select Yes end press Enter to finish the span
calibration procedure.
www.westsystems.com
www.westsystems.com
Select Yes and press Enter to proceed.
Portable flux meter handbook
Release 10.0
5.39 December 2007
2005
Portable flux meter handbook
Release 10.0 December 2007
WEST Systems
WEST Systems
Now the DRAGER detector is calibrated.
This calibration procedure can be necessary if the reading odf CO2 concentration on the
FluxStation and the reading of the Drager are different. Normally there is a small
difference between the DRAGER and FluxStation; This is due :
!to the resolution of the display of Drager: +/- 10 ppm and +/- 100 ppm if the full scale is
more than 10000 ppm;
!
to the analog to digital conversion;
!
to the leak of linearity of DRAGER in some ranges.
Press the enter key,
then the display will ask to enter the password
Press the DN key twice to set the password = 2
then press enter to confirm
MENU:
MEASUREMENT:
Now press the DN key up to the display shows
MENU:
MAINTENANCE:
MENU:
MAINTENANCE:
www.westsystems.com
www.westsystems.com
PASSWORD?
2
8.7
PAGE
Calibration of the 4-20 mA interface of Drager
Now press the enter key to enter in the maintenace menu
MAINTENANCE:
CALIBR. 4-20mA
Now press the DN key up to the display shows
MAINTENANCE:
CALIBR. 4-20 mA
Select Yes using the left arrow key and press Enter key
MEASURE REAL
VALUE AT X2 !
Press Enter key to proceed
40 mV REAL VALUE?
40.0
In this phase the reading of concentration in the SetStation application
must be zero, more or less a tolerance value and a little noise. If the
value you read is not correct you can adjust it.
An example: The Drager (and the fluxStation) full scale value is set to 20000 ppm and
the reading you're having is 150 ppm instead of 0.0 ppm.
You've to compute the "real value" using the following formula:
RealValue= OffSet + (FS/4) 160
FS
Where :
!FS is the full scale value (20000 ppm in the example);
!
OffSet is the value expressed in ppm you're reading on the palmtop (150 ppm in
the example)
Then RealValue = (150+(20000/4)*160)/20000 = 41.2
Set 41.2 using the arrows and press enter to confirm
Portable flux meter handbook
Release 10.0 December 2007
ALARM DISABLED?
Y/N
WEST Systems
WEST Systems
Portable flux meter handbook
Release 10.0 December 2007
then press Enter to access the 4-20 mA calibration procedure
Calibration of the 4-20 mA interface of Drager
PAGE
8.8
NEW CALIBRATION
FACTOR STORED!
Press Enter key to proceed
Portable flux meter handbook
Release 10.0
5.39 December 2007
2005
200 mV REAL VALUE?
200.0
Now the Drager shows: 200 mV REAL VALUE?
In this phase the reading of concentration in the palmflux must equal
to the full scale you set on the palmflux, more or less a tolerance value
and a little noise. If the value you read is not
correct you can adjust it.
An example: The Drager (and the palmflux) full scale value is set to 20000 ppm and the
reading you're having is 18900 ppm instead of 20000.0 ppm.
You've to compute the "real value" using the following formula:
RealValue= Reading + (FS/4) 160
FS
Where :
!
!
FS is the full scale value (20000 ppm in the example);
Reading is the value expressed in ppm you're reading on the palmtop (18900
ppm in the example)
Then RealValue = (18900+(20000/4)*160)/20000 = 191.2
Set 191.2 using the arrows and press enter to confirm
WEST Systems
NEW CALIBRATION
FACTOR STORED!
Press Enter key to proceed
200 mV Value OK?
Y/N
The drager ask 200 mV value OK?
If the reading on Palmflux now is good select Yes and then press Enter
key to proceed, else select N to repeat the calibration
Alarm ENABLED
Y/N
Now the Drager shows: ALARM ENABLED?
Select Yes and press Enter Key
Now the 4-20 mA of drager is calibrated.
Portable flux meter handbook
Release 10.0 December 2007
200 mV REAL VALUE?
200.0
WEST Systems
www.westsystems.com
The drager ask 40 mV value OK?
If the reading on Palmflux now is good select Yes and then press Enter
key to proceed, else select N to repeat the calibration
www.westsystems.com
40 mV Value OK?
Y/N
Portable flux meter handbook
Release 10.0 December 2007
Portable flux meter handbook
Release 10.0 December 2007
WEST Systems
WEST Systems
www.westsystems.com
www.westsystems.com
PAGE
8.9
Calibration of the flux meter
Fluxmeter calibration
As the computation of flux is a function of the gradient of
concentration vs. time, barometric pressure, air temperature and
the
the accumulation chamber volume / surface ratio,
calibration of the instrument depends only on the detector
calibration. The accuracy of the barometric pressure and air
temperature measurement affect the evaluation of flux: 3 degrees
Celsius of error while evaluating the temperature will cause a 1 %
of error when computing the flux.
A 10 HPa (mBar) error
measuring the barometric pressure will cause a 1% error in the
flux evaluation.
How to verify the fluxmeter calibration
The calibration described refers to carbon dioxide calibration, for other gases, like
methane or hydrogen sulphide, the same procedure has been followed.
www.westsystems.com
www.westsystems.com
PAGE
8.10
Sketch of calibration device
RS 245-6089
3
5
9.0
1
Portable flux meter handbook
Release 10.0 December 2007
WEST Systems
7
3
1
Sta
nd
ard
ta
om
s.
9.0
Mass flow controller
100% carbon dioxide (or target gas)
cylinder and pressure reducing valve
CO2 fluxes from soil are simulated by injecting a known flow of gas into the
accumulation chamber.
The interface between the accumulation chamber and
the calibration table is built to minimize the gas leakage.
The apparatus is schematized in figure 1.
For flux between 0.5 and 300 moles/(m2day) the injected flux is controlled and
measured with a precision mass flow controller. This MFC, calibrated for CO2, is
electronically stabilized (Accuracy 1%).
Portable flux meter handbook
Release 10.0 December 2007
7
WEST Systems
5
Standard taoms.
8.11
PAGE
Calibration of the flux meter
Fluxmeter calibration
For fluxes between 300 moles/(m2day) and 700 moles/ (m2day) the injected
flux is controlled by means of a mechanical flow reducer and measured using a
bubble flowmeter (Accuracy 3%) before and after the flux measurement with
Two series of measure were performed for flux of 300 moles/(m2day) to
evaluate the coherence between the two different methods of flow
measurement.
A thermometer and barometer were utilized to measure the barometric
pressure and the air temperature during the experiment in order to select the
www.westsystems.com
www.westsystems.com
the accumulation chamber.
correct accumulation chamber conversion factor.
A flow meter is utilized to measure the pumping flow during the experiment.
During all the measures a 100% CO2 flow was utilized.
The same procudure was utilized to check the
instrumental response to
Portable flux meter handbook
Release 10.0 December 2007
Portable flux meter handbook
Release 10.0 December 2007
WEST Systems
WEST Systems
methane / Hydrogen Sulfide.
PAGE
8.12
Calibration of the flux meter
The influence of pumping flow
Influence of pumping efficiency on the flux measurement results:
We have carried out some sets of measures utilizing the same injected flux but
with different pumping flow from the accumulation chamber to the detector.
measured with a Microbridge Mass Airflow sensor (Accuracy 2%).
We have not noted a significant variation of the measures except when the
pumping flow is less than 200 SCCM.
www.westsystems.com
www.westsystems.com
The pumping flow was changed by means of a mechanical flow reducer and
1000
10000
100000
2
0
-2
1200 SCCM
-4
-6
-8
1000 SCCM
800 SCCM
500 SCCM
300 SCCM
100 SCCM
-10
-12
-14
-16
In the diagram the plot of the measurement error versus the imposed flux of
carbon dioxide (expressed in grams per square meter per day) at different
pumping flow rates is shown.
In order to avoid unwanted variation of pumping flow due to power supply the
pump is supplied at 12 V DC with a stabilized voltage regulator.
The pumping flow , after the power supply stabilization, is 1000 SCCM 20%.
The efficiency of pump can vary due to dust or moisture in the pump body.
Periodic maintenance is necessary.
WEST Systems
100
4
Error %
Portable flux meter handbook
Release 10.0 December 2007
WEST Systems
10
Portable flux meter handbook
Release 10.0 December 2007
Imposed flux
1
Calibration of the flux meter
The influence of mixing device
PAGE
8.13
In the plot the measured flux vs the mixing
device rotation speed.
Influence of the mixing device rotation speed on flux reading
0.5
0.4
0.3
0.2
0.1
0
-0.1
-0.2
-0.3
-0.4
-0.5
0
20
40
60
80
100
120
www.westsystems.com
Influence of the mixing device rotation speed
Error %
www.westsystems.com
The mixing device was suspected, by some researcher, to affect the accuracy of the flux
measurement.
In our experience the precision of the measurements was noteably reduced without a
mixing device present.
In the two plots below the measurements at various regimes of mixing device rotation
are reported.
140
In the plot the mixing device RPM (Rotation per
minute) vs power supply voltage. The normal range
for the battery voltage is between 9.6 V (new
battery) and 6 Volt (discharged battery)
RPM vs battery voltage
140
120
RPM
100
80
60
40
20
0
0
2
4
6
Volt
8
10
12
Portable flux meter handbook
Release 10.0 December 2007
Battery status vs RPM.
WEST Systems
WEST Systems
Portable flux meter handbook
Release 10.0 December 2007
RPM
Portable flux meter handbook
Release 10.0 December 2007
Portable flux meter handbook
Release 10.0 December 2007
WEST Systems
WEST Systems
www.westsystems.com
www.westsystems.com
PAGE
8.14
Databases structure
The databases
All the information necessary to run scada, as well as the data acquired by the
fluxstation, are stored in a single file : scada_data.mdb
PAGE
9.1
These two file are located in the C:\WEST\SCADA\
folder
The two databases are accessed by our software via ODBC, then two System
DSN (Data source name) definitions are added by the Scada setup.
The first system DSN is scada_data , it has a MS Access (.mdb) driver and it
point to the file C:\WEST\Scada\scada_data.mdb.
The second system DSN is scada_log , it has a MS Access (.mdb) driver and it
point to the file C:\WEST\Scada\scada_log.mdb.
!
Both DSN are created automatically by the Scada suite setup. Normally
it’s not necessary to modify it manually.
Continuous monitoring device handbook
www.westsystems.com
Release 10.0 November 2007
Both are file based databases in the MS Access format.
WEST Systems
WEST Systems
Continuous monitoring device handbook
www.westsystems.com
Release 10.0 November 2007
A second database : scada_log.mdb is used by Scada to log messages, error
reports and other information that are generated by scada and that can be
helpful to diagnose some malfunctions of the system.
Databases structure
PAGE
9.2
!
Both DSN are created automatically by the Scada suite setup. Normally
it’s not necessary to modify it manually.
Database scada_log.mdb
The database scada_log.mdb is composed by several tables:
AccessesLog:
ConversationLog: Information about the “conversation between Scada and the
FluxStation(s);
EmergencyRawData: Raw data coming from the fluxstations: usefull for
malfunction diagnostic;
StationStatusLog: Informations about the status of the fluxstations;
Continuous monitoring device handbook
www.westsystems.com
Release 10.0 November 2007
The first line sets the DSN that point to scada_data.mdb and the second line sets
the DSN that point to the log database.
TelemetryUseLog: information about the use of the telemetry system. Designed
to check the bill, in case of GSM based telemetries.
The information in scada_log.mdb is not useful during the “normal” operation of
the system. Some of troubleshooting can be understood using its information.
WEST Systems
WEST Systems
Continuous monitoring device handbook
www.westsystems.com
Release 10.0 November 2007
The four applications of Scada suite read the system DSN from the
ODBCName.txt file, located in the C:\WEST\scada\source\ folder
Databases structure
Scada_data.mdb is composed by several tables, some of them are to
define the fluxstations and their configuration. Some of them contain the
results acquired by the fluxstations.
The tables:
HEADERS
RESULTS
PLOTS
PLOTTV
contain the data generated by the
fluxstations
The tables:
ChannelScopes
Commands
Parameters
DataFormatType
RS485Types
SupportedStations
contain the auxiliary data necessary
for the correct working of the Scada
The tables:
Networks
Stations
Channels
PlotDescription
PhisicalChannels
Telemetry
HWRT_Parameters
contain the description of the monitoring network:
Scada, up to now, support only a single network (NetworkID: WS), each
network can be composed by several Fluxstations.
WEST Systems
WEST Systems
Continuous monitoring device handbook
www.westsystems.com
Release 10.0 November 2007
To understand the structure of the database is not important for the
standard use of the system.This information is reported for
documentation purpouse.
Continuous monitoring device handbook
www.westsystems.com
Release 10.0 November 2007
Database scada_data.mdb
PAGE
9.3
Databases structure
Database scada_data.mdb
Each FluxStation must be defined in the Stations table.
Field
ID
Active
NetworkID
StationID
StationIP
Description
TelemetryID
TelemetryName
TelemetryPath
Site
Latitude
Longitude
Elevation
Responsible
Type
Model
PollingFrequency
PollingTimeShift
PollingRetryDelay
Value
Description
13
Record ID (Counter)
-1
-1 = Active // 0 Not active
Has to be WS
WS
OVK01
Identifier of station
0001
Address of station
Flux Station 2007
SSR24
Type of telemetry
2427581
* Address of remote telemetry system
* Optional repeater address
Name of the site
Localization of site
Localization of site
Localization of site
Name of responsible
HWR7
Station type
1
Station subtype
24
** See note
00.15.00
** See note
5
** See note
note *
The telemetryname and telemetrypath formats and values are
depending on the telemetry type (TelemetryID). If the station is
connected with a serial cable (TelemetryID = “COM_1”), or with
a point to point radio connection these to fields are not considered,
simply because there is not necessity to address the
communication. If your system has a SSR24 (SpreadSpectrum
radio system) based telemetry you’ll find more information about
this argument on the Appendix.F
Continuous monitoring device handbook
www.westsystems.com
Release 10.0 November 2007
Continuous monitoring device handbook
www.westsystems.com
Release 10.0 November 2007
PAGE
9.4
note **
PollingTimeShift is a delay, expressed in hh:mm:ss, that will be
added to the time of telemetry call: If pollingfrequency is 24 Scada
will execute a call every hour plus the PollingTimeShift time. Then
Scada will call the station at 1:15, 2:15 , 3:15 and so on. The
PollingShiftTime must be synchronized with the radio ON and radio
OFF parameters of the FluxStation in order to call the station when
the telemetry is ON.
PollingRetryDelay, expressed in minutes, is used in case of fail if
the communication. If Scada is not able to call the remote station it
retry to call after PollingRetryDelay minutes. If PollingRetryDelay is
set to zero Scada will retry to call the station only at the next
scheduled time.
WEST Systems
WEST Systems
PollingFrequency is the number of telemetry calls that Scada will
perform during a day to download the FluxStation data.
WEST Systems
Continuous monitoring device handbook
www.westsystems.com
Release 10.0 November 2007
!
Type and Model are critical parameters that indicate to
Scada how to manage the station and must be not
modified.
StationID is the station identifier and cannot to be miodified. The
StationIP is the logical address of the station and cannot to be
modified.
PAGE
The Site, Latitude, Longitude, Elevation and Responsible fields contain only
descriptive data.
WEST Systems
Database scada_data.mdb
9.5
Continuous monitoring device handbook
www.westsystems.com
Release 10.0 November 2007
Databases structure
Databases structure
Database scada_data.mdb
The PhisicalChannels table contain information about the “phisical”
configuration of the station channels.
ID
47
48
49
50
51
52
53
54
55
56
57
58
59
60
61
62
63
StationID
OVK01
OVK01
OVK01
OVK01
OVK01
OVK01
OVK01
OVK01
OVK01
OVK01
OVK01
OVK01
OVK01
OVK01
OVK01
OVK01
OVK01
Number
0
1
2
3
4
5
6
7
1
2
3
4
169
170
171
172
173
Name
FullScale
LowScale Gain Offset Statistics PlotCurve Conf Type
CO2
20000
0
1
0
1
-1 FF06 ANALOG
Bar.P
1060
600
1
0
1
0 FF05 ANALOG
Ch.2
5000
0
1
0
1
0 FF06 ANALOG
Ch.3
5000
0
1
0
1
0 FF05 ANALOG
Ch.4
5000
0
1
0
1
0 FF05 ANALOG
Ch.5
5000
0
1
0
1
0 FF05 ANALOG
dP
1100
600
1
0
1
0 FF05 ANALOG
P.Flow
1000
0
1
0
1
0 FF0F ANALOG
SOILBOX Soil W.
100
0
1
0
1
0 A0
DIGITAL
SOILBOX Soil W. Raw
35
15
1
0
1
0 A1
DIGITAL
SOILBOX Soil T.
200
0
1
0
1
0 22
DIGITAL
SOILBOX Soil T. Raw
200
0
1
0
1
0 A2
DIGITAL
AIRBOX Air RH
0
0
1
0
1
0 DA
DIGITAL
AIRBOX Air T
0
0
1
0
1
0 D9
DIGITAL
AIRBOX Wind Speed
0
0
1
0
1
0 D7
DIGITAL
AIRBOX Wind Dir
0
0
1
0
1
0 D8
DIGITAL
AIRBOX Rain Gauge
0
0
1
0
1
0 DF
DIGITAL
There are two basic type of “channel”: ANALOG or DIGITAL; The heigth analog
channels are managed by the AC board of the flux station. The Digital channels
are devices (AirBox and SoilBox in the base configuration) that are connected to
the station with a serial connection (RS485).
ANALOG
Number is the phisical ADC ID;.
Name is a short mnemonic description;
FullScale and LowScale and Conf are used to set the type of signal to be read
(Voltage or Current) and the range of the detector connected to the channel;
Gain and OffSet can be used to scale the result of the measurement;
Continuous monitoring device handbook
www.westsystems.com
Release 10.0 November 2007
Continuous monitoring device handbook
www.westsystems.com
Release 10.0 November 2007
PAGE
9.6
Statistics change the statistic treatment reserved to the channel;
WEST Systems
DIGITAL
Number is the logical RS485 ID of the device;.
Name is a short mnemonic description;
Conf is the type device connected;
FullScale and LowScale depends on Conf and must not modified.
Gain and OffSet must not modified.
Statistics change the statistic treatment reserved to the channel;
PlotCurve:
Setting to -1 this value force the flux station to
acquire a Flux Curve of the signal coming from this detector.
Information about how to change the configuration and to sent it to the
FluxStation are reported on Chapter 10
WEST Systems
PlotCurve:
Setting to -1 this value force the flux station to
acquire a Flux Curve of the signal coming from this detector.
Database scada_data.mdb
Channels table
9.7
PAGE
Databases structure
Continuous monitoring device handbook
www.westsystems.com
Release 10.0 November 2007
Each record define a channel , for instance Air temperature or CO2 Flux.
Most of the field of the table must not modified by the user and are not
documented here.
PanelPage: set the Scada panel where the channel
information are displayed;
RowOnPanel: set the row on the Scada panel where the information are
displayed;
RevisionPriority: When using Query.exe the list of channels will be in
descending order and only the channels with RevisionPriority > 0 will be
visible;
Monitored: Monitor.exe will show the channels with monitored <> 0, see
chapter 11;
MonitoringGroup: see chapter 11;
AlarmType, ActiveThresholds, UPAlarm,UPPrealarm, DnPrealarm,
DnAlarm: these fields are related with an “alarm” signal managed by
Scada.exe: see chapter 10;
Gain, OffSet: by varing these fields it’s possible to scale the result values of
the channel, ask to West Systems;
Continuous monitoring device handbook
www.westsystems.com
Release 10.0 November 2007
The Channels table is derived from the PhisicalChannels one, integrated with
additional records and contain all the “definition” necessary to manage the
several signals managed by the station.
Name, Description: The name and the description of the channels;
!
The direct (manual) modification of the Channels table can
be very critical. Ask support to West Systems before to
make any modification.
WEST Systems
WEST Systems
Active: If active = -1 the channel will be managed by Scada.exe. To exclude
a channel set active=0;
PAGE
9.8
Databases structure
Database scada_data.mdb
Telemetry table
DISK
The station has not a telemetry system and the data is trasferred via
SDmemory card. In the telemetry table we defined a telemetry of this
base type:
TelemetryID = SD
WindowStart=00:00:00
WindowStop=23:59:59
CommPort= 0
HostID= <blank>
Settings=<blank>
TelemetryType=DISK
BaseType=DISK
CommTimeOut=<blank>
If you want to set this telemetry for your station you’ve to put the
Stations.TelemetryID = SD in the record of the Stations table that
define your station.
ETH
The station telemetry system is based on a
ethernet to serial converter (as the Moxa DE211)..
TelemetryID = Moxa_1
WindowStart=00:00:00
WindowStop=23:59:59
CommPort= Socket port of the IP.
HostID= IP address of the Moxa
Settings= RS232 parameters of the RS232 port of the moxa;
TelemetryType=MOXA
BaseType=ETH
CommTimeOut=2000
If you want to set this telemetry for your station you’ve to put the
Stations.TelemetryID = Moxa_1 in the record of the Stations table that
define your station.
WEST Systems
WEST Systems
Continuous monitoring device handbook
www.westsystems.com
Release 10.0 November 2007
There are 3 possible base types of telemetry (Field BaseType:
Continuous monitoring device handbook
www.westsystems.com
Release 10.0 November 2007
The Channels table is derived from the PhisicalChannels one, integrated with
additional records and contain all the “definition” necessary to manage the
several signals managed by the station.
Database scada_data.mdb
9.9
PAGE
Databases structure
RS232
The base type RS232 supports several TelemetryTypes:
Continuous monitoring device handbook
www.westsystems.com
Release 10.0 November 2007
SSR24: Spread spectrum 2.4 or 0.9 GHz in switched mode;
RS232: Direct cable connection.
The base type RS232 supports several TelemetryTypes:
The configuration of each type is described in the telemetry handbook.
SSR24 : Appendix F;
GSM : Appendix G; (not included)
RS232 : Appendix M;
General settings:
WindowStart, WindowStop: are used to define an activity time
window for the telemetry: If Scada.exe has to share the telemetry
with another application is possible to define a time window, for
instance between 11:00:00 and 16:00:00.
Scada.exe will use the telemetry system only during this interval.
Continuous monitoring device handbook
www.westsystems.com
Release 10.0 November 2007
GSM: Gsm based data modems;
WEST Systems
WEST Systems
CommTimeOut: Is a TimeOut interval, expressed in milliSeconds.
The communications can suffer of latency times (as for example a
Moxa device connected via a IEEE802.xx network, or via an ADSL
connection). By setting a proper value to CommTimeOut can solve
the problems due to long latency times.
WEST Systems
WEST Systems
Continuous monitoring device handbook
www.westsystems.com
Release 10.0 November 2007
Continuous monitoring device handbook
www.westsystems.com
Release 10.0 November 2007
PAGE
9.10
Scada software suite
General description
The software suite of Scada is composed by 4 applications:
PAGE
10.1
Monitoring: This application allows you to have a “quick view” of the data acquired by
the FluxStations.
Query: This application allows you to query the database and obtain a table in the .xls
format of the data stored in the database.
Scada
Scada reads the network configuration from the scada_data ODBC data souce name
(Chapter 9).
Once reads the configuration it runs continuosly to manage the information of all the
stations that compose your network.
The application shows several information.
Scada Panel
The Panel form resume all the information of the
station and its channels;
In the first column is reported the name of the
station (Stations.StationID).
In the second column the name of each channel
(Channels.Name) and in the third column the
result (empty in the example) of the last
downloaded measurment and the unit.
Station Log dialog box
The dialog “Station log” reports all the events related with the management of station and
telemetries. These information are saved in the Conversation table of the scada_log
database.
Normal events are reported in green, Warnings are reported in yellow and Alarms and
Errors are reported in red.
In the drawing, after the CopyRight message, a Normal event is reported:
The next interrogation of the OVK01 station is scheduled at 13:11:00 of 12/12/2007.
The log can be saved as text file by right clicking the text box and selecting
{Save as}.
WEST Systems
FluxDataRevision: This application allows you to review the flux curves acquired by the
FluxStations.
Continuous monitoring device handbook
www.westsystems.com
Release 10.0 November 2007
Scada: This application , designed to run continuosly, performs the polling of the stations
in your network, downloads and stores the data in a database and allow you to configure
and manage the remote statios using a telemetry system.
PAGE
10.2
Scada software suite
Scada application
Continuous monitoring device handbook
www.westsystems.com
Release 10.0 November 2007
PC Clock
!
On the left-top corner of Scada the pc clock is shown: Scada will use
this date/time information to set the clock of each station managed
every time it will be able to talk with the station. Then to avoid
confusion in the data you get you must check that the PC clock is
correctly set.
Right click
By right clicking on the StationID field of a
station a menu appears.
{Station Info}
By selecting {StationInfo} you can get a report
where all the information about the station, the
telemetry , the configuration parameters, the status
and about all the channels that belong to the station
are present. The StationInfo report will be
automatically closed after 30 seconds.
WEST Systems
{Exclude}
By selecting {Exclude} you can temporary exclude
the station. While excluded a station is not managed
by the application. This feature is normally used
when a station is under maintenance to avoid
useless telemetry calls.
While excluded the
background color of the station will be red. To
reactivate the station select {Include} from the
same menu.
{Call Now}
By selecting {Call Now} the application re-schedule
the next call to now. Of course you’ve to consider
that the remote telemetry system can be off and
then the call will be not successful.
Scada software suite
10.3
PAGE
Scada application
By selecting {Options}{Show
advanced menu} an advanced station
menu will be enabled, then now right
clicking the StationID field a more
complete menu is shown.
{Sample Now}
By selecting {Sample Now} you force the immediate execution of an analisys cicle. The
command will be sent to the station during the next call, then to have an immediate effect
{Sample Now} must be followed by {Call Now}.
{Get channels configuration}
By selecting {Get channels configuration} the application will download the configuration of the
channels from the station and will store this configuration in the database. The action will be
performed during the next scheduled call.
{Set channels configuration}
By selecting {Set channels configuration} the application will upload the configuration of the
channels from the database to the station, reconfiguring the station with the database settings.
The action will be performed during the next scheduled call.
{Get station parameters}
Continuous monitoring device handbook
www.westsystems.com
Release 10.0 November 2007
{Options} menu
By selecting {Get station parameters} the application will download the timing parameters of
from the station and will store it in the database. The action will be performed during the next
scheduled call.
{Set station parameters}
{Edit station parameters}
By selecting {Edit station parameters} the application allows you to modify the timings of the
analisys cicle (parameters) and to save it in the database..
!
Since all the actions described in this page, except {Sample Now}, are quite
critical we advise you to follow this procedure:
a) Do NOT get or set the channels configuration unless big malfunction of
the system. Anyway before to do that call us.
b) To change the parameters:
1) select {Get Station Parameters}; wait the next successful call;
2) Edit the parameters {Edit station parameters} and save into the
database;
3) select {Set Station Parameters}; wait the next successful call;
Now the station is set with new parameters
WEST Systems
By selecting {Set station parameters} the application will upload the timing parameters from
the database to the station and will re-configure the timings of the analisys cicle. The action will
be performed during the next scheduled call.
PAGE
10.4
Scada software suite
Scada application
Right click
Continuous monitoring device handbook
www.westsystems.com
Release 10.0 November 2007
By right clicking on the Channel.Name field
of a station a menu appears.
Channel Info
Configure Alarms
Show graph
{Channel Info}
By selecting {Channel Info} a report of the
channel configuration and status will be
shown.
WEST Systems
{Configure Alarms}
By selecting {Configure Alarms} will be possible to set alarm level and modalities for
the channel.
All thresholds / only upper thresholds / only lower thresholds / Alarm not active;
{Show graph}
By selecting {Show Graph}, active only for the channels that are configured to be
acquired as flux curve, the last downloaded curve will be displayed.
Scada software suite
Scada application
The StationID field backcolor and forecolor change in function of the status
of the call.
PAGE
10.5
OKV01
OKV01
OKV01
OKV01
Black, Yellow:
Scada was able to reach the station,
but the station is not answering
correctly;
OKV01
OKV01
OKV01
OKV01
OKV01
OKV01
Blue, White:
Scada was able to reach the station
and get the data; This mus be the
“normal” situation when Scada is
waiting the next call.
WEST Systems
Black, Red:
Scada was not able to reach the
station: The remote telemetry is off /
the telemetry is not working ;
Continuous monitoring device handbook
www.westsystems.com
Release 10.0 November 2007
Green, Black:
Scada is calling the station;
WEST Systems
Continuous monitoring device handbook
www.westsystems.com
Release 10.0 November 2007
PAGE
10.6
Scada software suite
Scada application
Scada software suite
10.7
PAGE
Scada application
The alarms
For each channel is possible to set an alarm:
DN thresholds
All thresholds
UP Alarm
UP PreAlarm
DN PreAlarm
DN Alarm
The alarm management will modify the backcolor of the result field of the channel in
order to highlight when a value is not “correct”
OKV01
350.0 ppm
OKV01
350 ppm
OKV01
850 ppm
OKV01
OKV01
0.23 moles/sm/day
0.234
The channel result field backcolor can be:
WHITE : if the channel has not alarms configurated. All the values are considered OK;
GREEN : The channel has alarms configurated and the value is in the normal range;
YELLOW: The channel value is between the prealarm and alarm thresholds;
RED: The channel
DNAlarm one);
value higher than the UPalarm threshold (Or is less than the
WEST Systems
UP thresholds
Continuous monitoring device handbook
www.westsystems.com
Release 10.0 November 2007
No Alarm
WEST Systems
Continuous monitoring device handbook
www.westsystems.com
Release 10.0 November 2007
PAGE
10.8
Scada software suite
Scada application
In the lower right corner a dialog shows the “binary” communication that flows
on the coomunication stream between computer and telemetry device:
Some of the byte are “translated” in a visible format: for example the byte &0D
(That correspond to the Enter key ) is diplayed as <CR>.
The format is:
dd/mm/yyyy hh:mm:ss : 12/12/2007 16.28.40
stationID : OVK01
TelemetryType : RS232
Communication port: 1
Direction of communication: TX (or RX)
Trasmitted data: AT<CR>
The communication log can be saved on a text file by right clicking on
the text box and selecting {Save as}.
Scada software suite
Flux revision
Fluxrevision allows the checking of flux curves acquired by the station.
PAGE
11.1
Select your station.
By selecting “Never revised” you can
select the curves you never checked
Select the gas specie (If the station has
additional gas detectors)
Number of selected curves / Total
number of curves in the query period.
The list of flux curves that correspond to
your selection
WEST Systems
By selecting [Filter] you can apply a
more restrictive filter to your query.
ErrQ <= 0.9
will select the curves
where ErrQ is less than 0.9 (That means
not very well shaped curves).
Flux >= 1500 Moles/sm/day will select
the curves where the flux is more than
1500 moles/sm/day (That means
exceptionally high flux).
WEST Systems
Continuous monitoring device handbook
www.westsystems.com
Release 10.0 November 2007
Select the end date of the period.
Continuous monitoring device handbook
www.westsystems.com
Release 10.0 November 2007
Select the initial date of the period.
Scada software suite
To see the flux curve click on the list.
The flux curve
On the right part of the form is reported the information related with the flux
curve.
The interval used to compute the regression is highlighted in red.
The regression computed is drawn in yellow.
The limit of the interval are the two red vertical lines.
Continuous monitoring device handbook
www.westsystems.com
Release 10.0 November 2007
Flux revision
WEST Systems
WEST Systems
Continuous monitoring device handbook
www.westsystems.com
Release 10.0 November 2007
PAGE
11.2
Manual revision
Modify the limits by dragging the vertical lines in the desired position.
The flux, the slope and the ErrQ will be automatically updated.
To save the new result right clik and select {Save Flux}
Using the manual revision the computation of flux is completely under your
responsability. You can select wrong interval and get wrong results, as in the drawing.
The slope of the curve is positive, but the seleted interval, too short, gives a negative
result.
PAGE
WEST Systems
WEST Systems
Continuous monitoring device handbook
www.westsystems.com
Release 10.0 November 2007
Flux revision
11.3
Continuous monitoring device handbook
www.westsystems.com
Release 10.0 November 2007
Scada software suite
Scada software suite
Flux revision
Automatic computation of flux.
FluxRevision can compute the flux following 3 different algorithms:
By selecting {Auto Best slope}: the flux will be computed searching for the higher
flux;
By selecting {Auto Best ErrQ}: the flux will be computed searching for the better
regression quality;
By selecting {Auto Best Product}: the flux will be computed searching for a
compromise between higher flux and best regression quality.
After the automatic computation you have to select {Save Flux} to save the results.
The automatic computation uses, as minimum interval to be used, the interval selected
by left and right limits (The two red vertical linees), then if you want to compute the flux
using at least 50% of the points in the curve you’ve to select approximately the 50% of
the curve and after select one of the 3 methode for the auto computation. After that
you’ve to select {Save regression mode} to save this settings.
Continuous monitoring device handbook
www.westsystems.com
Release 10.0 November 2007
Continuous monitoring device handbook
www.westsystems.com
Release 10.0 November 2007
PAGE
11.4
The saved settings will be used by the batch processing of FluxRevision and by Scada,
when it process the curves while downloading for the station.
By pressing the [Auto Calculate] button fluxrevision will process all the fluxcurves in the
list. The methode and the minimum interval will be the one selected with the procedure
described before.
More restrictive settings to the automatic processing can be set by opening the
{File}{Settings} menu.
For each gas specie you can set the minimum
interval, the minimum left limit and the
maximum righ limit, as well as the processing
algorithm.
If you need a rigid processing you can set rigid
parameters as:
Interval : 80%
Minimum left: 10%
Maximum right:10%
With these settings Scada and Flux revision
are obliged to compute the flux in the range
from 10% to 90% of the curve.
WEST Systems
WEST Systems
Batch processing
Scada software suite
11.5
PAGE
Flux revision
Batch processing
Continuous monitoring device handbook
www.westsystems.com
Release 10.0 November 2007
same consideration for the
Revision date, the ErrQ and the
Flux.
WEST Systems
WEST Systems
Continuous monitoring device handbook
www.westsystems.com
Release 10.0 November 2007
By clicking on [Sampling Date]
you can order the list by date in
ascending or descending mode .
WEST Systems
WEST Systems
Continuous monitoring device handbook
www.westsystems.com
Release 10.0 November 2007
Continuous monitoring device handbook
www.westsystems.com
Release 10.0 November 2007
PAGE
11.6
Scada software suite
Monitor
Monitor is a simple application designed to have a quick view of the last days of data.
Monitor display the data of the channels that are active and
Channels.Monitored > 0 and the Channels.MonitoringGroup = 1;
PAGE
11.7
have the field
To have two Monitor, one showing a group of channels and the second showing a second
group of channels you’ve to:
1) Open the Channels table of scada_data.mdb , put the value 2 on the
Channels.MonitoringGroup of the channels you want to assign to the second group.
2) Create a new ShortCut of Monitoring and modify the properties of the shortcut as
following:
add a “2” after Monitor.exe.
Monitor apparence
Continuous monitoring device handbook
www.westsystems.com
Release 10.0 November 2007
Continuous monitoring device handbook
www.westsystems.com
Release 10.0 November 2007
The field Channels.MonitoringGroup can be used to assign a group of channels to a
specific instance Monitor
WEST Systems
WEST Systems
By right clicking on the screen you can modify the apparence properties of
each plot, as the color of the grid, the background....
WEST Systems
WEST Systems
Continuous monitoring device handbook
www.westsystems.com
Release 10.0 November 2007
Continuous monitoring device handbook
www.westsystems.com
Release 10.0 November 2007
PAGE
11.8
Query
The Query application allows you to exctract the data from the database and
to put it an a table in the MS Excel format
11.9
PAGE
Scada software suite
Set the date interval you want to query and Select the Channels then press
[Next >>];
The buttons [Last month], [Last week] [Last 24 hours] will help you by
setting a “standard” time interval.
Continuous monitoring device handbook
www.westsystems.com
Release 10.0 November 2007
Press the [Next >>] button.
WEST Systems
WEST Systems
Continuous monitoring device handbook
www.westsystems.com
Release 10.0 November 2007
Run Query and selct the station(s) you want to query.
Scada software suite
A resume of the query is reported: The column “Records” shows how many
record are present in the time interval you selected for each channel;
By pressing [Export All] you’ll get a table with a row for each record (and a
column for each channel, plus one for the date/time);
By setting the “Number of points per day” field, for instance putting 4, and
pressing [Export] you’ll get a table with the 4 row for each day. This feature is
useful when you need a simplified table that reports, for example, only the daily
average of each chanell.
After pressing the button you’ve to choose a name and a folder for the excel file .
Continuous monitoring device handbook
www.westsystems.com
Release 10.0 November 2007
Query
WEST Systems
WEST Systems
Continuous monitoring device handbook
www.westsystems.com
Release 10.0 November 2007
PAGE
11.10
A.1
PAGE
AirBox
Release II , General description
The air box is an hardware/software interface that convert the signal of Air
Temperature/ Relative Humidity gauge and Sonic wind speed / direction gauge to a
digital format compatible with the DF1A soilflux station.
www.westsystems.com
www.westsystems.com
The output of the air box is a RS485 with the standard WESTS Systems pin out.
Since the AirBox is designed to be the last device in the bus the RS485 line is
terminated with a 120 Ohm embedded resistor.
North Marker
1
2
3
6
7
Gill
+V12
S_Gnd
TD
Gnd
RD
Description
Rain Gauge
Wind direction
Wind Speed
Air Temperature
Air rel.humidity
Conf Unit
DF
mm
D8
°N
D7
m/s
D9
°C
DA
%
Sw6 Off
A8
A7
A6
A5
A4
Sw6 On
AD
AC
AB
AA
A9
The air box is designed to be mounted on a 50 mm diameter pole. Avoid
obstacles that can affect the wind speed and direction measurement accuracy.
The blue marker must be pointed in NORTH direction, using a compass,
to get the correct reading of wind direction.
The rain-gauge must be levelled using the bubble gage
AirBox Two handbook
Release 10.0 November 2007
Rain
WEST Systems
November 2007
2
T Sw.B
Release 10.0
WEST Systems
AirBox Two handbook
RS485
A.2
PAGE
AirBox
Connectors pinout
GILL Connections
PCB Pin
5)
8)
7)
8)
6)
+12V
Gnd
RD
Gnd
TD
www.westsystems.com
Air RH & T Connections
Panel 6+T
Pin 2:
Pin 3:
Pin 5:
Pin 6:
female
+5V
Data
Sck
Gnd
connector
Red
Yellow
Blue
Black
PCB Pin
9) +5V
11) Data
10) Sck
12) Gnd
Rain Gauge Connections
Panel 3+T male connector PCB Pin
Pin 2: SW_A
13)
Pin T: SW_B
14)
www.westsystems.com
Panel 6+T female connector
Pin 1:
+V12 RED
Pin 3:
SGND Green
Pin 5:
TD
Yellow
Pin 6:
Gnd
Black
Pin 7 (T): RD
Blue
DIP switch settings
SW1
SW2
SW3
SW4
SW5
SW6
SW7
SW8
Air RH%
Air T.°C
W.Speed m/s
W.Dir °N
Rain G.
ID Base/Extended
Set Conf=05
Calibration enabled
On
On
On
On
On
On
Off
Off
SW7 : If your station firmaware is older than release 9.14 please set SW7 to ON in
order to allow the correct configuration of the RS485 chain. You can read the
firmware release of the station resetting it. (Power off, wait at least 10 seconds and
power on the station).
SW6: If two airbox are installed on the same RS485 chain the SW6 switch of one of
them must be set to On in order to avoid addresses interference.
SW8: No actual user enabled function
AirBox Two handbook
Release 10.0 November 2007
Panel 6+T male connector PCB Pin
Pin 1: Gnd
Black
4) Gnd
Pin 2: A
Yellow
1) A
Pin 3: B
Green
2) B
Pin 6: +V12 Red
3) +Vin
WEST Systems
November 2007
Release 10.0
WEST Systems
AirBox Two handbook
RS485 Connections
A.3
PAGE
AirBox
Gill sonic wind speed and direction gauge
Speed
!Range 0..60 m/sec
!Accuracy : 4%
!Resolution : 0.01 m/sec
D17
R4
TZB12V
10R
TMBAT46
R24
3.6V NiCd
TZB5V
100n
100n
U1
1K
R6
R7
74AC14M
Y1
C32
C33
L1
L2
L3
L4
WEST
1K
D4
1M
100n
R21
100n
CRYSTAL
J10
1K
R9
R26
CRES2
D14
Rg
C8
100n
U4
C3
Systems
1
2
3
4
5
6
7
Airbox_II.ddb
Amphenol Male
Digital only cable
+12
GND
GILL female
J2
Gill configuration
M2 Gill Polar Continuous data format mode
U1 WInd Speed Unit meter/second
O1 Comma Separated Format CSV
L1 CR/LF Message terminator
P1 Out rate 1 sample / second
B3 Baud rate 9600
F1 No parity 8 bit
H1 Power-up message on
NQ Node address not defined
E3 communication protocol E3 = RS232
J1
1
2
3
4
5
6
7
TD
RD
Amph 6+T Female
DB9 FEMALE
Test/Setup cable
If analogue output is present:
S6 = 0-60 m/sec Wind Speed analogue range output
C2 = Wrap around 0-359°
T1 = 0..5 Volts analoge voltage output (T2=4-20mA)
To configure the GILL connect it via RS232 using a 9600-n-8-1 configured terminal.
Send a "*" to enter in the set mode and D3 to list the actual settings.
Send a
E3<Enter>
and check it sending an
E<Enter>
Turn off the GILL, wait 5 second and turn on it.
Enter * and D3 to check that the configuration changed.
The GILL save the modifications automatically
1
6
2
7
3
8
4
9
5
AirBox Two handbook
Release 10.0 November 2007
TD
1K
8
D1
U2
22p
RD
GND
TXD
1
R29
22p
SGND
SW DIP-8
JTAG
D2
100n
S2
R27
ATMEGA128/64
ST232CD
C24
100
C30
J1
100n
J3
C6
GILL
Data
Gnd
C25
SCK
100n
+5V
SHT1X
7) +V Gill
8) TD Gill
9) RD Gill
10) Gnd
AirBox II
100K
10uF
C22
C23
Gnd
100n
7805
C31
+
R28
L4 L3 L2 L1
1K
100n
C9
VR1
C5
R2
May 2004
D20
100n
D16
0.1uF
L1
Vin
TD
RD
507-762 RS BOX
D3
TZB12V
D15
Gnd
TMBAT46
RS485
TMMBAT46
C4
D18
10K
TZB12V
1M
November 2007
100k
R8
C2
Release 10.0
100k
R10
R25
WEST Systems
10k
R3
Pluvio
+12V
RXD
BT2
R23
R5
+V
+V
120
Rg
J1
1
2
3
4
5
6
7
8
9
D5
B
RD
GND
TD
10R
ST485AD
R22
A
J2
Signal Ground
+V
Gnd
10K
U3
SGND
SEN2
AirBox
TD
+12V
+
1
2
3
4
5
6
7
100n
RXD
Analog WS
Analog WD
J3
-
TXD
1
2
3
4
5
6
7
D19
TMMBAT46
1
2
3
4
5
6
7
8
9
Signal Ground
+V
Gnd
+12V
WS
SGND
WD
RD
GND
1K
J1
J2
Amphenol Male
J4
Analog / Digital cable
GILL female
AirBox Two handbook
www.westsystems.com
Power supply
!9..30 VDC 40 mA typical @ 12VDC
WEST Systems
www.westsystems.com
Direction
!Range 0..360 degree North without dead zone.
!Accuracy : 3%
!Resolution : 1 degree
A.4
PAGE
AirBox
Silicon Air Temperature and relative humidity gauge
SEN1
VDD
SCK
DATA
GND
SHT1X
4
3
2
1
VDD
SCK
DATA
GND
TMMBAT46
D1
R1
1K
+5V
SCKD
DATAD
1K R2
1
2
3
4
5
6
7
D2
TZB 5V
Probe Layout (actual size)
5 Sck 6 GND
TZB 5VR1
1K
1
Sck
Vdd
Gnd
Data
AirT&RH
SHT75
1K
D2
R2
WEST
3 Data
2 +5V
D1
Amphenol 6T male
AirBox Two handbook
Release 10.0 November 2007
J1
AMP 6+T MALE
WEST Systems
Probe schematics
4
November 2007
Release 10.0
WEST Systems
AirBox Two handbook
www.westsystems.com
2 sensors for relative humidity & temperature
- Measurement range: 0-100% RH
- Absol. RH accuracy: +/- 2% RH (10...90%
RH)
- Repeatability RH: +/- 0.1% RH
- Temp. accuracy: +/- 0.4°C (5...40 °C)
- Calibrated & digital output
- Fast response time < 3 sec.
www.westsystems.com
Sensor specifications
AirBox
Silicon Air Temperature and relative humidity gauge
PAGE
A.5
Air Temperature accuracy Vs. temperature
1.6
1.4
1.2
1
0.8
0.6
0.4
0.2
0
-40
-20
0
20
40
60
80
100
120
Measured temperature °C
www.westsystems.com
Error °C
www.westsystems.com
Temperature accuracy
4
3
2
1
0
0
20
40
60
%RH
80
100
120
AirBox Two handbook
Release 10.0 November 2007
5
WEST Systems
Relative Humidity Accuracy
Error %
November 2007
Release 10.0
WEST Systems
AirBox Two handbook
Relative Humidity accuracy Vs. RH%
A.6
TZB5V
100n
7805
VR1
TH 510
www.westsystems.com
www.westsystems.com
D1
Multimeter probes
100n
100n
ST232CD
2 +5V
WEST
R2
5 Sck 6 GND
R24
D20
C4
100n
C6
100n
100n
C23
GILL
C24
C25
SHT1X
U1
8
R6
SEN2
Gnd
1
U2
1M
12) Ss Gnd
JTAG
C22
R25
Data
S2
SW DIP-8
R27
J1
ATMEGA128/64
C2
11) Ss Data
100
C30
R7
J10
Y1
C33
L1
L2
L3
L4
C32
22p
22p
WEST
D4
D14
R21
100n
CRYSTAL
Pluvio
1K
Rg
CRES2
74AC14M
14) Rg Sw.B
R9
R26
1M
Rg
100n
13) Rg Sw.A
1K
R29
C8
100n
U4
C3
Systems
Airbox_II.ddb
!
The correct working of RAIN gauge, when the station is in stand-by, is
substained by the internal NiCd battery. To allow the proper operation of the
system the battery voltage must be more than 4.6 Volt.
To test it:
1) power off the station;
2) measure the NiCd battery voltage;
3) drop 100 cc of water inside the RainGauge: the 4 LED lights must Flash for
a 1/5 second period per each raing gauge balance "click".
AirBox Two handbook
Release 10.0 November 2007
10R
TMBAT46
D18
J3
100K
10uF
WEST Systems
SCK
R28
May 2004
10) Ss SCK
C31
+
D1
+5V
C9
AirBox II
9) Ss +5V
C5
R2
1K
Gnd
100n
D16
1K
8) Gill Gnd
TZB12V
L1
Vin
100n
7) Gill RD
RD
+
NiCd
Air
TH RS
& BOX
T. Probe
507-762
battery
1K
Release 10.0
6) Gill TD
TD
10K
TZB12V
0.1uF
+V
100k
R8
D3
5) Gill +12V
1K
Gnd
100k
R10
BT2
3.6V NiCd
+
4) Ground
R5
10k
R3
D15
3) +V in
120
R23
TMMBAT46
B
+V
RS485
2) RS485_B
D5
TMBAT46
A
J4
1) RS485_A
10R
U3
ST485AD
R22
100n
WEST Systems
10K
-
November 2007
R4
TZB12V
D19
TMMBAT46
AirBox Two handbook
D17
D2
1
PCB Layout
Battery Voltage
Testing, see note below
L4 L3 L2 L1
4
Air TH & T. Probe
!
3 Data
TZB 5VR1
D2
1K
1K
AirT&RH
Sck
Vdd
Gnd
Data
1K
1K
SHT75
Sck
Vdd
Gnd
Data
AirT&RH
IN-B
D1
2 +5V
WEST
R2
5 Sck 6 GND
3 Data
Connections:
!RS485 --> OUT
!Rain Gauge --> IN-B
!Gill --> IN-A
D2
TZB 5VR1
Gill
1
www.westsystems.com
+V12
S_Gnd
TD
Gnd
RD
SHT75
1
2
3
6
7
IN-A
Rain Gauge
T Sw.B
2
OUT
RS485
4
PAGE
AirBox
Rain gauge
PAGE
A.7
Manufatcurer : LASTEM
Ordering code :DQA030
Rain gauge
Range: illimited . . . .
Accuracy 1%
Resolution 0.2 mm
Collector surface area: 324 square centimeter
Collector area diameter : 203 mm
Temperature range 0..+50°C
AirBox
While the FluxStation is in stand-by state the airbox reads and store the
reading of the raingauge. The airbox is power supplied with a 3.6V
rechargeable battery that’s charged by the FluxStation every analisys
cicle.
Check
www.westsystems.com
www.westsystems.com
Rain gauge support for 50 mm diameter mast mounting
Water filter
Reed ampolla switch
balance / magnet
AirBox Two handbook
Release 10.0 November 2007
Water collection funnel
WEST Systems
November 2007
Release 10.0
WEST Systems
AirBox Two handbook
To check the calibration of the raingauge:
Enter, slowly, 1.0 liter of water in the funnel. The reading must be
increased of 30.8 mm.
Since the rain gauge channel reading is cumulative, you’ve to note any test
you made, in order to do not confuse tests with real rain.
Rain gauge
PAGE
A.8
levelling bolts
In order to have a correct working the raing-gauge must be
levelled by trimming the 3 levelling bolts. A spirit-level will help in
the levelling.
www.westsystems.com
AirBox Two handbook
Release 10.0 November 2007
spirit level
WEST Systems
Release 10.0
November 2007
Unscrew the 3 bolts
WEST Systems
AirBox Two handbook
www.westsystems.com
Remove the cover
Cables
PAGE
C.1
Power supply cable
J1 Amphenol 3 + T Pin Male
Ground
J2
1
2
3
4
Female
SC Ground
Solar cell cable
SC +12V
J3 Amphenol 3 + T Pin Female
J3
1
2
3
4
Female
SC Ground
SC +12V
RS485 cable
Ja Amphenol 6 + T Pin Female
Ja
1
2
3
4
5
6
7
Female
Jb Amphenol 6 + T Pin Female
Gnd
RS485 A
RS485 B
12V Switched
Jb
1
2
3
4
5
6
7
Female
RS485N cable
Ja Amphenol 6 + T Pin Female
Ja
Gnd 1
RS485 A 2
RS485 B 3
Gnd 4
12V NOT switched 5
12V switched 6
7
Female
Jb Amphenol 6 + T Pin Female
Jb
1
2
3
4
5
6
7
Female
Continuous monitoring device handbook
www.westsystems.com
Release 10.0 November 2007
+12 Volts
WEST Systems
J1
1
2
3
4
Male
J2 Amphenol 3 + T Pin Female
PAGE
C.2
Cables
Standard analog sensor cable
WEST Systems
Continuous monitoring device handbook
www.westsystems.com
Release 10.0 November 2007
3 meter
Amphenol 6+T Female (sensor side)
Pin 1
Pin 2
Pin 3
Pin 4
Pin 5
Pin 6
Pin 7
Amphenol 6+T Male (station side)
12 Volts
Channel A signal
Signal GND common
Channel B signal
n.c.
Gnd (power ground)
n.c.
Connectors Amphenol Part Numbers
Amphenol
Amphenol
Amphenol
Amphenol
6+PE
6+PE
3+PE
3+PE
female
male
female
male
cable
cable
cable
cable
Amphenol
Amphenol
Amphenol
Amphenol
T3105-001
T3104-001
T3109-001
T3108-001
Amphenol
Amphenol
Amphenol
Amphenol
6+PE
6+PE
3+PE
3+PE
female
male
female
male
panel
panel
panel
panel
Amphenol
Amphenol
Amphenol
Amphenol
T3107-000
T3106-000
T3111-000
T3110-000
Amphenol PLUG for female
Amphenol PLUG for male
Amphenol T6482-000
Amphenol T6483-000
Global system block scheme.
The system described in this handbook is a data trasmission system able
to transfer bidirectional data between two RS232 based equipments.
F.1
PAGE
SpreadSpectrum 2.4 GHz radio telemetry
The system is composed by 2 radio-modems, 2 antennas, and several
accessories.
RS232C
Master
radio-modem
2.4 GHz SS
Radio links
RS232C
FluxStation
Slave
radio-modem
The maximum range of "radio link" is approximately 35 Km (20 miles) in
optimal conditions. The two antennas of each radio link must be optically
visible in a licteral mode. Rain, storms, high air humidity as well as snow
and tree leaves can reduce drastically the range. The antennas must be
installed in the most elevated position in order to improve the radio signal
quality.
The system can works as
Point to Point Master mode 0
or
Point to Point switched Master mode 6
The factory setting is MODE 0 : point to point
To change from mode 0 to mode 6 some modification in the setup of
Master radio is necessary, as well as modification in the scada_data.mdb
file.
SSR24 based point to point telemetry
Release 10.0 November 2007
Master Center
Computer
WEST Systems
WEST Systems
Freewave based point to point telemetry
www.westsystems.com
Release 10.0 November 2007
In the following drawing a sketch of the system is shown.
PAGE
F.2
SpreadSpectrum 2.4 GHz radio telemetry
Point to point telemetry system
The system is set to trasmit data bidirectionally from the master center
up to the remote equipment:
Due to the specification of the FluxStation the maximum effective
connection rate is limited to 38400bit/sec.
PC -- Master SSR24 radio:
38400 bit/sec;
8 data bit;
1 stop bit;
None parity;
None handshake.
RS232C
Slave
radio-modem
WEST Systems
FluxStation -- SSR24 radio:
38400 bit/sec;
8 data bit;
1 stop bit;
None parity;
None handshake.
FluxStation
WEST Systems
Master
radio-modem
SSR24 based point to point telemetry
Release 10.0 November 2007
Master Center
Computer
Radio link
Freewave based point to point telemetry
www.westsystems.com
Release 10.0 November 2007
RS232C
SpreadSpectrum 2.4 GHz radio telemetry
PAGE
Point to point telemetry system
RS232 cabling specifications
Female 9 pin
DB9 connector
Male 9 pin
DB9 connector
WEST Systems
Slave
radio-modem
WEST Systems
Male 9 pin
DB9 connector
Radio link
Freewave based point to point telemetry
www.westsystems.com
Release 10.0 November 2007
Female 9 pin
DB9 connector
SSR24 based point to point telemetry
Release 10.0 November 2007
Master
radio-modem
Master Center
Computer
FluxStation
F.3
PAGE
F.4
SpreadSpectrum 2.4 GHz radio telemetry
Connecting telemetry to the station
P1
P2
A
B
CPU
RUN
MMC-SD
POWER
POWER ON
PULL AND SWITCH
POWER OFF
ON
+12 +24
SSR24 based point to point telemetry
Release 10.0 November 2007
WEST
CPU
WEST
Freewave based point to point telemetry
www.westsystems.com
Release 10.0 November 2007
AWM3300V
Connect the power supply cord of radio to “Power A”
RS232 cable
9 Pin Female to 9 pin male Pin To Pin RS232 cable:
P1
P2
A
B
AWM3300V
CPU
RUN
MMC-SD
WEST
WEST Systems
POWER
POWER ON
PULL AND SWITCH
POWER OFF
ON
DB9 Female
Connect the radio RS232 to the fluxstation RS232
+12 +24
DB9 Male
WEST Systems
WEST
CPU
0.5 m
P1
P2
A
F.5
PAGE
Connecting telemetry to the station
Fogo Station
SpreadSpectrum 2.4 GHz radio telemetry
B
AWM3300V
POWER ON
PULL AND SWITCH
POWER OFF
+12 +24
Connect the antenna out of radio to the pass-trough connector
RF Radio pig-tail
0.25 meter station-side antenna cable
SMA Male
We supplied two ruggedized BackFire 18 db antennas. The antenna can
be polarized in both , vertical or horizontal polarization. By default the
antennas are set to the vertical polarization.
For the master center we supplied a 10 meter lenght coaxial cable.
WEST Systems
RG316 cable
RCA female
to
N-Type Male
adapter
SSR24 based point to point telemetry
Release 10.0 November 2007
ON
SMA Male
WEST Systems
CPU
RUN
MMC-SD
POWER
WEST
Freewave based point to point telemetry
www.westsystems.com
Release 10.0 November 2007
WEST
CPU
PAGE
F.6
SpreadSpectrum 2.4 GHz radio telemetry
Connecting the antenna to the station
Connect the coaxial cable to the passtrought connection on the right
panel of FluxStation.
The antenna is furnished with a tilt
adapter to point the antenna in the
vertical plane. Due to space problems
the tilt adapter must be assembled by
you.
SSR24 based point to point telemetry
Release 10.1 November 2007
Pay attention to antenna polarization (Vertical in the picture).
WEST Systems
WEST Systems
Freewave based point to point telemetry
www.westsystems.com
Release 10.1 November 2007
Protect the connector with self-bolding tape.
Setting the radio-modem
Change the setting of the radio-modem only when strictly necessary.
F.7
PAGE
SpreadSpectrum 2.4 GHz radio telemetry
!Connect the radio-modem to a computer using a standard serial cable;
!
Open a RS232 terminal , hyperterminal for example;
!
Set the software to 19200 , 8 data bit, 1 stop bit , none parity , none (or
!
hardware ) handshake;
Press the SET red button on the front panel of radio modem: All the LED
light (CTS,TX,RD) on the radiomodem panel will become solid GREEN;
Follow the instruction reported on the handbook to change the setting;
Here following the default (WEST Systems) factory settings for each radiomodem.
Master radio-modem
Modem Serial Number 242-6476
Point to Point Slave/Master Switchable
SET MODEM MODE Modem Mode is 0
(0) Point to Point Master
(1) Point to Point Slave
(2) Point to MultiPoint Master
(3) Point to MultiPoint Slave
(4) Point to Point Slave/Repeater
(5) Point to Point Repeater
(6) Point to Point Slave/Master Switchable
(7) Point to MultiPoint Repeater
(F) Ethernet Options
(Esc) Exit to Main Menu
SET BAUD RATE
Modem Baud is 38400
MODEM CALL BOOK
Entry to Call is 00
Entry Number
Repeater1
(0)
242-7581
(1)
000-0000
Repeater2
RADIO PARAMETERS
(0) FreqKey
5
(1) Max Packet Size 8
(2) Min Packet Size 9
(3) Xmit Rate
1
(4) RF Data Rate
3
(5) RF Xmit Power 10
(6) Slave Security 1
(7) RTS to CTS
0
(8) Retry Time Out 255
(9) Lowpower Mode 0
(A) High Noise
0
(B) MCU Speed
0
(C) RemoteLED
0
SET BAUD RATE
Modem Baud is 038400
(A) Data, Parity 0
(B) MODBus RTU 0
(C) RS232/485
0
(D) Setup Port 3
(E) TurnOffDelay 0
TurnOnDelay 0
(F) FlowControl 0
SSR24 based point to point telemetry
Release 10.0 November 2007
Freewave based point to point telemetry
www.westsystems.com
Release 10.0 November 2007
!
Modem Serial Number 242-7581 SLAVE
RADIO PARAMETERS
SET MODEM MODE
Modem Mode is 4
WARNING: Do not change parameters without
reading manual
(0) Point to Point Master
(1) Point to Point Slave
(2) Point to MultiPoint Master
(3) Point to MultiPoint Slave
(4) Point to Point Slave/Repeater
(5) Point to Point Repeater
(6) Point to Point Slave/Master Switchable
(7) Point to MultiPoint Repeater
(F) Ethernet Options
(Esc) Exit to Main Menu
(0) FreqKey
5
(1) Max Packet Size 8
(2) Min Packet Size 9
(3) Xmit Rate
1
(4) RF Data Rate
3
(5) RF Xmit Power 10
(6) Slave Security 1
(7) RTS to CTS
0
(8) Retry Time Out 255
(9) Lowpower Mode 0
(A) High Noise
0
(B) MCU Speed
0
(C) RemoteLED
0
(Esc) Exit to Main Menu
SET BAUD RATE
Modem Baud is 38400
The most important settings are displayed. The Slave security of the slave
radio must be disabled: SlaveSecurity=1; The modem baud rate has to be
38400. The slave radio has to be in Mode 1 or Mode 4.
WEST Systems
WEST Systems
Slave radio-modem
SpreadSpectrum 2.4 GHz radio telemetry
Setting the telemetry.
First communication and fluxstation-computer
synchronization; The FluxStation clock can be not
synchronized with the computer one; then, since the radio
on/off is managed by the station a synchronization is
necessary. That can be done using the PDA and the SetStation
application or via computer.
The modem can work in point-to-point or in point-to-point switched
mode:
Point to point
Set the master radio mode to 0: master;
Restart the radio modem and check that it is able to connect the slave
radio: the CD light must become solid green.
Open the stations table on scada_data.mdb.
Change the TelemetryID field to COM_1
Check that on the telemetry table the record COM_1 has the fields
CommPort=1 and settings = “38400,n,8,1”;
Be sure that the radio is connected with the COM1: port of the
computer and restart scada.exe. Wait that the CD light of radio is ON,
then select {Call Now}.
If the communications will be successful the FluxStation clock is
synchronized with the PC one and you’re ready.
SSR24 based point to point telemetry
Release 10.0 November 2007
Freewave based point to point telemetry
www.westsystems.com
Release 10.0 November 2007
PAGE
F.8
Point to point switched
Set the master radio mode to 6: master switched;
Change the TelemetryID field to SSR24
Check that on the telemetry table the record SSR24 has the fields
CommPort=1 and settings = “38400,n,8,1”;
Be sure that the stations.TelemetryName is set to “2427581”;
Be sure that the radio is connected with the COM1: port of the
computer and restart scada.exe. Wait that the CD light of radio is ON,
then select {Call Now}.
If the communications will be successful the FluxStation clock is
synchronized with the PC one and you’re ready.
WEST Systems
WEST Systems
Open the stations table on scada_data.mdb.
Setting the telemetry.
Point to point switched with repeater
F.9
PAGE
SpreadSpectrum 2.4 GHz radio telemetry
Enter in the setup of master radio and :
Set the master radio mode to 6: master switched;
Open the call book entry of the radio;
Set the call book entry 0 by setting the 2427581 radio as slave to be
connected, setting the correct sequence of repeater that must be
used.
Open the stations table on scada_data.mdb.
Change the TelemetryID field to SSR24
Check that on the telemetry table the record SSR24 has the fields
CommPort=1 and settings = “38400,n,8,1”;
On the stations table search the record that define the station and
set
Stations.TelemetryName is set to “0”;
The Scada application, if the telemetryID is set to SSR24, when find
a lenght one TelemetryName will use the command ATDT instead
of ATD to call the TelemetryName, then it will use the CallBook data
entry 0 instead of to call directly the slave radio.
SSR24 based point to point telemetry
Release 10.0 November 2007
Freewave based point to point telemetry
www.westsystems.com
Release 10.0 November 2007
To understand the following information a base
knowlege of the freewave operating mode is
necessary.
Be sure that the radio is connected with the COM1: port of the
computer and restart scada.exe. Wait that the CD light of radio is ON,
then select {Call Now}.
If the communications will be successful the FluxStation clock is
synchronized with the PC one and you’re ready.
WEST Systems
WEST Systems
I supposed to use the callbook entry 0 but it’s possible to use another
callbook in the range 0 to 9.
PAGE
F.10
SpreadSpectrum 2.4 GHz radio telemetry
The radio-modem LED Lights
You can check the status of the link watching the LED lights on the
radio-modem front panel. The meaning of the LED light depends on
the function assigned to the radio-modem. The LED light status for
the Master center radio is reported on the drawing below.
CD
TX
When you turn on the master radio-modem the
3 lights are solid red until the radio-modem
connect to the repeater and the slave radiomodem.
If the connection to the slave radio will be
successfull the LED lights will be:
CD
Not Connected
TX
CTS
CD
Connected
TX
CTS
After the connection while trasmitting the data
the LED lights become:
CD
Trasmitting data
TX
SSR24 based point to point telemetry
Release 10.0 November 2007
Sla
co ve N
nn
ec OT
ted
Re
p
e
NO at
T c er
on
ne
cte
d
Se
tu
pM
od
e
Co
nn
ec
ted
No
t
Da
ta
tti
ng
Tra
sm
i
nn
ec
ted
CTS
Co
Freewave based point to point telemetry
www.westsystems.com
Release 10.0 November 2007
Master LED Status
CTS
CD
Repeater
Not Connected
WEST Systems
TX
CTS
If the master radio-modem is able to reach the
repeater but NOT able to connect to the SLAVE
the LED become:
CD
Slave
Not Connected
TX
CTS
If you push the SET button to enter in the Setup
Utility of the radio modem the LED light
become:
CD
Setup Mode
TX
CTS
LED Status legenda
LED is OFF
Solid RED
Flashing Orange
Solid GREEN
Intermittent Flash RED
Solid RED dim
WEST Systems
If the master radio-modem is NOT able to
connect to the REPEATER the LED become:
SpreadSpectrum 2.4 GHz radio telemetry
PAGE
The radio-modem LED Lights
F.11
Slave LED Status
CD
When you turn on the Slave radio-modem the 3 lights
are as shown on the right until it will be connected to
the master radio-modem via repeater.
CD
TX
Not Connected
CTS
If the connection of the slave radio will be successfull
the LED lights will be:
CD
TX
Connected
CTS
After the connection while trasmitting the data the
LED lights become:
CD
TX
Trasmitting data
SSR24 based point to point telemetry
Release 10.0 November 2007
Se
tu
pM
od
e
tC
on
ne
cte
d
No
ng
Da
ta
tti
Tra
sm
i
ted
CTS
Co
nn
ec
Freewave based point to point telemetry
www.westsystems.com
Release 10.0 November 2007
TX
CTS
CD
TX
Setup Mode
CTS
CTS
LED Status legenda
LED is OFF
Solid RED
Flashing Orange
Solid GREEN
Intermittent Flash RED
Solid RED dim
WEST Systems
WEST Systems
If you push the SET button to enter in the Setup
Utility of the radio modem the LED light become:
SMA Antenna connector 50 Ohm
Power Supply inlet 10 .. 24 VDC,
max 1 Ampere @12 VDC
1
2
4
3
WEST Systems
SSR24 based point to point telemetry
Release 10.0 November 2007
RS232 port DTE female
www.westsystems.com
RS232
459
PAGE
SET
CD
TX
CTS
www.westsystems.com
Freewave based point to point telemetry
www.westsystems.com
Release 10.0 November 2007
Status LED Lights
ANTENNA
459
WEST Systems
F.12
SpreadSpectrum 2.4 GHz radio telemetry
The radio modem
Set button (Press to enter in setup mode)
SpreadSpectrum 2.4 GHz radio telemetry
1
2
3
4
PAGE
The radio modem interface schematic
F.13
Power IN
1N4007
J11
D9
1A
+12V
C16
100n
D10
24V600W
J7
1
2
3
4
5
6
7
8
9
10
R15
+VFW
SET
DTR_FW
GND
TDFW
GND
RDFW
CD
RTS
CTS
J10
RS232 FEMALE
1K
1
DSR 6
2
7
3
8
4
9
GND 5
S2
Set Btn
SSR24 based point to point telemetry
Release 10.0 November 2007
Radio
JP2
1
2
D T R _F W
DTR da PC
The radio modem PCB layout
J2
PS In
+VDC
GND
Freewave based point to point telemetry
www.westsystems.com
Release 10.0 November 2007
F2
C1
100n
D2
F1
1A
1N4007
24V600W
D1
R1
RS232
DSR
TD
RTS
RD
CTS
DTR
GND
VDC
DTR
GND
TD
GND
RD
CD
SET
DB9 - FEMALE
J1
RTS
GND
CD
J3
CTS
1K
S1
Set Btn
Other side
WEST Systems
WEST Systems
Freewave
WEST Systems
Rel 1.1/ March 2004
F.12
SpreadSpectrum 2.4 GHz radio telemetry
PAGE
Pointing antennas
It's possible to use the CTS as raw signal strenght indicator;
Enter in the setup of the Master radio and change the RF data rate
parameter to 1, and the Operation mode to 0 (master) then exit from the
(0) FreqKey
5
(1) Max Packet Size 8
(2) Min Packet Size 9
(3) Xmit Rate
1 (set it to 0 to point the antenna)
(4) RF Data Rate
3
(5) RF Xmit Power 10
(6) Slave Security 1
(7) RTS to CTS
0
(8) Retry Time Out 255
(9) Lowpower Mode 0
(A) High Noise
0
(B) MCU Speed
0
(C) RemoteLED
0
(Esc) Exit to Main Menu
TX
No signal
CTS
Then you can start searching the maximum signal
rotating the antenna and searching the strongest
signal. Remember that if the CD LED become RED
you lost the link connection (No signal).
CD
TX
Very low signal
CTS
CD
TX
Medium signal
CTS
WEST Systems
When set to Xmit rate 0 the radio-modem will
trasmit data back and forth continuously, and the
strength of the signal may be gauged by the CTS
LED light. A solid red CTS light indicate a strong
signal, the less the KED is on the weaker the signal.
Because the radio-modems transmit countinuously
when Xmit rate is set to 0 (wheter or not they have
data to send) they use radio spectrum
unnecessarily.. Therefore, xmit rate = 0 should be
used only as a diagnostic tool and not for normal
operation.
CD
TX
Strong signal
CTS
Remember to reset the "xmit rate" parameter to 1 and
the operation mode to the original value
WEST Systems
CD
SSR24 based point to point telemetry
Release 10.0 November 2007
Freewave based point to point telemetry
www.westsystems.com
Release 10.0 November 2007
RADIO PARAMETERS
SoilBox
General description
The Soil.box is an hardware/software interface that convert the signal of Soil
Temperature and of the Soil Water Content TDR CS616 sensor to a digital format
compatible with the DF1A soilflux station.
PAGE
S.1
TDR
1
2
3
6
IN-A
T Gnd-Black
Gnd
RS485A
RS485B
+12 V
RS485
www.westsystems.com
1 Ign-Orange
HUB-04
IN-B
OUT
Pt100
www.westsystems.com
Pt100
TDR
Ohm
TDR P uSec
s/n
CE
Soil WC %
T. °C
The output of the Soil.box is a RS485 with the standard WEST Systems pin out.
Since the SoilBox is designed to be the last device in the bus the RS485 line is
terminated with a 120 Ohm embedded resistor.
Description
Water Content %
Water C. Pulse
Soil temperature
PT100 Resistance
LCD
TDR
TDR RAW
6B13
6B13 R.
Conf
A0
A1
22
A2
Unit LS FS
ID0 ID1 ID2 ID3
%
0 100 1
5
9
0D
uSec
15
35 2
6
0A 0E
°C
0 200 3
7
0B 0F
Ohm
4
8
0C 10
Where:
LCD is the caption that the station display when the channel is selected.
Conf. Is the channel type
Unit is the measure unit.
LS is the minimum reading
FS is the maximum reading
The RED highlighted is the default set.
ID0 .. ID3 are the base RS485 address of the device that you can set following the
next table:
SW5
SW6
SW7
Addr 0
ID0
DIP SW
0
0
0
01
ID1
0
0
1
05
ID2
0
1
0
09
ID3
0
1
1
13
Dip SW 8 :Reserved for calibration / no actual function.
Please note that the soilbox is designed to works only with the CS616 CS water
content TDR probe. The obsolete CS615 can not be used.
Please follow the instructions on the RS485 Expansion chapter of the station
Handbook to configure the station.
WEST Systems
Addresses
SoilBox handbook
Release 10.0 November 2007
Connections:
!
RS485 --> IN A
!
CS616 --> IN-B
!
Pt100 --> OUT
PAGE
S.2
SoilBox
Connectors pinout
Soil Temperature Pt100 Connections
www.westsystems.com
Panel 3+T
Pin 1:
Pin 2:
Pin 3:
Pin T:
!
female connector
Red 1
Red 2
White 1
White 2
If you’re using a old Pt100 probe , supplied with the Rs485 HUB check that the
pin T is connected to the White 2 wire of the Pt100 probe. If NOT please modify
the Pt100 connection. A simple bridge between pin 3 and pin T can be enough ,
also if this simple solution can reduce the temperature measurement accuracy.
CS616 Connections
WEST Systems
SoilBox handbook
Release 10.0 November 2007
Panel 6+T female connector
Pin 1: Orange (Ignition)
Pin 2: Red (Power supply)
Pin 3: Green (Signal)
Pin 4: Black + Screen (Ground)
RS485 Connections
Panel 6+T male connector
Pin 1: Gnd
Black
Pin 2: A
Yellow
Pin 3: B
Green
Pin 6: +V12 Red
DIP switch settings
DIP SW
SW1
SW2
SW3
SW4
DIP SW
Enable/Disable
TDR
TDR RAW
6B13
6B13 R.
Enable/Disable
Factory Default
1
1
1
1
Factory Default
SW5
ID Set 0
0
SW6
ID Set 1
0
SW7
ID Set 2
0
SW8
Calibration
0
See page S.1
1A
F1
1K
R18
B
A
Vp
1
2
3
4
5
6
7
CS61x
J10
V12
U7
VN820
1N4007
D14
10R
R33
10R
R32
Vp
C10
D15 100n
TZB12V
D17
D16
VCC
T1OUT T1IN
T2OUT T2IN
R1IN R1OUT
R2IN R2OUT
ST232CD
6
7
7805
VIN
D
R
DE
RE
100n
C31
VR2
OUT
12
9
11
10
1
3
4
5
VCC
C11
100n
VCC
8
4
1
3
2
D1
C22
100n
R29
1M
SCK
MOSI
MISO
CS616EN
VCC14
1
19
2
3
4
5
6
7
8
9
10
11
12
13
14
15
16
17
18
1
PE0 RXD0/(PDI)
PE1 TXD0/(PDO)
PE2 (XCK0/AIN0)
PE3 (OC3A/AIN1)
PE4 (OC3B/INT4)
PE5 (OC3C/INT5)
PE6 (T3/INT6)
PE7 (IC3/INT7)
PB0 (SS)
PB1 (SCK)
PB2 (MOSI)
PB3 (MISO)
PB4 (OC0)
PB5 (OC1A)
PB6 (OC1B)
PB7 (OC2/OC1C)
TOSC2/PG3
PEN
GND
VCC
C43
100n
A Y
U10A
7
2 3
C23
100n
VCC
CRES2
100n R30
1M
RST
TOSC1/PG4
74AC14M
RST
(AD0) PA0
(AD1) PA1
(AD2) PA2
(AD3) PA3
(AD4) PA4
(AD5) PA5
(AD6) PA6
(AD7) PA7
(ALE) PG2
(A15) PC7
(A14) PC6
(A13) PC5
(A12) PC4
(A11) PC3
(A10) PC2
(A9) PC1
(A8) PC0
74AC14M
U10B
4 5
C39
22p
C40
22p
Y2
74AC14M
U10C
CRYSTAL
6 T1
SoilBox handbook
Release 6.9 October 2004
R36
10K
D18
TZB5V
VCC
Q2
BC817
100n
C37
C36
100n
TMMBAT46
1K
R26
ST485AD
GND VCC
A
B
U9
PS_CHK
R35
10K 5
R34
10K
EN
C1+
C1C2+
C2-
VCC
PG1 (RD)
PG0 (WR)
34
33
51 1
50 2
49 3
48 4
47 5
46 6
45 7
44 8
43
42
41
40
39
38
37
36
35
VCC
L6
100uH
100uH
+ C44
5VR
C38
100n
AVCC
C32
100n
10uF
AD7714_RST
VCC
6
VCC
C33
100n
AVCC
5VR
AD7714
DGND
RESET
SYNC
DOUT
POL
CS
DRDY
DIN
SCK
DVDD
U11
AVCC
AGND
STBY
BUFF
VREF+
VREFAIN5
AIN6
AIN3
AIN4
AIN1
AIN2
MCKIN
MCKOUT
D13
D12
D11
D10 VCC
GND
12 AVCC
18
11 VCC
13
15
14
16
17
9
10
7
8
2
3
9
22p
74AC14M
1013
74AC14M
U10F
C30
100n
5VR
6K19 0.1%
R40
C26
100n
6K19 0.1%
22p
U10D
74AC14M U10E
8 11
400uA REF
R39
C41
XT2 C42
R31
1M XTAL
12
RED1
RED2
WHITE1
WHITE2
C25
100nRED2
400uA REF
J9
4
3
2
1
Pt100 Input
PAGE
Schematic
www.westsystems.com
24
5
MISO
0R
21
AD7714_CS
23
L1
L2
L3
L4
4
19
20
R38
R20
1K
R21
1K
R25
1K
R19
1K
22
1
L5
16
15
14
13
12
11
10
9
MOSI
SCK
VCC
R37
10K
AD7714_CS
AD7714_RST
SW DIP-8
S2
ATMEGA128/64
U6
SoilBox
WEST Systems
RS485
6
5
4
3
2
1
J8
V12 Switched
L4
DB9 Female
RD
13
8
14
7
GND
TD
100n
C35 U5
2
V+
6
V-
VCC
VCC
16
VCC
GND
15
C34
VCC
1
6
2
7
3
8
4
9
5
C9
TZB12V
TZB12V
RESET
VCC
GND
20
21
22
100n
23
J1
Output
Status
Vcc
Input
GND
1
24
100n
CS616EN
XTAL2
64
63
62
61
60
59
58
57
56
55
54
AVCC
GND
AREF
PF0 (ADC0)
PF1 (ADC1)
PF2 (ADC2)
PF3 (ADC3)
PF4 (ADC4/TCK)
PF5 (ADC5/TMS)
PF6 (ADC6/TDO)
PF7 (ADC7/TDI)
PD0 (SCL/INT0)
(SDA/INT1) PD1
(RXD1/INT2) PD2
(TXD1/INT2) PD3
(IC1) PD4
(XCK1) PD5
(T1) PD6
(T2) PD7
25
26
27
28
29
30
31
32
T1
XTAL1
53
1
2
3
4
5
6
7
8
9
10
52
VCC
GND
RST
VCC
AVCC
J5
JTAG
S.3
SoilBox
PCB Layout
100n
C33
C32
L6
C30
C25
6K19 0.1%
100n
R39
C26
HUB2004.DDB
+
p
100n
Red2
Red1
J9
Pt100 Input
+12VS
C43
CS61x
1K
R21
C31
U10
BC817
White 2 Pin T
White 1 Pin 3
Red 2
Pin 2
Red 1
Pin 1
Ignition Pin 1(Yellow)
P.Supply Pin 2(Red)
Signal
Pin 3(Green)
Gnd
Pin 4(Blue)
1K
10K
D1
5
Gnd
J
74AC14M
4
G
6
A
/
Q2
8
J
T
A
12
CRES2
TMMBAT46
A
2 A
B
3 B
C23
R34
D11
C36
ST232CD
R29
100n
ST485AD
C35
C34
100n
C22
100n
1A
TZB12V
7805
U5
R35
VR2
Pin 1
Pin 2
Pin 3
(Blue)
(Green)
(Yellow)
+12Volts
Pin 6
(Red)
C37
100n
C9
F1
100n
J8
L4
V12 Switched
C11
RS485
100n
100n
R32
10K
+12V
1N4007
6 +12V
D10
1M
10R
Gnd
RS485-A
RS485-B
D17
D12
S2
R30
10K
R33
D13
1M
SW DIP-8
D16
10R
RS485
Gnd
TZB12V
U9
WEST
Systems
1 Gnd
8
1
100n
R36
100n
R26
1K
Gnd
G
1K
L4
R20 R19
L3
100n
U7
Green
E
Green
A1
T
M
VN820
3
R
1K
L2
R25
7
Red
U
6
10
K
L1
CS616
J10
Orange
XTAL
A
XT2
T
R1
S
L
R2
Y
0
2
R
4
Y
C
C
C38
100n
TZB12V
DB9 Female
J1
1K
100n
D18
R18
D15
C10
TZB5V
WEST Systems
5
U11
2
100n
D14
SoilBox handbook
Release 6.9 October 2004
W1
1
White1
L5
2
100uH
10uF
PT100
W2
R40
C44
9
3
C
2
2
p
SoliBox Rel 2.00
www.westsystems.com
100uH
AD7714
100n
0 R
R38
6K19 0.1%
White2
PAGE
S.4
Testing temperature channel
Connect the dummy Pt100 probe , you can ask with no charge to WEST Systems, to the soil box and check
that the 6B13 channel reading is equal to the reading reported on the label attached to the dummy probe.
The Dummy probe resistance has a tolerance of 1/1000 of the value reported on the label. The temperature
reading error must be less than 0.5°C
WEST Systems provide a 100 Ohm (Zero degree Celsius) and a 154 Ohm (141.1°C ) dummy probes.
Dummy Pt100
154 Ohm
141.1 °C
To check the soil pt100 probe use a calibrated termocouple or pt100 (better) portable gauge and compare
the reading with the station one. A 1.6°C tollerance must be acceptedt if you use a K termocouple, a 0.5°C
tollerance is normal if you use a Pt100 probe.
Testing TDR channel
The field test of the TDR is not possible. In order to have a valid data set avoid to extract the TDR probe from
soil to do not perturbate the reading.
SoilBox
Soil water content
PAGE
S.5
6+T
Pin
Pin
Pin
Pin
Pin
Pin
Pin
Male cable connector
(To the SoilBox)
1 : Red +12 Volt
2 : Orange
Ignition
3 : Green
Frequency signal out
4 : Black+Sh. Ground
5 : n.c.
6 : n.c.
T : n.c.
WEST Systems
SoilBox handbook
Release 6.9 October 2004
The CS616 (CS615) Water Content Reflectometer measures the volumetric water content of porous
media using time-domain measurement methods.
The Water Content Reflectometer consists of two stainless steel rods connected to a printed circuit
board. A shielded four-conductor cable is connected to the circuit board to supply power, enable the
probe, and monitor the pulse output. The circuit board is encapsulated in epoxy. The probe rods can
be inserted from the surface or the probe can be buried at any orientation to the surface.
The CS616 (CS615) response is dependent on the dielectric constant of the material surrounding
the probe rods. Water is the principal contributor to the dielectric constant value, but the solid
constituents such as quartz, clay and organic matter also affect the measurement. The same
calibration of volumetric water content to probe output signal period may not apply to all soils.
Accuracy can be optimized by using calibrations derived for a specific soil. Accuracy of ± 2.0% over
the entire water content range and for a wide range of soil types is routinely obtained in our
laboratory. Applying the general calibrations from the operating manual provides accuracy of ±
3.0%.
www.westsystems.com
Manufatcurer : Campbell Scientific
Ordering code : . . . CS616 / CS615 (Out of stock)
Water content
Range 5-50 %
Accuracy 3%
www.westsystems.com
PAGE
S.6
SoilBox
Soil temperature
Manufatcurer : RS
Ordering code :RS 321-6090
Type : Pt100 DIN IEC 751 Class B 4 wires
Range 0 to 200 °C
Max operating temperature 200°C
Accuracy 0.3°C
Probe length 300 mm
Probe diameter 6 mm
Cable length 3 Meter
Cable PTFE and silicon insulated
WEST Systems
SoilBox handbook
Release 6.9 October 2004
3+T
Pin
Pin
Pin
Pin
300 mm
Male connector (to the SoilBox)
1 : RED
2 : RED
3 : White
T : White
PDA software installation
The SetStation software is furnished by WEST Systems on two different support
format:
!On the WEST Systems software CD
!
On the Compact Flash data card.
PAGE
Z.1
4) Copy the file SetStation.exe file in the folder
\\Mobile device\PocketPC\Windows\Start Menu
"storage card" based installation
ACER n300
WEST Systems
acer
n300
All Palmtops:
!Insert the Compact Flash / Secure Digital Card in the palmtop;
!Run "File Explorer" on your palmtop;
!Select the file "SetStation.exe" from the "Storage card";
!Copy the file SetStation.exe file in the folder "\Windows\Start Menu";
In the next page the CF / SD /MMC based installation is described in
detail.
www.westsystems.com
1) Connect the palmtop to your computer using the USB or Serial craddle;
2) Start the communications with the palmtop using MS ActiveSynch;
3) Open "Windows Explorer" of your PC
FluxStation handbook
Release 10.0 December 2007
PC based installation
WEST Systems
www.westsystems.com
Since the use of Microsoft ActiveSynch is not always so easy we advise
you to setup SetStstion using the furnished CF compact flash (or SD
secure digital) memory card.
Software installation
File explorer
My device
www.westsystems.com
iPAQ File store
My Documents
Program Files
Storage card
Temp
Windows
File explorer
Storage card
SetStation
Cut
Copy
Rename
Delete
To select and copy the file in the "storage card":
Tap "Start" , "Programs"
then tap "File Explorer".
From the "File explorer" menu tap "My Device"
and then tap "Storage card"
Now tap and hold SetStation until a flying menu
appear.
Tap "Copy"
www.westsystems.com
PAGE
Z.2
Then tap "Storage card" and select "My Device",
then "Windows" and now "Start menu"
Now tap and hold in the white area of "Start menu"
folder until a flying menu will appear.
Programs
Settings
Active synch
Bluetooth manag...
Calendar
Windows media
Refresh
View all files
Tap "Paste"
Paste
Paste shorcut
New Folder
Start
Today
Active synch
Bluetooth Manager
SetStation
Tasks
Windows media
Now close all the applications and then tap "Start":
the SetStation.exe will be one of the "Start" menu
items.
FluxStation handbook
Release 10.0 December 2007
File explorer
Start menu
WEST Systems
WEST Systems
FluxStation handbook
Release 10.0 December 2007
Send via e-mail
Beam file....
Scada software installation
The Scada software is furnished by WEST Systems on
software CD.
the WEST Systems
PAGE
Z.3
Requirements
OS Requirements
The Scada software suite can run on MS Windows XP professional, MS Vista pro
/ business. We don’t advise other OS such as XP Home or Vista Home.
First installation
Run ScadaSetup.msi
www.westsystems.com
www.westsystems.com
The Scada software suite requires the installation of the MS .NET Framework
2.0. To simplify the installation the computer must have an internet connection.
Make a backup copy of scada_data.mdb and scada_log.mdb;
Using Control Panel disinstall the old Scada;
Run ScadaSetup.msi , preserving the old databases.
WEST Systems
The new Scada suite is ready to run.
WEST Systems
Upgrades
FluxStation handbook
Release 10.0 December 2007
once finished the scada suite is ready to run.
WEST Systems
WEST Systems
FluxStation handbook
Release 10.0 December 2007
FluxStation handbook
Release 10.0 December 2007
www.westsystems.com
www.westsystems.com
PAGE
Z.4
HandBook 10.0 released on November 2007
FluxStation HWR8 and Scada software suite
HandBook 10.1 released on December 2007
Some minor revision were introduced:
Chapter 2 : Assembly instruction
Appendix F: Page F.6 antenna assembly instruction
© www.westsystems.com
Continuous monitoring
Release 10.1 December 2007
W
Sys ES
tem T
s
© www.westsystems.com
Continuous monitoring
Release 10.1 December 2007