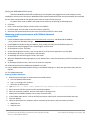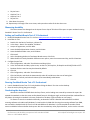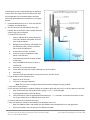
1
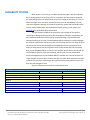
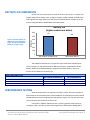
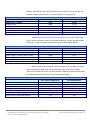
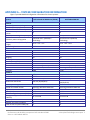
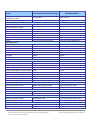
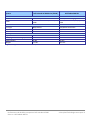
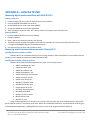
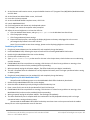
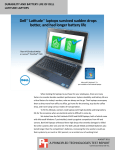
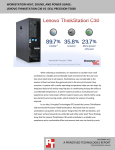
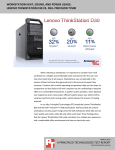
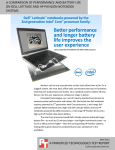
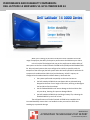
PERFORMANCE AND DURABILITY COMPARISON: DELL LATITUDE 14 5000 SERIES VS. HP ELITEBOOK 840 G1 When you’re looking to purchase new business-class notebooks for a wide range of employees, durability and superior performance should dictate your choice. In the Principled Technologies labs, we put the performance and durability of two systems to the test: the Dell Latitude 14 5000 Series (E5440) and HP EliteBook 840 G1. We purchased systems that were configured as similarly as possible, with the exception of the drive type (the Dell system had a solid-state hybrid drive while the HP system used a traditional hard disk drive) and the battery. At Dell’s request, we configured each notebook with the default battery. We found that: the systems performed comparably on the tests that we ran the Dell Latitude 14 5000 Series was better able to withstand being dropped to the floor from a height of 29 inches, suffering no damage to the hard drive after three drops the HP EliteBook 840 G1 took severe damage to the hard drive after only one drop, showing 90.1 percent damaged blocks the Dell Latitude 14 5000 Series had longer battery life, outlasting the EliteBook 840 G1 by over half an hour The solid performance of the Dell Latitude 14 5000 Series coupled with its increased durability means that it can handle the tasks you need it to while also standing up to potential damage. MARCH 2014 A PRINCIPLED TECHNOLOGIES TEST REPORT Commissioned by Dell Inc. DURABILITY TESTING When workers are on the go, accidents sometimes happen. Not all notebooks do an equally good job of surviving a fall. To see how our two test systems compared, we attempted to drop each system three times from a height of 29 inches (73.7 cm), or about desk-high. After each drop, we used HD Tune Pro 5.00 and HDDScan 3.3, tests that assess hard drive damage, to measure how well the system had protected its data. Once a system failed to boot, we conducted no further testing on that system. See Appendix A for detailed hardware information. The Dell Latitude 14 5000 Series proved the more durable of the systems, sustaining no damage to the hard drive after three drops. During the second drop, the Dell Latitude 14 5000 Series suffered minor cosmetic damage, with the DVD drive faceplate breaking on one side. The HP EliteBook 840 G1 suffered no cosmetic damage, but made an intermittent clicking noise after the first drop. After the first drop, 90.1% of the HP system’s blocks were damaged and PassMark BurnIn Pro registered an error when we attempted to launch the graphics tests for the second drop. On the second drop, the HP EliteBook 840 G1 ran only the CPU and Disk BurnIn tests as the 2D and 3D tests would not function. After the third drop, the HD Tune Pro scan showed 98.6 percent damaged blocks on the EliteBook 840 G1, and after this scan the drive was no longer visible in the OS or BIOS. The drive was also not visible when attached to another computer for scanning via USB dongle. We could not perform the HDDScan test, as the drive was too damaged to scan. Figure 1 summarizes the results of our hard drive scans. Drop testing – physical data protection Dell Latitude 14 5000 Series HP EliteBook 840 G1 0.0% 0 90.1% 40,140 0.0% 0 90.6% 78,426 0.0% 0 98.6% N/A Drop 1 HD Tune Pro 5.00 damaged blocks percentage HDDScan 3.3 bad blocks Drop 2 HD Tune Pro 5.00 damaged blocks percentage HDDScan 3.3 bad blocks Drop 3 HD Tune Pro 5.00 damaged blocks percentage HDDScan 3.3 bad blocks Figure 1: The results of our physical data protection drop test for the notebooks. Performance and durability comparison: Dell Latitude 14 5000 Series vs. HP EliteBook 840 G1 A Principled Technologies test report 2 BATTERY LIFE COMPARISON No one likes to be tethered to an outlet to do his or her work, so a system with lengthy battery life is always a plus. As Figure 2 shows, the Dell Latitude 14 5000 Series had a significantly longer battery life than the HP EliteBook 840 G1, outlasting it by 38 minutes using the BAPCo® MobileMark® 2012 benchmark. Battery life (higher numbers are better) 600 533 495 Figure 2: The Dell Latitude 14 5000 Series lasted 38 minutes longer than the HP EliteBook 840 G1 on a single charge. Minutes 500 400 300 200 100 0 Dell Latitude 14 5000 Series HP EliteBook 840 G1 The Latitude also delivered a 73.2 percent higher Performance Qualification score (see Figure 3). The Dell Latitude 14 5000 Series battery shipped with a 65 Wh battery, while the HP EliteBook 840 G1 shipped with a 50 Wh battery, which can account for the difference in battery life. BAPCo MobileMark 2012 Performance Qualification score MobileMark 2012 - Battery Life score (minutes) MobileMark 2012 - Battery Life score (hours: minutes) Dell Latitude 14 5000 Series 123 533 8:53 HP EliteBook 840 G1 71 495 8:15 Figure 3: Median scores for the BAPCo MobileMark 2012 benchmark. Higher numbers are better. PERFORMANCE TESTING Because performance is so important to today’s worker, we used a number of benchmarks to rate the performance of the notebooks, and found that the Dell Latitude 14 5000 Series was up to completing the tasks workers require. We ran each test three times and report the median of the three runs. Futuremark® 3DMark® Advanced rates a system’s graphics performance by testing the video card. Both systems had integrated Intel HD Graphics 4400 graphics Performance and durability comparison: Dell Latitude 14 5000 Series vs. HP EliteBook 840 G1 A Principled Technologies test report 3 adapters. We found that two systems performed comparably in this test, with the Dell Latitude 14 5000 Series achieving a 2.7 percent higher score (see Figure 4). 3DMark Advanced Dell Latitude 14 5000 Series 3,955 4,896 2,365 21.00 21.59 7.51 3DMark Score - Median Graphics Score Physics Score Graphics Test 1 Graphics Test 2 Physics Test HP EliteBook 840 G1 3,852 4,707 2,355 20.33 20.61 7.48 Figure 4: Median scores for the 3DMark Advanced benchmark. Higher numbers are better. HDXPRT 2012 measures the performance of systems on common media usages. Figure 5 shows the median results of our HDXPRT 2012 tests. The Dell Latitude 14 5000 Series had a 1.3 percent higher Create HD Score than the HP EliteBook 840 G1. HDXPRT 2012 Create HD Score (higher is better) Media Organizer - minutes (lower is better) Media Creator - minutes (lower is better) Photo Blogger - minutes (lower is better) Video Producer - minutes (lower is better) Music Maker - minutes (lower is better) Dell Latitude 14 5000 Series 154 6.57 13.86 9.69 2.83 3.39 HP EliteBook 840 G1 152 6.56 13.91 9.82 2.97 3.44 Figure 5: Median scores for the HDXPRT 2012 benchmark. BAPCo SYSmark® 2012 measures system performance for a number of common tasks including office productivity and media creation. Figure 6 shows the median results of our SYSmark 2012 tests. The Dell Latitude 14 5000 Series and HP EliteBook 840 G1 achieved identical SYSmark 2012 Overall Performance Ratings. BAPCo SYSmark 2012 SYSmark 2012 Overall Performance Rating SYSmark 2012 - Office Productivity SYSmark 2012 - Media Creation SYSmark 2012 - Web Development SYSmark 2012 - Data/Financial Analysis SYSmark 2012 - 3D Modeling SYSmark 2012 - System Management Dell Latitude 14 5000 Series 114 116 104 104 127 111 124 HP EliteBook 840 G1 114 116 103 106 120 111 129 Figure 6: Median scores for the BAPCo SYSmark 2012 benchmark. Higher numbers are better. Performance and durability comparison: Dell Latitude 14 5000 Series vs. HP EliteBook 840 G1 A Principled Technologies test report 4 WHAT WE TESTED About BAPCo MobileMark 2012 BAPCo MobileMark 2012 is an industry-standard benchmark that provides a battery life rating and a performance rating based on common office scenarios. MobileMark 2012 uses applications and workloads specific to mobile systems. These include office activities like file and document management, data processing, and rich content creation. This module provides a score for battery life of the tested applications. MobileMark 2012 measures system battery life in minutes. It records system battery life at the start of the benchmark and repeats the workload until the system battery life is depleted, or until the system powers down due to low battery life. For more information on this benchmark, see www.bapco.com/products/mobilemark2012/index.php. About Futuremark 3DMark Advanced The Futuremark 3DMark Advanced benchmark suite tests system GPU DirectX® 11 performance and CPU workload processing performance, primarily to report a system’s 3D gaming capability. Tests include HDR rendering, shadow mapping, and pixel shading. For more information on this benchmark, see www.futuremark.com/benchmarks/3dmark/all. About HDXPRT 2012 The High Definition eXperience & Performance Ratings Test (HDXPRT) 2012 is a benchmark that evaluates the capabilities of PCs in consumer digital media uses, including the following: Media Organizer Media Creator Photo Blogger Video Producer Music Maker For more information on HDXPRT 2012, see www.hdxprt.com. About BAPCo SYSmark 2012 BAPCo SYSmark 2012 is an application-based benchmark that tests performance in the following office workload scenarios: office productivity, media creation, Web development, data/financial analysis, 3D modeling, and system management. SYSmark 2012 records the time the system takes to complete each individual operation in each scenario. For more information on this benchmark, see www.bapco.com/products/sysmark-2012. Performance and durability comparison: Dell Latitude 14 5000 Series vs. HP EliteBook 840 G1 A Principled Technologies test report 5 IN CONCLUSION Durability and performance are important when selecting a notebook for employees in the workplace. The Dell Latitude 14 5000 Series performed comparably to or better than a similarly configured competitor system while also withstanding three drops without compromising physical data. The HP EliteBook 840 G1 incurred severe hard drive damage on the first drop and continued to take damage with every drop. This means that the Dell Latitude 14 5000 Series should handle common tasks for work and be durable enough for workers on the go. Performance and durability comparison: Dell Latitude 14 5000 Series vs. HP EliteBook 840 G1 A Principled Technologies test report 6 APPENDIX A – SYSTEM CONFIGURATION INFORMATION Figure 7 provides detailed configuration information for the test systems. System General Number of processor packages Number of cores per processor Number of hardware threads per core Total number of processor threads in system System power management policy Processor power-saving option System dimensions (width × depth × height) System weight CPU Vendor Name Model number Stepping Socket type Core frequency (GHz) System Bus L1 cache L2 cache L3 cache Platform Vendor Motherboard model number Motherboard chipset BIOS name and version Memory module(s) Vendor and model number Type Speed (MHz) Speed running in the system (MHz) Timing/Latency (tCL-tRCD-tRPtRASmin) Size (MB) Number of memory module(s) Total amount of system RAM (GB) Dell Latitude 14 5000 Series (E5440) HP EliteBook 840 G1 1 2 2 1 2 2 4 4 Dell Enhanced Intel® SpeedStep® Technology HP Optimized Enhanced Intel SpeedStep Technology 13.3″ × 9.3″ × 1.1″ 13.3″ × 9.3″ × 0.8″ 4.9 lbs. 4.0 lbs. Intel Core™ i5 4200U C0 Socket 1168 BGA 1.60 Intel DMI 5 GT/s 32 KB + 32 KB (per core) 256 KB (per core) 3 MB Intel Core i5 4200U C0 Socket 1168 BGA 1.60 Intel DMI 5 GT/s 32 KB + 32 KB (per core) 256 KB (per core) 3 MB Dell 0RT36Y Intel 8 series chipset Hewlett-Packard 198F Intel 8 series chipset Hewlett-Packard L71 Ver.01.04 (10/09/2013) Dell A01 (09/18/2013) Samsung® M471B5173BD0-YK0 PC3-12800 1,600 1,600 Samsung M471B5173DB0-YK0 PC3-12800 1,600 1,600 11-11-11-28 11-11-11-28 4,096 1 4 4,096 1 4 Performance and durability comparison: Dell Latitude 14 5000 Series vs. HP EliteBook 840 G1 A Principled Technologies test report 7 System Chip organization (singlesided/double-sided) Channel (single/dual) Hard disk Vendor and model number Number of disks in system Size (GB) Buffer size (MB) RPM Type Controller Driver Operating system Name Build number Service Pack File system Kernel Language Microsoft DirectX version Graphics Vendor and model number Type Chipset BIOS version Total available graphics memory (MB) Dedicated video memory (MB) System video memory (MB) Shared system memory (MB) Resolution Driver Sound card/subsystem Vendor and model number Driver Ethernet Vendor and model number Driver Wireless Vendor and model number Driver Optical drive(s) Vendor and model number Type Dell Latitude 14 5000 Series (E5440) HP EliteBook 840 G1 Double-sided Double-sided Single Single Seagate® ST500LM000-1EJ16 1 500 64 5,400 SSHD SATA 6Gb/s Intel 8 series chipset Intel 12.6.2.1000 (05/20/2013) Toshiba MK5061GSYN 1 500 16 7,200 SATA 3.0Gb/s Intel 8 series chipset Intel 12.8.0.1016 (08/01/2013) Microsoft® Windows® 7 Professional 7601 1 NTFS ACPI x64-based PC English DirectX 11 Microsoft Windows 7 Professional 7601 1 NTFS ACPI x64-based PC English DirectX 11 Intel HD Graphics 4400 Integrated Intel HD Graphics 4400 2171.13 1,696 64 0 1,632 1,366 × 768 Intel 9.18.10.3257 (07/29/2013) Intel HD Graphics 4400 Integrated Intel HD Graphics 4400 2175.1 1,740 128 0 1,612 1,366 × 768 Intel 9.18.10.3324 (10/07/2013) Realtek High Definition Audio Realtek 6.0.1.5978 (08/01/2013) IDT High Definition Audio IDT 6.10.6486.0 (07/05/2013) Intel Ethernet Connection I218-LM Intel 12.6.51.9427 (07/09/2013) Intel Ethernet Connection I218-LM Intel 12.8.33.9427 (09/06/2013) Dell Wireless 1506 Atheros 10.0.0.227 (02/19/2013) Intel Dual Band Wireless-N 7260 Intel 16.1.5.2 (08/29/2013) HL-DT-ST GU90N DVD+-RW N/A N/A Performance and durability comparison: Dell Latitude 14 5000 Series vs. HP EliteBook 840 G1 A Principled Technologies test report 8 System Ports USB Other Monitor LCD type Screen size Refresh rate Battery Type Size (length × width × height) Rated capacity Weight Dell Latitude 14 5000 Series (E5440) HP EliteBook 840 G1 1 × USB 2.0, 2 × USB 3.0 SD™ Media card reader, Mini DP, VGA, HDMI 3 × 3.0, 1 × 3.0 Charging SD Media card reader, Display Port, VGA WLED-backlit 14.0″ 60 LED-backlit HD SVA flat 14.0″ 60 Lithium-ion 8.12″ × 2.75″ × 0.75″ 65 Wh 0.72 lbs. Lithium-ion 7.75″ × 4.00″ × 0.25″ 50 Wh 0.57 lbs. Figure 7: Configuration information for the test systems. Performance and durability comparison: Dell Latitude 14 5000 Series vs. HP EliteBook 840 G1 A Principled Technologies test report 9 APPENDIX B – HOW WE TESTED Measuring digital media capabilities with HDXPRT 2012 Setting up the test 1. 2. 3. 4. 5. Locate the optical drive or attach an external drive to the notebook. Insert the HDXPRT DVD-ROM into the drive. At the HDXPRT Install screen, click Install HDXPRT. Accept the HDXPRT end user license agreement. After the setup is complete, select Yes, I want to restart my computer now, and click Finish. Running HDXPRT 1. 2. 3. 4. Click the HDXPRT 2012 shortcut on the desktop. Click Run HDXPRT. Enter a test name, choose 4 iterations, and click Run. The Results Screen automatically appears at the end of a successful run. The test results files are found in the C:\ProgramFiles\HDXPRT\Reports\<TestName> directory. 5. Run the test one more time, and record the results. Measuring overall system performance with SYSmark 2012 Avoiding antivirus software conflicts SYSmark 2012 is not compatible with any virus-scanning software, so we uninstalled any such software that was present on the notebook PCs before we installed the benchmark. Avoiding pre-installed software conflicts SYSmark 2012 installs the following applications, which its test scripts employ: ABBYY® FineReader Pro 10.0 Adobe® Acrobat® Pro 9 Adobe After Effects® CS5 Adobe Dreamweaver® CS5 Adobe Photoshop® CS5 Extended Adobe Premiere® Pro CS5 Adobe Flash® Player 10.1 Autodesk® 3DS Max® 2011 Autodesk AutoCAD® 2011 Google SketchUp® Pro 8 Microsoft Internet Explorer® Microsoft Office 2010 Mozilla® Firefox® Installer Mozilla Firefox 3.6.8 Winzip® Pro 14.5 If any of these applications are already on the system under test, they will cause problems with the benchmark due to software conflicts. To avoid any such issues, before we installed the benchmark, we uninstalled all conflicting preinstalled software applications, including different versions of any of the programs SYSmark 2012 uses. Performance and durability comparison: Dell Latitude 14 5000 Series vs. HP EliteBook 840 G1 A Principled Technologies test report 10 Setting up the test Using the SYSmark built-in Configuration tool This tool supports three levels of configuration: 1. Only makes changes that are REQUIRED in order for the benchmark to run. 2. Additionally, makes changes that are RECOMMENDED for repeatable results. 3. Additionally, makes OPTIONAL changes that help ensure best results. The Configuration tool makes the following configuration changes at each of the three levels: Level 1 - Required Disables User Account Control (UAC) Disables Windows Update Disables System Sleep and Hibernate Disables Low Battery Actions Disables Network Proxies Level 2 - Recommended Creates BAPCo power scheme Sets Power Plan Type to High Performance Disables Windows Firewall Disables Windows Sidebar/Gadgets Disables Windows Pop-ups Disables Incoming Remote Desktop Connections Disables Windows Error Reporting Disables Screen Saver and Monitor Timeout Sets CPU Adaptive Mode Disables Desktop Slideshow Disables Disk Defrag Level 3 - Optional Sets Hard Disk Timeout Disables Windows Defender Disables System Restore Ignores Laptop Lid Close Sets Maximum Display Brightness Disables Adaptive Brightness Installing SYSmark 2012 and configuring the system for testing 1. Locate the optical drive or attach an external drive to the notebook. 2. 3. 4. 5. 6. 7. Insert the SYSmark 2012 v1.5 Install DVD into the drive. When the Autoplay menu appears, click Run SYSmark2012_setup.exe. At the Welcome screen, click Next. Enter the serial number, and click Next. Accept the license agreement, and click Next. At the Choose Components screen, select Full, and click Next. Performance and durability comparison: Dell Latitude 14 5000 Series vs. HP EliteBook 840 G1 A Principled Technologies test report 11 8. At the Choose Install Location screen, accept the default location of C:\Program Files (x86)\BAPCo\SYSmark2012, and click Next. 9. At the Choose Start Menu Folder screen, click Install. 10. Insert Disc 2 when prompted. 11. At the InstallShield Wizard Complete screen, click Finish. 12. Download and install SYSmark 2012 v1.5 Patch 1 and v1.5.2 Patch 2 from www.bapco.com/products/support/sysmark-2012. 13. Launch SYSmark 2012. 14. Click Configuration and choose all options. 15. Click Apply, and restart the computer when prompted. Running the test 1. 2. 3. 4. Launch SYSmark 2012 by double-clicking the desktop icon. Enter a Project name and choose 3 iterations. Click Run Benchmark. Repeat steps 1 through 3 two more times, and record the last run. Getting the SYSmark 2012 results When SYSmark 2012 has completed, the Test Results Viewer appears. To submit these results to BAPCo, we saved the test results by performing the following steps: 1. Click Save. 2. Enter a name, and select FDR to save the results as an FDR file. 3. Click Save again, and select PDF to save the results as a PDF file. 4. Browse to the Documents directory where the result FDR and PDF files were saved. Measuring battery life with MobileMark 2012 Avoiding antivirus software conflicts MobileMark 2012 is not compatible with any virus-scanning software, so we uninstalled any such software present on the notebook PCs before we installed the benchmark. Avoiding pre-installed software conflicts MobileMark 2012 installs the following applications, which its test scripts employ: ABBYY FineReader Pro 11 Adobe Acrobat Pro X Adobe Flash Player 11 Adobe Photoshop CS5 Extended 12.04 Adobe Photoshop Elements 10 Adobe Premiere Pro CS 5.5 CyberLink PowerDVD Ultra 11 Microsoft Excel 2010 SP1 Microsoft Internet Explorer Microsoft Outlook 2010 SP1 Microsoft PowerPoint 2010 SP1 Microsoft Windows Media Player Performance and durability comparison: Dell Latitude 14 5000 Series vs. HP EliteBook 840 G1 A Principled Technologies test report 12 Microsoft Word 2010 SP1 Mozilla Firefox 10.0.2 WinZip Pro 16 If any of these applications are already on the system under test, they could cause problems with the benchmark due to software conflicts. To avoid any such issues, before we installed the benchmark, we uninstalled all conflicting pre-installed software applications, including different versions of any of the programs MobileMark 2012 uses. Adjusting display brightness and power settings The brightness of a notebook’s display affects its battery life. Therefore, BAPCo requires that, before you test with MobileMark 2012, you do the following step: make sure the brightness of the notebook’s monitor is greater than or equal to 150 nits on a completely white screen while the notebook is unplugged and running on battery power. The measurement follows the standards from the Video Electronics Standards Association (www.vesa.org). We complied with this standard for all the tests we ran by setting the notebook PC’s brightness as close to 150 nits as we could without going below that brightness level. We used the following procedure before we started each test. Note: This procedure assumes we began with the notebook plugged into the power supply. 1. To create a completely blank, white screen, open Microsoft Paint by clicking Start→All Programs→ Accessories→Paint. 2. Press Ctrl+W to open the Resize and Skew dialog. 3. Under Horizontal and Vertical enter 200, and click OK. 4. Click the View tab. 5. Click Full screen to view a white screen. 6. Wait 45 minutes to allow the screen to warm. 7. Unplug the notebook from the power supply, and measure the display’s brightness using a luminance meter in the center of the screen. (We used the Gossen Mavolux5032C.) 8. If the reading is below or significantly greater than 150 nits, use the notebook’s keyboard screen-brightnessadjustment keys to bring the display as close to 150 nits as possible, then retest. 9. Allow the notebook to run on battery power for 10 minutes, re-measure the display, and adjust the brightness up or down as necessary. 10. Verify that the notebook saved the brightness setting by plugging in the system, unplugging it, and taking another reading. Note: If the notebook did not save the brightness setting, use its power management application(s) to set the brightness appropriately, and save that setting. If saving the setting is ineffective, use the keyboard brightness setting keys to adjust the screen to bring the display as close to 150 nits as possible. Next, note how many times you pressed the button to achieve the desired brightness. After unplugging the system under test, use the keyboard to set the desired brightness by pressing the brightness button as many times as you previously noted to return the screen to the correct brightness level. Using the MobileMark built-in Configuration tool This tool supports three levels of configuration: 1. Only makes changes that are REQUIRED in order for the benchmark to run. 2. Additionally, makes changes that are RECOMMENDED for repeatable results. Performance and durability comparison: Dell Latitude 14 5000 Series vs. HP EliteBook 840 G1 A Principled Technologies test report 13 3. Additionally, makes OPTIONAL changes that help ensure best results. The Configuration tool makes the following configuration changes at each of the three levels: Level 1 - Required Disables User Account Control (UAC) Disables Windows Update Disables System Sleep and Hibernate Sets Screen Dimming Timeout (2 minutes) Disables Low Battery Actions Disables Network Proxies Disables Autorun for Optical Drive Level 2 - Recommended Creates BAPCo power scheme Sets Power Plan Type to balanced Disables Windows Firewall Disables Windows Sidebar/Gadgets Disables Windows Pop-ups Disables Incoming Remote Desktop Connections Disables Windows Error Reporting Disables Screen Saver and Monitor Timeout Sets CPU Adaptive Mode Disables Desktop Slideshow Disables Disk Defrag Level 3 - Optional Sets Hard Disk Timeout Disables Windows Defender Disables System Restore Ignores Laptop Lid Close Sets Maximum Display Brightness Disables Adaptive Brightness Because we are testing how well each system does out-of-box, we chose only the Required options in the Configuration tool. Installing MobileMark 2012 and configuring the system for testing 1. Verify that the wireless adapter is enabled and connected to a wireless router that is not connected to the Internet. 2. Locate the optical drive or attach an external drive to the notebook. 3. 4. 5. 6. 7. 8. Insert the MobileMark 2012 Install DVD into the drive. When the Autoplay menu appears, click Run MobileMark2012_Setup.exe. At the Welcome screen, click Next. Enter the serial number, and click Next. Accept the license agreement, and click Next. At the Choose Components screen, select Full, and click Next. Performance and durability comparison: Dell Latitude 14 5000 Series vs. HP EliteBook 840 G1 A Principled Technologies test report 14 9. At the Choose Install Location screen, accept the default location of C:\Program Files (x86)\BAPCo\MobileMark2012, and click Next. 10. At the Choose Start Menu Folder screen, click Install. 11. Insert Disc 2 when prompted. 12. At the InstallShield Wizard Complete screen, click Finish. 13. Launch MobileMark 2012. 14. Click Configuration and choose only the Required options. 15. Click Apply, and restart the computer when prompted. 16. Adjust the screen brightness to no less than 150 nits: a. Click the Windows Start button, and type power options in the Windows Start Search box. b. Click Change plan settings. c. Click Change advanced power settings. d. Expand the Display option, and change the Display brightness on battery and plugged in to the correct percentage that produces no less than 150 nits. Note: If you are unable to save these settings, please see the Displaying Brightness section above. Conditioning the battery 1. 2. 3. 4. 5. 6. 7. 8. 9. Plug the AC power adapter into the notebook PC, and completely charge the battery. Install MobileMark 2012, following the steps we outlined in the Installing MobileMark 2012 section. Double-click the MobileMark 2012 icon on the desktop. Click the Office Productivity icon. Type System Conditioning as the name for this test in the Project Name, check the box next to conditioning, and click Continue. If MobileMark 2012 lists no problems or warnings, click Continue. If it does list any problems or warnings, close MobileMark 2012, and correct the problem(s) before proceeding. When prompted, unplug the AC power adapter. The Office Productivity test begins immediately. The test is complete when the notebook PC has fully depleted its battery and is no longer operational when running on battery power. Plug the AC power adapter into the notebook PC, and completely charge the battery. Measuring battery life with MobileMark 2012 We performed the following steps to run the MobileMark 2012 Office Productivity benchmark: 1. Double-click the MobileMark 2012 icon on the desktop. 2. Select the Office Productivity test by clicking the Office Productivity icon. 3. Enter a name for this test in the Project Name field, and click Continue. 4. If MobileMark 2012 lists no problems or warnings, click Continue. If it does list any problems or warnings, close MobileMark 2012, and correct the problem(s) before proceeding. 5. When prompted, unplug the AC power adapter. The test begins immediately. 6. The Office Productivity test is complete when the notebook PC has fully depleted its battery and is no longer operational when running on battery power. We executed the MobileMark 2012 Office Productivity test three times on the system and took the median battery life run as the representative score for that test. Performance and durability comparison: Dell Latitude 14 5000 Series vs. HP EliteBook 840 G1 A Principled Technologies test report 15 Getting the MobileMark 2012 results After each MobileMark 2012 Office Productivity test completed, we plugged the AC power adapter into the notebook PC and turned on the system. MobileMark 2012 started automatically after the system booted, then analyzed the test scores and opened the Test Results Viewer with the results from the last test. To submit these results to BAPCo, we saved the test results by performing the following steps: 1. 2. 3. 4. Click Save. Enter a name and select FDR to save the results as an FDR file. Click Save again, and select PDF to save the results as a PDF file. Browse to the Documents directory where the result FDR and PDF files were saved. Measuring graphics performance with 3DMark Advanced Installing 3DMark 1. Purchase 3DMark Advanced Edition from www.futuremark.com/store, and download the 3DMark_v110_installer.exe Windows package. 2. Install 3DMark by double-clicking the 3DMark_v110_installer.exe file; leave the default options set. 3. At the Choose Setup Language screen, choose English, and click Next. 4. At the Welcome screen, click Next. 5. At the License Agreement screen, click I accept the terms of the license agreement, and click Next. 6. At the Setup Type screen, click Complete, and click Next. 7. At the Ready to Install the Program screen, click Install. 8. When the 3DMark Read Me page appears in your Web browser, review the document, and click Close when you are finished. 9. At the Setup Complete screen, click Finish to restart the computer. 10. Download and install the 3DMark patch 3DMark-v1-2-250. 11. Launch 3DMark Advanced by double-clicking on the 3DMark desktop icon. Enter the registration code, and click Register. 12. Exit 3DMark Advanced. Running 3DMark Advanced 1. Boot the system and open an administrative command prompt: a. Click the Windows Start button. b. Type cmd and right-click cmd.exe. c. Select Run as administrator. 2. Type Cmd.exe /c start /wait Rundll32.exe advapi32.dll,ProcessIdleTasks 3. Do not interact with the system until the command completes. 4. After the command completes, wait 5 minutes before running the test. 5. Double-click the 3DMark desktop icon to launch the benchmark. 6. In the 3DMark Main section, click the Performance option under Preset, and select Benchmark tests only. 7. Click Run 3DMark. 8. When the benchmark run completes, take a screenshot of the results, and record them as follows: 3DMark Score Graphics Score Performance and durability comparison: Dell Latitude 14 5000 Series vs. HP EliteBook 840 G1 A Principled Technologies test report 16 Physics Score Graphics Test 1 Graphics Test 2 Physics Test 9. Shut down the system. 10. Repeat steps 1 through 9 four more times, and report the median of the last three runs. Measuring durability This test measures the damage that the impact from a drop of 29 inches inflicts upon an open notebook running PassMark® BurnIn Test v7.1 Professional. Setting up PassMark BurnIn Test v7.1 Professional 1. Download PassMark BurnIn Test v7.1 Pro from www.passmark.com/download/bit_download.htm. 2. Install BurnIn Test: a. Double-click the BurnIn Test bitpro_x64.exe file. b. In the Setup – BurnIn Test window, click Next. c. Accept the agreement, and click Next. d. Leave the default destination location, and click Next. e. Leave the default folder name, and click Next. f. Click Install. g. At the Completing the BurnIn Test Setup Wizard screen, click Finish. h. When the BurnIn Test by PassMark Software screen opens, enter the username and key, and click Continue. 3. Configure BurnIn Test: a. Click Configuration, and select Test Selection and Duty Cycles. b. In the Test selection and duty cycles screen, set the CPU, 2D Graphics, 3D Graphics and Disk(s) fields to 25%. c. Deselect all other tests that may be selected by default. d. Click OK. e. Click Configuration, and select Test Preferences. f. Click the Disk tab, and check the Automatically select all hard drives at the start of testing box. g. Click the Pre-Test tab, and select the None (start immediately) radio button. h. Click OK. Running PassMark BurnIn Test v7.1 Professional 1. Launch PassMark BurnIn Test v7.1 Pro by double-clicking the BurnIn Test icon on the Desktop. 2. Start the test by clicking the green triangle. Conducting the drop test We used a Lansmont PDT56ED Precision Drop Tester, with a landing area covered by commercial carpet. We opened the notebook so that the screen and keyboard formed a 120-degree angle, and then placed the notebook flat on the platen. Orienting the notebook in this way resulted in a flat drop. (Figure 8 shows our test setup.) To allow us to scan the notebooks identically, we booted to a Hiren’s BootCD and installed the hard disk scanning software to the Microsoft Windows 7 virtual machine’s RAM disk. Running the scanning software from RAM, we scanned the hard disk with HD Tune Pro 5.00 and HDDScan for Windows 3.3, and recorded the number of bad sectors and blocks before and after the drop test. We also recorded any other physical defects, such as cracks or breaks Performance and durability comparison: Dell Latitude 14 5000 Series vs. HP EliteBook 840 G1 A Principled Technologies test report 17 in the display, as well as separated hinges or displaced screws, which the impact of the drop caused. We took still photographs of the notebooks before and after each drop. We dropped each notebook once, using this process: 1. Install PassMark BurnIn Test v7.1 Pro onto the test notebook, as outlined above. 2. Run HD Tune Pro 5.00 and HDDScan 3.3 to get baseline data on the state of the hard disk. Boot the system using a Hiren’s BootCD. a. Install HD Tune Pro 5.00: i. Insert a USB flash drive containing the HD Tune Pro installation executable, and click once on My Computer. ii. Navigate to the USB drive, and double-click the hdtunepro_500_trial.exe installation file to install the application. iii. At the welcome screen, click Next. iv. Click the I accept the agreement radio button, and click Next. v. In the Select Destination Location window, click Browse. Figure 8: Our physical durability test setup. vi. Click the RAMDisk drive once to select it, and click OK. vii. Click Next in the next two windows. viii. Leave check box empty for Create a desktop icon, and click Next. ix. Click Install. x. Leave the check box checked for Launch HD Tune Pro, and click Finish. b. Run the HD Tune Pro 5.00 Error Scan: i. Select the Error Scan tab. ii. Click Start in the right hand pane. Note: The Error Scan is complete when the Start button changes from grey to black. c. Save the Error Scan Results. d. Click the Copy information to clipboard button on the upper right hand menu bar (it is the first button on the left): i. Open a new text file by clicking StartRun, typing notepad, and clicking OK. ii. In the Notepad window, click EditPaste. iii. Click FileSave As, enter an appropriate filename using a .txt extension, and choose the location to save the file (we saved ours to a USB flash drive). Click Save. e. Close the HD Tune Pro 5.00 Hard Disk Utility. f. Scan the notebook’s hard drive with HDDScan for Windows version 3.3: i. Open the HDDScan folder, and double-click the HDDScan.exe executable file to run the application. ii. Click TasksSurface Tests to open the Test Selection window. Performance and durability comparison: Dell Latitude 14 5000 Series vs. HP EliteBook 840 G1 A Principled Technologies test report 18 iii. iv. 3. 4. 5. 6. 7. 8. 9. 10. 11. 12. Select Verify from the list of tests, and click Add Test. At the conclusion of the run, double-click the VR-Verify test id in the Test Manager window to open up the results. v. Select the Report tab, and copy and paste the test results into Notepad. vi. Save the results as a text file. Set the height of the platen on the Lansmont Precision Drop Tester to 29 inches above the surface of the 28-ounce commercial carpeting. Place the fully-charged notebook onto the platen of the drop tester, with the notebook’s base flat on the platen and the screen facing forward, open at a 120-degree angle. Launch PassMark BurnIn Test. Unplug the notebook, and drop the notebook onto the commercial carpeting. Wait until the notebook is completely still. If the battery or any other components come off the system, inspect them for damage, and reinstall them if possible. Take digital pictures of the notebook from all angles after completing the checklist. Stop PassMark BurnIn Test. Reconnect the notebook’s AC adapter. Run HD Tune Pro 5.00 and HDD Scan 3.3 using the process in Step 2, and record the results as the notebook’s posttest disk status. Performance and durability comparison: Dell Latitude 14 5000 Series vs. HP EliteBook 840 G1 A Principled Technologies test report 19 ABOUT PRINCIPLED TECHNOLOGIES Principled Technologies, Inc. 1007 Slater Road, Suite 300 Durham, NC, 27703 www.principledtechnologies.com We provide industry-leading technology assessment and fact-based marketing services. We bring to every assignment extensive experience with and expertise in all aspects of technology testing and analysis, from researching new technologies, to developing new methodologies, to testing with existing and new tools. When the assessment is complete, we know how to present the results to a broad range of target audiences. We provide our clients with the materials they need, from market-focused data to use in their own collateral to custom sales aids, such as test reports, performance assessments, and white papers. Every document reflects the results of our trusted independent analysis. We provide customized services that focus on our clients’ individual requirements. Whether the technology involves hardware, software, Web sites, or services, we offer the experience, expertise, and tools to help our clients assess how it will fare against its competition, its performance, its market readiness, and its quality and reliability. Our founders, Mark L. Van Name and Bill Catchings, have worked together in technology assessment for over 20 years. As journalists, they published over a thousand articles on a wide array of technology subjects. They created and led the Ziff-Davis Benchmark Operation, which developed such industry-standard benchmarks as Ziff Davis Media’s Winstone and WebBench. They founded and led eTesting Labs, and after the acquisition of that company by Lionbridge Technologies were the head and CTO of VeriTest. Principled Technologies is a registered trademark of Principled Technologies, Inc. All other product names are the trademarks of their respective owners. Disclaimer of Warranties; Limitation of Liability: PRINCIPLED TECHNOLOGIES, INC. HAS MADE REASONABLE EFFORTS TO ENSURE THE ACCURACY AND VALIDITY OF ITS TESTING, HOWEVER, PRINCIPLED TECHNOLOGIES, INC. SPECIFICALLY DISCLAIMS ANY WARRANTY, EXPRESSED OR IMPLIED, RELATING TO THE TEST RESULTS AND ANALYSIS, THEIR ACCURACY, COMPLETENESS OR QUALITY, INCLUDING ANY IMPLIED WARRANTY OF FITNESS FOR ANY PARTICULAR PURPOSE. ALL PERSONS OR ENTITIES RELYING ON THE RESULTS OF ANY TESTING DO SO AT THEIR OWN RISK, AND AGREE THAT PRINCIPLED TECHNOLOGIES, INC., ITS EMPLOYEES AND ITS SUBCONTRACTORS SHALL HAVE NO LIABILITY WHATSOEVER FROM ANY CLAIM OF LOSS OR DAMAGE ON ACCOUNT OF ANY ALLEGED ERROR OR DEFECT IN ANY TESTING PROCEDURE OR RESULT. IN NO EVENT SHALL PRINCIPLED TECHNOLOGIES, INC. BE LIABLE FOR INDIRECT, SPECIAL, INCIDENTAL, OR CONSEQUENTIAL DAMAGES IN CONNECTION WITH ITS TESTING, EVEN IF ADVISED OF THE POSSIBILITY OF SUCH DAMAGES. IN NO EVENT SHALL PRINCIPLED TECHNOLOGIES, INC.’S LIABILITY, INCLUDING FOR DIRECT DAMAGES, EXCEED THE AMOUNTS PAID IN CONNECTION WITH PRINCIPLED TECHNOLOGIES, INC.’S TESTING. CUSTOMER’S SOLE AND EXCLUSIVE REMEDIES ARE AS SET FORTH HEREIN. Performance and durability comparison: Dell Latitude 14 5000 Series vs. HP EliteBook 840 G1 A Principled Technologies test report 20