1
Enterprise PeopleTools 8.49
PeopleBook: PeopleSoft Analytic
Calculation Engine
March 2007
Enterprise PeopleTools 8.49 PeopleBook: PeopleSoft Analytic Calculation Engine
SKU PT849ACE-B 0307
Copyright © 1988-2007, Oracle. All rights reserved.
The Programs (which include both the software and documentation) contain proprietary information; they are
provided under a license agreement containing restrictions on use and disclosure and are also protected by copyright,
patent, and other intellectual and industrial property laws. Reverse engineering, disassembly, or decompilation of the
Programs, except to the extent required to obtain interoperability with other independently created software or as
specified by law, is prohibited.
The information contained in this document is subject to change without notice. If you find any problems in the
documentation, please report them to us in writing. This document is not warranted to be error-free. Except as may
be expressly permitted in your license agreement for these Programs, no part of these Programs may be reproduced or
transmitted in any form or by any means, electronic or mechanical, for any purpose.
If the Programs are delivered to the United States Government or anyone licensing or using the Programs on behalf of
the United States Government, the following notice is applicable:
U.S. GOVERNMENT RIGHTS
Programs, software, databases, and related documentation and technical data delivered to U.S. Government
customers are “commercial computer software” or “commercial technical data” pursuant to the applicable Federal
Acquisition Regulation and agency-specific supplemental regulations. As such, use, duplication, disclosure,
modification, and adaptation of the Programs, including documentation and technical data, shall be subject to
the licensing restrictions set forth in the applicable Oracle license agreement, and, to the extent applicable, the
additional rights set forth in FAR 52.227-19, Commercial Computer Software--Restricted Rights (June 1987).
Oracle Corporation, 500 Oracle Parkway, Redwood City, CA 94065.
The Programs are not intended for use in any nuclear, aviation, mass transit, medical, or other inherently dangerous
applications. It shall be the licensee’s responsibility to take all appropriate fail-safe, backup, redundancy and other
measures to ensure the safe use of such applications if the Programs are used for such purposes, and we disclaim
liability for any damages caused by such use of the Programs.
The Programs may provide links to Web sites and access to content, products, and services from third parties.
Oracle is not responsible for the availability of, or any content provided on, third-party Web sites. You bear all risks
associated with the use of such content. If you choose to purchase any products or services from a third party, the
relationship is directly between you and the third party. Oracle is not responsible for: (a) the quality of third-party
products or services; or (b) fulfilling any of the terms of the agreement with the third party, including delivery of
products or services and warranty obligations related to purchased products or services. Oracle is not responsible for
any loss or damage of any sort that you may incur from dealing with any third party.
Oracle, JD Edwards, PeopleSoft, and Siebel are registered trademarks of Oracle Corporation and/or its affiliates.
Other names may be trademarks of their respective owners.
Open Source Disclosure
Oracle takes no responsibility for its use or distribution of any open source or shareware software or documentation
and disclaims any and all liability or damages resulting from use of said software or documentation. The following
open source software may be used in Oracle’s PeopleSoft products and the following disclaimers are provided.
Apache Software Foundation
This product includes software developed by the Apache Software Foundation (http://www.apache.org/). Copyright
© 2000-2003. The Apache Software Foundation. All rights reserved. Licensed under the Apache License, Version
2.0 (the “License”); you may not use this file except in compliance with the License. You may obtain a copy of the
License at http://www.apache.org/licenses/LICENSE-2.0.
Unless required by applicable law or agreed to in writing, software distributed under the License is distributed on an
“AS IS” BASIS, WITHOUT WARRANTIES OR CONDITIONS OF ANY KIND, either express or implied. See the
License for the specific language governing permissions and limitations under the License.
OpenSSL
Copyright © 1998-2005 The OpenSSL Project. All rights reserved.
This product includes software developed by the OpenSSL Project for use in the OpenSSL Toolkit
(http://www.openssl.org/).
THIS SOFTWARE IS PROVIDED BY THE OpenSSL PROJECT “AS IS” AND ANY EXPRESSED OR
IMPLIED WARRANTIES, INCLUDING, BUT NOT LIMITED TO, THE IMPLIED WARRANTIES OF
MERCHANTABILITY AND FITNESS FOR A PARTICULAR PURPOSE ARE DISCLAIMED. IN NO EVENT
SHALL THE OpenSSL PROJECT OR ITS CONTRIBUTORS BE LIABLE FOR ANY DIRECT, INDIRECT,
INCIDENTAL, SPECIAL, EXEMPLARY, OR CONSEQUENTIAL DAMAGES (INCLUDING, BUT NOT
LIMITED TO, PROCUREMENT OF SUBSTITUTE GOODS OR SERVICES; LOSS OF USE, DATA, OR
PROFITS; OR BUSINESS INTERRUPTION) HOWEVER CAUSED AND ON ANY THEORY OF LIABILITY,
WHETHER IN CONTRACT, STRICT LIABILITY, OR TORT (INCLUDING NEGLIGENCE OR OTHERWISE)
ARISING IN ANY WAY OUT OF THE USE OF THIS SOFTWARE, EVEN IF ADVISED OF THE POSSIBILITY
OF SUCH DAMAGE.
Loki Library
Copyright © 2001 by Andrei Alexandrescu. This code accompanies the book: Alexandrescu, Andrei. “Modern C++
Design: Generic Programming and Design Patterns Applied”. Copyright © 2001 Addison-Wesley. Permission to
use, copy, modify, distribute and sell this software for any purpose is hereby granted without fee, provided that the
above copyright notice appear in all copies and that both that copyright notice and this permission notice appear in
supporting documentation.
Helma Project
Copyright © 1999-2004 Helma Project. All rights reserved. THIS SOFTWARE IS PROVIDED “AS IS”
AND ANY EXPRESSED OR IMPLIED WARRANTIES, INCLUDING, BUT NOT LIMITED TO, THE
IMPLIED WARRANTIES OF MERCHANTABILITY AND FITNESS FOR A PARTICULAR PURPOSE ARE
DISCLAIMED. IN NO EVENT SHALL THE HELMA PROJECT OR ITS CONTRIBUTORS BE LIABLE FOR
ANY DIRECT, INDIRECT, INCIDENTAL, SPECIAL, EXEMPLARY, OR CONSEQUENTIAL DAMAGES
(INCLUDING, BUT NOT LIMITED TO, PROCUREMENT OF SUBSTITUTE GOODS OR SERVICES;
LOSS OF USE, DATA, OR PROFITS; OR BUSINESS INTERRUPTION) HOWEVER CAUSED AND ON
ANY THEORY OF LIABILITY, WHETHER IN CONTRACT, STRICT LIABILITY, OR TORT (INCLUDING
NEGLIGENCE OR OTHERWISE) ARISING IN ANY WAY OUT OF THE USE OF THIS SOFTWARE, EVEN IF
ADVISED OF THE POSSIBILITY OF SUCH DAMAGE.
Helma includes third party software released under different specific license terms. See the licenses directory in the
Helma distribution for a list of these license.
Sarissa
Copyright © 2004 Manos Batsis.
This library is free software; you can redistribute it and/or modify it under the terms of the GNU Lesser General
Public License as published by the Free Software Foundation; either version 2.1 of the License, or (at your option)
any later version.
This library is distributed in the hope that it will be useful, but WITHOUT ANY WARRANTY; without even the
implied warranty of MERCHANTABILITY or FITNESS FOR A PARTICULAR PURPOSE. See the GNU Lesser
General Public License for more details.
You should have received a copy of the GNU Lesser General Public License along with this library; if not, write to
the Free Software Foundation, Inc., 59 Temple Place, Suite 330, Boston, MA 02111-1307 USA.
ICU
ICU License - ICU 1.8.1 and later COPYRIGHT AND PERMISSION NOTICE Copyright © 1995-2003
International Business Machines Corporation and others. All rights reserved.
Permission is hereby granted, free of charge, to any person obtaining a copy of this software and associated
documentation files (the “Software”), to deal in the Software without restriction, including without limitation the
rights to use, copy, modify, merge, publish, distribute, and/or sell copies of the Software, and to permit persons
to whom the Software is furnished to do so, provided that the above copyright notice(s) and this permission
notice appear in all copies of the Software and that both the above copyright notice(s) and this permission notice
appear in supporting documentation. THE SOFTWARE IS PROVIDED “AS IS,” WITHOUT WARRANTY
OF ANY KIND, EXPRESS OR IMPLIED, INCLUDING BUT NOT LIMITED TO THE WARRANTIES OF
MERCHANTABILITY, FITNESS FOR A PARTICULAR PURPOSE AND NONINFRINGEMENT OF THIRD
PARTY RIGHTS. IN NO EVENT SHALL THE COPYRIGHT HOLDER OR HOLDERS INCLUDED IN THIS
NOTICE BE LIABLE FOR ANY CLAIM, OR ANY SPECIAL INDIRECT OR CONSEQUENTIAL DAMAGES,
OR ANY DAMAGES WHATSOEVER RESULTING FROM LOSS OF USE, DATA OR PROFITS, WHETHER IN
AN ACTION OF CONTRACT, NEGLIGENCE OR OTHER TORTIOUS ACTION, ARISING OUT OF OR IN
CONNECTION WITH THE USE OR PERFORMANCE OF THIS SOFTWARE. Except as contained in this notice,
the name of a copyright holder shall not be used in advertising or otherwise to promote the sale, use or other dealings
in this Software without prior written authorization of the copyright holder.
All trademarks and registered trademarks mentioned herein are the property of their respective owners.
Sun’s JAXB Implementation – JDSDK 1.5 relaxngDatatype.jar 1.0 License
Copyright © 2001, Thai Open Source Software Center Ltd, Sun Microsystems. All rights reserved.
THIS SOFTWARE IS PROVIDED BY THE COPYRIGHT HOLDERS AND CONTRIBUTORS “AS
IS” AND ANY EXPRESS OR IMPLIED WARRANTIES, INCLUDING, BUT NOT LIMITED TO, THE
IMPLIED WARRANTIES OF MERCHANTABILITY AND FITNESS FOR A PARTICULAR PURPOSE
ARE DISCLAIMED. IN NO EVENT SHALL THE REGENTS OR CONTRIBUTORS BE LIABLE FOR
ANY DIRECT, INDIRECT, INCIDENTAL, SPECIAL, EXEMPLARY, OR CONSEQUENTIAL DAMAGES
(INCLUDING, BUT NOT LIMITED TO, PROCUREMENT OF SUBSTITUTE GOODS OR SERVICES;
LOSS OF USE, DATA, OR PROFITS; OR BUSINESS INTERRUPTION) HOWEVER CAUSED AND ON
ANY THEORY OF LIABILITY, WHETHER IN CONTRACT, STRICT LIABILITY, OR TORT (INCLUDING
NEGLIGENCE OR OTHERWISE) ARISING IN ANY WAY OUT OF THE USE OF THIS SOFTWARE, EVEN IF
ADVISED OF THE POSSIBILITY OF SUCH DAMAGE.
W3C IPR SOFTWARE NOTICE
Copyright © 2000 World Wide Web Consortium, (Massachusetts Institute of Technology, Institut National de
Recherche en Informatique et en Automatique, Keio University). All Rights Reserved.
Note: The original version of the W3C Software Copyright Notice and License could be found at
http://www.w3.org/Consortium/Legal/copyright-software-19980720.
THIS SOFTWARE AND DOCUMENTATION IS PROVIDED “AS IS,” AND COPYRIGHT HOLDERS MAKE
NO REPRESENTATIONS OR WARRANTIES, EXPRESS OR IMPLIED, INCLUDING BUT NOT LIMITED TO,
WARRANTIES OF MERCHANTABILITY OR FITNESS FOR ANY PARTICULAR PURPOSE OR THAT THE
USE OF THE SOFTWARE OR DOCUMENTATION WILL NOT INFRINGE ANY THIRD PARTY PATENTS,
COPYRIGHTS, TRADEMARKS OR OTHER RIGHTS. COPYRIGHT HOLDERS WILL NOT BE LIABLE FOR
ANY DIRECT, INDIRECT, SPECIAL OR CONSEQUENTIAL DAMAGES ARISING OUT OF ANY USE OF
THE SOFTWARE OR DOCUMENTATION.
Contents
General Preface
About This PeopleBook ............................................................................. . . . . . . . .xv
PeopleSoft Enterprise Application Prerequisites... ........................................................ . . . . . . . .xv
Application Fundamentals..................................................................................... . . . . . . . .xv
Documentation Updates and Printed Documentation..................................................... ........xvi
Obtaining Documentation Updates...............................................................................xvi
Downloading and Ordering Printed Documentation............................................................xvi
Additional Resources.......................................................................................... . . . . . . .xvii
Typographical Conventions and Visual Cues............................................................... .......xviii
Typographical Conventions......................................................................................xviii
Visual Cues..........................................................................................................xix
Country, Region, and Industry Identifiers........................................................................xix
Currency Codes.............................................................................................. . . . . . . .xx
Comments and Suggestions.................................................................................. . . . . . . . .xx
Common Elements Used in PeopleBooks.................................................................. . . . . . . . .xx
Preface
PeopleSoft Analytic Calculation Engine Preface.............................................. . .. . . .xxiii
PeopleSoft Analytic Calculation Engine..................................................................... .......xxiii
Common Elements Used in This PeopleBook.............................................................. .......xxiii
Part 1
Getting Started with PeopleSoft Analytic Calculation Engine
Chapter 1
Getting Started with PeopleSoft Analytic Calculation Engine.............................. ..........3
PeopleSoft Analytic Calculation Engine Overview......................................................... ..........3
PeopleSoft Analytic Calculation Engine Implementation.................................................. ..........3
Part 2
Designing and Editing Analytic Models
Copyright © 1988-2007, Oracle. All rights reserved.
v
Contents
Chapter 2
Understanding PeopleSoft Analytic Calculation Engine..................................... ..........7
PeopleSoft Analytic Calculation Engine Components..................................................... ..........7
PeopleSoft Analytic Calculation Engine Architecture.. .................................................... . . . . . . . .10
PeopleSoft Analytic Calculation Engine Development Process. ......................................... . . . . . . . .11
Development Process Without Existing Record Structures........................................... . . . . . . . .11
Development Process Using Existing Record Structures.............................................. . . . . . . .12
PeopleSoft Analytic Calculation Engine Security........................................................... . . . . . . . .12
Chapter 3
Understanding Analytic Models................................................................... . . . . . . . .15
Analytic Models................................................................................................. . . . . . . . .15
Relationship of Parts........................................................................................... . . . . . . . .15
Data Cubes and Dimensions............................................................................... . . . . . . .16
Formulas and User Functions.............................................................................. . . . . . . .19
Cube Collections............................................................................................. . . . . . . .20
Organizers.................................................................................................... . . . . . . .20
Tools.............................................................................................................. . . . . . . . .20
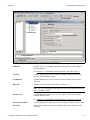
PeopleSoft Application Designer Window Components for Creating Analytic Model Definitions. . . . . . . . .20
Behavior of Bars............................................................................................. . . . . . . .22
Menu Bar..................................................................................................... . . . . . . .22
Part Browser................................................................................................. . . . . . . .25
Chapter 4
Creating Analytic Model Definitions.............................................................. . . . . . . . .27
Understanding the Analytic Model Definition Creation Process.......................................... . . . . . . . .27
Understanding Conventions for Naming Analytic Models and Parts. .... ... ... ... .... ... ... ... .... ... .. . . . . . . . .28
Creating a New Analytic Model Definition................................................................... . . . . . . . .29
Opening an Analytic Model Definition........................................................................ . . . . . . . .29
Creating Organizers............................................................................................ . . . . . . . .29
Entering Notes for an Analytic Model Definition’s Parts................................................... . . . . . . . .30
Finding Parts.................................................................................................... . . . . . . . .30
Validating Analytic Models..................................................................................... . . . . . . . .30
Chapter 5
Creating Data Cubes................................................................................. . . . . . . . .31
Understanding Data Cubes. .................................................................................. . . . . . . . .31
vi
Copyright © 1988-2007, Oracle. All rights reserved.
Contents
Definition of a Data Cube................................................................................... . . . . . . .31
Input Data Cubes............................................................................................ . . . . . . .32
Calculation Data Cubes..................................................................................... . . . . . . .33
Association Data Cubes.................................................................................... . . . . . . .33
Virtual Data Cubes.......................................................................................... . . . . . . .35
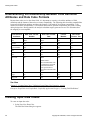
Understanding the Relationship Between Field Definition Attributes and Data Cube Formats. . . . . . . . . . . . . .38
Creating Input Data Cubes.................................................................................... . . . . . . . .38
Creating Calculation Data Cubes............................................................................ . . . . . . . .39
Creating Association Data Cubes. ........................................................................... . . . . . . . .39
Creating Virtual Data Cubes.................................................................................. . . . . . . . .40
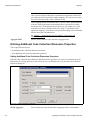
Defining Data Cube Properties............................................................................... . . . . . . . .40
Defining General Data Cube Properties.................................................................. . . . . . . .40
Selecting Aggregate Functions for Attached Dimensions. ............................................. . . . . . . .42
Auditing Data Cubes at Design Time.. ...................................................................... . . . . . . . .43
Understanding Causes and Inputs........................................................................ . . . . . . .44
Understanding Effects...................................................................................... . . . . . . .44
Displaying Causes and Inputs............................................................................. . . . . . . .45
Displaying Effects............................................................................................ . . . . . . .45
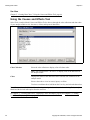
Using the Causes and Effects Tool........................................................................ . . . . . . .46
Chapter 6
Creating Dimensions................................................................................. . . . . . . . .47
Understanding Dimensions................................................................................... . . . . . . . .47
Creating a New Dimension.................................................................................... . . . . . . . .48
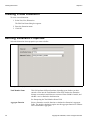
Defining Dimension Properties............................................................................... . . . . . . . .48
Attaching a Dimension to a Data Cube...................................................................... . . . . . . . .50
Changing the Order of Dimensions in the Part Browser.................................................. . . . . . . . .51
Chapter 7
Creating Cube Collections.......................................................................... . . . . . . . .53
Understanding Cube Collections............................................................................. . . . . . . . .53
Types of Cube Collections.................................................................................... . . . . . . . .54
Read/Write Cube Collections.............................................................................. . . . . . . .54
Intermediate/Calculation Cube Collections............................................................... . . . . . . .55
Presentation Cube Collections............................................................................. . . . . . . .56
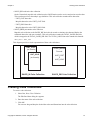
Example: Creating Two Cube Collections................................................................ . . . . . . .56
Creating Cube Collections.................................................................................... . . . . . . . .57
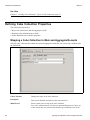
Defining Cube Collection Properties......................................................................... . . . . . . . .58
Copyright © 1988-2007, Oracle. All rights reserved.
vii
Contents
Mapping a Cube Collection to Main and Aggregate Records.......................................... . . . . . . .58
Mapping Data Cubes and Dimensions to Fields........................................................ . . . . . . .59
Defining Additional Cube Collection Dimension Properties............................................ . . . . . . .60
Chapter 8
Creating Explicit Dimension Sets................................................................. . . . . . . . .63
Understanding Explicit Dimension Sets..................................................................... . . . . . . . .63
Understanding Implicit Tuples and Explicit Tuples......................................................... . . . . . . . .66
Defining Explicit Dimension Sets............................................................................. . . . . . . . .67
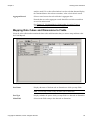
Viewing Explicit Dimension Set Properties............................................................... . . . . . . .67
Editing or Adding New Explicit Dimension Sets......................................................... . . . . . . .68
Chapter 9
Creating Hierarchies................................................................................. . . . . . . . .71
Understanding the Relationship of PeopleSoft Trees to Analytic Models.. ............................. . . . . . . . .71
Purpose of PeopleSoft Trees and Analytic Model Hierarchies....................................... . . . . . . . .71
PeopleCode Usage with PeopleSoft Trees and Analytic Models. ... ... ... ... ... ... ... ... ... ... ... .. . . . . . . . .72
Understanding BAM Model Total Members... .............................................................. . . . . . . . .73
Understanding Dimension Members......................................................................... . . . . . . . .73
Types of Dimension Members............................................................................. . . . . . . .73
Purpose of Node Levels in Creating Hierarchies........................................................ . . . . . . .76
Creation of New Members at Runtime.................................................................... . . . . . . .78
Understanding the Calculation of Aggregate Data......................................................... . . . . . . . .78
Dimension Order Impact on Calculation.................................................................. . . . . . . .78
Logic for Determining the Order of Members............................................................ . . . . . . .78
Understanding the Persistence of Aggregate Data........................................................ . . . . . . . .79
Persistence of Aggregate and Detail Data............................................................... . . . . . . .79
Aggregate Record Properties. ............................................................................. . . . . . . .80
Pushed Down Data.......................................................................................... . . . . . . .80
Data Type Considerations.................................................................................. . . . . . . .81
Working with Overrides........................................................................................ . . . . . . . .81
Understanding Default Aggregation....................................................................... . . . . . . .81
Understanding Override Order of Precedence.......................................................... . . . . . . .82
Understanding the PSACETREEOVRD Subrecord..................................................... . . . . . . .84
Example: Using Default Aggregation..................................................................... . . . . . . .84
Example: Creating Overrides.............................................................................. . . . . . . .91
Example: Creating a Hierarchy with Mixed Aggregate and Detail Members.. ... .. ... .. .. ... .. .. .........109
viii
Copyright © 1988-2007, Oracle. All rights reserved.
Contents
Chapter 10
Creating Rules, Formulas, and User Functions................................................ . . . . . . .111
Understanding Rules, Formulas, and User Functions... .................................................. . . . . . . .111
Common Elements Used in This Chapter................................................................ . . . . . .111
Rules, Formulas, and User Functions..........................................................................112
Filter User Functions..............................................................................................113
Rule Bar Display...................................................................................................114
Understanding Rule Error Messages.. ...................................................................... .......114
Defining and Editing Data Cube Formulas.................................................................. .......119
Defining and Editing User Functions......................................................................... .......119
Working with the Elements of Rules......................................................................... .......120
Understanding the Elements of Rules..........................................................................120
Inserting a Built-in Function into a Rule.........................................................................128
Inserting a User Function into a Rule...........................................................................128
Inserting a Numeric Value or Text Value into a Rule..........................................................128
Inserting a Data Cube Reference into a Rule..................................................................129
Inserting a Dimension Reference into a Rule..................................................................129
Inserting a Dimension Member Reference into a Rule.......................................................129
Inserting a Blank Line into a Rule...............................................................................130
Inserting a Comment into a Rule................................................................................130
Performing Exceptions to the Rule........................................................................... .......130
Understanding Exceptions to the Rule..........................................................................131
Create Different Calculations for Different Members..........................................................131
Creating Different Calculations for Different Groups of Members... ........................................133
Working with Circular Formulas and Circular Systems.................................................... .......134
Understanding Circular Formulas...............................................................................134
Understanding Circular Systems and Recursive Systems...................................................135
Understanding Recursive System Resolution.................................................................135
Understanding Circular System Resolution. ...................................................................135
Changing Circular Formula and Circular System Options....... ......... ......... ......... ......... ........136
Chapter 11
Using Built-in Functions in Analytic Models................................................... .......139
Built-in Function Reference................................................................................... .......139
ABS..................................................................................................................139
ACOS...............................................................................................................139
ARGUMENTS Declaration.......................................................................................140
ASC..................................................................................................................140
ASIN.................................................................................................................141
Copyright © 1988-2007, Oracle. All rights reserved.
ix
Contents
AT....................................................................................................................141
ATAN................................................................................................................143
BREAK..............................................................................................................143
CASE................................................................................................................144
CHANGE............................................................................................................144
CHILDCOUNT.....................................................................................................145
CHR.................................................................................................................145
CONSOL............................................................................................................146
COS.................................................................................................................146
CUBEID.............................................................................................................147
CUMAVG...........................................................................................................147
CUMSUM...........................................................................................................148
DAVG................................................................................................................148
DAY..................................................................................................................149
DCOUNT............................................................................................................150
DDB.................................................................................................................150
DEC.................................................................................................................151
DLOOKUP..........................................................................................................152
DMAX...............................................................................................................152
DMIN................................................................................................................153
DSUM...............................................................................................................154
E.....................................................................................................................154
FIND.................................................................................................................155
FIRST...............................................................................................................155
FOR.................................................................................................................156
FORCHILDREN....................................................................................................156
FORMEMBERS....................................................................................................157
FV....................................................................................................................158
GROUPAVG........................................................................................................159
GROUPBY..........................................................................................................160
GROUPMAX.......................................................................................................160
GROUPMIN........................................................................................................161
GROUPSUM.......................................................................................................162
GROW..............................................................................................................163
IF.....................................................................................................................164
INC..................................................................................................................164
INCDATE...........................................................................................................165
INPUT...............................................................................................................165
INSUBTREE........................................................................................................166
ISINPUT............................................................................................................166
x
Copyright © 1988-2007, Oracle. All rights reserved.
Contents
INTERCEPT........................................................................................................167
IRR..................................................................................................................167
LN....................................................................................................................168
LEFT................................................................................................................168
LEN..................................................................................................................169
LOWER.............................................................................................................169
MATCH..............................................................................................................169
MAX.................................................................................................................170
MBR2TEXT.........................................................................................................171
MEDIAN.............................................................................................................171
MEMBER...........................................................................................................172
MID..................................................................................................................173
MIN..................................................................................................................173
MOD.................................................................................................................174
MONTH.............................................................................................................174
NEXT................................................................................................................175
NPER................................................................................................................176
NPV..................................................................................................................176
NUM2TEXT.........................................................................................................177
NUMMEMBERS...................................................................................................177
OPRID...............................................................................................................177
PARENT............................................................................................................179
PCT..................................................................................................................180
PERCENTILE......................................................................................................180
PI.....................................................................................................................181
PMT.................................................................................................................181
PREV................................................................................................................182
PREVSELF.........................................................................................................183
PV............................................................................................................ .......184
QUARTILE..........................................................................................................184
RAND...............................................................................................................185
RATE................................................................................................................185
REPLACE..........................................................................................................186
RETURN............................................................................................................186
RIGHT...............................................................................................................186
ROUND.............................................................................................................187
SELF................................................................................................................187
SET..................................................................................................................188
SIN...................................................................................................................188
SLN..................................................................................................................189
Copyright © 1988-2007, Oracle. All rights reserved.
xi
Contents
SLOPE..............................................................................................................189
SQRT................................................................................................................191
STDEV..............................................................................................................192
SYD..................................................................................................................192
TAN..................................................................................................................193
TEXT2MBR.........................................................................................................194
TEXT2NUM.........................................................................................................194
THIS.................................................................................................................194
THISCUBE.........................................................................................................195
TRUNC..............................................................................................................196
UPPER..............................................................................................................196
VAR..................................................................................................................196
WHILE...............................................................................................................197
YEAR................................................................................................................197
Part 3
Working with Analytic Types
Chapter 12
Understanding the Relationship of Analytic Types to Analytic Models.................. .......201
Purpose of Analytic Type Definitions......................................................................... .......201
Example: Working with an Analytic Type and an Analytic Model.... ................ .......................202
Relationship of Record Attributes to Data Caching Behavior............................................. .......205
Synchronization Order......................................................................................... .......208
Part 4
Working with Analytic Grids
Chapter 13
Creating Analytic Grids.............................................................................. .......211
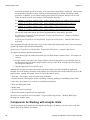
Understanding Analytic Grid Design......................................................................... .......211
Components for Working with Analytic Grids..................................................................212
Inserting and Resizing Analytic Grid Controls.............................................................. .......214
Setting Analytic Grid Analytics Properties................................................................... .......215
Setting Analytic Grid Label Properties....................................................................... .......217
Setting Analytic Grid Use Properties......................................................................... .......218
xii
Copyright © 1988-2007, Oracle. All rights reserved.
Contents
Setting Analytic Grid General Properties.................................................................... .......220
Inserting and Manipulating Analytic Grid Columns......................................................... .......222
Inserting Analytic Grid Columns.................................................................................223
Deleting Analytic Grid Columns..................................................................................223
Moving Analytic Grid Columns on the Layout Tab.............................................................224
Moving Analytic Grid Columns on the Order Tab..............................................................224
Resizing Analytic Grids...........................................................................................224
Setting Column Properties for Analytic Grids............................................................... .......224
Manipulating the Analytic Grid at Runtime.................................................................. .......225
Part 5
Debugging Analytic Models
Chapter 14
Viewing and Debugging Analytic Models....................................................... .......229
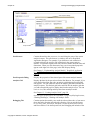
Understanding the Analytic Model Viewer.................................................................. .......229
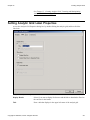
Viewing Analytic Model Properties........................................................................... .......230
Understanding Analytic Model Properties... ...................................................................230
Pages Used to View Analytic Model Properties...............................................................232
Viewing Analytic Models..........................................................................................232
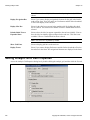
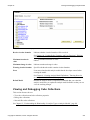
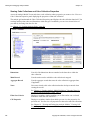
Viewing and Debugging Cube Collections.....................................................................233
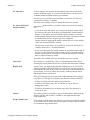
Viewing and Debugging Data Cubes...........................................................................236
Viewing Cell Properties...........................................................................................238
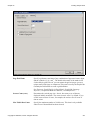
Viewing Dimension Properties. ..................................................................................239
Viewing User Function Properties...............................................................................241
Viewing Organizer Properties....................................................................................241
Using Analytic Model Viewer Alongside PeopleSoft Application Designer. . .. . .. .. . .. . .. .. . .. . .. .. . .. . .......242
Using the Application Log Fence............................................................................. .......243
Chapter 15
Capturing Analytic Instances...................................................................... .......245
Understanding the Analytic Instance Capture Utility....................................................... .......245
Capturing Analytic Instance Data............................................................................ .......245
Pages Used to Export Analytic Instances......................................................................246
Exporting Analytic Instances.....................................................................................246
Importing Analytic Instance Data............................................................................. .......248
Pages Used to Import Analytic Instances......................................................................248
Copyright © 1988-2007, Oracle. All rights reserved.
xiii
Contents
Importing Analytic Instances.....................................................................................248
Part 6
Converting Analytic Models
Chapter 16
Converting BAM 8.8 Models to Analytic Models............................................... .......253
Understanding the Conversion Process..................................................................... .......253
Understanding Part Conversion Details... .................................................................. .......255
Exporting BAM 8.8 Models.................................................................................... .......262
Running the PTAEACECONV Application Engine Program..... ......................................... .......262
Running PTAEACECONV from PeopleSoft Application Designer..........................................263
Running PTAEACECONV from a PeopleSoft Pure Internet Architecture Page...........................263
Examining the PTAEACECONV Log File................................................................... .......264
Glossary of PeopleSoft Enterprise Terms..............................................................265
Index ............................................................................................................291
xiv
Copyright © 1988-2007, Oracle. All rights reserved.
About This PeopleBook
PeopleSoft Enterprise PeopleBooks provide you with the information that you need to implement and use PeopleSoft
Enterprise applications from Oracle.
This preface discusses:
• PeopleSoft Enterprise application prerequisites.
• Application fundamentals.
• Documentation updates and printed documentation.
• Additional resources.
• Typographical conventions and visual cues.
• Comments and suggestions.
• Common elements in PeopleBooks.
Note. PeopleBooks document only elements, such as fields and check boxes, that require additional explanation. If an
element is not documented with the process or task in which it is used, then either it requires no additional explanation
or it is documented with common elements for the section, chapter, PeopleBook, or product line. Elements that are
common to all PeopleSoft Enterprise applications are defined in this preface.
PeopleSoft Enterprise Application Prerequisites
To benefit fully from the information that is covered in these books, you should have a basic understanding
of how to use PeopleSoft Enterprise applications.
You might also want to complete at least one introductory training course, if applicable.
You should be familiar with navigating the system and adding, updating, and deleting information by using
PeopleSoft Enterprise menus, pages, or windows. You should also be comfortable using the World Wide Web
and the Microsoft Windows or Windows NT graphical user interface.
These books do not review navigation and other basics. They present the information that you need to use the
system and implement your PeopleSoft Enterprise applications most effectively.
Application Fundamentals
Each application PeopleBook provides implementation and processing information for your PeopleSoft
Enterprise applications.
For some applications, additional, essential information describing the setup and design of your system appears
in a companion volume of documentation called the application fundamentals PeopleBook. Most product lines
have a version of the application fundamentals PeopleBook. The preface of each PeopleBook identifies the
application fundamentals PeopleBooks that are associated with that PeopleBook.
Copyright © 1988-2007, Oracle. All rights reserved.
xv
General Preface
The application fundamentals PeopleBook consists of important topics that apply to many or all PeopleSoft
Enterprise applications. Whether you are implementing a single application, some combination of applications
within the product line, or the entire product line, you should be familiar with the contents of the appropriate
application fundamentals PeopleBooks. They provide the starting points for fundamental implementation tasks.
Documentation Updates and Printed Documentation
This section discusses how to:
• Obtain documentation updates.
• Download and order printed documentation.
Obtaining Documentation Updates
You can find updates and additional documentation for this release, as well as previous releases, on Oracle’s
PeopleSoft Customer Connection website. Through the Documentation section of Oracle’s PeopleSoft
Customer Connection, you can download files to add to your PeopleBooks Library. You’ll find a variety of
useful and timely materials, including updates to the full line of PeopleSoft Enterprise documentation that is
delivered on your PeopleBooks CD-ROM.
Important! Before you upgrade, you must check Oracle’s PeopleSoft Customer Connection for updates to the
upgrade instructions. Oracle continually posts updates as the upgrade process is refined.
See Also
Oracle’s PeopleSoft Customer Connection, http://www.oracle.com/support/support_peoplesoft.html
Downloading and Ordering Printed Documentation
In addition to the complete line of documentation that is delivered on your PeopleBook CD-ROM, Oracle
makes PeopleSoft Enterprise documentation available to you via Oracle’s website. You can:
• Download PDF files.
• Order printed, bound volumes.
Downloading PDF Files
You can download PDF versions of PeopleSoft Enterprise documentation online via the Oracle Technology
Network. Oracle makes these PDF files available online for each major release shortly after the software
is shipped.
See Oracle Technology Network, http://www.oracle.com/technology/documentation/psftent.html.
Ordering Printed, Bound Volumes
You can order printed, bound volumes of selected documentation via the Oracle Store.
See Oracle Store, http://oraclestore.oracle.com/OA_HTML/ibeCCtpSctDspRte.jsp?section=14021
xvi
Copyright © 1988-2007, Oracle. All rights reserved.
General Preface
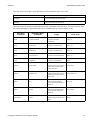
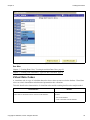
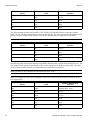
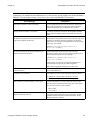
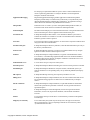
Additional Resources
The following resources are located on Oracle’s PeopleSoft Customer Connection website:
Resource
Navigation
Application maintenance information
Updates + Fixes
Business process diagrams
Support, Documentation, Business Process Maps
Interactive Services Repository
Support, Documentation, Interactive Services Repository
Hardware and software requirements
Implement, Optimize + Upgrade; Implementation Guide;
Implementation Documentation and Software; Hardware
and Software Requirements
Installation guides
Implement, Optimize + Upgrade; Implementation Guide;
Implementation Documentation and Software; Installation
Guides and Notes
Integration information
Implement, Optimize + Upgrade; Implementation Guide;
Implementation Documentation and Software; Pre-Built
Integrations for PeopleSoft Enterprise and JD Edwards
EnterpriseOne Applications
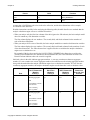
Minimum technical requirements (MTRs)
Implement, Optimize + Upgrade; Implementation Guide;
Supported Platforms
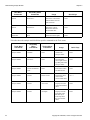
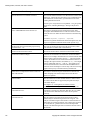
Documentation updates
Support, Documentation, Documentation Updates
PeopleBooks support policy
Support, Support Policy
Prerelease notes
Support, Documentation, Documentation Updates,
Category, Release Notes
Product release roadmap
Support, Roadmaps + Schedules
Release notes
Support, Documentation, Documentation Updates,
Category, Release Notes
Release value proposition
Support, Documentation, Documentation Updates,
Category, Release Value Proposition
Statement of direction
Support, Documentation, Documentation Updates,
Category, Statement of Direction
Troubleshooting information
Support, Troubleshooting
Upgrade documentation
Support, Documentation, Upgrade Documentation and
Scripts
Copyright © 1988-2007, Oracle. All rights reserved.
xvii
General Preface
Typographical Conventions and Visual Cues
This section discusses:
• Typographical conventions.
• Visual cues.
• Country, region, and industry identifiers.
• Currency codes.
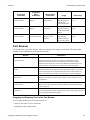
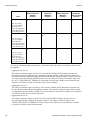
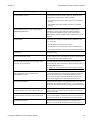
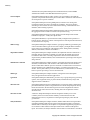
Typographical Conventions
This table contains the typographical conventions that are used in PeopleBooks:
Typographical Convention or Visual Cue
Description
Bold
Indicates PeopleCode function names, business function
names, event names, system function names, method
names, language constructs, and PeopleCode reserved
words that must be included literally in the function call.
Italics
Indicates field values, emphasis, and PeopleSoft
Enterprise or other book-length publication titles. In
PeopleCode syntax, italic items are placeholders for
arguments that your program must supply.
We also use italics when we refer to words as words or
letters as letters, as in the following: Enter the letter O.
xviii
KEY+KEY
Indicates a key combination action. For example, a plus
sign (+) between keys means that you must hold down
the first key while you press the second key. For ALT+W,
hold down the ALT key while you press the W key.
Monospace font
Indicates a PeopleCode program or other code example.
“ ” (quotation marks)
Indicate chapter titles in cross-references and words that
are used differently from their intended meanings.
. . . (ellipses)
Indicate that the preceding item or series can be repeated
any number of times in PeopleCode syntax.
{ } (curly braces)
Indicate a choice between two options in PeopleCode
syntax. Options are separated by a pipe ( | ).
Copyright © 1988-2007, Oracle. All rights reserved.
General Preface
Description
Typographical Convention or Visual Cue
[ ] (square brackets)
Indicate optional items in PeopleCode syntax.
& (ampersand)
When placed before a parameter in PeopleCode syntax,
an ampersand indicates that the parameter is an already
instantiated object.
Ampersands also precede all PeopleCode variables.
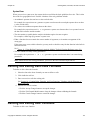
Visual Cues
PeopleBooks contain the following visual cues.
Notes
Notes indicate information that you should pay particular attention to as you work with the PeopleSoft
Enterprise system.
Note. Example of a note.
If the note is preceded by Important!, the note is crucial and includes information that concerns what you must
do for the system to function properly.
Important! Example of an important note.
Warnings
Warnings indicate crucial configuration considerations. Pay close attention to warning messages.
Warning! Example of a warning.
Cross-References
PeopleBooks provide cross-references either under the heading “See Also” or on a separate line preceded by
the word See. Cross-references lead to other documentation that is pertinent to the immediately preceding
documentation.
Country, Region, and Industry Identifiers
Information that applies only to a specific country, region, or industry is preceded by a standard identifier in
parentheses. This identifier typically appears at the beginning of a section heading, but it may also appear
at the beginning of a note or other text.
Example of a country-specific heading: “(FRA) Hiring an Employee”
Example of a region-specific heading: “(Latin America) Setting Up Depreciation”
Country Identifiers
Countries are identified with the International Organization for Standardization (ISO) country code.
Copyright © 1988-2007, Oracle. All rights reserved.
xix
General Preface
Region Identifiers
Regions are identified by the region name. The following region identifiers may appear in PeopleBooks:
• Asia Pacific
• Europe
• Latin America
• North America
Industry Identifiers
Industries are identified by the industry name or by an abbreviation for that industry. The following industry
identifiers may appear in PeopleBooks:
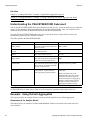
• USF (U.S. Federal)
• E&G (Education and Government)
Currency Codes
Monetary amounts are identified by the ISO currency code.
Comments and Suggestions
Your comments are important to us. We encourage you to tell us what you like, or what you would like to see
changed about PeopleBooks and other Oracle reference and training materials. Please send your suggestions to
your product line documentation manager at Oracle Corporation, 500 Oracle Parkway, Redwood Shores, CA
94065, U.S.A. Or email us at [email protected].
While we cannot guarantee to answer every email message, we will pay careful attention to your comments
and suggestions.
Common Elements Used in PeopleBooks
xx
As of Date
The last date for which a report or process includes data.
Business Unit
An ID that represents a high-level organization of business information. You
can use a business unit to define regional or departmental units within a
larger organization.
Description
Enter up to 30 characters of text.
Effective Date
The date on which a table row becomes effective; the date that an action
begins. For example, to close out a ledger on June 30, the effective date for the
ledger closing would be July 1. This date also determines when you can view
and change the information. Pages or panels and batch processes that use the
information use the current row.
Copyright © 1988-2007, Oracle. All rights reserved.
General Preface
Once, Always, and Don’t
Run
Select Once to run the request the next time the batch process runs. After the
batch process runs, the process frequency is automatically set to Don’t Run.
Select Always to run the request every time the batch process runs.
Select Don’t Run to ignore the request when the batch process runs.
Process Monitor
Click to access the Process List page, where you can view the status of
submitted process requests.
Report Manager
Click to access the Report List page, where you can view report content, check
the status of a report, and see content detail messages (which show you a
description of the report and the distribution list).
Request ID
An ID that represents a set of selection criteria for a report or process.
Run
Click to access the Process Scheduler request page, where you can specify the
location where a process or job runs and the process output format.
SetID
An ID that represents a set of control table information, or TableSets.
TableSets enable you to share control table information and processing options
among business units. The goal is to minimize redundant data and system
maintenance tasks. When you assign a setID to a record group in a business
unit, you indicate that all of the tables in the record group are shared between
that business unit and any other business unit that also assigns that setID to
that record group. For example, you can define a group of common job codes
that are shared between several business units. Each business unit that shares
the job codes is assigned the same setID for that record group.
Short Description
Enter up to 15 characters of text.
User ID
An ID that represents the person who generates a transaction.
Copyright © 1988-2007, Oracle. All rights reserved.
xxi
General Preface
xxii
Copyright © 1988-2007, Oracle. All rights reserved.
PeopleSoft Analytic Calculation Engine Preface
This chapter provides an overview of the PeopleSoft Analytic Calculation Engine and lists common elements.
PeopleSoft Analytic Calculation Engine
This PeopleBook is written for application developers working with PeopleSoft applications, and provides a
foundation for developing and administering analytic models, which calculate and send data to PeopleSoft
applications for the purposes of multidimensional reporting, analysis, and data entry.
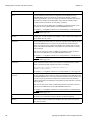
Common Elements Used in This PeopleBook
Create a new cube collection.
Create a new data cube.
Add existing data cubes to the selected cube collection.
Create a new dimension.
Attach one or more dimensions to the selected data cube.
Detach one or more dimensions from the selected data cube.
Validate the analytic model.
Find all of the locations of the selected part in the analytic model.
Display the direct causes of the selected data cube.
Display the direct effects of the selected data cube.
Accept the changes you made to the rule.
Cancel the changes you made to the rule.
Copyright © 1988-2007, Oracle. All rights reserved.
xxiii
Preface
xxiv
Copyright © 1988-2007, Oracle. All rights reserved.
PART 1
Getting Started with PeopleSoft Analytic
Calculation Engine
Chapter 1
Getting Started with PeopleSoft Analytic Calculation Engine
CHAPTER 1
Getting Started with PeopleSoft Analytic
Calculation Engine
This chapter provides an overview of PeopleSoft Analytic Calculation Engine and discusses PeopleSoft Analytic
Calculation Engine implementation.
PeopleSoft Analytic Calculation Engine Overview
PeopleSoft Analytic Calculation Engine comprises a calculation engine plus several PeopleTools features that
enable application developers to define both the calculation rules and the display of calculated data within
PeopleSoft applications for the purposes of multidimensional reporting, data editing, and analysis.
Specifically, application developers create analytic models to define the rules that are used to calculate data.
Application developers also create PeopleSoft Pure Internet Architecture pages with analytic grids to display
the data within PeopleSoft applications. Within the application, a PeopleSoft Pure Internet Architecture page
with an analytic grid may be referred to as an interactive report. End users view, analyze, and make changes to
analytic model data. When end users save their changes, PeopleSoft Analytic Calculation Engine recalculates
the data and sends the calculated data to the application database.
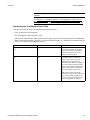
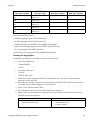
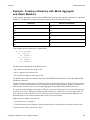
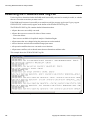
PeopleSoft Analytic Calculation Engine Implementation
The functionality to create your own analytic models is delivered as part of standard PeopleSoft PeopleTools
that are provided with all PeopleSoft products. However, you must complete these activities before you can
create analytic models:
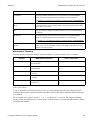
Step
Reference
Install PeopleTools
See Enterprise PeopleTools Installation Guide for your
database platform.
Install the database that you want to use with your
application.
See the installation documentation for your database
platform.
Configure the application server.
See Enterprise PeopleTools 8.49 PeopleBook: System and
Server Administration, “Using the PSADMIN Utility”.
Enable the appropriate number of analytic server instances.
See Enterprise PeopleTools 8.49 PeopleBook: System
and Server Administration, “Managing Analytic Servers,”
Configuring and Starting Analytic Servers.
Copyright © 1988-2007, Oracle. All rights reserved.
3
Getting Started with PeopleSoft Analytic Calculation Engine
Chapter 1
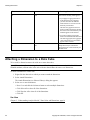
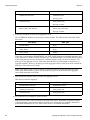
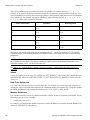
Step
Reference
Establish a user profile that gives you access to PeopleSoft
Application Designer and any other processes that you will
use.
See Enterprise PeopleTools 8.49 PeopleBook: Security
Administration.
Configure the application for which you are creating or
changing an analytic model.
The appropriate PeopleBook for your application.
See Also
Chapter 2, “Understanding PeopleSoft Analytic Calculation Engine,” page 7
4
Copyright © 1988-2007, Oracle. All rights reserved.
PART 2
Designing and Editing Analytic Models
Chapter 2
Understanding PeopleSoft Analytic Calculation Engine
Chapter 3
Understanding Analytic Models
Chapter 4
Creating Analytic Model Definitions
Chapter 5
Creating Data Cubes
Chapter 6
Creating Dimensions
Chapter 7
Creating Cube Collections
Chapter 8
Creating Explicit Dimension Sets
Chapter 9
Creating Hierarchies
Chapter 10
Creating Rules, Formulas, and User Functions
Chapter 11
Using Built-in Functions in Analytic Models
CHAPTER 2
Understanding PeopleSoft Analytic
Calculation Engine
This chapter discusses:
• PeopleSoft Analytic Calculation Engine components.
• PeopleSoft Analytic Calculation Engine architecture.
• PeopleSoft Analytic Calculation Engine development process.
• PeopleSoft Analytic Calculation Engine security.
PeopleSoft Analytic Calculation Engine Components
This section discusses these PeopleSoft Analytic Calculation Engine components:
• Analytic model.
• Analytic type.
• Analytic instances.
• Analytic calculation engines.
• Analytic server instances.
• Analytic Calculation Engine classes.
• Analytic Calculation Engine Metadata classes.
• AnalyticType classes.
• AnalyticGrid classes.
• PeopleSoft Pure Internet Architecture pages with analytic grids.
• Analytic Model Viewer.
• Analytic Instance Capture Utility.
• PeopleSoft Performance Monitor.
Analytic Model
Use PeopleSoft Application Designer to create an analytic model. When you create an analytic model, you:
• Define data cubes, dimensions, cube collections, and other parts that are used to organize and calculate
individual fields of data.
• Map records to cube collections within the analytic model.
Copyright © 1988-2007, Oracle. All rights reserved.
7
Understanding PeopleSoft Analytic Calculation Engine
Chapter 2
• Map individual record fields to data cubes and dimensions within the cube collections.
Analytic Type
Both PeopleSoft Analytic Calculation Engine and PeopleSoft Optimization Framework use analytic types. Use
PeopleSoft Application Designer to create an analytic type definition, which defines the caching behavior of
the records that the analytic model uses, specifies the records that are accessible by all end users, and specifies
the records that are only accessible by certain users for what-if scenario forecasting.
See Chapter 12, “Understanding the Relationship of Analytic Types to Analytic Models,” Purpose of
Analytic Type Definitions, page 201 and Enterprise PeopleTools 8.49 PeopleBook: PeopleSoft Optimization
Framework, “Designing Analytic Type Definitions”.
Analytic Instances
Analytic instances are runtime instances of analytic types that are loaded into analytic server instances
by means of the AnalyticInstance class Load method. The AnalyticInstance class is one of the Analytic
Calculation Engine classes. To view and edit analytic model data, an end user selects an analytic instance ID
within an application’s PeopleSoft Pure Internet Architecture pages.
Analytic Calculation Engines
Analytic calculation engines run inside analytic server instances. They calculate analytic instance data by
using the relationships and rules that are defined in the analytic model.
Analytic Server Instances
When used with PeopleSoft Analytic Calculation Engine, analytic server instances are processes in the
application server domain that contain and run analytic instances and analytic calculation engines. When a
user selects an analytic instance ID within an application, the system generates one analytic calculation engine
and one analytic server instance. One analytic server instance can contain one and only one analytic instance,
and one and only one analytic calculation engine. All three of these components—plus the application
server—exist in one application server domain. An application server can only communicate with analytic
server instances that exist in the same application server domain as the application server. For this reason,
a PeopleSoft application that exists in one application server domain cannot communicate with an analytic
model that exists in a different application server domain.
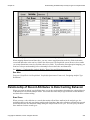
The PSANALYTICSRV table contains a row that provides information about each analytic server instance
that is running within an application server domain. You administer analytic server instances by using the
Summary and Servers pages that display the data from the PSANALYTICSRV table.
See Enterprise PeopleTools 8.49 PeopleBook: System and Server Administration, “Managing Analytic
Servers,” Administering Analytic Servers.
Analytic Calculation Engine Classes
You use the Analytic Calculation Engine classes for all runtime operations between PeopleSoft applications
and analytic calculation engines. Use the Analytic Calculation Engine classes to either retrieve or specify
data in an instance of an analytic model loaded into the system, and also to calculate (or recalculate) data
cube values. The Analytic Calculation Engine classes run on the application server and use Tuxedo service
requests to communicate with analytic server instances.
The Analytic Calculation Engine classes contain the AnalyticInstance classes, which are used by PeopleSoft
Analytic Calculation Engine and PeopleSoft Optimization Framework to manipulate analytic instance
definitions with PeopleCode. Use the AnalyticInstance classes to manipulate analytic instance definitions
at runtime.
8
Copyright © 1988-2007, Oracle. All rights reserved.
Chapter 2
Understanding PeopleSoft Analytic Calculation Engine
See Enterprise PeopleTools 8.49 PeopleBook: PeopleCode API Reference, “Analytic Calculation Engine
Classes”.
Analytic Calculation Engine Metadata Classes
The Analytic Calculation Engine Metadata classes are application classes that PeopleSoft applications use to
create and change analytic model metadata. For example, using the Analytic Calculation Engine Metadata
classes you could modify a calculation rule. Applications can use the Analytic Calculation Engine Metadata
classes to perform all of the analytic model-related actions that are available in PeopleSoft Application
Designer.
See Enterprise PeopleTools 8.49 PeopleBook: PeopleCode API Reference, “Analytic Calculation Engine
Metadata Classes”.
AnalyticType Classes
The AnalyticType classes are PeopleCode application classes that PeopleSoft applications use to manipulate
analytic type definitions. Use the AnalyticType classes at runtime to perform all of the analytic type
definition-related actions that are available in PeopleSoft Application Designer.
See Enterprise PeopleTools 8.49 PeopleBook: PeopleCode API Reference, “Analytic Calculation Engine
Metadata Classes”.
AnalyticGrid Classes
PeopleSoft Analytic Calculation Engine uses the AnalyticGrid classes to manipulate analytic grids using
PeopleCode. Use the AnalyticGrid classes to manipulate the display or data of analytic grids at runtime.
See Enterprise PeopleTools 8.49 PeopleBook: PeopleCode API Reference, “Analytic Grid Classes”.
PeopleSoft Pure Internet Architecture Pages with Analytic Grids
Use PeopleSoft Application Designer to create PeopleSoft Pure Internet Architecture pages with analytic
grids. Pages with analytic grids display PeopleSoft Analytic Calculation Engine data and application data
within PeopleSoft applications. Within the application, a PeopleSoft Pure Internet Architecture page with an
analytic grid may be referred to as an interactive report. Analytic grids provide drag and drop functionality
so end users can view their data in different ways.
See Chapter 13, “Creating Analytic Grids,” page 211.
Analytic Model Viewer
The Analytic Model Viewer helps developers debug and analyze analytic models by enabling them to view an
analytic model’s parts and to view and edit an analytic model’s application data.
See Chapter 14, “Viewing and Debugging Analytic Models,” page 229.
Analytic Instance Capture Utility
When experiencing problems with an application that uses an analytic model, customers can use the Analytic
Instance Capture Utility to package analytic model data and metadata to send to PeopleSoft support for analysis.
See Chapter 15, “Capturing Analytic Instances,” page 245.
PeopleSoft Performance Monitor
PeopleSoft Performance Monitor enables you to monitor PeopleSoft Analytic Calculation Engine and view
real-time and historical performance data. PeopleSoft Performance Monitor provides the information that you
need to solve immediate performance issues as well as analyze trends in system performance.
Copyright © 1988-2007, Oracle. All rights reserved.
9
Understanding PeopleSoft Analytic Calculation Engine
Chapter 2
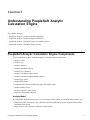
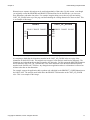
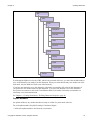
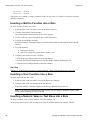
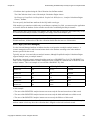
PeopleSoft Analytic Calculation Engine Architecture
This diagram illustrates how the various PeopleSoft Analytic Calculation Engine architecture components
work together:
Application Designer
Analytic Server Instance
Analytic Server Instance
Analytic Model
Analytic Server Instance
Analytic Type
SQL
(2-Tier)
PeopleSoft
Database
SQL
Analytic
Calculation
Engine
Analytic
Instance
Pages with
Analytic Grids
BEA Tuxedo
PSAPPSERV
PSAPPSERV
SQL
PeopleSoft
Application
Server
(PSAPPSERV)
JOLT/Tuxedo
Web Server
HTTP
Web Browser
Application
Pages for
End User
Analytic Model
Viewer for
Application
Developer
PeopleSoft Analytic Calculation Engine architecture
10
Copyright © 1988-2007, Oracle. All rights reserved.
Chapter 2
Understanding PeopleSoft Analytic Calculation Engine
PeopleSoft Analytic Calculation Engine Development Process
You should follow the development process outlined here for your PeopleSoft application to correctly employ
the features of PeopleSoft Analytic Calculation Engine.
Development Process Without Existing Record Structures
If you do not have existing record structures on which to base your analytic model, perform this iterative
process:
• Create the record definitions while creating the analytic model’s cube collections.
See Enterprise PeopleTools 8.49 PeopleBook: PeopleSoft Application Designer, “Creating Record
Definitions” and Chapter 7, “Creating Cube Collections,” page 53.
• Create the rest of the analytic model.
See Chapter 4, “Creating Analytic Model Definitions,” page 27.
• Define application data security.
See Enterprise PeopleTools 8.49 PeopleBook: Security Administration, “Understanding PeopleSoft
Security,” Application Data Security.
• Create an analytic type definition.
At the appropriate step in this process, you must attach the analytic type to the analytic model.
• Attach the analytic type to the analytic model.
See Enterprise PeopleTools 8.49 PeopleBook: PeopleSoft Optimization Framework, “Designing Analytic
Type Definitions,” Creating Analytic Type Definitions and Chapter 4, “Creating Analytic Model
Definitions,” page 27.
• Create PeopleSoft Pure Internet Architecture pages with analytic grids.
Note. Within the application, a PeopleSoft Pure Internet Architecture page with an analytic grid may
be referred to as an interactive report.
See Chapter 13, “Creating Analytic Grids,” page 211.
• As needed, create pages and any required PeopleCode to administer analytic instances.
See Enterprise PeopleTools 8.49 PeopleBook: PeopleSoft Application Designer, “Creating Page Definitions”
and Enterprise PeopleTools 8.49 PeopleBook: PeopleCode API Reference, “Analytic Type Classes”.
• As needed, write PeopleCode programs using the appropriate classes (Analytic Calculation Engine, Analytic
Calculation Engine Metadata, AnalyticGrid, AnalyticType) to manipulate the analytic model, its data,
and its display as necessary for your application.
See Enterprise PeopleTools 8.49 PeopleBook: PeopleCode API Reference.
• As needed, write Application Engine programs for batch calculations.
See Enterprise PeopleTools 8.49 PeopleBook: PeopleSoft Application Engine, “Creating Application
Engine Programs”.
• As needed, write application pages that enable end users to load analytic instances.
Copyright © 1988-2007, Oracle. All rights reserved.
11
Understanding PeopleSoft Analytic Calculation Engine
Chapter 2
Note. You can also embed analytic instance loading functionality into PeopleSoft Pure Internet Architecture
pages with analytic grids.
Development Process Using Existing Record Structures
If you have existing record structures on which the analytic model should be based, perform this iterative
process:
• Create a new analytic model.
At the appropriate step in this process, create the analytic model’s cube collections to retrieve data from
the records.
See Chapter 7, “Creating Cube Collections,” page 53.
• Create an analytic type definition.
• Attach the analytic type to the analytic model.
See Enterprise PeopleTools 8.49 PeopleBook: PeopleSoft Optimization Framework, “Designing Analytic
Type Definitions,” Creating Analytic Type Definitions and Chapter 4, “Creating Analytic Model
Definitions,” page 27.
• Create PeopleSoft Pure Internet Architecture pages with analytic grids.
Note. Within the application, a PeopleSoft Pure Internet Architecture page with an analytic grid may
be referred to as an interactive report.
See Chapter 13, “Creating Analytic Grids,” page 211.
• As needed, create pages and any required PeopleCode to administer analytic instances.
See Enterprise PeopleTools 8.49 PeopleBook: PeopleSoft Application Designer, “Creating Page Definitions”
and Enterprise PeopleTools 8.49 PeopleBook: PeopleCode API Reference, “Analytic Type Classes”.
• As needed, write PeopleCode programs using the appropriate classes (Analytic Calculation Engine, Analytic
Calculation Engine Metadata, AnalyticGrid, AnalyticType) to manipulate the analytic model, its data,
and its display as necessary for the application.
See Enterprise PeopleTools 8.49 PeopleBook: PeopleCode API Reference, “Analytic Type Classes”.
• As needed, write Application Engine programs for batch calculations.
See Enterprise PeopleTools 8.49 PeopleBook: PeopleSoft Application Engine, “Creating Application
Engine Programs”.
• As needed, write application pages that enable end users to load analytic instances.
Note. You can also embed this functionality into PeopleSoft Pure Internet Architecture pages with analytic
grids.
PeopleSoft Analytic Calculation Engine Security
PeopleSoft Analytic Calculation Engine does not provide additional data security features beyond what is
already available in PeopleTools. You define analytic model data security within the application that uses the
analytic model by creating a view for each read/write cube collection . Additionally, you can:
12
Copyright © 1988-2007, Oracle. All rights reserved.
Chapter 2
Understanding PeopleSoft Analytic Calculation Engine
• Create filter functions to restrict the data that appears in the analytic grid.
See Chapter 10, “Creating Rules, Formulas, and User Functions,” Filter User Functions, page 113.
• Create filter functions that filter data by userID.
See Chapter 11, “Using Built-in Functions in Analytic Models,” OPRID, page 177.
Copyright © 1988-2007, Oracle. All rights reserved.
13
Understanding PeopleSoft Analytic Calculation Engine
14
Chapter 2
Copyright © 1988-2007, Oracle. All rights reserved.
CHAPTER 3
Understanding Analytic Models
This chapter discusses:
• Analytic models.
• Relationship of parts.
• Tools.
• Naming conventions for analytic models and parts.
Analytic Models
An analytic model is an information workshop. Just like an ordinary workshop, it contains parts that you use
to build your projects, and tools to put the parts together. But instead of building a cabinet or a chair, you
organize data by building analytic models of information. This analytic model imitates the structure and
relationships of information in the real world.
You can think of an analytic model as a collection of various kinds of information that are held together by a
common purpose. For example, you can create an analytic model of an entire business, with information about
revenues, employee expenses, accounts receivable, assets, liabilities, equity, and so on. You can also create
an analytic model of a particular part of a business—such as employee expenses—and include more detail
than you would in a more general analytic model of a business. The focus can be wide or narrow, but all the
information about the area of interest goes into a single analytic model.
Because of an analytic model’s multidimensional capabilities, end users analyze data from different angles to
gain insight into their data. This data can range from a small table of values to a very large table containing
hundreds of kinds of data about thousands of people, places, or things.
Relationship of Parts
This section discusses:
• Data cubes and dimensions.
• Formulas.
• Cube collections.
• Organizers.
Copyright © 1988-2007, Oracle. All rights reserved.
15
Understanding Analytic Models
Chapter 3
Data Cubes and Dimensions
The primary parts in an analytic model are data cubes (cubes) and dimensions:
• A data cube is like a sheet of paper that contains one and only one kind of data.
When you build an analytic model, you create a data cube for each kind of information in the analytic
model. For example, an analytic model of a business might contain a data cube for sales, a data cube for
rent, a data cube for salary, and so on.
• A dimension contains a list of one kind of data that can span various contexts.
For example, an analytic model of a business might contain the PRODUCT_CODES dimension and
the MONTHS dimension. These two dimensions can be used in both a SALES cube collection and a
COST_OF_GOODS cube collection to track the products’ sales and costs over a period of months.
• A dimension member (member) is one list item within a dimension.
There are many different kinds of dimension members. For example, the 010 product code is a detail member
of the PRODUCT_CODES dimension. Western Europe is an aggregate member of the REGIONS dimension.
See Chapter 9, “Creating Hierarchies,” Types of Dimension Members, page 73.
Note. You do not create dimension members in the analytic model definition. Instead, dimension members
are dynamically created during runtime.
See Chapter 9, “Creating Hierarchies,” Creation of New Members at Runtime, page 78.
Data cubes and dimensions work together to create the structure of the analytic model. To see how this works,
imagine writing SALES at the top of a blank sheet of paper. This is the equivalent of creating a new data cube.
You could write only a single value in the SALES cube, but a cube with only one value is not useful. So
your next action is to write a list of months across the top of the cube and a list of product codes down the
side of the cube. This is an example of this image:
SALES
2004/01 2004/02 2004/03
010
020
070
SALES data cube with attached PRODUCT_CODES and MONTHS dimensions
The SALES cube now contains a value for every month and product code because you attached two
dimensions to the cube.
16
Copyright © 1988-2007, Oracle. All rights reserved.
Chapter 3
Understanding Analytic Models
Dimensions are separate objects that can be used independently of data cubes. For this reason, even though
you originally created the MONTHS and PRODUCTS dimensions for the SALES cube, you can reuse
these dimensions with other data cubes. For example, imagine taking a new sheet of paper and writing
COST_OF_GOODS at the top of the page, and then attaching the existing dimensions to the new sheet. This
is an example of this image:
SALES
2004/01 2004/02 2004/03
010
020
070
COST_OF_GOODS
2004/01 2004/02 2004/03
010
020
070
Attaching the PRODUCT_CODES and MONTHS dimensions to the COST_OF_GOODS data cube
It is tempting to think that the dimensions attached to the COST_OF_GOODS cube are copies of the
dimensions on the SALES cube. This might be true on paper, but an analytic model works differently. The
dimensions are independent objects that you attach to the data cubes. For this reason, the MONTHS dimension
that is attached to the COST_OF_GOODS cube is the same dimension as the MONTHS dimension that is
attached to the SALES cube. Therefore, any change that an application makes in a dimension is reflected on
all data cubes that use that dimension.
For example, suppose the application adds a product code called 090 to the PRODUCT_CODES dimension on
the SALES cube. The analytic model adds 090 to the PRODUCTS dimension on the COST_OF_GOODS
cube. This is an example of this image:
Copyright © 1988-2007, Oracle. All rights reserved.
17
Understanding Analytic Models
Chapter 3
SALES
2004/01 2004/02 2004/03
010
020
070
090
COST_OF_GOODS
2004/01 2004/02 2004/03
010
020
070
090
Adding the 090 product code to the PRODUCT_CODES dimension on the SALES cube
When updating an analytic model, you can use a combination of existing and new dimensions when you
define a data cube. For example, suppose you create a cube called SALARY. You want to track monthly
data, so you attach the existing MONTHS dimension to the data cube. You also want to track the salary for
each employee, so you create a new EMPLOYEES dimension and attach it to the SALARY cube. This
is an example of this image:
18
Copyright © 1988-2007, Oracle. All rights reserved.
Chapter 3
Understanding Analytic Models
SALARY
2004/01 2004/02 2004/03
2004/01 2004/02 2004/03
(Existing MONTHS
dimension)
Carlos
Chang
John
Linda
Carlos
Chang
John
Linda
(New EMPLOYEES
dimension)
SALARY data cube with attached MONTHS dimension and new EMPLOYEES dimension
Formulas and User Functions
You create formulas to define the relationships among the data cubes in an analytic model. For example, this
formula for the GROSS_MARGIN data cube defines the relationship between GROSS_MARGIN and other
data cubes called SALES and COST_OF_GOODS:
SALES - COST_OF_GOODS
The analytic calculation engine recalculates the values in the GROSS_MARGIN data cube whenever the end
user changes the values in the SALES or COST_OF_GOODS data cubes and saves those changes.
Formulas refer to kinds of information as defined by data cubes. Formulas do not refer to specific values. The
relationship between GROSS_MARGIN, SALES and COST_OF_GOODS remains true regardless of the
specific data contained in these data cubes. You can attach new products or months to the data cubes without
changing or copying the formula because the relationships between the data cubes have not changed.
User functions serve several purposes. You can create a user function that contains all or part of a formula, and
apply this user function to calculate multiple data cubes. You can also create user functions to define filter
functions and rules for aggregating dimension members.
See Chapter 10, “Creating Rules, Formulas, and User Functions,” page 111 and Chapter 9, “Creating
Hierarchies,” Understanding Dimension Members, page 73.
Copyright © 1988-2007, Oracle. All rights reserved.
19
Understanding Analytic Models
Chapter 3
Cube Collections
A cube collection is a collection of related data cubes. You create cube collections to load data from the
database into the analytic model, save data back to the database, and display calculated data to the end user at
runtime. Some cube collections contain data cubes that receive user input, and other cube collections calculate
data cubes and display calculated data to the end user.
See Chapter 7, “Creating Cube Collections,” page 53.
Organizers
You can use organizers to arrange an analytic model’s parts for more convenient viewing and editing. Within
an analytic model, you can place any of the following parts in as many different organizers as you want:
• Cube collections.
• Data cubes.
• Dimensions.
• User functions.
• Organizers.
You can drag and drop parts into and between organizers, place sub-organizers into organizers, and drag and
drop organizers and sub-organizers to arrange their positions in the Organizers branch of the part browser.
See Also
Chapter 4, “Creating Analytic Model Definitions,” Creating Organizers, page 29
Tools
This section discusses:
• PeopleSoft Application Designer window components for creating analytic model definitions.
• Behavior of bars.
• Menu bar.
• Part bar.
• Rule bar.
• Bart browser.
• Notes bar.
PeopleSoft Application Designer Window Components
for Creating Analytic Model Definitions
You use the areas labeled in this example to create analytic model definitions:
20
Copyright © 1988-2007, Oracle. All rights reserved.
Chapter 3
Understanding Analytic Models
Menu Bar
Tool Bar
Formula Bar
Rule Bar
Part Browser
Part Property Editor
Notes Bar
Output Window
Status Bar
PeopleSoft Application Designer interface for creating analytic model definitions
Menu Bar
Provides access to commands and features that you use to create analytic
model definitions.
See Chapter 3, “Understanding Analytic Models,” Menu Bar, page 22.
Tool Bar
Contains buttons that you use to perform common commands and edit an
analytic model definition’s parts.
Formula Bar
Contains buttons that you use to define formulas for data cubes and user
functions.
Rule Bar
Displays the rules for data cubes and user functions.
Note. The type of information that appears in the rule bar depends on the part
that is currently selected.
Part Browser
Contains hierarchies that you use to view, organize, and edit an analytic
model definition’s parts.
See Chapter 3, “Understanding Analytic Models,” Part Browser, page 25.
Part Property Editor
Contains dialog boxes that you use to edit an analytic model definition’s parts.
Notes Bar
Enables you to enter notes about the different parts of the analytic model
definition.
Copyright © 1988-2007, Oracle. All rights reserved.
21
Understanding Analytic Models
Chapter 3
Output Window
Contains the output text from PeopleSoft Application Designer operations,
such as Build (SQL Create and Alter), Find Definition References, Upgrade,
Results, Validate, and PeopleCode Log.
Status Bar
Contains descriptions of buttons and menu commands.
Behavior of Bars
All of the bars—except for the menu bar and status bar—are dockable. You can drag the bars to the top,
bottom, left, or right sides of the PeopleSoft Application Designer interface.
To float the bars, drag them away from the edges of the PeopleSoft Application Designer interface. You can
then resize them vertically and horizontally.
Menu Bar
This section reviews PeopleSoft Application Designer’s menu commands that you use to create analytic
model definitions.
Note. This section does not review all of PeopleSoft Application Designer’s menu commands.
See Enterprise PeopleTools 8.49 PeopleBook: PeopleSoft Application Designer, “Using PeopleSoft
Application Designer,” Using the PeopleSoft Application Designer Window Components.
This table shows the analytic model definition specific commands in the Edit menu:
Edit Menu Commands
Usage
Quick Keys
Paste Function
Select to insert a built-in function and its
arguments into a rule.
CTRL+SHIFT+F
Paste Cube Name
Select to insert a reference to the data
cube into a rule.
CTRL+SHIFT+N
Paste Member Ref...
Insert a reference to a dimension into
a rule. Once PeopleSoft Analytic
Calculation Engine inserts the dimension
reference, complete the syntax for a
member reference.
CTRL+SHIFT+M
See Chapter 10, “Creating Rules,
Formulas, and User Functions,”
Inserting a Dimension Member
Reference into a Rule, page 129.
22
Paste Dimension
Insert a reference to a dimension into a
rule.
None
Paste User Function
Insert a reference to a user function into
a rule.
None
Copyright © 1988-2007, Oracle. All rights reserved.
Chapter 3
Understanding Analytic Models
This table shows the analytic model definition specific commands in the View menu:
View Menu Commands
Usage
Notes Bar
Active and deactivate the notes bar.
Rule Bar
Active and deactivate the rule bar.
This table shows the analytic model definition specific commands in the Part menu. You can access the same
Part menu commands by right-clicking the part or subbranch that you want to add to or edit:
Part Menu
Commands
Secondary Menu
Commands
Usage
Quick Keys
New
Cube Collection
Create a new cube
collection.
CTRL+L
New
Data Cube
Create a new data cube.
CTRL+D
New
Dimension
Create a new dimension.
CTRL+E
New
User Function
Create a new user function.
CTRL+U
New
Organizer
Create a new organizer.
None
Attach
Data Cubes...
Attach one or more existing
data cubes to the selected
cube collection.
CTRL+S+D
Attach
Dimensions...
Attach one or more existing
dimensions to the selected
data cube.
CTRL+SHIFT+E
Move
Up
Move the selected part
one position up in the part
browser.
ALT+UP
Move
Down
Move the selected part one
position down in the part
browser.
ALT+DOWN
Clone Part
None
Make a copy of the selected
part.
None
Copyright © 1988-2007, Oracle. All rights reserved.
23
Understanding Analytic Models
Part Menu
Commands
Chapter 3
Secondary Menu
Commands
Usage
Quick Keys
Detach
Data Cubes...
Detach one or more data
cubes from the selected
cube collection.
None
Detach
Dimensions...
Detach one or more
dimensions from the
selected data cube.
None
Delete Part
None
Delete the selected parts.
None
This table shows the analytic model definition specific commands in the Tools menu:
Tools Menu
Commands
24
Secondary
Menu
Commands
Tertiary Menu
Commands
Usage
Quick Keys
Analytic Model
Validate
None
Validate the
analytic model.
None
Analytic Model
Find Part...
None
Find where the
current part is used
by other parts in the
analytic model.
None
Analytic Model
Causes and Effects
Tool...
None
Launch the Causes
and Effects Tool.
None
Analytic Model
Causes
Direct Causes
Display the direct
causes of the
selected data cubes.
ALT + <
Analytic Model
Causes
All Causes
Display all causes
of the selected data
cubes.
None
Analytic Model
Causes
All Inputs
Display all of the
input data cubes
that directly or
indirectly affect
the selected data
cubes.
None
Copyright © 1988-2007, Oracle. All rights reserved.
Chapter 3
Understanding Analytic Models
Tools Menu
Commands
Secondary
Menu
Commands
Tertiary Menu
Commands
Usage
Quick Keys
Analytic Model
Effects
Direct Effects
Display the direct
effects of the
selected data cubes.
ALT + >
Analytic Model
Effects
All Effects
Display all effects
of the selected data
cubes.
None
Analytic Model
Circular Formulas
Show Circular
System
Show the data
cubes involved in
the circular system.
None
Part Browser
The part browser is a treelike structure whose main branch is the analytic model itself. The main branch
contains several subbranches, as described in this table:
Branch
Description
Cube Collections
Contains a subbranch for each cube collection in the analytic model.
Double-click a cube collection to edit the cube collection’s properties.
Expand a cube collection to view all of the dimensions and data cubes in a
cube collection. Click a dimension or data cube to edit its properties.
Cubes
Contains a subbranch for each data cube in the analytic model. Click a data
cube to edit its properties. Expand a data cube view all of the dimensions
that are attached to the data cube. Click a dimension to edit its properties.
Dimensions
Displays each dimension in the analytic model. Click a dimension to edit
its properties.
User Functions
Displays each user function in the analytic model. Click a user function to
edit its properties.
Organizers
Contains a subbranch for each organizer in the model. Expand the organizers
to view the parts within the organizers.
Dragging and Dropping Parts in the Part Browser
You can drag and drop parts in the part browser to:
• Add new data cubes to cube collections.
• Attach data cubes to dimensions.
Copyright © 1988-2007, Oracle. All rights reserved.
25
Understanding Analytic Models
Chapter 3
• Rearrange the order of dimensions.
• Rearrange the hierarchy of organizers.
26
Copyright © 1988-2007, Oracle. All rights reserved.
CHAPTER 4
Creating Analytic Model Definitions
This chapter provides overviews of the analytic model definition creation process and the conventions for naming
analytic models and parts and discusses how to:
• Create a new analytic model definition.
• Open an analytic model definition.
• Create organizers.
• Enter notes for an analytic model definition’s parts.
• Find parts.
• Validate analytic models.
Understanding the Analytic Model Definition Creation Process
You create analytic model definitions to define the rules that are used to calculate application data in the
PeopleSoft Analytic Calculation Engine. This section provides a high-level discussion of the steps for
creating a new analytic model definition assuming that you already have record structures on which to base
your analytic model.
To create an analytic model:
1. Create a new analytic model definition.
See Chapter 4, “Creating Analytic Model Definitions,” Creating a New Analytic Model Definition,
page 29.
2. Perform these tasks in whatever order is appropriate to your own development needs:
• Create the analytic model definition’s dimensions.
See Chapter 6, “Creating Dimensions,” page 47.
• Create the analytic model definition’s data cubes and set the properties of the data cubes.
Consider the kinds of information that the end user should analyze. These kinds of information
should be your data cubes.
See Chapter 5, “Creating Data Cubes,” page 31.
Copyright © 1988-2007, Oracle. All rights reserved.
27
Creating Analytic Model Definitions
Chapter 4
• Define formulas and user functions to calculate the data cubes.
Define a formula for each data cube that you want to calculate. If you want to reuse the formula
in more than one data cube, create a user function and reference the user function in the formula
for each of the data cubes.
See Chapter 10, “Creating Rules, Formulas, and User Functions,” Defining and Editing Data Cube
Formulas, page 119.
• Attach dimensions to the data cubes.
Attach the dimensions to the data cubes after you have created the dimensions and data cubes.
See Chapter 6, “Creating Dimensions,” Attaching a Dimension to a Data Cube, page 50.
• Define the analytic model’s cube collections.
See Chapter 7, “Creating Cube Collections,” page 53.
• Define the analytic model definition’s filter functions.
See Chapter 10, “Creating Rules, Formulas, and User Functions,” Filter User Functions, page 113.
• Define the analytic model definition’s organizers.
See Chapter 4, “Creating Analytic Model Definitions,” Creating Organizers, page 29.
3. Save the analytic model definition.
Understanding Conventions for Naming Analytic
Models and Parts
You must adhere to these rules when naming analytic models and all analytic model parts:
• Names must consist only of letters, numbers, and underscores (_).
Other than underscores, do not use nonalphanumeric characters.
• All letters must be uppercase.
• The first character in a name must consist of a letter.
Do not use a number or underscore as the first character in a name.
• Blank spaces are not allowed in names.
Use underscores instead of blank spaces.
• Names must not exceed 30 characters.
See Also
Chapter 16, “Converting BAM 8.8 Models to Analytic Models,” Understanding Part Conversion Details,
page 255
Enterprise PeopleTools 8.49 PeopleBook: PeopleCode API Reference, “Analytic Calculation Engine Metadata
Classes,” AnalyticModelDefn Class
28
Copyright © 1988-2007, Oracle. All rights reserved.
Chapter 4
Creating Analytic Model Definitions
Creating a New Analytic Model Definition
To open a new analytic model definition:
1. Select File, New in PeopleSoft Application Designer.
The New Definition dialog box appears.
2. Select Analytic Model.
3. Click OK.
The new analytic model definition appears.
Opening an Analytic Model Definition
To open an analytic model definition:
1. Select File, Open in PeopleSoft Application Designer.
The Open Definition dialog box appears.
2. Select Analytic Model in the Definition drop-down list box.
3. Provide selection criteria.
Enter an analytic model definition name or description (or the beginning characters of either), or
select a project.
4. Click Open or press ENTER to display analytic model definitions matching the selection criteria
that you entered.
To clear the current selection criteria and start over, click New Search. To change how the search list
appears, perform one of these actions:
• Click the List button to view only the names of the analytic model definitions.
• Click the Details button to view the names and descriptions.
By default, both the names and descriptions appear in the search list.
5. Double-click the analytic model definition that you want to open in the definition workspace, or
highlight the analytic model definition and click Open.
You can also press SHIFT+CLICK to select more than one definition to open in a single action, or
right-click to view a pop-up menu from which you can open, print, rename, or delete the selected
analytic model definition.
Creating Organizers
To create an organizer:
1. In the analytic model, select the Organizers branch in the part browser.
2. Select Part, New, Organizer.
Copyright © 1988-2007, Oracle. All rights reserved.
29
Creating Analytic Model Definitions
Chapter 4
The Edit Part Name dialog box appears.
3. Enter a name for the organizer.
4. Click OK.
See Also
Chapter 3, “Understanding Analytic Models,” Cube Collections, page 20
Entering Notes for an Analytic Model Definition’s Parts
Use the notes bar to create notes for the analytic model definition or its parts. To create a note:
1. In the part browser, select the analytic model definition or the part for which you want to create a note.
2. Click the notes bar.
3. Enter the note.
You may also:
• Press ENTER to create multiple paragraphs.
• Click Cancel Changes to cancel the changes you made to the note.
4. Click Accept Changes to accept the changes you made to the note.
Finding Parts
You can select one or more parts and find all of the locations in the analytic model where the parts are used.
Note. The Find Part feature does not operate on organizers.
To find a part:
1. Select one or more parts in the part browser.
2. Select Tools, Analytic Model, Find Part.
The locations of the parts are listed in the output window.
Validating Analytic Models
An important part of the analytic model creation process involves periodically validating the analytic model.
The validate utility runs a series of tests on the analytic model and sends its results to the Validate tab in the
output window. If errors are found, they are listed on this tab.
To validate an analytic model, select Tools, Analytic Model, Validate.
30
Copyright © 1988-2007, Oracle. All rights reserved.
CHAPTER 5
Creating Data Cubes
This chapter provides overviews of data cubes and the relationship between field definition attributes and data cube
formats and discusses how to:
• Create input data cubes.
• Create calculation data cubes.
• Create association data cubes.
• Create virtual data cubes.
• Define data cube properties.
• Audit data cubes at design time.
Understanding Data Cubes
This section provides overviews of:
• Definition of a data cube.
• Input data cubes.
• Calculation data cubes.
• Association data cubes.
• Virtual data cubes.
Definition of a Data Cube
A data cube is a container for one kind of data that you use in cube collections.
You can place the same data cube in more than one cube collection. For example, you can place
the EMPLOYEE_EXPENSE data cube in both an EMPLOYEE_ANALYSIS cube collection and an
INCOME_STATEMENT cube collection. To populate the data cubes with data from the database, you map
fields to the data cubes within the cube collection’s properties.
See Chapter 7, “Creating Cube Collections,” Mapping Data Cubes and Dimensions to Fields, page 59.
Within PeopleSoft Pure Internet Architecture pages with analytic grids, end users view cube collections and
drag and drop data cubes to view their relationships to other data cubes.
You create four different types of data cubes that you use within an analytic model:
• Input data cubes.
• Calculation data cubes.
Copyright © 1988-2007, Oracle. All rights reserved.
31
Creating Data Cubes
Chapter 5
• Association data cubes.
• Virtual data cubes.
The four types of data cubes are not mutually exclusive, but certain combinational restrictions apply. For
example, consider that all calculation data cubes contain formulas, and association data cubes may or may
not contain formulas. When an association data cube does contain a formula, it is considered to be a type of
calculation data cube. Similarly, when an input data cube contains a formula, it is also considered to be a type
of calculation data cube. Any of these data cubes may also be considered virtual data cubes if their values
are not stored in the database.
This table lists each type of data cube and specifies whether the data cube can contain a formula, whether the
data cube can lack a formula, whether the data cube can be virtual, and whether the data cube can be nonvirtual:
Formula
Allowed?
Data Cube Type
Input
Yes
No Formula
Allowed?
Can Be Virtual?
Can Be Nonvirtual?
Yes
No
Yes
Note. When input
data cubes contain
formulas, they must
use the INPUT
built-in function.
Calculation
Yes
No
Yes
Yes
Association
Yes
Yes
Yes
Yes
Virtual
Yes
No
Yes
No
Example: Working with Data Cubes and Dimensions
To be useful, a data cube must work with one or more dimensions. For example, suppose that you want to
track the sales of multiple products in multiple regions. First, create an input data cube called SALES and
dimensions called PRODUCTS and REGIONS. Next, attach the PRODUCTS dimension and REGIONS
dimension to the SALES data cube.
Note. When a cube collection is mapped to either a Writable-only record or a record with the Readable and
Writable attributes, all data cubes in the cube collection should share the same set of dimensions.
The combined string of all the attached dimension names should not exceed 256 characters.
See Also
Chapter 6, “Creating Dimensions,” page 47
Chapter 3, “Understanding Analytic Models,” Data Cubes and Dimensions, page 16
Input Data Cubes
Input data cubes receive their data from either the end user in the application or tables/views in the
database. Input data cubes can exist in all types of cube collections, although they do not serve a purpose in
intermediate/calculation cube collections. Use the INPUT built-in function to work with input cube data.
32
Copyright © 1988-2007, Oracle. All rights reserved.
Chapter 5
Creating Data Cubes
Note. Even though an input cube that uses either the INPUT built-in function is considered to be a type of
calculation data cube, it would not serve a purpose in an intermediate/calculation cube collection.
See Chapter 11, “Using Built-in Functions in Analytic Models,” INPUT, page 165.
See Also
Chapter 5, “Creating Data Cubes,” Creating Input Data Cubes, page 38
Chapter 7, “Creating Cube Collections,” Types of Cube Collections, page 54
Calculation Data Cubes
Calculation data cubes contain formulas that calculate data based on the data of other cubes. Calculation
data cubes can exist in all types of cube collections.
Note. Even though an input cube that uses either the INPUT built-in function is considered to be a type of
calculation data cube, it would not serve a purpose in an intermediate/calculation cube collection.
See Also
Chapter 5, “Creating Data Cubes,” Creating Calculation Data Cubes, page 39
Chapter 7, “Creating Cube Collections,” Types of Cube Collections, page 54
Association Data Cubes
An association data cube is a data cube that is formatted as a member of a dimension and has one or more
attached dimensions. An association data cube associates two dimensions, enabling the end user to group
members of one dimension into categories that are defined by the members of a different dimension. When
an association data cube receives its values from dimension members, it can be considered to be a type of
input data cube. When an association data cube receives its values from a calculation formula, it can be
considered to be a type of calculation data cube.
Association data cubes can exist in all types of cube collections.
Example: Creating the DEPT_TO_REGION Association Data Cube
This example associates the DEPTID dimension with the REGION dimension. This table lists the members
that are included in each dimension:
DEPTID Dimension Members
Note. In the application, the end users group or
categorize these members by categories that are
defined by the members of the REGION dimension.
REGION Dimension Members
Note. In the application, the end users select members
from this dimension to group members of the DEPTID
dimension.
AUS01
APAC
AUS02
LATAM
BRA01
NAMER
CAN01
EUROP
Copyright © 1988-2007, Oracle. All rights reserved.
33
Creating Data Cubes
Chapter 5
DEPTID Dimension Members
REGION Dimension Members
Note. In the application, the end users group or
categorize these members by categories that are
defined by the members of the REGION dimension.
Note. In the application, the end users select members
from this dimension to group members of the DEPTID
dimension.
EUR01
NA
GBR01
NA
JAP01
NA
JAP02
NA
MEX01
NA
USA01
NA
USA02
NA
This association enables the end user to group the members of the DEPTID dimension into categories that are
defined by the members of the REGION dimension.
To create the DEPT_TO_REGION association data cube:
1. Create a new data cube named DEPT_TO_REGION.
2. Format the data cube as a member of the REGION dimension.
This dimension contains the categories that the end user will use to group the members of the DEPTID
dimension. These members appear in the right-hand column of the data cube’s data. The end user can
select these members from a drop-down list box.
3. Attach the DEPTID dimension to the DEPT_TO_REGION association data cube.
This dimension contains the members that the end user will group or categorize. These members
appear in the left-hand column of the data cube’s data.
This example shows an association data cube and its drop-down list box in an analytic grid:
34
Copyright © 1988-2007, Oracle. All rights reserved.
Chapter 5
Creating Data Cubes
DEPT_TO_REGION association data cube in the Analytic Model Viewer
See Also
Chapter 5, “Creating Data Cubes,” Creating Association Data Cubes, page 39
Chapter 7, “Creating Cube Collections,” Types of Cube Collections, page 54
Virtual Data Cubes
A virtual data cube is a type of calculation data cube whose values are not saved to the database. Virtual data
cubes can exist in intermediate/calculation and presentation cube collections.
This table describes the characteristics of virtual data cubes and the resulting benefits to the analytic model:
Characteristic
Value data of virtual data cube is not stored in the database.
Benefit
Reduces:
• Size of the database.
• Time to load data from the database.
Copyright © 1988-2007, Oracle. All rights reserved.
35
Creating Data Cubes
Chapter 5
Characteristic
Benefit
The analytic calculation engine does not recalculate the virtual
data cube unless the virtual data cube has nonvirtual dependents.
Reduces recalculation time.
The analytic calculation engine neither allocates memory
nor calculates virtual data cubes until it receives a request for
recalculation of the virtual data cube.
Reduces memory consumption and recalculation
time.
See Chapter 5, “Creating Data Cubes,” Defining General Data Cube Properties, page 40.
When an end user loads an analytic instance, the underlying analytic model’s virtual data cubes do not contain
data. However, as soon as the analytic calculation engine receives a request for a virtual cube’s data, the
analytic calculation engine calculates the entire cube and places the totals and all nonzero values in a temporary
storage area. After this point—if the application requires the data—the analytic calculation engine retrieves the
data from the temporary storage area.
Virtual cube data is recalculated for these circumstances:
• The virtual data cube’s data is displayed in an analytic grid.
• The virtual data cube is used during a step of a recalculation.
• The virtual data cube is accessed by a user function, even if the cube’s data does not appear in the application.
• An application uses a PeopleCode program to request data from the virtual data cube.
Note. Whenever a circumstance requires a recalculation of all the data in an analytic model (for example,
when the application adds a member to a dimension), the temporary storage for all virtual data cubes is
discarded. This storage is created again as needed.
Virtual data cubes have the following two restrictions. Otherwise, you can use virtual data cubes in the way
you use nonvirtual data cubes.
• Because a virtual data cube does not permanently store data, it must contain a formula to generate its data.
Note. Deleting the formula for a virtual data cube results in an invalid analytic model.
• A virtual data cube cannot participate in recursive or circular systems because a virtual data cube’s formula
cannot refer to itself, either directly or indirectly.
This restriction applies because the first time a virtual cube’s data is requested, the analytic calculation
engine calculates and stores the data for the entire virtual data cube. In recursive or circular systems, the
analytic calculation engine cannot calculate all of the data at the same time for any given data cube.
Note. If a virtual cube is part of a recursive or circular system, the analytic calculation engine generates an
error value for all of the cube’s values. Use the Recalculate function in the Analytic Calculation Engine
classes to determine whether you violated this restriction. The Recalculate function returns a VIRTUAL
error for the data cube cells that are affected.
36
Copyright © 1988-2007, Oracle. All rights reserved.
Chapter 5
Creating Data Cubes
PeopleSoft recommends that you create virtual data cubes when you expect the cubes to be large, sparse,
and output-only, especially when a relatively small slice of the ordinary cubes is used in any given analytic
instance ID. The analytic calculation engine takes a long time to recalculate nonvirtual cubes that are
large, sparse, and output-only. When you make these cubes into virtual cubes, you eliminate them from
the recalculation process and drastically reduce memory requirements. If an analytic instance uses only a
small slice of the cube, the cube calculates on demand quickly and requires less memory because of the
sparsity compression.
Virtual cubes are also useful for intermediate calculations that do not require permanent storage permanently,
especially if these cubes would normally be large and sparse.
Note. You cannot use virtual cubes for intermediate calculations that are part of a recursive or circular system.
Note. Do not create virtual cubes out of large, dense cubes that are displayed frequently and take a long
time to recalculate. Such virtual cubes cause delays when an application requests data. To be certain of
recalculation time, PeopleSoft recommends you test whether using a virtual cube causes a significant
delay in the generation of data.
See Chapter 10, “Creating Rules, Formulas, and User Functions,” Understanding Circular Systems and
Recursive Systems, page 135 and Enterprise PeopleTools 8.49 PeopleBook: PeopleCode API Reference,
“Analytic Calculation Engine Classes,” Recalculate.
Intermediate virtual cubes can count as output-only cubes, as long as they do not have nonvirtual dependents.
For example, you can create formulas such as the following for output-only virtual cubes:
• This formula is for the SALARY_BY_EMPLOYEE data cube:
GROUPSUM(RCD JOB, SALARY, BUDGET_PERIOD, BUS_UNIT, EMPID, LEDGER, VERSION)
• This formula is for the BENEFITS_BY_EMPLOYEE data cube:
GROUPSUM(RCD JOB, BENEFITS, BUDGET_PERIOD, BUS_UNIT, EMPID, LEDGER, VERSION)
• This formula is for the SALARY_AND_BENEFITS_BY_EMPLOYEE data cube:
SALARY_BY_EMPLOYEE + BENEFITS_BY_EMPLOYEE
Even though SALARY_BY_EMPLOYEE and BENEFITS_BY_EMPLOYEE are used by another virtual
cube, they are not recalculated by the analytic calculation engine if there are no nonvirtual dependents. For
this reason, you must write the final formula for the SALARY_AND_BENEFITS_BY_EMPLOYEE data
cube in this way:
GROUPSUM(RCD_JOB, SALARY, BUDGET_PERIOD, BUS_UNIT, EMPID, LEDGER, VERSION) +⇒
GROUPSUM(RCD JOB, Benefits, Budget Period, Bus Unit, EmpID, Ledger, Version)
See Also
Chapter 5, “Creating Data Cubes,” Creating Virtual Data Cubes, page 40
Chapter 7, “Creating Cube Collections,” Types of Cube Collections, page 54
Copyright © 1988-2007, Oracle. All rights reserved.
37
Creating Data Cubes
Chapter 5
Understanding the Relationship Between Field Definition
Attributes and Data Cube Formats
Because data cubes receive data from fields, it is important to correctly set both the attributes of field
definitions and the formats of data cubes to ensure compatibility. The following table describes compatibilities
between field definition attributes and data cube formats. Cells marked Yes indicate compatibility. Cells
marked No indicate incompatibility. Cells marked Warn indicate potential compatibility and yield a warning
during design time. During runtime, the analytic calculation engine generates an error if it determines that
the mapping is not compatible.
Field Definition
Attributes
Data Cube Format:
Number
Data Cube
Format:
Member
Data Cube Format:
Date
Data Cube
Format: Text
Char
Warn
Warn
Yes
Yes
Number
Yes
No
Yes
Yes
Signed Number
Yes
No
Yes
Yes
Date
No
Yes
Yes
Yes
Time
No
No
No
No
Date Time
No
Warn
Yes
Yes
Note. When a
date-formatted data cube
is mapped to a field with
a Date Time attribute,
time-specific data is
truncated in the data cube
data.
Image
No
No
No
No
Long Char
No
No
No
No
See Also
Chapter 5, “Creating Data Cubes,” Defining General Data Cube Properties, page 40
Enterprise PeopleTools 8.49 PeopleBook: PeopleSoft Application Designer, “Creating Field Definitions”
Creating Input Data Cubes
To create an input data cube:
1. Select Part, New, Data Cube.
The Edit Part Name dialog box appears.
38
Copyright © 1988-2007, Oracle. All rights reserved.
Chapter 5
Creating Data Cubes
2. Enter the data cube name.
3. Click OK.
Note. Do not create formulas for input data cubes.
See Also
Chapter 5, “Creating Data Cubes,” Input Data Cubes, page 32
Creating Calculation Data Cubes
To create a calculation data cube:
1. Select Part, New, Data Cube.
The Edit Part Name dialog box appears.
2. Enter the data cube name.
3. Click OK.
4. Create a formula for the calculation data cube.
See Chapter 10, “Creating Rules, Formulas, and User Functions,” Defining and Editing Data Cube
Formulas, page 119.
See Also
Chapter 5, “Creating Data Cubes,” Calculation Data Cubes, page 33
Creating Association Data Cubes
To create an association data cube:
1. Select Part, New, Data Cube.
The Edit Part Name dialog box appears.
2. Enter the data cube name.
3. Click OK.
4. Format the data cube as a member of a dimension.
This dimension contains the members that the end user will group or categorize. In the application,
these members appear in the left-hand column of the data cube’s data.
See Chapter 5, “Creating Data Cubes,” Defining General Data Cube Properties, page 40.
5. Attach a different dimension to the data cube.
This dimension contains the categories by which the end user will group the members of the X
dimension. These members appear in the right-hand column of the data cube’s data. The end user can
select these members from a drop-down list box.
Copyright © 1988-2007, Oracle. All rights reserved.
39
Creating Data Cubes
Chapter 5
See Chapter 6, “Creating Dimensions,” Attaching a Dimension to a Data Cube, page 50.
See Also
Chapter 5, “Creating Data Cubes,” Association Data Cubes, page 33
Creating Virtual Data Cubes
To create a virtual data cube:
1. Select Part, New, Data Cube.
The Edit Part Name dialog box appears.
2. Enter the name of the data cube.
3. Click OK.
4. On the General tab of the data cube’s properties, select Virtual Cube (doesn’t store data).
See Also
Chapter 5, “Creating Data Cubes,” Virtual Data Cubes, page 35
Defining Data Cube Properties
This section discusses how to:
• Define general data cube properties.
• Select aggregate functions for attached dimensions.
Defining General Data Cube Properties
Select the data cube whose properties you want to define, and then select the General tab.
40
Copyright © 1988-2007, Oracle. All rights reserved.
Chapter 5
Creating Data Cubes
General tab
Data Cube
Displays the name of the data cube.
Format
Number: Select to format the data cube’s values as numbers.
Date: Select to format the data cube’s values as a date in the format
YYYY-MM-DD. For example, 2004/03/18 for March 18, 2004.
Note. Although the values are saved in the database using this date format,
end users can use My Personalizations to select a different display format in
PeopleSoft Pure Internet Architecture.
See Enterprise PeopleTools 8.49 PeopleBook: Using PeopleSoft Applications,
“Setting User Preferences,” Defining Your User Personalizations.
Member: Select to format the data cube’s values as members of a specified
dimension, as part of creating an association data cube.
See Chapter 5, “Creating Data Cubes,” Association Data Cubes, page 33.
When you select Member, the Dimension drop-down list box appears. Select a
dimension for which you want to format the data cube’s values as members.
For example, you can format a CUSTOMER_ID data cube as a member of
the CUSTID dimension.
Copyright © 1988-2007, Oracle. All rights reserved.
41
Creating Data Cubes
Chapter 5
Note. In the analytic grid, data cubes formatted as members should have
a field type of Edit Box.
Text: Select to format the data cube’s values as text. This option is useful for
entering names, addresses, and other textual data.
Virtual Cube (doesn’t
store data)
Select to set the data cube as a virtual data cube.
Clear to set the data cube as a nonvirtual data cube.
See Chapter 5, “Creating Data Cubes,” Virtual Data Cubes, page 35.
Note. A virtual data cube must contain a formula. Selecting this option
without entering and accepting a formula for a virtual data cube results in
an invalid analytic model.
Calculate Aggregate
Select to enable calculation of the data cube’s aggregates.
Note. If Calculate Aggregate is enabled for the data cube, the analytic
calculation engine initially retrieves the aggregate data from the aggregate
record when the analytic instance is loaded, but overwrites this data upon
recalculation. If this check box is disabled, values from the aggregate record
still load when the analytic instance is loaded; however, these values are not
recalculated.
Clear this check box to disable calculation of all of the data cube’s aggregates,
regardless of specified overrides.
Note. Disabling aggregate calculation for data cubes disables all aggregate
calculations, including the default sum aggregation.
See Chapter 9, “Creating Hierarchies,” Understanding Override Order of
Precedence, page 82.
See Also
Chapter 5, “Creating Data Cubes,” Understanding the Relationship Between Field Definition Attributes and
Data Cube Formats, page 38
Selecting Aggregate Functions for Attached Dimensions
Select the data cube for which you want to select an aggregate function, and then select the Dimensions tab.
42
Copyright © 1988-2007, Oracle. All rights reserved.
Chapter 5
Creating Data Cubes
Dimensions tab
Name
Displays the names of the dimensions that are attached to the data cube.
See Chapter 6, “Creating Dimensions,” Attaching a Dimension to a Data
Cube, page 50.
Aggregate Function
Select a cube dimension override user function to calculate the aggregates for
the dimension as it is attached to the data cube.
See Chapter 9, “Creating Hierarchies,” Understanding Override Order of
Precedence, page 82.
Auditing Data Cubes at Design Time
This section provides overviews of causes and inputs and of effects and discusses how to:
• Display causes and inputs.
• Display effects.
• Use the Causes and Effects tool.
Copyright © 1988-2007, Oracle. All rights reserved.
43
Creating Data Cubes
Chapter 5
Note. This section discusses auditing data cubes in design time. Use the Analytic Model Viewer to audit cube
collections and data cubes in runtime.
See Chapter 14, “Viewing and Debugging Analytic Models,” Viewing and Debugging Cube Collections,
page 233.
Understanding Causes and Inputs
Any data cube that affects another data cube is a cause—or precedent—of that data cube. A data cube can be a
direct cause or an indirect cause of another data cube. A direct cause is used in the data cube’s formula. An
indirect cause is not used in the formula, but it appears somewhere in the chain of formulas that ultimately
affect the data cube.
For example, suppose the GROSS_MARGIN and NET_INCOME data cubes contain these formulas:
• Formula for the GROSS_MARGIN data cube:
SALES - COST_OF_GOODS
• Formula for the NET_INCOME data cube:
GROSS_MARGIN - TOTAL_EXPENSE
In this example, SALES is a direct cause of GROSS_MARGIN because it is used in GROSS_MARGIN’s
formula. SALES is an indirect cause of NET_INCOME because it affects GROSS_MARGIN, which in
turn affects NET_INCOME.
You can display the causes of a data cube to view the assumptions behind a result or to find a formula that is
not working properly.
Using the All Inputs option, you can also display all of the input data cubes that affect a data cube, either
directly or indirectly.
See Chapter 5, “Creating Data Cubes,” Displaying Causes and Inputs, page 45.
Understanding Effects
Any data cube that is affected by another data cube is an effect—or dependent—of that data cube. A data
cube can be a direct effect or an indirect effect of another data cube. A direct effect uses the data cube in its
formula. An indirect effect does not use the data cube in its formula, but it is part of the chain of calculations
that are affected by the data cube.
Again, suppose the GROSS_MARGIN and NET_INCOME data cubes contain these formulas:
• Formula for the GROSS_MARGIN data cube:
SALES - COST_OF_GOODS
• Formula for the NET_INCOME data cube:
GROSS_MARGIN - TOTAL_EXPENSE
GROSS_MARGIN is a direct effect of SALES because it uses SALES in its formula. NET_INCOME is an
indirect effect of SALES because it is affected by GROSS_MARGIN, which in turn is affected by SALES.
You can display either the direct or direct plus indirect effects of a data cube to view the consequences
of a data cube’s values.
44
Copyright © 1988-2007, Oracle. All rights reserved.
Chapter 5
Creating Data Cubes
See Chapter 5, “Creating Data Cubes,” Displaying Effects, page 45.
Displaying Causes and Inputs
To display the causes or inputs of a data cube:
1. Select a data cube whose causes or inputs you want to display.
• To select several consecutive data cubes, hold down the SHIFT key and select the data cubes.
• To select a series of nonconsecutive data cubes, hold down the CTRL key and select the data cubes.
2. Select Tools, Analytic Model, Causes.
3. Select one of these options:
• Direct Causes.
• All Causes.
• All Inputs.
When applicable, the Causes and Effects dialog box displays the causes or inputs of the data cube.
You expand any of the data cubes in the dialog box to view their attached dimensions.
Note. The All Inputs option does not display the INPUT built-in function.
4. Click Close when you have finished viewing the causes or inputs.
Note. You can also display causes and inputs by using the Causes and Effects Tool.
See Also
Chapter 5, “Creating Data Cubes,” Using the Causes and Effects Tool, page 46
Displaying Effects
To display the effects of a data cube:
1. Select a data cube whose effects you want to display.
To select several data cubes, hold down the CTRL key and select the data cubes.
2. Select Tools, Analytic Model, Effects.
3. Select one of these options:
• Direct Effects.
• All Effects.
The Causes and Effects dialog box displays either the direct effects or all (direct and indirect)
effects of the data cube. You expand any of the data cubes in the dialog box to view their attached
dimensions.
4. Click OK when you have finished viewing the effects.
Note. You can also display effects by using the Causes and Effects tool.
Copyright © 1988-2007, Oracle. All rights reserved.
45
Creating Data Cubes
Chapter 5
See Also
Chapter 5, “Creating Data Cubes,” Using the Causes and Effects Tool, page 46
Using the Causes and Effects Tool
Select Tools, Analytic Model, Causes and Effects Tool to browse through the cube collections and data cubes
of your analytic model to view the causes, effects, and inputs of data cubes.
Causes and Effects Tool
Cube Collection
Select the cube collection to display a list of its data cubes.
Note. You can also select <All Cubes> to display a list of all data cubes in
the analytic model.
Cubes
Displays the names of the data cubes in the selected cube collection or the
analytic model.
Select a data cube to view its causes, inputs, or effects.
To select several data cubes, hold down the CTRL key and select the data cubes.
Note. You can also audit individual data cubes by selecting the data cube, and then selecting Tools, Analytic
Model and the desired audit option from the menu bar.
See Chapter 5, “Creating Data Cubes,” Displaying Causes and Inputs, page 45 and Chapter 5, “Creating
Data Cubes,” Displaying Effects, page 45.
46
Copyright © 1988-2007, Oracle. All rights reserved.
CHAPTER 6
Creating Dimensions
This chapter provides an overview of dimensions and discusses how to:
• Create a new dimension.
• Define dimension properties.
• Attach a dimension to a data cube.
• Change the order of dimensions in the part browser.
Understanding Dimensions
A dimension is a collection of people, places, events, or things for which you want to keep data. Each member
of the dimension is called a dimension member.
See Chapter 9, “Creating Hierarchies,” Understanding Dimension Members, page 73.
To keep data for each member of the dimension, attach the dimension to one or more data cubes. For example,
to keep sales data for multiple products, attach a PRODUCTS dimension to a SALES data cube. To track the
cost of goods for each product, attach the PRODUCTS dimension to a COST_OF_GOODS data cube.
Note. When a cube collection is mapped to either a Writable-only record or a record with the Readable and
Writable attributes, all data cubes in the cube collection should share the same set of dimensions.
Because dimensions receive data from fields, it is important to correctly set the attributes of field definitions to
ensure compatibility. You can map fields with the following attributes to dimensions:
• Char
• Number
• Signed Number
• Date
• Date Time
See Also
Chapter 3, “Understanding Analytic Models,” Data Cubes and Dimensions, page 16
Copyright © 1988-2007, Oracle. All rights reserved.
47
Creating Dimensions
Chapter 6
Creating a New Dimension
To create a new dimension:
1. Select Part, New, Dimension.
The Edit Part Name dialog box appears.
2. Enter the dimension name.
3. Click OK.
Defining Dimension Properties
Select the dimension whose properties you want to define:
Defining dimension properties
Total Member Name
This field performs different functions depending upon whether you have
entered a value into the Total Member Name field, whether the dimension
belongs to an analytic model that was converted from a BAM 8.8 model, and
whether a tree is attached to the dimension.
See Interpreting the Total Member Name Field.
Aggregate Function
48
Select a dimension override function to calculate the dimension’s aggregate
fields. The analytic calculation engine uses this aggregate function to calculate
all of a dimension’s aggregates.
Copyright © 1988-2007, Oracle. All rights reserved.
Chapter 6
Creating Dimensions
Note. This aggregate function does not apply to leaf members or detail
members.
See Chapter 9, “Creating Hierarchies,” Understanding Override Order of
Precedence, page 82 and Chapter 9, “Creating Hierarchies,” Example:
Creating a Hierarchy with Mixed Aggregate and Detail Members, page 109.
Interpreting the Total Member Name Field
This table describes the state of the dimension based upon whether:
• A tree is attached to the dimension.
• The Total Member Name field has a value.
Values for the Total Member Name field come from either the value that you entered into the Total Member
Name field of the dimension’s properties, a converted BAM 8.8 model, or a PeopleCode command using the
Analytic Calculation Engine Metadata Classes.
Tree Attached to Dimension?
Has Value?
Resulting State of Dimension
Yes
No
If you select Calculate Aggregates,
the value of hierarchy root member
appears to the end user and to the
analytic calculation engine.
No
Yes
PeopleSoft Analytic Calculation
Engine creates a basic, one-node
hierarchy for the dimension. By
default, the Show Hierarchy method is
used on the analytic model, and both
the one-node hierarchy and the name
that you enter into the Total Member
Name field appear to the end user.
Note. For the actual value of the
hierarchy to appear to the end user, you
must select Calculate Aggregate. If
you do not select this check box, the
value of 0 appears to the end user.
Copyright © 1988-2007, Oracle. All rights reserved.
49
Creating Dimensions
Chapter 6
Tree Attached to Dimension?
Yes
Has Value?
Resulting State of Dimension
Yes
One of these resulting states applies:
• If you apply an aggregate function
to this dimension, the value that
you enter into the Total Member
Name field serves as an alias to the
hierarchy root member.
This alias only appears to the user
functions within the analytic model;
the actual value of the hierarchy root
member appears to the end user.
• If you do not apply an aggregate
function to this dimension and select
Calculate Aggregates, the aggregate
value of the hierarchy root member
appears to the end user.
No
No
PeopleSoft Analytic Calculation
Engine does not create a hierarchy for
the dimension.
Attaching a Dimension to a Data Cube
To be useful, a dimension must work with one or more data cubes.
Note. When a cube collection is mapped to either a Writable-only record or a record with the Readable and
Writable attributes, all data cubes in the cube collection should share the same set of dimensions.
To attach a dimension to a data cube:
1. Right-click the data cube to which you want to attach the dimension.
2. Select Attach Dimensions.
The Attach Dimension(s) to Selected Cube(s) dialog box appears.
3. Select one or more dimensions.
• Press CTRL and click the left mouse button to select multiple dimensions.
• Click Select All to select all of the dimensions.
• Click Unselect All to clear all of the dimensions.
• Click OK.
See Also
Chapter 3, “Understanding Analytic Models,” Data Cubes and Dimensions, page 16
50
Copyright © 1988-2007, Oracle. All rights reserved.
Chapter 6
Creating Dimensions
Changing the Order of Dimensions in the Part Browser
To change the order of dimensions in the part browser:
1. Select one dimension that you want to move up or down in relationship to the other dimensions
in the part browser.
2. Perform one of these steps:
• Right-click the dimension member and select Move Up or Move Down.
• Hold down the left mouse button, drag the dimension to the desired location, and release the left
mouse button.
3. Perform steps 1 and 2 until all of the dimensions appear in the desired order in the part browser.
See Also
Chapter 9, “Creating Hierarchies,” Dimension Order Impact on Calculation, page 78
Copyright © 1988-2007, Oracle. All rights reserved.
51
Creating Dimensions
52
Chapter 6
Copyright © 1988-2007, Oracle. All rights reserved.
CHAPTER 7
Creating Cube Collections
This chapter provides overviews of cube collections and types of cube collections and discusses how to:
• Create cube collections.
• Define cube collection properties.
Understanding Cube Collections
A cube collection is a collection of related data cubes. You create cube collections to load data from the
database into the analytic model, receive user input, persist data back to the database, and display calculated
data to the end user at runtime.
When the end user loads an analytic instance, PeopleSoft Analytic Calculation Engine loads the data from the
database into the data cubes of the analytic model. These data cubes exist within cube collections. You map
the main record from the database to the cube collection, and the main record’s fields to the data cubes and
dimensions within the cube collection.
After loading an analytic instance, the end user has access to one or more cube collections within the
application. These cube collections—which are displayed in PeopleSoft Pure Internet Architecture pages
with analytic grids—contain the data that end users can view or edit. You create these pages in PeopleSoft
Application Designer.
See Chapter 13, “Creating Analytic Grids,” page 211.
Note. The analytic model may contain cube collections that are not visible to the end user.
For each record you want to work with in the analytic model, you generally create read/write cube collection
to load data into the analytic model, and a presentation cube collection for end user input, reporting and
forecasting. The presentation cube collection calculates the data from the read/write cube collection’s data
cubes and displays the calculated data to the end user. Presentation cube collections may also receive end
user input.
You can also create an intermediate/calculation cube collection to organize data cubes and create calculations
whose results are not displayed to the end user.
In the General tab of the cube collection’s properties, you map the main record, which stores the fact data that
you want to load and persist. For a read/write cube collection, select one of the records that you selected in the
analytic type definition that corresponds to the analytic model. For a presentation cube collection, select a
derived/work record from the list of available records.
Note. Do not map intermediate/calculation cube collections to any records.
Copyright © 1988-2007, Oracle. All rights reserved.
53
Creating Cube Collections
Chapter 7
Note. In the analytic type definition, you do not have to select the derived/work records that you want to
map to presentation cube collections. However the analytic type definition must include all derived/work
records that are mapped to cube collections on which you use the NetChanges parameter of the GetData
CubeCollection class method.
Note. When a cube collection is mapped to either a Writable-only record or a record with the Readable and
Writable attributes, all data cubes in the cube collection should share the same set of dimensions.
If desired, you can also use the General tab to map the cube collection to an aggregate record to persist the
cube collection’s aggregate data.
After you map the cube collection to the main and aggregate records, use the Field Map tab to map the cube
collection’s data cubes and dimensions to the fields of the main and aggregate records.
Note. You can map a data cube or dimension to one field within one record. Once you have mapped a data
cube or dimension to a particular record field, you cannot use that record field in another mapping. You can,
however, reuse the same field if that field is from a different record.
Use the Dimensions tab to define these additional attributes for the dimensions in the cube collection:
• How much aggregate data is saved.
• Sort order.
• Filter user function.
Types of Cube Collections
You create three different types of cube collections in an analytic model. This section provides overviews of:
• Read/write cube collections.
• Intermediate/calculation cube collections.
Note. Intermediate/calculation cube collections are optional.
• Presentation cube collections.
Read/Write Cube Collections
Use read/write cube collections to load data from the database, receive user input, and persist data back to the
database. For the main record, you can select any record type except derived/work records.
Note. The analytic type that you use with the analytic model must contain the records that you map
to read/write cube collections.
See Chapter 12, “Understanding the Relationship of Analytic Types to Analytic Models,” page 201.
This table indicates which data cube types are allowed in a read/write cube collection:
54
Copyright © 1988-2007, Oracle. All rights reserved.
Chapter 7
Creating Cube Collections
Allowed in Read/Write
Cube Collection?
Data Cube Type
Yes
Input data cubes
See Chapter 5, “Creating Data Cubes,” Input Data Cubes,
page 32.
Calculation data cubes
Yes
See Chapter 5, “Creating Data Cubes,” Input Data Cubes,
page 32.
Note. Initial data values for calculation data cubes are
loaded from the database. Calculated values are written
back to the database.
Association data cubes
Yes
See Chapter 5, “Creating Data Cubes,” Association Data
Cubes, page 33.
No
Virtual data cubes
See Chapter 5, “Creating Data Cubes,” Virtual Data Cubes,
page 35.
Intermediate/Calculation Cube Collections
Use intermediate/calculation cube collections to organize data cubes and create intermediate calculations in an
analytic model. These intermediate values are neither displayed to the end user nor persisted to the database.
For this reason, do not map a main record to an intermediate/calculation cube collection. You can view
intermediate/calculation cube collections in the Analytic Model Viewer.
Note. Intermediate/calculation cube collections are optional.
This table indicates which data cube types are allowed in an intermediate/calculation cube collection:
Allowed in Intermediate/Calculation
Cube Collection?
Data Cube Type
Input data cubes
Yes
See Chapter 5, “Creating Data Cubes,” Input Data Cubes,
page 32.
Note. Although input data cubes are allowed in
calculation cube collections, their data is not updated.
For this reason, input data cubes serve no purpose in
intermediate/calculation cube collections.
Calculation data cubes
Yes
See Chapter 5, “Creating Data Cubes,” Input Data Cubes,
page 32.
Copyright © 1988-2007, Oracle. All rights reserved.
55
Creating Cube Collections
Chapter 7
Allowed in Intermediate/Calculation
Cube Collection?
Data Cube Type
Association data cubes
Yes
See Chapter 5, “Creating Data Cubes,” Association Data
Cubes, page 33.
Yes
Virtual data cubes
See Chapter 5, “Creating Data Cubes,” Virtual Data Cubes,
page 35.
Presentation Cube Collections
Use presentation cube collections to present data to the end user for the purposes of reporting and forecasting.
For forecasting purposes, end users may also enter data into presentation cube collections. You can only select
a derived/work record as the main record of a presentation cube collection. If you select any other type of
record, you will not be able to select the cube collection on the Analytics tab of the analytic grid.
Note. You must create the derived/work record before selecting it as the main record.
See Enterprise PeopleTools 8.49 PeopleBook: PeopleSoft Application Designer, “Creating Record
Definitions,” Creating a New Record.
Use the GetData and SetData methods to transfer data between presentation cube collections and the
application server.
This table indicates which data cube types are allowed in a presentation cube collection:
Allowed in Presentation
Cube Collection?
Data Cube Type
Input data cubes
Yes
See Chapter 5, “Creating Data Cubes,” Input Data Cubes,
page 32.
Calculation data cubes
Yes
See Chapter 5, “Creating Data Cubes,” Input Data Cubes,
page 32.
Association data cubes
Yes
See Chapter 5, “Creating Data Cubes,” Association Data
Cubes, page 33.
Virtual data cubes
Yes
See Chapter 5, “Creating Data Cubes,” Virtual Data Cubes,
page 35.
Example: Creating Two Cube Collections
Suppose you want to work with sales data in an analytic model. Create these cube collections:
56
Copyright © 1988-2007, Oracle. All rights reserved.
Chapter 7
Creating Cube Collections
• SALES_RW read/write cube collection.
On the General tab, map this cube collection to the SALES main record to receive and persist raw sales data.
This record must exist in the analytic type definition. This cube collection contains these data cubes:
- UNIT_COST data cube.
Map this data cube to the UNIT_COST field.
- UNIT_SOLD data cube.
Map this data cube to the UNIT_SOLD field.
• SALES_PRES presentation cube collection.
Map this cube collection to the SALES_WK derived/work record to calculate sales data and display the
calculated data to the end user at runtime. This cube collection contains the TOTAL_SALES data cube,
which is mapped to the TOTAL_SALES_WK field. The TOTAL_SALES data cube contains this formula:
UNIT_COST * UNIT_SOLD
This diagram provides a visual representation of these cube collections:
UNIT_COST
(no formula)
TOTAL_SALES
Formula:
UNIT_SOLD
(no formula)
SALES_IN Cube Collection
UNIT_COST
X
UNIT_SOLD
SALES_WK Cube Collection
SALES_IN and SALES_WK cube collections
Creating Cube Collections
To create a cube collection:
1. Select Part, New, Cube Collection.
The Edit Part Name dialog box appears.
2. Enter the name of the cube collection.
3. Click OK.
You can now drag and drop the desired data cubes and dimensions into the cube collection.
Copyright © 1988-2007, Oracle. All rights reserved.
57
Creating Cube Collections
Chapter 7
See Also
Chapter 7, “Creating Cube Collections,” Types of Cube Collections, page 54
Defining Cube Collection Properties
This section discusses how to:
• Map a cube collection to main and aggregate records.
• Map data cubes and dimensions to fields.
• Define additional cube collection properties.
Mapping a Cube Collection to Main and Aggregate Records
Select the cube collection that contains the main and aggregate records that you want to map, and then select
the General tab.
General tab
Cube Collection
Displays the name of the cube collection.
Description
Enter a more detailed description of the cube collection.
Main Record
Select a main record to map to the cube collection.
For a cube collection that is used for user input and data retrieval, select one
of the records that you selected in the analytic type definition to use in the
58
Copyright © 1988-2007, Oracle. All rights reserved.
Chapter 7
Creating Cube Collections
analytic model. For a cube collection that is used to calculate data and display
the calculated data to the end user at runtime, select a derived/work record.
Aggregate Record
Select a record to store the cube collection’s aggregate data.
Records that are used as aggregate records should be read after records that
are used as main records.
See Chapter 12, “Understanding the Relationship of Analytic Types to
Analytic Models,” Synchronization Order, page 208.
Mapping Data Cubes and Dimensions to Fields
Select the cube collection that contains the data cubes and dimensions that you want to map, and then select
the Field Map tab.
Field Map tab
Part Name
Displays the name of the data cube or dimension to which you map fields.
Note. You can map a field to only one data cube or dimension.
Part Type
Displays whether the part to which you map fields is a data cube or dimension.
Main Field
Select a main field to map to the data cube or dimension.
Copyright © 1988-2007, Oracle. All rights reserved.
59
Creating Cube Collections
Chapter 7
Note. You can map a data cube or dimension to one field within one record.
Once you have mapped a data cube or dimension to a particular record field,
you cannot use that record field in another mapping. You can, however, reuse
the same field if that field is from a different record.
When mapping dimensions and data cubes, you may want to map dimensions
to the key fields in the main record and data cubes to the non-key fields in
the main record. The PeopleSoft system, however, does enable you to map
dimensions to non-key and data cubes to key fields. To perform the most
appropriate mapping, you must have a deeper understanding of the relationship
between data cubes and dimensions.
See Chapter 3, “Understanding Analytic Models,” Data Cubes and
Dimensions, page 16.
Aggregate Field
Select a field to store the cube collection’s aggregate data.
Defining Additional Cube Collection Dimension Properties
This section discusses how to:
• Set additional cube collection dimension properties.
• View additional cube collection dimension properties.
Setting Additional Cube Collection Dimension Properties
Select the cube collection that contains the dimensions whose properties you want to set, and then select the
Dimensions tab. Double-click any of the cells in the row of a dimension to access the Edit Cube Collection
Dimension dialog box.
Edit Cube Collection Dimension dialog box
Persist Aggregate:
60
Select whether to persist the dimension’s aggregate values to the database.
Copyright © 1988-2007, Oracle. All rights reserved.
Chapter 7
Creating Cube Collections
Aggregate data is persisted to the aggregate record that you select on the
General tab.
ALL: Select to persist all of the dimension member aggregate values to
the database.
NONE: Select to persist none of the dimension member aggregate values to
the database.
ROOT: Select to persist only the value of the hierarchy root member to
the database.
See Chapter 9, “Creating Hierarchies,” Understanding the Persistence of
Aggregate Data, page 79.
Filter User Function:
Select a filter user function to apply to the dimension.
Select None if you do not want to apply a filter user function to the dimension.
See Chapter 10, “Creating Rules, Formulas, and User Functions,” Rules,
Formulas, and User Functions, page 112.
Sort Type:
Sort by Name: Select to sort the dimension member values by name.
Sort by Key: Select to sort the dimension member values by data cube values.
Note. You can only select from the fields that are mapped to data cubes.
Sort Key #1
If Sort by Key is selected, select the first data cube name by which you would
like to sort the dimension member values. Select to sort the dimension’s key
values in ascending or descending order.
Sort Key #2
If Sort by Key is selected, select the second data cube name by which you
would like to sort the dimension member values. Select to sort the dimension’s
key values in ascending or descending order.
Sort Key #3
If Sort by Key is selected, select the third data cube name by which you would
like to sort the dimension member values. Select to sort the dimension’s key
values in ascending or descending order.
Viewing Additional Cube Collection Dimension Properties
The Dimensions tab displays additional properties that you have set for the dimensions in a cube collection.
Select the cube collection that contains the dimensions whose properties you want to view, and then select the
Dimensions tab.
Copyright © 1988-2007, Oracle. All rights reserved.
61
Creating Cube Collections
Chapter 7
Dimensions tab
62
Dimension
Displays the name of the dimension.
Persist Aggregate
Displays any aggregates that are persisted for the dimension.
Filter
Displays the filter formula that is applied to the dimension.
Sort Type
Displays the sort type that is applied to the dimension’s values.
Sort #1
If the dimension values are sorted by key, displays the first key field by which
the dimension member values are sorted.
Sort #1 Order
If the dimension member values are sorted by the first key, displays whether
the sort is by ascending or descending order.
Sort #2
If the dimension member values are sorted by key, displays the second key
field by which the dimension member values are sorted.
Sort #2 Order
If the dimension member values are sorted by a second key, displays whether
the sort is by ascending or descending order.
Sort #3
If the dimension member values are sorted by key, displays the third key field
by which the dimension member values are sorted.
Sort #3 Order
If the dimension member values are sorted by key, displays whether the sort is
by ascending or descending order.
Copyright © 1988-2007, Oracle. All rights reserved.
CHAPTER 8
Creating Explicit Dimension Sets
This chapter provides overviews of explicit dimension sets, and implicit tuples and explicit tuples, and discusses how
to define explicit dimension sets.
See Also
Chapter 9, “Creating Hierarchies,” Understanding the Calculation of Aggregate Data, page 78
Understanding Explicit Dimension Sets
You create an explicit dimension set to form a distinct group of an analytic model’s dimensions. Explicit
dimension sets improve the calculation efficiency of multidimensional data cubes. You can create one or more
explicit dimension sets within an analytic model. Explicit dimension sets may contain completely different or
some of the same dimensions as one another. The analytic calculation set instantiates valid combinations of
members called explicit tuples from explicit dimension sets.
See Chapter 8, “Creating Explicit Dimension Sets,” Understanding Implicit Tuples and Explicit Tuples,
page 66.
A model can contain explicit dimension supersets and explicit dimension subsets. An explicit dimension
superset is a set of dimensions that contains the same dimensions as its subset; however, the superset contains
one or more dimensions than its subset. A subset is the inverse of a superset: it contains the same dimensions
as its superset; however, the subset contains one or more fewer dimensions than its superset. An analytic
model can contain multiple supersets and subsets.
Explicit dimension sets are applied to individual data cubes when calculating data, and are also used for
exporting data. To determine which explicit dimension set it uses on a data cube, the analytic calculation
engine first reads which dimensions are attached to the data cube, and then analyzes and iterates through the
explicit dimension sets in priority order. The set at the lowest numbered row in the Explicit Dimension Sets
dialog box receives the highest priority.
See Chapter 8, “Creating Explicit Dimension Sets,” Editing or Adding New Explicit Dimension Sets, page 68.
Note. Explicit dimension subsets must exist at a lower priority than their supersets. However, it is not
necessary for an explicit dimension subset to exist in the row directly beneath its superset. For example,
suppose that a superset exists in row 1. Its subset can be in row 3; it does not have to be in row 2. The explicit
dimension set in row 2 can contain dimensions that are not included in other explicit dimension sets.
Using the priority order, the analytic calculation engine matches the first explicit dimension set that has either
the same or fewer dimensions as are attached to the data cube, and then continues down the priority order for
the remaining dimensions. The analytic calculation engine uses single dimensions if any of these dimensions
remain unmatched after it has iterated through all explicit dimension sets.
For example, suppose these dimensions are attached to the OVERHEAD_COSTS data cube:
Copyright © 1988-2007, Oracle. All rights reserved.
63
Creating Explicit Dimension Sets
Chapter 8
• CHANNELS
• CUSTOMERS
• TAXES
• EXPENSES
• MONTHS
• PRODUCTS
• REGIONS
The analytic model contains these explicit dimension sets:
• SET_1: MONTHS, REGIONS (first priority)
• SET_2: TAXES, PRODUCTS (second priority)
• SET_3: CHANNELS, CUSTOMERS, PRODUCTS (third priority)
• SET_4: CHANNELS, CUSTOMERS (fourth priority)
• SET_5: TAXES, EXPENSES (fifth priority)
The analytic calculation engine iterates through the explicit dimension sets—beginning with SET_1—and then
continues down the priority order for the remaining dimensions, matching the following:
• SET_1: MONTHS, REGIONS (first priority)
• SET_2: TAXES, PRODUCTS (second priority)
• SET_4: CHANNELS, CUSTOMERS (fourth priority)
Example 1: Explicit Dimension Sets
This table lists an analytic model’s data cubes and their attached dimensions:
Data Cubes
SALES
Data Cube Formula (if any)
UNIT_SALES * UNIT_PRICE
Attached Dimensions
• PRODUCTS
• REGIONS
• MONTHS
UNIT_SALES
None (input cube)
• PRODUCTS
• REGIONS
• MONTHS
UNIT_PRICE
None (input cube)
• PRODUCTS
• REGIONS
• MONTHS
The company:
• Sells the hamburgers product in both the Africa and Asia regions during all months of the year.
• Sells the french fries product in the Africa region only during the summer months.
• Never sells the french fries product in the Asia region.
64
Copyright © 1988-2007, Oracle. All rights reserved.
Chapter 8
Creating Explicit Dimension Sets
If you do not create an explicit dimension set to calculate these data cubes, the analytic calculation engine
calculates the sales for all products in all regions during all months, even if some of these combinations are
not valid. In other words, the analytic calculation engine calculates the sales for french fries for all months
in Asia, even though the company does not sell french fries in Asia. Additionally, the analytic calculation
engine calculates the sales for french fries during all months in Africa, even though the company only sells
french fries in Africa during the summer.
In total, without using an explicit dimension set, the analytic calculation engine performs 48 calculations for
the SALES data cube:
(2 PRODUCTS * 2 REGIONS * 12 MONTHS)
The analytic calculation engine generates the value of 0 for each invalid member combination, taking valuable
time to do so. These invalid member values are:
• Not saved to the main record.
• Not displayed to end users in the application.
End users view invalid member combinations as blank cells.
To prevent this unneeded calculation of data, you should create an explicit dimension set consisting of the
PRODUCTS, REGIONS, and MONTHS dimensions. The analytic calculation engine uses this explicit
dimension set, plus the UNIT_SALES and UNIT_PRICE input data cubes, to determine the explicit tuples.
Using these tuples, the analytic calculation engine only calculates the necessary values.
Note. The analytic calculation engine uses the input cubes that comprise the relevant data cube’s formula
to instantiate the explicit tuples that it uses to calculate the data cube.
In total, the analytic calculation engine performs 27 calculations for the SALES data cube:
(1 PRODUCT * 2 REGIONS * 12 MONTHS) + (1 PRODUCT * 1 REGIONS * 3 MONTHS)
Example 2: Explicit Dimension Supersets and Subsets
An analytic model contains the SALES data cube. These dimensions are attached to this data cube:
• PRODUCTS
• REGIONS
• ORDER_ID
• BUSINESS_UNIT
• DEPT_ID
• EMPL_ID
You have defined these explicit dimension sets:
• SET_1: PRODUCTS, REGIONS, ORDER_ID (Priority 1).
• SET_2: PRODUCTS, REGIONS (Priority 2).
• SET_3: REGIONS, ORDER_ID (Priority 3).
• SET_4: DEPT_ID, EMPL_ID (Priority 4).
The explicit dimension subset (PRODUCTS, REGIONS) exists at a lower priority than its superset
(PRODUCTS, REGIONS, ORDER_ID). The subset is in row 2; the superset is in row 1. The analytic
calculation engine takes the cross product of the following to instantiate the valid combinations of dimension
members for the SALES data cube:
Copyright © 1988-2007, Oracle. All rights reserved.
65
Creating Explicit Dimension Sets
Chapter 8
• SET_1: PRODUCTS, REGIONS, ORDER_ID.
• SET_4: DEPT_ID, EMPL_ID.
• BUSINESS_UNIT dimension.
Understanding Implicit Tuples and Explicit Tuples
Implicit tuples are the combinations of members that are used to calculate a single data cube but do not
comprise an explicit dimension set.
Explicit tuples are the valid combinations of members that are instantiated from an explicit dimension set
and are instantiated from these sources:
• Data loaded from the database.
• Data loaded by using the SetData
• Other explicit tuples in explicit dimension supersets.
Example: Implicit Tuples
This table lists the field to which the BUSINESS_UNIT dimension is mapped. Empty cells indicate null values:
BUSINESS_UNIT field
US001
US002
This table lists the field to which the DEPARTMENT dimension is mapped.
DEPARTMENT field
DEPT1000
DEPT2000
DEPT3000
DEPT4000
In this example, departments 1000 and 2000 only exist in business unit US001, and departments 3000 and
4000 only exist in business unit US002.
If the BUSINESS_UNIT and DEPARTMENT dimensions do not comprise an explicit dimension set and both
dimensions are attached to the SALES data cube, the analytic calculation engine uses these implicit tuples to
calculate the SALES data cube:
(US001, DEPT1000),
(US001, DEPT2000) ,
66
Copyright © 1988-2007, Oracle. All rights reserved.
Chapter 8
Creating Explicit Dimension Sets
(US001,
(US001,
(US002,
(US002,
(US002,
(US002,
DEPT3000) ,
DEPT4000),
DEPT1000),
DEPT2000) ,
DEPT3000) ,
DEPT4000)
Example: Explicit Tuples
This example uses the same fields as the implicit tuples example.
If you create an explicit dimension set that includes the BUSINESS_UNIT and DEPARTMENT dimensions,
the analytic calculation engine uses these explicit tuples to calculate the SALES data cube:
(US001,
(US001,
(US002,
(US002,
DEPT1000),
DEPT2000) ,
DEPT3000) ,
DEPT4000)
Note. The analytic calculation engine also uses the input cubes that comprise the relevant data cube’s formula
to instantiate the explicit tuples that it uses to calculate the data cube.
Defining Explicit Dimension Sets
This section discusses how to:
• View explicit dimension set properties.
• Edit or add new explicit dimension sets.
Viewing Explicit Dimension Set Properties
Double-click the Parts branch in the part browser, and then select the Explicit Dimension Set tab.
Copyright © 1988-2007, Oracle. All rights reserved.
67
Creating Explicit Dimension Sets
Chapter 8
Explicit Dimension Set tab
Explicit Dimension Set
Displays the name of the explicit dimension set.
Dimensions
Displays the dimensions that are included in the explicit dimension set.
Editing or Adding New Explicit Dimension Sets
Perform one of these actions:
• To edit a preexisting explicit dimension set, double-click the name of the explicit dimension set on the
Explicit Dimension Set tab.
• To add a new explicit dimension set to an analytic model that does not yet contain any explicit dimension sets,
right-click the area at the bottom portion of the Explicit Dimension Set tab and select Add Dimension Set.
In either case, the Edit Explicit Dimension Set dialog box appears.
68
Copyright © 1988-2007, Oracle. All rights reserved.
Chapter 8
Creating Explicit Dimension Sets
Edit Explicit Dimension Set dialog box
Explicit Dimension Set
Enter or edit the name of the explicit dimension set.
Dimensions
Displays the dimensions in the explicit dimension set.
Add
If a row is currently selected, click this button to add a blank row beneath
the currently selected row. You can then click the blank row to select a
new dimension to add to the set.
If a row is not currently selected, click this button to add a blank row to the
bottom of the set. You can then click the blank row to add a new dimension
from the resulting drop-down list box.
Note. Explicit dimension subsets must exist at a lower priority than their
supersets. However, it is not necessary for an explicit dimension subset to
exist in the row directly beneath its superset. For example, if a superset exists
in row 1, its subset can be in row 3 (it does not have to be in row 2). The
explicit dimension set in row 2 can contain dimensions that are not included in
other explicit dimension sets.
Delete
Delete a blank row or dimension from the explicit dimension set.
Note. You must select a row before clicking Delete.
Copyright © 1988-2007, Oracle. All rights reserved.
69
Creating Explicit Dimension Sets
70
Chapter 8
Copyright © 1988-2007, Oracle. All rights reserved.
CHAPTER 9
Creating Hierarchies
This chapter provides overviews of the relationship of PeopleSoft trees to analytic models, BAM total members,
dimension members, the calculation of aggregate data, and the persistence of aggregate data, and discusses how to
work with overrides.
See Also
Enterprise PeopleTools 8.49 PeopleBook: PeopleSoft Tree Manager
Understanding the Relationship of PeopleSoft
Trees to Analytic Models
This section discusses:
• The purpose of PeopleSoft trees and analytic model hierarchies.
• PeopleCode usage with PeopleSoft trees and analytic models.
Purpose of PeopleSoft Trees and Analytic Model Hierarchies
PeopleSoft Analytic Calculation Engine uses trees to establish hierarchies of a dimension’s parent-child
relationships. PeopleSoft Analytic Calculation Engine uses these hierarchies to:
• Calculate and display aggregated data to end users.
• Enable end users to navigate through data by performing such actions as expanding and collapsing nodes.
• Enable end users to drill down and drill up through data.
It is important to understand that PeopleSoft trees and hierarchies differ in the following manner: You
create one tree for each dimension that requires a hierarchy; the analytic model uses that tree to create one
hierarchy for one dimension.
Before loading the analytic model into the analytic server, the application uses the AttachTree method to attach
the tree to its corresponding dimension. Next, the analytic model creates its own hierarchy by reading the
parent-child relationships that are defined by that tree. During the remainder of the user session, the analytic
model uses its own hierarchy, and no longer uses the original tree. For this reason, when the application adds a
new dimension member during runtime, the member is actually added to the analytic model’s hierarchy; the
original tree is not modified.
See Chapter 6, “Creating Dimensions,” Defining Dimension Properties, page 48.
Note. If a tree is not attached to a dimension, you can create a basic hierarchy for that dimension by specifying
a total member name for the dimension.
Copyright © 1988-2007, Oracle. All rights reserved.
71
Creating Hierarchies
Chapter 9
See Chapter 6, “Creating Dimensions,” Defining Dimension Properties, page 48.
You can use the Analytic Model Viewer to view the properties of the trees that you are using with your
analytic model.
See Chapter 14, “Viewing and Debugging Analytic Models,” Viewing Dimension Properties, page 239.
PeopleCode Usage with PeopleSoft Trees and Analytic Models
Use the AttachTree and DetachTree methods to work with PeopleSoft trees and analytic models.
AttachTree Method
Use the AttachTree method to:
• Attach a tree to its corresponding dimension.
PeopleSoft Analytic Calculation Engine attaches the tree to the dimension, and then creates and displays the
hierarchy.
• Make changes to the tree.
• Create a record that uses PSACETREEOVRD as a subrecord, then attach the new record to the dimension
members to associate the member override function to the hierarchy.
Be aware of these restrictions:
• Because the AttachTree method attaches a specific tree to an analytic model, the system throws an error if
the tree’s name, setID, or effective date is incorrect.
• You can attach only one tree to a dimension.
• If the analytic model is already loaded into an analytic server, the tree is not attached until the next time that
the analytic model is reloaded.
DetachTree Method
Use the DetachTree method to detach the tree from the dimension.
Note. If the application loads the analytic model after the tree is detached, the analytic model does not create a
hierarchy for the dimension.
Note. If the analytic model is already loaded into an analytic server, the DetachTree method is not applied to
the tree until the next time the application loads the analytic model.
Updating a Tree at Runtime
To update a tree at runtime, perform these steps:
1. Unload the analytic model.
See Enterprise PeopleTools 8.49 PeopleBook: PeopleCode API Reference, “Analytic Calculation
Engine Classes,” Unload.
2. Use the DetachTree method to detach the tree from the analytic model.
3. Use the AttachTree method’s parameters to update the tree with the changes.
72
Copyright © 1988-2007, Oracle. All rights reserved.
Chapter 9
Creating Hierarchies
Note. Be aware of the details start level and tree discard level before making any changes to the tree.
See Chapter 9, “Creating Hierarchies,” Purpose of Node Levels in Creating Hierarchies, page 76.
4. Reload the analytic model.
See Also
Enterprise PeopleTools 8.49 PeopleBook: PeopleCode API Reference, “Analytic Calculation Engine Classes,”
AttachTree
Enterprise PeopleTools 8.49 PeopleBook: PeopleCode API Reference, “Analytic Calculation Engine Classes,”
DetachTree
Understanding BAM Model Total Members
PeopleSoft Business Analysis Modeler (BAM) models often contain total members. A dimension in a BAM
model may contain a total member to provide a simple aggregation of the other members of that dimension.
If you want to convert a BAM 8.8 model into an analytic model, you must understand how PeopleSoft Analytic
Calculation Engine handles the total members from BAM models, and the relationship between BAM total
members and the hierarchies and dimension members of analytic models.
See Chapter 6, “Creating Dimensions,” Defining Dimension Properties, page 48.
Understanding Dimension Members
This section discusses:
• Types of dimension members.
• Purpose of node levels in creating hierarchies.
• Creation of new members at runtime.
Types of Dimension Members
PeopleSoft Analytic Calculation Engine contains many different types of dimension members. The type of
member that exists within a dimension is determined by:
• Whether a tree is attached to the dimension.
• The types of leaves or nodes that are mapped to the dimension members.
Note. Two dimension members should never share the same name unless one member is a detail member and
one member is an aggregate member.
Copyright © 1988-2007, Oracle. All rights reserved.
73
Creating Hierarchies
Chapter 9
Detail Members and Leaf Members
If a tree is not attached to a dimension, PeopleSoft Analytic Calculation Engine creates detail members for
each value of the field to which the dimension is mapped.
If a tree is attached to a dimension, PeopleSoft Analytic Calculation Engine creates detail members out of
the tree’s detail values to establish a dimension’s parent and child relationships (in a tree, detail values can
serve as children and parents).
See Enterprise PeopleTools 8.49 PeopleBook: PeopleSoft Tree Manager, “Introduction to PeopleSoft Tree
Manager,” Using Detail Values (Leaves).
Note. When detail values serve as parents, they are also referred to as detail nodes because they do not display
aggregated data. Instead, detail nodes usually display the key values of regular transactional tables.
When detail members serve as parents, they do not display aggregated data. Rather, they enable end users to
navigate through the hierarchy.
Be aware of these characteristics of detail members’ relationship to the main record:
• Detail member names are either read from the main record or generated from the tree’s data.
• Navigation related functions such as PREV, NEXT, and PREVSELF operate on detail member names
that are persisted in the main record.
These functions do not use trees to determine the order of members.
See Chapter 11, “Using Built-in Functions in Analytic Models,” PREV, page 182; Chapter 11, “Using
Built-in Functions in Analytic Models,” NEXT, page 175 and Chapter 11, “Using Built-in Functions in
Analytic Models,” PREVSELF, page 183.
A leaf member is a special type of detail member that does not have children.
For example, suppose an end user enters 2004–01–01 as a new detail value. PeopleSoft Analytic Calculation
Engine generates a new 2004–01–01 leaf member. This is a leaf member because its corresponding detail
value does not have any children.
Aggregate Members
Aggregate members are mapped to the nodes of a tree that have either children or leaf ranges. Aggregate
members display a grouping of data, rather than a specific discrete value.
For example, suppose an analytic model’s DATE dimension is mapped to a tree that contains 2004–01–01 as
a leaf node and Q12004 as a branch node. PeopleSoft Analytic Calculation Engine generates the Q12004
aggregate member out of the branch node.
The analytic calculation engine creates aggregate members out of any tree elements that remain after it
creates the hierarchy’s detail members.
Hierarchy Root Member
You can map the hierarchy root member to any node that you want to serve as the root of the hierarchy. All
sibling nodes or nodes at a higher level of the tree are not used to create the hierarchy. You map the hierarchy
root member by using the NodeName parameter of the AttachTree method.
Note. Only one hierarchy root member can exist per dimension.
Consider this example of a tree’s parent-child relationships:
74
Copyright © 1988-2007, Oracle. All rights reserved.
Chapter 9
Creating Hierarchies
GBL
Asia
India
Bangalore
Calcutta
Delhi
Mumbia
China
Beijing
Kashi
Lianyungang
Europe
Example of a tree’s parent-child relationships
Even though the highest level node is GBL, which is the root node of the tree, you can select the India node to
serve as the hierarchy root member for this dimension. When you create the hierarchy root member out of the
India node, only the children of India exist in the hierarchy.
If you have not attached a tree to the dimension, a hierarchy root member still exists for that dimension if
you specified a root member name for that dimension. If you have not attached a tree to the dimension
and you have not entered a value in the Total Member Name field, neither a hierarchy root member nor
a hierarchy exists for that dimension.
See Chapter 6, “Creating Dimensions,” Defining Dimension Properties, page 48.
Orphan Members
An orphan member is any member that does not map to a child of a parent node in the tree.
For each orphan member, PeopleSoft Analytic Calculation Engine:
• Adds each orphan member to the hierarchy root member.
Copyright © 1988-2007, Oracle. All rights reserved.
75
Creating Hierarchies
Chapter 9
• Adds each orphan member’s value to the hierarchy root value’s member.
• Generates a message with the ID of 123 and stores it in the Messages property for the analytic instance.
You must write PeopleCode to iterate over the messages in the analytic instance and search for message
123, and then take any necessary further action.
See Enterprise PeopleTools 8.49 PeopleBook: PeopleCode API Reference, “Analytic Calculation Engine
Classes,” Error Handling.
Blank Members
A blank member is a member that has no value. Blank members are created out of either an empty detail in a
tree or a null cell in the main record. To create blank members:
• When the analytic model learns of a new empty detail in the tree, it adds the blank member to the appropriate
parent member.
• When the analytic model learns of a null cell in the main record, it adds the blank member as a child
of the hierarchy root.
• When the AddMember method adds a member with a blank member name ( “ ”), a blank member is added as
a child of the hierarchy root.
Note. When blank members are mapped to date fields, they are written to the database as values of 1/1/1900.
See Also
Chapter 10, “Creating Rules, Formulas, and User Functions,” Understanding the Elements of Rules, page 120
Purpose of Node Levels in Creating Hierarchies
Use node levels to create leaf, detail, and aggregate members out of tree nodes and leaves. Use the parameters
of the AttachTree method to set the node levels.
Details Start Level
The details start level determines the type of dimension members that PeopleSoft Analytic Calculation Engine
creates out of the nodes and leaves of a tree. Use either the parameters of the AttachTree method or the
Analytic Instance Load/Unload page to set the details start level. The details start level is a required parameter.
The default value is 0. The root level is 1.
See Enterprise PeopleTools 8.49 PeopleBook: System and Server Administration, “Managing Analytic
Servers,” Loading and Unloading Analytic Instances.
Note. If you specify a nonzero details start level, you must specify the strictly enforced method to the tree
in PeopleSoft Tree Manager. The strictly enforced method ensures that all members that are created out
of one level are created as the same member type.
See Enterprise PeopleTools 8.49 PeopleBook: PeopleSoft Tree Manager, “Creating Trees,” Defining Basic
Attributes.
This table describes the members that PeopleSoft Analytic Calculation Engine creates, depending on whether
the details start level is specified:
76
Copyright © 1988-2007, Oracle. All rights reserved.
Chapter 9
Creating Hierarchies
Details Start Level
Specified?
Value > 0
Leaf Members
PeopleSoft Analytic
Calculation Engine creates
leaf members out of any
detail values that are at the
far right of the tree.
Detail Members
Aggregate Members
PeopleSoft Analytic
Calculation Engine creates
detail members out of any
detail values or nodes that
are located either within
the specified details start
level, or within a level that is
lower (higher number) than
the details start level.
PeopleSoft Analytic
Calculation Engine creates
aggregate members out of
any aggregate nodes that are
located within a level that is
higher than the details start
level.
If you specify the root
level as the details start
level, PeopleSoft Analytic
Calculation Engine creates
detail members out of all
nodes in the tree.
Note. PeopleSoft Analytic
Calculation Engine cannot
create aggregate members
out of nodes that are at a
lower level than the details
start level.
Note. PeopleSoft Analytic
Calculation Engine cannot
create detail members out
of detail values that are at a
higher level than the details
start level.
Note. Do not specify a
details start level that is
equal to lower than the tree
discard level.
Value = 0
Note. When the value = 0,
the details start level is not
specified.
PeopleSoft Analytic
Calculation Engine creates
leaf members out of the
detail values that are located
at the far right of the tree.
PeopleSoft Analytic
Calculation Engine creates
detail members out of all
leaf members.
PeopleSoft Analytic
Calculation Engine creates
aggregate members out of
any nodes from which it has
not created leaf members.
Tree Discard Level
The tree discard level determines the level from which PeopleSoft Analytic Calculation Engine does not attach
any more of the tree to the dimension. Use either the parameters of the AttachTree method or the Analytic
Instance Load/Unload page to set the tree discard level.
See Enterprise PeopleTools 8.49 PeopleBook: System and Server Administration, “Managing Analytic
Servers,” Loading and Unloading Analytic Instances.
PeopleSoft Analytic Calculation Engine does not create members out of nodes or leaves that are either at this
level or lower than this level. You must specify a details start level to every tree for which you want to specify
a tree discard level. The default value is 0. If the tree discard level is anything other than Level 0, then the
tree discard level must be at a lower level than the details start level.
The analytic calculation engine ignores the tree discard level if:
• The details start level is 0.
• The tree discard level is either equal to or higher than the details start level.
Copyright © 1988-2007, Oracle. All rights reserved.
77
Creating Hierarchies
Chapter 9
Creation of New Members at Runtime
PeopleSoft Analytic Calculation Engine can create new dimension members during runtime by using:
• Data from the main record.
• Application data that is added at runtime.
Relationship of Leaf Ranges to New Members
If you map a dimension to a tree that includes leaf ranges, PeopleSoft Analytic Calculation Engine adds a new
dimension member to the appropriate parent in the hierarchy when the application adds a new leaf that falls
within a leaf range of the tree. Use the AddMember method to add new members to the dimension.
Note. PeopleSoft Analytic Calculation Engine ignores any new leaves that do not fall within the values of a
leaf range.
For example, suppose a tree contains a node called 2003Q1 that includes a leaf range of 2003-01-01 to
2003-03-31. During runtime, PeopleSoft Analytic Calculation Engine reads the main record data and
recognizes that the application has added 2003–02–04 as a new leaf that exists within the 2003Q1 leaf
range. PeopleSoft Analytic Calculation Engine creates the 2003–02–04 member and adds it as a child to the
2003Q1 member.
Understanding the Calculation of Aggregate Data
This section discusses:
• Dimension order impact on calculation.
• Logic for determining the order of members.
See Also
Chapter 9, “Creating Hierarchies,” Understanding Override Order of Precedence, page 82
Dimension Order Impact on Calculation
The order of dimensions in the analytic model determines which member the analytic calculation engine uses
to calculate the data cube aggregate value that exists at an intersection of two or more aggregate members.
When evaluating the data cube’s value at this intersection, the analytic calculation engine uses the aggregate
member of the dimension that appears as first in the order of dimensions in the part browser.
See Chapter 9, “Creating Hierarchies,” Example: Creating Overrides, page 91.
See Also
Chapter 6, “Creating Dimensions,” Changing the Order of Dimensions in the Part Browser, page 51
Logic for Determining the Order of Members
User functions often refer to dimension members to calculate data cubes. For this reason, you must understand
the factors that affect the way in which the analytic calculation engine orders dimension members:
78
Copyright © 1988-2007, Oracle. All rights reserved.
Chapter 9
Creating Hierarchies
Note. This section describes the member order as it exists within the analytic calculation engine. This internal
order may differ from the member order that is ultimately displayed to the end user.
• If the dimension is mapped to a tree, the analytic calculation engine first determines the member order by the
order of the detail values in the tree.
Next, the analytic calculation engine determines the member order from the order of the values as they
exist in the database.
For example, suppose a dimension is attached to a GBL tree and uses the United Kingdom node as its
hierarchy root member. This node contains detail values in this order: Cardiff, Liverpool, London,
Manchester. This dimension is also mapped to the UNITED_KINGDOM field in the database, which
contains the Edinburgh and Glasgow values. The analytic calculation engine creates this member order
in the hierarchy:
1. Cardiff
2. Liverpool
3. London
4. Manchester
5. Edinburgh
6. Glasgow
Note. The next time the analytic calculation engine creates these members (for example, when the
application loads the analytic model), the analytic calculation engine employs the existing member
order, even if it recognizes a new database value that matches the name of an existing member.
For example, suppose the analytic model has already established the above hierarchy before the
application adds the Manchester value to the UNITED_KINGDOM field. When the application
reloads the analytic model, the member order in this hierarchy remains; for this reason, Manchester
retains its fourth member position.
• If the dimension is not mapped to a tree, the member order is determined by the order of the members’ values
as they exist in the field that is mapped to the dimension.
Understanding the Persistence of Aggregate Data
This section discusses:
• Persistence of aggregate and detail data.
• Aggregate record properties.
• Pushed down data.
• Data type considerations.
Persistence of Aggregate and Detail Data
Assuming that you selected a main record and aggregate record in the cube collection, PeopleSoft Analytic
Calculation Engine uses these records to persist aggregate data and detail data:
Copyright © 1988-2007, Oracle. All rights reserved.
79
Creating Hierarchies
Chapter 9
• Tree data.
Tree data includes:
- Aggregate data:
PeopleSoft Analytic Calculation Engine persists aggregate data in the aggregate record.
See Chapter 9, “Creating Hierarchies,” Understanding the Persistence of Aggregate Data, page 79.
Note. Records that are used as aggregate records should be read after records that are used as main records.
See Chapter 12, “Understanding the Relationship of Analytic Types to Analytic Models,” Synchronization
Order, page 208.
- Pushed down data.
PeopleSoft Analytic Calculation Engine creates detail data out of pushed down aggregate data. For this
reason, PeopleSoft Analytic Calculation Engine persists this data in the main record.
See Chapter 9, “Creating Hierarchies,” Pushed Down Data, page 80.
• Detail data.
Detail data is data that cannot be broken down any further. PeopleSoft Analytic Calculation Engine persists
detail data to the main record.
A detail member is generated out of one value of detail data in the database.
Aggregate Record Properties
On a case-by-case basis, you must determine which aggregates you want to save for each dimension in the
cube collection. You may select either ALL, NONE, or ROOT in the Persist Aggregate field of the Edit Cube
Collection Dimension dialog box. Here are explanations for these selections:
• ALL: Select to persist all of the dimension member aggregate values to the database.
• NONE: Select to persist none of the dimension member aggregate values to the database.
• ROOT: Select to persist only the value of the hierarchy root member to the database.
See Chapter 7, “Creating Cube Collections,” Defining Additional Cube Collection Dimension Properties,
page 60.
Pushed Down Data
Sometimes a parent member in a hierarchy may contain aggregate data that is not derived by aggregating the
parent member’s children. When this is the case, you may want to break down the parent member’s value to
generate the detail data for the parent member’s children. You create user functions that employ the PARENT,
CHILDCOUNT, and FORCHILDREN built-in functions to push down aggregate data.
These user function examples push down parent member data:
AT (DIMENSION, Parent(DIMENSION), THISCUBE() * 0.2)
And:
AT (DIMENSION, Parent(DIMENSION), THISCUBE() / CHILDCOUNT(DIMENSION, #DIRECT))
80
Copyright © 1988-2007, Oracle. All rights reserved.
Chapter 9
Creating Hierarchies
See Also
Chapter 11, “Using Built-in Functions in Analytic Models,” PARENT, page 179
Chapter 11, “Using Built-in Functions in Analytic Models,” CHILDCOUNT, page 145
Chapter 11, “Using Built-in Functions in Analytic Models,” FORCHILDREN, page 156
Data Type Considerations
Aggregate members can have different data types than their child detail members, even though they both
display data for the same dimension. When this is the case, you must reconcile the situation if you want to
persist aggregates.
For example, suppose the PRODUCTS dimension is mapped to a numeric field in the main record and
contains members from this tree:
ALL_PRODUCTS
Release Less than 8
<Leaf Range (Low = 0, High= 799)
Release 8
<Leaf Range (Low = 800, High= 899)
Notice that the Release 8 member is not totally numeric; instead, it is a string that contains letters and a
number. If the detail value 846 is added to the tree, the member 846 (which is numeric) is added to the parent
member Release 8 (which is a string). To reconcile this situation, you should persist the aggregates for this
dimension to a field with a data type of String and a length of at least 20.
Note. It is not necessary for the main record’s fields to have the same data types as the aggregate record’s fields.
Working with Overrides
This section provides overviews of default aggregation, override order of precedence, and the
PSACETREEOVRD subrecord and discusses how to:
• Use default aggregation.
• Create overrides.
• Create a hierarchy with mixed aggregate and detail members.
Understanding Default Aggregation
By default, PeopleSoft Analytic Calculation Engine sums all of the values of a parent member’s direct children
to calculate the value of the parent member. PeopleSoft Analytic Calculation Engine executes this default
aggregation by iterating over all child members and applying the plus operator. The default aggregation
operates on all children, even if the child member itself is an aggregate value.
Note. This default aggregation is not used if you specified a cube dimension override user function, a member
override user function, a dimension override user function, or do not have any aggregates in the relevant part
of the analytic model.
This is an example of PeopleSoft Analytic Calculation Engine’s default aggregation:
Copyright © 1988-2007, Oracle. All rights reserved.
81
Creating Hierarchies
2003
Chapter 9
(170)
Q1 (80)
Jan (10)
Feb (20)
Mar (50)
Q2 (90)
Apr
(20)
May
(30)
Jun
(40)
In this example, 2003, Q1, and Q2 are non-leaf members—that is, aggregates. The numbers in parentheses to
the right of the aggregate members represent their aggregate values. The numbers in parenthesis to the right
of the nonaggregate members represent their nonaggregated values.
Understanding Override Order of Precedence
You must understand default aggregation and the order of precedence that the analytic calculation engine uses
to override the default aggregation. When calculating aggregate members, PeopleSoft Analytic Calculation
Engine begins with the most specific override available, and then proceeds to more general overrides. The
analytic calculation engine uses this order of precedence to evaluate aggregate members:
1. If the dimension does not contain any aggregate members, use the data cube’s formula.
If the dimension does contain aggregate members, perform one of these actions:
• If aggregate calculation is not enabled for the data cube, do not perform any more calculation
of aggregates.
Note. The analytic calculation engine generates an error when the analytic model is loaded.
• If Calculate Aggregates is selected for the data cube, perform Step 2.
2. Perform one of these actions:
Note. In either of these cases, the analytic calculation engine loads initial values from the aggregate
record when the analytic model is loaded, but overwrites the initial values upon recalculation.
• Use the cube dimension override user function if it exists.
This override operates on all of a dimension’s aggregate members for the dimension as it is attached
to a specific data cube.
For example, you can create one cube dimension user function to operate on the PRODUCTS
dimension when it is attached to the SALES data cube, and another cube dimension user function to
operate on the PRODUCTS dimension when it is attached to the COST_OF_GOODS data cube.
To set a cube dimension override user function, create a user function in the analytic model, and
then select the user function in the Aggregate Rule column in the Dimensions tab of the data cube’s
properties.
• If the cube dimension user function does not exist, perform Step 3.
3. Perform one of these actions:
82
Copyright © 1988-2007, Oracle. All rights reserved.
Chapter 9
Creating Hierarchies
• Use the member override user function.
This override operates on specific members of a dimension. You create the member override user
function in the analytic model. However, because members are often instantiated at runtime, you use
the PSACETREEOVRD subrecord to assign the member override user function to the dimension
rather than assign the member override user function to specific members within the analytic model.
For example, if the end user enters aggregate data, you can write a member override function that
uses the INPUT built-in function to capture the user input, and use the PARENT and CHILDCOUNT
built-in functions to push down the aggregate data and create new members. Then you can assign the
member override user function to the appropriate dimension in the PSACETREEORRD subrecord.
Note. If the member override user function does not contain a value, PeopleSoft Analytic Calculation
Engine applies the default aggregation (the plus operator) to the dimension members.
• If the member override function does not exist, perform Step 4.
4. Perform one of these actions:
• Use the dimension override function.
The analytic calculation engine uses this override user function to calculate all of a dimension’s
aggregates as they apply to all dimensions.
For example, suppose you create a dimension override function for the PRODUCTS dimension. If
this dimension is attached to both the SALES and COST_OF_GOODS dimensions, the dimension
override function applies to the aggregates for both data cubes.
To set a dimension override user function, create a user function and select the user function in the
Aggregate Function field of the dimension’s properties.
Note. This override function does not apply to leaf members or detail members.
• If the dimension override function does not exist, perform Step 5.
5. Aggregate the values of the child members by using the operators that are attached to each child.
The analytic calculation engine iterates over each value to evaluate the aggregate.
The default operator for each member is the plus operator.
You set the operators in the OPERATION field of the PSACETREEOVRD subrecord. When the
default sum operator is used, the actual value in the OPERATION field is null.
If you do not want to use the default sum aggregation, you can populate the OPERATION field with
one of these values:
• MIN.
Use this value for the analytic calculation engine to use subtraction aggregation. The analytic
calculation engine iterates over each member and applies the subtraction operator to each iteration.
The aggregate value is the resulting value after the final iteration.
• IGN.
Use this value for the analytic calculation engine to ignore the OPERATION field.
Copyright © 1988-2007, Oracle. All rights reserved.
83
Creating Hierarchies
Chapter 9
See Also
Chapter 9, “Creating Hierarchies,” Example: Using Default Aggregation, page 84
Chapter 9, “Creating Hierarchies,” Example: Creating a Hierarchy with Mixed Aggregate and Detail
Members, page 109
Understanding the PSACETREEOVRD Subrecord
You use the PSACETREEOVRD subrecord to assign an override to a tree. To use the subrecord, you must first
create a record definition. This record definition can contain additional fields. After you create the record
definition, insert the PSACETREEOVRD subrecord into the record definition.
To attach the PSACETREEOVRD subrecord to a tree, specify the name of the override record as the
RecordName parameter of the AttachTree method.
This table describes the PSACETREEOVRD:
Field Name
Description
Possible Values
TREE_NAME
The name of the tree that contains the
node to override.
DEPT_TREE
SET_ID
The setID of the tree.
123
EFFDT
The effective date of the tree.
12/1/03
TREE_NODE
The name of the dimension member on GBL
which the override should operate.
ACERULEID
The name of the user function to apply
as an override. This field can be null
because it can be reused.
USER_FUNCTION_NAME
OPERATION
Add, subtract, or ignore this entry
when aggregating a parent member.
MIN, IGN
Note. The default value in the
OPERATION field is null, causing
the analytic calculation engine to
use the sum operator for aggregating
members. Other possible values in
the table are MIN for subtraction
aggregation and IGN for ignore.
Note. The PSACETREEOVRD subrecord must contain a value in either or both of the OPERATION or
ACERULEID fields. If both of these fields are null, the analytic calculation engine ignores the row.
Example: Using Default Aggregation
This section provides an example of how to create an analytic model that uses default aggregation.
Requirements for Analytic Model
This table provides an example of a table named MainData, which you specified as the main record of a
cube collection:
84
Copyright © 1988-2007, Oracle. All rights reserved.
Chapter 9
Creating Hierarchies
DEPT field
Data Type: Number
SOMEDATE field
Data type: Date
NUM_SALES field
Data Type: Number
PRICE_PER_UNIT field
Data Type: Number
101
2004–01–01
1
10
102
2004–01–02
2
14
103
2004–01–01
4
15
201
2004–01–01
8
20
202
2004–02–01
16
23
You want the analytic model to:
• Calculate aggregates for the NUM_SALES field.
• Save the aggregates for the NUM_SALES field.
• Establish hierarchies for the DEPT and SOMEDATE dimensions.
• Refrain from calculating aggregates for the PRICE_PER_UNIT field.
• Save all aggregates for the DEPT dimension.
• Refrain from saving aggregates for the SOMEDATE dimension.
Creating the Aggregates
To fulfill the requirements of the analytic model, perform these steps:
1. Create these dimensions:
• DEPARTMENT
• DATE
2. Create these data cubes:
• SALES
• PRICE_PER_UNIT
3. Enable the Calculate Aggregates field for the SALES data cube, because you want to calculate
aggregates for this data cube.
4. Ensure that the Calculate Aggregates field is disabled for the PRICE_PER_UNIT data cube, because
you do not want to calculate aggregates for this data cube.
5. Create a cube collection called SALES.
6. Select MainData as the main record for the SALES cube collection.
7. Map the data cubes and dimensions within the SALES cube collection to fields in the main record.
This table provides the mappings:
Data Cube or Dimension to Map
DEPARTMENT dimension
Field in Main Record
DEPARTMENT field
Data type: Number
Copyright © 1988-2007, Oracle. All rights reserved.
85
Creating Hierarchies
Chapter 9
Data Cube or Dimension to Map
SOMEDATE dimension
Field in Main Record
SOMEDATE field
Data type: Date
SALES data cube
NUM_SALES field
Data type: Number
PRICE_PER_UNIT data cube
PRICE_PER_UNIT field
Data type: Number
8. Select the AGGRDATE record as the aggregate record.
The AGGRDATE database record currently contains no data. This table describes the fields within
the record:
Field Name
Data Type
DEPARTMENT
String
TREE_DATE
String
NUM_SALES
Number
Notice that even though the DEPARTMENT and TREE_DATE fields are of the String data type, none
of the main record’s fields are of this same data type. The DEPARTMENT and TREE_DATE fields are
of the String data type because the hierarchy’s members display strings, not dates or numbers. The
data types of the aggregate record’s fields must match the data types and lengths of the hierarchy’s
aggregate members. However, the data types of the aggregate record’s fields do not need to match the
data types of the main record’s fields.
Note. If you design a tree’s nodes so that the fields of the nodes are of the same data type as the
fields of the detail members, you can use the same data type for both the dimension’s aggregate
record fields and main record fields.
9. Map dimensions and data cubes to fields in the aggregate record.
This table provides the mappings:
Data Cube or Dimension to Map
Field in Aggregate Record
DEPARTMENT dimension
DEPARTMENT field
SOMEDATE dimension
TREE_DATE field
SALES data cube
NUM_SALES field
10. Use PeopleSoft Tree manager to create two trees.
Note. In the two tables, italicized children represent detail values. Remember, PeopleSoft Analytic
Calculation Engine creates detail members out of the tree’s detail values to establish a dimension’s
parent-child relationships (in a tree, detail values can serve as children and parents).
86
Copyright © 1988-2007, Oracle. All rights reserved.
Chapter 9
Creating Hierarchies
• DEPT_TREE
Parents
Children
(no parent —root)
GBL
GBL
US
GBL
LAT AM
US
101
US
102
US
103
LAT AM
201
LAT AM
202
• DATE_TREE
Parents
Children
(no parent — root)
CAL2004
CAL2004
JAN
CAL2004
FEB
JAN
2004–01–01
JAN
2004–01–02
FEB
2004–02–01
11. Consider these scenarios for default sum aggregation:
• If you select to persist all aggregates of both dimensions on the Dimensions tab of the cube
collection’s properties, the following rows are persisted in the aggregate record:
Note. Italicized values are the actual persisted aggregate members. Zero (0) values in this table are
not persisted. The Fully Qualified Member Name field is not a database value.
Fully Qualified Member Name
GBL
DEPARTMENT
TREE_DATE
NUM_SALES
GBL
2004–01–01
13
GBL
2004–01–02
2
GBL
2004–02–01
16
CAL2004.JAN. 2004–01–01
GBL
CAL2004.JAN.2004–01–02
GBL
CAL2004.FEB.2004–02–01
Copyright © 1988-2007, Oracle. All rights reserved.
87
Creating Hierarchies
Chapter 9
Fully Qualified Member Name
GBL.US
DEPARTMENT
TREE_DATE
NUM_SALES
US
2004–01–01
5
US
2004–01–02
2
US
2004–02–01
0
LAT AM
2004–01–01
8
LAT AM
2004–01–02
0
LAT AM
2004–02–01
16
101
CAL2004
1
102
CAL2004
2
103
CAL2004
4
201
CAL2004
8
202
CAL2004
16
101
JAN
1
102
JAN
2
103
JAN
4
CAL2004.JAN.2004–01–01
GBL.US
CAL2004.JAN.2004–01–02
GBL.US
CAL2004.FEB.2004–02–01
GBL.LAT AM
CAL2004.JAN.2004–01–01
GBL.LAT AM
CAL2004.JAN.2004–01–02
GBL.LAT AM
CAL2004.FEB.2004–02–01
GBL.US.101
CAL2004
GBL.US.102
CAL2004
GBL.US.103
CAL2004
GBL LAT AM.201
CAL2004
GBL LAT AM.202
CAL2004
GBL.US.101
CAL2004.JAN
GBL.US.102
CAL2004.JAN
GBL.US.103
CAL2004.JAN
88
Copyright © 1988-2007, Oracle. All rights reserved.
Chapter 9
Creating Hierarchies
Fully Qualified Member Name
GBL.LAT AM.201
DEPARTMENT
TREE_DATE
NUM_SALES
201
JAN
8
202
JAN
0
101
FEB
0
102
FEB
0
103
FEB
0
201
FEB
0
202
FEB
16
GBL
CAL2004
31
GBL
JAN
15
GBL
FEB
16
US
CAL2004
7
US
JAN
7
US
FEB
0
LAT AM
CAL2004
24
CAL2004.JAN
GBL.LAT AM.202
CAL2004.JAN
GBL.US.101
CAL2004.FEB
GBL.US.102
CAL2004.FEB
GBL.US.103
CAL2004.FEB
GBL. LAT AM.202
CAL2004.FEB
GBL. LAT AM.203
CAL2004.FEB
GBL
CAL2004
GBL
CAL2004.JAN
GBL
CAL2004.FEB
GBL.US
CAL2004
GBL.US
CAL2004. JAN
GBL.US
CAL2004.FEB
GBL.LAT AM
CAL2004
Copyright © 1988-2007, Oracle. All rights reserved.
89
Creating Hierarchies
Chapter 9
Fully Qualified Member Name
GBL.LAT AM
DEPARTMENT
TREE_DATE
NUM_SALES
LAT AM
JAN
8
LAT AM
FEB
16
CAL2004.JAN
GBL. LAT AM
CAL2004.FEB
• If you select to persist all aggregates of the DEPT_TREE dimension and to persist none of the
aggregates of the DATE_TREE dimension on the Dimensions tab of the cube collection’s properties,
the following rows are persisted in the aggregate record:
Note. Italicized values are the actual persisted aggregate members. Zero (0) values in this table not
persisted. The Fully Qualified Member Name field is not a database value.
Fully Qualified Member Name
GBL
DEPARTMENT
TREE_DATE
NUM_SALES
GBL
2004–01–01
13
GBL
2004–01–02
2
GBL
2004–02–01
16
US
2004–01–01
5
US
2004–01–02
2
US
2004–02–01
0
LAT AM
2004–01–02
8
LAT AM
2004–01–02
0
LAT AM
2004–02–01
16
CAL2004.JAN. 2004–01–01
GBL
CAL2004.JAN.2004–01–02
GBL
CAL2004.FEB.2004–02–01
GBL.US
CAL2004.JAN.2004–01–01
GBL.US
CAL2004.JAN.2004–01–02
GBL.US
CAL2004.FEB.2004–02–01
GBL.LAT AM
CAL2004.JAN.2004–01–02
GBL.LAT AM
CAL2004.JAN.2004–01–02
GBL.LAT AM
2004–02–01
90
Copyright © 1988-2007, Oracle. All rights reserved.
Chapter 9
Creating Hierarchies
• If you select to persist only the root aggregations of the DEPT_TREE dimension and to persist none
of the aggregates of the DATE_TREE dimension on the Dimensions tab of the cube collection’s
properties, the following rows are persisted in the aggregate record:
Note. Italicized values are the actual persisted aggregate members. The Fully Qualified Member
Name field is not a database value.
Fully Qualified Member Name
DEPARTMENT
GBL
TREE_DATE
NUM_SALES
GBL
2004–01–01
13
GBL
2004–01–02
2
GBL
2004–02–01
16
CAL2004.JAN. 2004–01–01
GBL
2004–01–02
GBL
2004–02–01
Example: Creating Overrides
This section provides an example of creating overrides and discusses the affect of dimension order on
calculation.
The following table describes the three dimensions used in this example. The first column lists the names
of the dimensions. The second column lists the dimension order, which determines calculation priority.
The third column lists the dimension override functions that are used if member override functions do not
exist for the children of the parents in the dimension:
Dimension
Dimension Order/Priority
Dimension Override User
Function
ACCT
1
<ACCT_DIM_DEFAULT_
FORMULA>
TRANS_DATE
2
<NONE>
DEPT
3
<DEPT_DIM_DEFAULT_
FORMULA>
The following table describes the hierarchy of the ACCT dimension that is associated with the AcctTree tree.
The first column lists the parents in the hierarchy. The second column lists the children of the parents. The
third column lists the member override user functions that are performed on each child.
Note. Overrides are not performed on cells denoted (leaf) or <none>.
Parent
Child
Member Override User
Function
100
110
<SALES_ACCT_SUM>
100
110
<DIRECTOR_ACCT_SUM>
Copyright © 1988-2007, Oracle. All rights reserved.
91
Creating Hierarchies
Chapter 9
Parent
Member Override User
Function
Child
100
120
<none>
110
111
(leaf)
110
112
(leaf)
120
121
(leaf)
The following table describes the hierarchy of the TRANS_DATE dimension that is associated with the
QrtrlyTree tree. The first column lists the parents in the hierarchy. The second column lists the children of the
parents. The third column lists the member override user functions that are performed on each child.
Note. Overrides are not performed on cells denoted (leaf) or <none>.
Parent
Member Override User
Function
Child
Q1
Q1
<none>
Q1
Jan
(leaf)
Q1
Feb
(leaf)
Q1
Mar
(leaf)
The following table describes the hierarchy of the DEPT dimension that is created from the DeptTree tree. The
first column lists the parents in the hierarchy. The second column lists the children of the parents. The third
column lists the member override user functions that are performed on each child.
Note. Overrides are not performed on cells denoted (leaf) or <none>.
Note. This example uses the <RED_HERRING> child node override as incorrect data. Leaf nodes do not
have aggregations.
Parent
92
Member Override User
Function
Child
GBL
GBL
<SOME_DEPT_AVG>
GBL
USA
<none>
GBL
EUR
<none>
USA
CA
(leaf)
USA
GA
(leaf)
USA
NY
(leaf)
Copyright © 1988-2007, Oracle. All rights reserved.
Chapter 9
Creating Hierarchies
Parent
Member Override User
Function
Child
USA
TX
<RED_HERRING>
USA
IL
(leaf)
Assume that a SALES data cube exists in the cube collection, and the three dimensions of this example
are attached to this data cube.
Read the instructions carefully before analyzing the following table; the table describes two methods that the
analytic calculation engine can use to calculate hierarchies.
• When you analyze only the first four columns of the table (ignore the fifth column), the basic analytic model
does not contain any cube dimension overrides.
The first column displays the row numbers. The second, third, and fourth columns list the members of
each of the three dimensions.
• When you analyze all five rows of the table, the basic analytic model does contain cube dimension overrides.
The first column displays the row numbers. The second, third, and fourth columns list the members of each
of the three dimensions. The fifth column-where it applies-lists the override that the analytic calculation
engine uses to calculate the row.
For example, if the developer applies the SALES_CUBE_OVERRIDE cube dimension override to the
TRANS_DATE dimension as it is attached to the SALES data cube, the Cube Dimension Override User
Function column indicates where the override is applied.
Italicized values in the table indicate aggregate members. A row may contain more than one aggregate
member. If a row contains one or more aggregate members, the table denotes the winning aggregate member
along with the method that the analytic calculation engine uses to calculate the member. If a row does not
contain any aggregate members, the analytic calculation engine uses the data cube’s rule to calculate values.
Row
1
TRANS_DATE
Dimension
Members
Priority 2
ACCT Dimension
Member
Priority 1
Winning aggregate:
DEPT Dimension
Members
Priority 3
Cube
Dimension
Override User
Function
Q1
USA
NA
Q1
CA
NA
100
Use member override
user function:
USA <SALES_
ACCT_SUM>
2
Winning aggregate:
100
Use member override
user function:
USA <SALES_
ACCT_SUM>
Copyright © 1988-2007, Oracle. All rights reserved.
93
Creating Hierarchies
Row
3
Chapter 9
TRANS_DATE
Dimension
Members
Priority 2
ACCT Dimension
Member
Priority 1
Winning aggregate:
DEPT Dimension
Members
Priority 3
Cube
Dimension
Override User
Function
Q1
NY
NA
Q1
TX
NA
Jan
USA
NA
Jan
CA
NA
Jan
NY
NA
100
Use member override
user function:
USA <SALES_
ACCT_SUM>
4
Winning aggregate:
100
Use member override
user function:
USA <SALES_
ACCT_SUM>
5
Winning aggregate:
100
Use member override
user function:
USA <SALES_
ACCT_SUM>
6
Winning aggregate:
100
Use member override
user function:
USA <SALES_
ACCT_SUM>
7
Winning aggregate:
100
Use member override
user function:
USA <SALES_
ACCT_SUM>
94
Copyright © 1988-2007, Oracle. All rights reserved.
Chapter 9
Creating Hierarchies
Row
8
TRANS_DATE
Dimension
Members
Priority 2
ACCT Dimension
Member
Priority 1
Winning aggregate:
DEPT Dimension
Members
Priority 3
Cube
Dimension
Override User
Function
Jan
TX
NA
Feb
USA
NA
Feb
CA
NA
Feb
NY
NA
Feb
TX
NA
100
Use member override
user function:
USA <SALES_
ACCT_SUM>
9
Winning aggregate:
100
Use member override
user function:
USA <SALES_
ACCT_SUM>
10
Winning aggregate:
100
Use member override
user function:
USA <SALES_
ACCT_SUM>
11
Winning aggregate:
100
Use member override
user function:
USA <SALES_
ACCT_SUM>
12
Winning aggregate:
100
Use member override
user function:
USA <SALES_
ACCT_SUM>
Copyright © 1988-2007, Oracle. All rights reserved.
95
Creating Hierarchies
Row
13
Chapter 9
TRANS_DATE
Dimension
Members
Priority 2
ACCT Dimension
Member
Priority 1
Winning aggregate:
DEPT Dimension
Members
Priority 3
Cube
Dimension
Override User
Function
Q1
USA
NA
Q1
CA
NA
Q1
NY
NA
Q1
TX
NA
Jan
USA
NA
110
Use member override
user function:
<DIRECTOR_ACCT_
SUM>
14
Winning aggregate:
110
Use member override
user function:
<DIRECTOR_ACCT_
SUM>
15
Winning aggregate:
110
Use member override
user function:
<DIRECTOR_ACCT_
SUM>
16
Winning aggregate:
110
Use member override
user function:
<DIRECTOR_ACCT_
SUM>
17
Winning aggregate:
110
Use member override
user function:
<DIRECTOR_ACCT_
SUM>
96
Copyright © 1988-2007, Oracle. All rights reserved.
Chapter 9
Creating Hierarchies
Row
18
TRANS_DATE
Dimension
Members
Priority 2
ACCT Dimension
Member
Priority 1
Winning aggregate:
DEPT Dimension
Members
Priority 3
Cube
Dimension
Override User
Function
Jan
CA
NA
Jan
NY
NA
Jan
TX
NA
Feb
USA
NA
Feb
CA
NA
110
Use member override
user function:
<DIRECTOR_ACCT_
SUM>
19
Winning aggregate:
110
Use member override
user function:
<DIRECTOR_ACCT_
SUM>
20
Winning aggregate:
110
Use member override
user function:
<DIRECTOR_ACCT_
SUM>
21
Winning aggregate:
110
Use member override
user function:
<DIRECTOR_ACCT_
SUM>
22
Winning aggregate:
110
Use member override
user function:
<DIRECTOR_ACCT_
SUM>
Copyright © 1988-2007, Oracle. All rights reserved.
97
Creating Hierarchies
Row
23
Chapter 9
TRANS_DATE
Dimension
Members
Priority 2
ACCT Dimension
Member
Priority 1
Winning aggregate:
DEPT Dimension
Members
Priority 3
Cube
Dimension
Override User
Function
Feb
NY
NA
Feb
TX
NA
Q1
USA
NA
Q1
CA
NA
110
Use member override
user function:
<DIRECTOR_ACCT_
SUM>
24
Winning aggregate:
110
Use member override
user function:
<DIRECTOR_ACCT_
SUM>
25
Winning aggregate:
120
Use the <ACCT_
DIM_DEFAULT_
FORMULA>
dimension override
user function because a
member override user
function does not exist
for this member:
26
Winning aggregate:
120
Use the <ACCT_
DIM_DEFAULT_
FORMULA>
dimension override
user function because a
member override user
function does not exist
for this member:
98
Copyright © 1988-2007, Oracle. All rights reserved.
Chapter 9
Creating Hierarchies
Row
27
TRANS_DATE
Dimension
Members
Priority 2
ACCT Dimension
Member
Priority 1
Winning aggregate:
DEPT Dimension
Members
Priority 3
Cube
Dimension
Override User
Function
Q1
NY
NA
Q1
TX
NA
Jan
USA
NA
Jan
CA
NA
120
Use the <ACCT_
DIM_DEFAULT_
FORMULA>
dimension override
user function because a
member override user
function does not exist
for this member:
28
Winning aggregate:
120
Use the <ACCT_
DIM_DEFAULT_
FORMULA>
dimension override
user function because a
member override user
function does not exist
for this member:
29
Winning aggregate:
120
Use the <ACCT_
DIM_DEFAULT_
FORMULA>
dimension override
user function because a
member override user
function does not exist
for this member:
30
Winning aggregate:
120
Use the <ACCT_
DIM_DEFAULT_
FORMULA>
dimension override
user function because a
member override user
function does not exist
for this member:
Copyright © 1988-2007, Oracle. All rights reserved.
99
Creating Hierarchies
Row
31
Chapter 9
TRANS_DATE
Dimension
Members
Priority 2
ACCT Dimension
Member
Priority 1
Winning aggregate:
DEPT Dimension
Members
Priority 3
Cube
Dimension
Override User
Function
Jan
NY
NA
Jan
TX
NA
Feb
USA
NA
Feb
CA
NA
120
Use the <ACCT_
DIM_DEFAULT_
FORMULA>
dimension override
user function because a
member override user
function does not exist
for this member:
32
Winning aggregate:
120
Use the <ACCT_
DIM_DEFAULT_
FORMULA>
dimension override
user function because a
member override user
function does not exist
for this member:
33
Winning aggregate:
120
Use the <ACCT_
DIM_DEFAULT_
FORMULA>
dimension override
user function because a
member override user
function does not exist
for this member:
34
Winning aggregate:
120
Use the <ACCT_
DIM_DEFAULT_
FORMULA>
dimension override
user function because a
member override user
function does not exist
for this member:
100
Copyright © 1988-2007, Oracle. All rights reserved.
Chapter 9
Creating Hierarchies
Row
35
TRANS_DATE
Dimension
Members
Priority 2
ACCT Dimension
Member
Priority 1
Winning aggregate:
DEPT Dimension
Members
Priority 3
Cube
Dimension
Override User
Function
Feb
NY
NA
Feb
TX
NA
Winning aggregate:
USA
<SALES_
CUBE_
OVERRIDE>
CA
<SALES_
CUBE_
OVERRIDE>
120
Use the <ACCT_
DIM_DEFAULT_
FORMULA>
dimension override
user function because a
member override user
function does not exist
for this member:
36
Winning aggregate:
120
Use the <ACCT_
DIM_DEFAULT_
FORMULA>
dimension override
user function because a
member override user
function does not exist
for this member:
37
111
Q1
Use default sum
aggregation because
neither a member
override user
function exists for
this member, nor a
dimension override
user function exists for
this dimension.
38
111
Winning aggregate:
Q1
Use default sum
aggregation because
neither a member
override user
function exists for
this member, nor a
dimension override
user function exists for
this dimension.
Copyright © 1988-2007, Oracle. All rights reserved.
101
Creating Hierarchies
Row
39
Chapter 9
TRANS_DATE
Dimension
Members
Priority 2
ACCT Dimension
Member
Priority 1
111
Winning aggregate:
DEPT Dimension
Members
Priority 3
Cube
Dimension
Override User
Function
NY
<SALES_
CUBE_
OVERRIDE>
TX
<SALES_
CUBE_
OVERRIDE>
Winning aggregate:
NA
Q1
Use default sum
aggregation because
neither a member
override user
function exists for
this member, nor a
dimension override
user function exists for
this dimension.
40
111
Winning aggregate:
Q1
Use default sum
aggregation because
neither a member
override user
function exists for
this member, nor a
dimension override
user function exists for
this dimension.
41
111
Jan
USA
Use the dimension
override user
function <DEPT_
DIM_DEFAULT_
FORMULA> because
a member override user
function does not exist
for this member.
42
111
Jan
CA
NA
Note. No winning
aggregate. Because
this row does not
contain any aggregates,
use the data cube’s rule
for calculating values.
102
Copyright © 1988-2007, Oracle. All rights reserved.
Chapter 9
Creating Hierarchies
Row
43
TRANS_DATE
Dimension
Members
Priority 2
ACCT Dimension
Member
Priority 1
DEPT Dimension
Members
Priority 3
Cube
Dimension
Override User
Function
111
Jan
NY
NA
111
Jan
TX
NA
111
Feb
Winning aggregate:
NA
Note. No winning
aggregate. Because
this row does not
contain any aggregates,
use the data cube’s rule
for calculating values.
44
Note. No winning
aggregate. Because
this row does not
contain any aggregates,
use the data cube’s rule
for calculating values.
45
USA
Use the dimension
override user
function <DEPT_
DIM_DEFAULT_
FORMULA> because
a member override user
function does not exist
for this member.
46
111
Feb
CA
NA
111
Feb
NY
NA
Note. No winning
aggregate. Because
this row does not
contain any aggregates,
use the data cube’s rule
for calculating values.
47
Note. No winning
aggregate. Because
this row does not
contain any aggregates,
use the data cube’s rule
for calculating values.
Copyright © 1988-2007, Oracle. All rights reserved.
103
Creating Hierarchies
Row
48
Chapter 9
TRANS_DATE
Dimension
Members
Priority 2
ACCT Dimension
Member
Priority 1
DEPT Dimension
Members
Priority 3
Cube
Dimension
Override User
Function
111
Feb
TX
NA
112
Winning aggregate:
USA
<SALES_
CUBE_
OVERRIDE>
CA
<SALES_
CUBE_
OVERRIDE>
NY
<SALES_
CUBE_
OVERRIDE>
TX
<SALES_
CUBE_
OVERRIDE>
Note. No winning
aggregate. Because
this row does not
contain any aggregates,
use the data cube’s rule
for calculating values.
49
Q1
Use default sum
aggregation because
a member override user
function does not exist
for this member.
50
112
Winning aggregate:
Q1
Use default sum
aggregation because
a member override user
function does not exist
for this member.
51
112
Winning aggregate:
Q1
Use default sum
aggregation because
a member override user
function does not exist
for this member.
52
112
Winning aggregate:
Q1
Use default sum
aggregation because
a member override user
function does not exist
for this member.
104
Copyright © 1988-2007, Oracle. All rights reserved.
Chapter 9
Creating Hierarchies
Row
53
TRANS_DATE
Dimension
Members
Priority 2
ACCT Dimension
Member
Priority 1
112
Jan
DEPT Dimension
Members
Priority 3
Winning aggregate:
Cube
Dimension
Override User
Function
NA
USA
Use the dimension
override user
function <DEPT_
DIM_DEFAULT_
FORMULA> because
a member override user
function does not exist
for this member.
54
112
Jan
CA
NA
112
Jan
NY
NA
112
Jan
TX
NA
112
Feb
Winning aggregate:
NA
Note. No winning
aggregate. Because
this row does not
contain any aggregates,
use the data cube’s rule
for calculating values.
55
Note. No winning
aggregate. Because
this row does not
contain any aggregates,
use the data cube’s rule
for calculating values.
56
No winning aggregate.
Because this row
does not contain any
aggregates, use the
data cube’s rule for
calculating values.
57
USA
Use the dimension
override user
function <DEPT_
DIM_DEFAULT_
FORMULA> because
a member override user
function does not exist
for this member.
Copyright © 1988-2007, Oracle. All rights reserved.
105
Creating Hierarchies
Row
58
Chapter 9
TRANS_DATE
Dimension
Members
Priority 2
ACCT Dimension
Member
Priority 1
DEPT Dimension
Members
Priority 3
Cube
Dimension
Override User
Function
112
Feb
CA
NA
112
Feb
NY
NA
112
Feb
TX
NA
121
Winning aggregate:
USA
<SALES_
CUBE_
OVERRIDE>
CA
<SALES_
CUBE_
OVERRIDE>
NY
<SALES_
CUBE_
OVERRIDE>
TX
<SALES_
CUBE_
OVERRIDE>
Note. No winning
aggregate. Because
this row does not
contain any aggregates,
use the data cube’s rule
for calculating values.
59
Note. No winning
aggregate. Because
this row does not
contain any aggregates,
use the data cube’s rule
for calculating values.
60
Note. No winning
aggregate. Because
this row does not
contain any aggregates,
use the data cube’s rule
for calculating values.
61
Q1
Use default sum
aggregation.
62
121
Winning aggregate:
Q1
Use default sum
aggregation.
63
121
Winning aggregate:
Q1
Use default sum
aggregation.
64
121
Winning aggregate:
Q1
Use default sum
aggregation.
106
Copyright © 1988-2007, Oracle. All rights reserved.
Chapter 9
Creating Hierarchies
Row
65
TRANS_DATE
Dimension
Members
Priority 2
ACCT Dimension
Member
Priority 1
121
Jan
DEPT Dimension
Members
Priority 3
Winning aggregate:
Cube
Dimension
Override User
Function
NA
USA
Use the dimension
override user
function <DEPT_
DIM_DEFAULT_
FORMULA> because
a member override user
function does not exist
for this member.
66
121
Jan
CA
NA
121
Jan
NY
NA
121
Jan
TX
NA
121
Feb
Winning aggregate:
NA
Note. No winning
aggregate. Because
this row does not
contain any aggregates,
use the data cube’s rule
for calculating values.
67
Note. No winning
aggregate. Because
this row does not
contain any aggregates,
use the data cube’s rule
for calculating values.
68
Note. No winning
aggregate. Because
this row does not
contain any aggregates,
use the data cube’s rule
for calculating values.
69
USA
Use the dimension
override user
function <DEPT_
DIM_DEFAULT_
FORMULA> because
a member override user
function does not exist
for this member.
Copyright © 1988-2007, Oracle. All rights reserved.
107
Creating Hierarchies
Row
70
Chapter 9
ACCT Dimension
Member
Priority 1
TRANS_DATE
Dimension
Members
Priority 2
DEPT Dimension
Members
Priority 3
Cube
Dimension
Override User
Function
121
Feb
CA
NA
121
Feb
NY
NA
121
Feb
TX
NA
Note. No winning
aggregate. Because
this row does not
contain any aggregates,
use the data cube’s rule
for calculating values.
71
Note. No winning
aggregate. Because
this row does not
contain any aggregates,
use the data cube’s rule
for calculating values.
72
Note. No winning
aggregate. Because
this row does not
contain any aggregates,
use the data cube’s rule
for calculating values.
The analytic calculation engine used this logic to determine which cell of the row it finally used to calculate
the aggregate:
• Aggregation for row 25:
The analytic calculation engine used the 120 value from the TRANS_DATE dimension because this
dimension was the only dimension that contained an aggregate member. Understand that if either of the
two other dimensions contained an aggregate member, the analytic calculation engine would still select the
120 value because the TRANS_DATE dimension is first in priority. The analytic calculation engine used
the <ACCT_DIM_DEFAULT_FORMULA> dimension override because neither a cube dimension user
function nor a member override user function existed for this member.
• Aggregation for row 37:
The analytic calculation engine used the Q1 value from the TRANS_DATE dimension because this was
the only dimension that contained an aggregate member. The analytic calculation engine used the default
sum aggregation because neither a member override user function existed for this member nor a dimension
override user function existed for this dimension.
• Aggregation for row 41:
The analytic calculation engine used the USA value from the DEPT dimension because this was
the only dimension that contained an aggregate member. The analytic calculation engine used
<DEPT_DIM_DEFAULT_FORMULA> because neither a cube dimension user function nor a member
override user function existed for this member.
108
Copyright © 1988-2007, Oracle. All rights reserved.
Chapter 9
Creating Hierarchies
Example: Creating a Hierarchy with Mixed Aggregate
and Detail Members
In this example, the analytic model contains a BONUS cube collection that calculates the bonus for a group of
employees. The BONUS cube collection uses the main record, as described in this table:
Employee
Bonus (in thousands)
VP
300
D1
200
D2
100
M1
40
M2
10
M3
20
This example uses the following tree, named BUS1:
VP - Vice president
D1 - Director 1
M1 - Manager 1
D2 - Director 2
M2 - Manger 2
M3 - Manager 3
The hierarchical relationships in the BUS1 tree are:
• D1 and D2 are directors who report to VP.
• M1 is a manager who reports to D1.
• M2 and M3 are managers who report to D2.
The BONUS cube collection contains a data cube called EMPLOYEE_BONUS, to which the EMPLOYEE
dimension is attached.
You do not want to calculate the Vice President’s bonus by summing the bonuses of all of the Vice President’s
children. The VP node should not exist as an aggregate member of the hierarchy; it should exist instead as a
detail member. For this reason, do not calculate aggregates for the EMPLOYEE_BONUS data cube.
To create the correct members to the nodes of this tree, specify the details start level as level two (because the
root level is level one). With this specification, detail members are created out of every tree node at the VP
level and any level lower than the VP level. End users use the hierarchy for navigating throughout the tree.
Remember that you can create hierarchies that are only used for navigation.
Make this data available to the end user:
• The bonus for every employee.
• The total bonuses for each employee, plus the total bonuses for each employee who reports to him or her.
To achieve these results, perform these steps:
Copyright © 1988-2007, Oracle. All rights reserved.
109
Creating Hierarchies
Chapter 9
1. Create a data cube called TOTAL_BONUS.
2. Attach the EMPLOYEE_BONUS dimension to the TOTAL_BONUS data cube.
3. Add the TOTAL_BONUS data cube to the BONUS cube collection.
In this example’s hierarchy, all the members are detail members except for the hierarchy root member. Because
aggregate user functions are only used to calculate aggregate members, you should create a regular formula for
the TOTAL_BONUS data cube to calculate its aggregates. Use the FORCHILDREN built-in function to sum
the value of the EMPLOYEE_BONUS data cube plus all of the children of the member. For example:
FORCHILDREN(DIMENSION, MEMBER, EXPRESSION)
Because you specified level two as the details start level, the root member is calculated as an aggregate. The
analytic calculation engine calculates both the TOTAL_BONUS and EMPLOYEE_BONUS data cubes by
using the sum default, because you did not create and select an aggregate function for this purpose.
This table displays the calculation results of all members that are attached to the EMPLOYEE_BONUS
data cube:
Full Path to Employee
in Hierarchy
110
Employee (Dimension
Member)
Employee Bonus (in
thousands)
Total Bonus (in
thousands)
BUS1
BUS
300
670
BUS1.VP
VP
300
670
BUS1.VP.D1
D1
200
240
BUS1.VP.D2
D2
100
130
BUS1.VP.D1.M1
M1
40
40
BUS1.VP.D2.M2
M2
10
10
BUS1.VP.D2.M3
M3
20
20
Copyright © 1988-2007, Oracle. All rights reserved.
CHAPTER 10
Creating Rules, Formulas, and User Functions
This chapter provides overviews of rules, formulas, and user functions, filter user functions, and design time rule error
messages and discusses how to:
• Define and edit data cube formulas.
• Define and edit user functions.
• Work with the elements of rules.
• Perform exceptions to the rule.
• Work with circular formulas and circular systems.
Understanding Rules, Formulas, and User Functions
This section lists common elements and discusses rules, formulas, and user functions and the rule bar display.
Common Elements Used in This Chapter
Insert a plus symbol into the rule.
Insert a minus symbol into the rule.
Insert a multiplication symbol into the rule.
Insert a division symbol into the rule.
Insert an exponent symbol into the rule.
Insert a left parenthesis into the rule.
Insert a right parenthesis into the rule.
Insert a less than symbol into the rule.
Insert a greater than symbol into the rule.
Copyright © 1988-2007, Oracle. All rights reserved.
111
Creating Rules, Formulas, and User Functions
Chapter 10
Insert an equal symbol into the rule.
Insert an AND operator into the rule.
Insert an OR operator into the rule.
Insert a NOT operator into the rule.
Paste a built-in function and its arguments into the rule.
Paste a data cube name into the rule.
Paste a dimension name into the rule.
Paste a member reference into the rule.
Paste a user function into the rule.
Exit the formula without canceling the changes or validating the formula.
Rules, Formulas, and User Functions
In PeopleSoft Analytic Calculation Engine, you use the rule bar to create rules that define the calculation of
data. You use rules within formulas and user functions.
Formulas define the calculation of data cubes. You enter the formula within the rule bar of the data cube that
you want to calculate.
You can create a formula and save it as a user function, which can be reused with various data cubes by
entering the name of the user function in the rule bar of the relevant data cube. You also create user functions
to create filters and to define the calculation of aggregates.
PeopleSoft Analytic Calculation Engine enables you to create rules that contain references to other parts. When
the values of these other parts change, the analytic calculation engine recalculates the rule and stores the results
in the field mapped to the calculated part. These kinds of rules can be useful for working with assumption data.
When end users work with analytic instance data within an application, they can enter assumption values into
one data cube, and then view the results of those assumptions in the values of other calculated data cubes.
For example, suppose an analytic model contains three data cubes called PROFIT, INCOME, and EXPENSE.
The PROFIT data cube contains this formula:
INCOME - EXPENSE
When an end user changes a value that is tied to the INCOME or EXPENSE data cube, the analytic calculation
engine recalculates the formula and stores the result in the field that is mapped to the PROFIT data cube.
112
Copyright © 1988-2007, Oracle. All rights reserved.
Chapter 10
Creating Rules, Formulas, and User Functions
Filter User Functions
You apply a filter user function to a specific dimension, on the Dimensions tab of the cube collection’s
properties.
See Chapter 7, “Creating Cube Collections,” Defining Additional Cube Collection Dimension Properties,
page 60.
This section provides overviews of:
• Data filters.
• Dimension member filters.
Data Filters
You can create filter user functions to display only the dimension members whose values meet a certain
condition. For example, this is the formula for the FILTER_PROD_OVER_2000 filter user function, which is
applied to the PRODUCTS dimension:
IF (SALES > 2000, RETURN(1), RETURN(0))
In the analytic model, only the PRODUCTS dimension is attached to the SALES data cube. In the analytic grid,
the end user views the SALES data cube but only has access to the products that have sold over 2000 units.
Here is the formula for the FILTER_RED_PRODUCTS filter user function, which is applied to the
PRODUCTS dimension:
IF(PRODUCT_COLOR = "RED", RETURN(1), RETURN(0))
In this example, the end user only has access to the products whose members have the red attribute.
When a filter user function is applied to a dimension that is attached to a multidimensional data cube, the
end user has access to a different set of members depending on whether the filtered dimension is in the
column axis/row axis or slice bar.
Using the first filter user function example, the PRODUCTS, MONTHS and REGIONS dimensions are
attached to the SALES data cube. When only the PRODUCTS dimension is in the column or row axis—and
the other dimensions are in the slice bar—the end user has access to only the PRODUCTS members that have
sold over 2000 units in the currently selected region and month in the slice bar. If the end user changes the
region or month selection in the slice bar, the filter is reapplied and the analytic grid may display a different
set of PRODUCTS members.
However—when the PRODUCTS dimension plus one or more dimensions are in the slice bar—the end user
has access to a different set of dimension members. For example:
• If the PRODUCTS dimension is in the slice bar, the end user has access to all PRODUCTS members that
have sold over 2000 units in all regions over the course of all months, regardless of where these dimensions
are displayed in the grid.
• If the PRODUCTS dimension is in the row headings, the MONTHS dimension is in the column headings
and the REGION dimension is in the slice bar, the end user has access to all PRODUCTS members that have
sold over 2000 units in the currently selected region in the slice bar, over the course of all months.
• If the PRODUCTS and MONTHS dimensions are in the row headings—and the MONTHS dimension is
indented below the PRODUCTS dimension—plus the REGION dimension is in the slice bar, the end user
has access to all PRODUCTS members that have sold over 2000 units in the currently selected region in
the slice bar, for the month under which the products are displayed. This means that the analytic grid may
display a different set of products for each month.
Copyright © 1988-2007, Oracle. All rights reserved.
113
Creating Rules, Formulas, and User Functions
Chapter 10
Dimension Member Filters
You can create filter user functions to display only the dimension members that are referenced in the filter
function. For example, this is the formula for the FILTER_DIGITAL_CAMERAS filter user function, which is
applied to the PRODUCTS dimension:
IF(MEMBER(PRODUCTS) = [PRODUCTS:Digital Cameras], RETURN(1), RETURN(0))
In this example, the end user only has access to the Digital Cameras member of the PRODUCTS dimension.
You can also create filter functions that filter data by userID by using the OPRID built-in function.
See Chapter 11, “Using Built-in Functions in Analytic Models,” OPRID, page 177.
Rule Bar Display
The information that is displayed in the rule bar depends on the selected part. This table lists the parts and
the resulting rule bar display:
Selected Part
Rule Bar Display
Data cube
The data cube’s formula (if any).
User function
The user function’s rule.
All other parts
Remains blank.
No selected part
Remains blank.
To edit a formula or user function, click in the rule bar. The rule bar displays buttons that enable you to
edit rules.
Understanding Rule Error Messages
When creating an analytic model, it is important that you create rules that follow certain guidelines. For
example, a multiplication symbol needs a value or expression on both sides of the symbol; therefore, if you
create a rule such as 3 + 5 *, the analytic calculation engine cannot interpret the rule.
When you either click the Accept Changes button to accept a rule or you select Tools, Validate Project, the
analytic calculation engine examines the analytic model’s rules for errors. All error messages for rules appear
in the Output window. When you click an error message, the cursor moves to the part or rule in the analytic
model definition that caused the error message. At this time, you can edit the rule in question and fix the error.
The following table describes PeopleSoft Analytic Calculation Engine’s rule error messages and how to
resolve them.
114
Copyright © 1988-2007, Oracle. All rights reserved.
Chapter 10
Creating Rules, Formulas, and User Functions
Note. When %1 or %2 appears in this table, it denotes that the actual error message includes context-specific
information. For example, the Invalid Dimension %1 error message would yield the error Invalid dimension
PRODUCTS in the Output window if a rule referred to a nonexistent PRODUCTS dimension.
Error Message
Description
A dimension argument cannot be used here.
An invalid argument was passed to the function. The function
does not take a dimension as an argument. Please check the
number and argument types for the function in question.
Analytic model with name %1 not found.
The analytic model was not found in the PeopleSoft database.
Please make sure that the model is saved before the validate is
called.
All dimension arguments must be declared before any
expression arguments are declared.
All the dimension arguments must be declared before expression
arguments are declared. Dimension arguments are declared
with a prefix of $, and expression arguments are declared with a
prefix of @. For example:
ARGUMENTS($DIM, @ExprToLookup, @Condition,⇒
@Direction := #FORWARD);
All required arguments must be declared before any
optional arguments are declared.
Optional arguments should be placed at the end of the
declaration. If there are two or more optional arguments, place
the most optional argument last. For example:
ARGUMENTS($Dim, @ExprToLookup, @Condition,⇒
@Direction := #FORWARD);
In this example, @Direction is an optional argument and is
placed after the non-optional @Condition argument.
Note. Optional arguments should have a default value.
Circular reference.
See “Circular Reference.”
Comment is not terminated.
The comment in a rule was not terminated with the symbols >>.
See Chapter 10, “Creating Rules, Formulas, and User
Functions,” Inserting a Blank Line into a Rule, page 130.
Data cube name is not terminated by a single quote.
The data cube reference in a rule contained a starting single
quote but was not terminated with a single quote. Valid syntax
for a data cube reference is either of these:
• DATA_CUBE
• ’Data Cube’
Duplicate argument name %1.
Copyright © 1988-2007, Oracle. All rights reserved.
The argument mentioned in the error is a duplicate. Another
argument with the same name is used in the context. Please
check the formula in question.
115
Creating Rules, Formulas, and User Functions
Error Message
Duplicate dimensions in member references.
Chapter 10
Description
Two or more member references in a data cube slice use the same
dimension. A data cube slice can refer to only one member from
each dimension. For this reason, you must remove one of the
clashing member references.
See Enterprise PeopleTools 8.49 PeopleBook: Using PeopleSoft
Applications, “Working With Pages,” Slicing Analytic Grid
Data.
Error in ARGUMENTS of user function %1.
The analytic calculation engine encountered an error while
parsing the ARGUMENTS section of the user function. Please
check this section to make sure that it conforms to the following
syntax:
ARGUMENTS(argument1, argument2...argumentN)
Dimension arguments should be declared with a prefix of $, and
expression arguments should be declared with a prefix of @.
The following error occurred while preprocessing
user function %1 – %2.
This error occurred while processing the user function, which
was referred to in another rule or user function.
Function not allowed in this context.
You used a function that is not allowed in the current context.
Functions are nested too deeply.
Functions are nested when one function is used inside another
function. For example, the SIN function is nested inside the ABS
function in the expression ABS(SIN(A)). The nesting depth
refers to the number of levels of functions within functions. For
example, the expression ABS(SIN(MAX(A, B))) has a depth
of three, while MAX(ABS(A), SIN(B)) has a depth of two,
because the SIN function is not used inside the ABS function.
Functions can be nested up to 32 levels deep. This error message
appears when you try to nest functions beyond this limit.
Internal error. Uncompiled user function reference
made in the formula.
The analytic calculation engine encountered an internal error
while compiling rules. Please analyze and correct the user
function in question.
Invalid constant.
The rule contains an invalid constant reference. Please refer to
the valid constants that are supported by PeopleSoft Analytic
Calculation Engine.
See Chapter 10, “Creating Rules, Formulas, and User
Functions,” Understanding the Elements of Rules, page 120.
116
Invalid dimension %1.
A function is referring to a dimension that does not exist. Make
sure that all of the dimension names in the rule are spelled
correctly.
Invalid function %1.
The rule contains a user function or built-in function name
that the analytic calculation engine does not recognize. The
analytic calculation engine reads a name as a function when it is
followed by an opening parenthesis. For example, the expression
A + BLOOPER(X) generates this error because PeopleSoft
Analytic Calculation Engine does not contain a function called
BLOOPER.
Copyright © 1988-2007, Oracle. All rights reserved.
Chapter 10
Creating Rules, Formulas, and User Functions
Error Message
Invalid member reference.
Description
You incorrectly entered a member reference. When this error
message occurs, check for one of these problems:
• The dimension name in the member reference is not spelled
correctly.
• The member name in the member reference is not spelled
correctly.
Invalid member reference syntax. Valid syntax is
[DIMENSION:Member].
A member reference uses invalid syntax. When referring
to members in rules, please make sure that the member is
fully qualified with a dimension name. The valid syntax is
[DIMENSION_NAME: Member Name]. The brackets ([ ]) are
required.
Invalid number.
The current rule contains an invalid number. When this is the
case, verify that:
• The number does not contain any commas.
• The number does not contain more than one decimal point.
• If the number is negative, the minus sign precedes the number.
Syntax error.
See “Syntax Error.”
Text not terminated by quote.
The rule contains a text value that does not have a closing quote.
Text values must be enclosed within quotes.
The ARGUMENTS declaration must appear at the
beginning of a user function.
The ARGUMENTS function should be placed at the starting
block of the body of the user function. Please check the syntax of
the ARGUMENTS function.
See Chapter 11, “Using Built-in Functions in Analytic Models,”
ARGUMENTS Declaration, page 140.
This argument has not been declared in the
ARGUMENTS section.
You used an argument to a user function, in the body of the user
function, before declaring it in the ARGUMENTS section.
Please check the syntax of the ARGUMENTS function and
ensure that all arguments are declared before they are used.
Unbalanced parentheses
The rule does not contain a closing parenthesis for every opening
parenthesis. For example, the expression A + (B * C generates
this error because there should be a closing parenthesis following
C.
Could not find the user function with the name %1.
The user function was referred to in a rule but was not found in
the analytic model.
Could not find the user function rule with the name
%1.
The user function that is referenced in the rule was not found in
the analytic model. Please check the body of the user function.
Undefined data cube %1.
You referred to a nonexistent data cube in a formula or user
function. You must create the data cube before referring to it.
Copyright © 1988-2007, Oracle. All rights reserved.
117
Creating Rules, Formulas, and User Functions
Chapter 10
Circular Reference
If a data cube’s formula refers directly or indirectly to a current value of the same data cube, the analytic
calculation engine generates a circular reference error. Following are some examples of circular references:
Case 1
A = A + B
When the analytic calculation engine evaluates the formula A + B, the analytic calculation engine changes the
value of A. Then, the analytic calculation engine must evaluate the formula again, using the new value of A,
consequently changing the value of A again. For this reason, the analytic calculation engine must evaluate
the formula again, and so on. Because the analytic calculation engine does not contain a method to exit this
cycle, it refuses to accept a formula that contains a circular reference.
This formula contains a direct circular reference because A refers to itself in its own formula.
Case 2
A = B + C
B = A + D
This case is slightly more complex, but is a result of the same issue presented in Case 1. When the analytic
calculation engine evaluates the formula B + C, the analytic calculation engine changes the value of A. The
analytic calculation engine must then evaluate the formula A + D, using the new value of A, consequently
changing the value of B. For this reason, the analytic calculation engine must re-evaluate B + C, consequently
changing the value of A. For this reason, the analytic calculation engine must re-evaluate A + D, and so
on. These two formulas create an endless circle.
These formulas contain an indirect circular reference because neither A nor B refers to itself in its own
formula. Instead, the circularity is created by the two formulas working together. The following statement
describes this circularity: A depends on B, which depends on A.
Case 3
A
B
D
F
=
=
=
=
B
D
F
A
+
+
+
+
C
E
G
H
In this case, A depends on B, which depends on D, which depends on F, which depends on A.
The analytic calculation engine traps all circular errors and does not allow you to inadvertently create circular
references. Though this is the case, you may have to rethink the logic of the analytic model to ensure proper
calculation. A circular reference is often the result of a logical error, which is an attempt to define something
in terms of itself. If you encounter a circular reference error, you may need to step through the formulas in
the analytic model definition to discover where the thinking is circular. Once you find this answer, you must
rework the logic to remove the circularity.
A circular reference error occurs when a data cube directly or indirectly refers to a current value of itself. On
the other hand, if a data cube refers to a previous value of itself, the formula is not only valid but useful.
See Chapter 11, “Using Built-in Functions in Analytic Models,” PREVSELF, page 183.
See Chapter 10, “Creating Rules, Formulas, and User Functions,” Working with Circular Formulas and
Circular Systems, page 134.
118
Copyright © 1988-2007, Oracle. All rights reserved.
Chapter 10
Creating Rules, Formulas, and User Functions
Syntax Error
When you receive a syntax error, the current rule does not follow the basic guidelines for a rule. This is often
the result of a typographical error. Possible violations of the rule guidelines include:
• An arithmetic operator does not have a value on both sides.
For example, the expression A+B+ generates a syntax error because the second plus operator does not have
a value on both sides.
• Two values exist without an operator between the values.
For example, the expression Profit 0.50 generates a syntax error because there is no operator between
the data cube reference and the number.
• The rule contains a symbol that the analytic calculation engine does not recognize.
For example, a dollar sign ($) generates a syntax error.
• Either a function does not contain the correct number of arguments, or it contains an argument of the
wrong type.
If the syntax error occurs within a function, you may need to check the entry for that function in the built-in
function reference.
See Chapter 11, “Using Built-in Functions in Analytic Models,” Built-in Function Reference, page 139.
• The rule contains too many closing parentheses.
For example, the expression A * (B + C)) generates a syntax error because there is an extra closing
parenthesis.
Note. If there are too few closing parentheses, you receive the error Unbalanced parentheses.
Defining and Editing Data Cube Formulas
To define or edit a data cube formula:
1. Select the data cube whose formula you want to define or edit.
2. Click inside the rule bar.
3. Enter a new rule or edit the existing rule.
See Chapter 10, “Creating Rules, Formulas, and User Functions,” Working with the Elements of
Rules, page 120.
4. Perform one of these actions:
• Click the Accept Changes button to accept the changes.
• Click the Exit Formula Mode button to keep the changes without validating the formula.
• Click the Cancel Changes button to cancel the changes.
Defining and Editing User Functions
To define or edit a user function:
Copyright © 1988-2007, Oracle. All rights reserved.
119
Creating Rules, Formulas, and User Functions
Chapter 10
1. Perform one of these actions:
• To define a new user function, select Part, New, User Function.
The Edit Part Name dialog box appears. Enter the name for the user function and click OK.
• To edit an existing user function, select the user function whose formula you want to edit.
2. Click inside the rule bar.
3. Enter a new rule or edit the existing rule.
See Chapter 10, “Creating Rules, Formulas, and User Functions,” Working with the Elements of
Rules, page 120.
4. Perform one of these actions:
• Click the Accept Changes button to accept the changes.
• Click the Exit Formula Mode button to keep the changes without validating the formula.
• Click the Cancel Changes button to cancel the changes.
Working with the Elements of Rules
This section provides an overview of the elements of rules and discusses how to:
• Insert a built-in function into a rule.
• Insert a user function into a rule.
• Insert a numeric value or text value into a rule.
• Insert a data cube reference into a rule.
• Insert a dimension reference into a rule.
• Insert a dimension member reference into a rule.
• Insert a blank line into a rule.
• Insert a comment into a rule.
Understanding the Elements of Rules
This section discusses the various elements that are included in rules.
Built-in Functions
There are many useful calculations that are difficult or impossible to perform with simple arithmetic. You can
perform many such calculations by using PeopleSoft Analytic Calculation Engine’s built-in functions.
Most functions have one or more arguments that supply the information that the function needs to perform the
calculation. Arguments are enclosed within parentheses after a function name.
When a function contains more than one argument, the arguments are always separated by commas. For
example, the following formula uses the MIN function to calculate the minimum of CASH_NEEDED and
CREDIT_AVAILABLE to determine the values of the CASH_ADVANCE data cube:
MIN(CASH_NEEDED, CREDIT_AVAILABLE)
120
Copyright © 1988-2007, Oracle. All rights reserved.
Chapter 10
Creating Rules, Formulas, and User Functions
Some functions do not take any arguments because they do not require additional information to calculate a
result. For example, the PI function returns the mathematical constant pi. Because this function does not require
any information, it does not take any arguments. Nevertheless, you must still follow the function name with
parentheses. For example, the following formula calculates the circumference of a circle using the PI function:
PI( ) * DIAMTER_OF_CIRCLE
The parentheses following PI indicate that the name is a function rather than a data cube reference.
Many functions have one or more optional arguments. If you leave out an optional argument, the analytic
calculation engine supplies a default value for the argument. For example, the CHANGE function calculates
the change between members of a dimension and takes these arguments in order:
1. The dimension for which you want to calculate the change.
2. The information for which you want to calculate the change.
3. How many members back to look.
Note. The third argument is optional; if you do not include it, the analytic calculation engine assumes
you want to calculate the change from only the previous member.
For example, suppose you want to calculate the monthly change in sales. You can use the CHANGE function
and leave out the third argument, as shown in the following formula:
CHANGE(MONTHS, SALES)
For each month, the analytic calculation engine calculates the change in sales from the previous month.
Now suppose you want to calculate the yearly change in sales. You can use the CHANGE function and supply
12 as the third argument, as shown in the following formula:
CHANGE(MONTHS, SALES, 12)
For each month, the analytic calculation engine calculates the change in sales from 12 previous months. To
summarize:
• You must always place parentheses after a function name.
• If a function contains arguments, place the arguments inside the parentheses.
• If a function contains more than one argument, separate the arguments with commas.
• You can leave out an optional argument if the default value for the argument is satisfactory.
See Chapter 11, “Using Built-in Functions in Analytic Models,” CHANGE, page 144.
Conditions and Conditional Formulas
A condition is an expression that evaluates as true or false. A conditional formula returns different values for
different conditions. The most simple conditional formula returns one value if a specified condition is true, and
a different value if the condition is false. A complex conditional formula may return many different values
based on many different conditions. These are types of conditions and conditional formulas:
• Comparison operators.
• Truth functions.
• Compound conditions.
See “Comparison Operators”, “Truth Functions”, “Compound Conditions.”
Copyright © 1988-2007, Oracle. All rights reserved.
121
Creating Rules, Formulas, and User Functions
Chapter 10
Comparison Operators
You can compare the values of two expressions using one of PeopleSoft Analytic Calculation Engine’s
comparison operators.
A comparison returns either a True value (1) or a False value (0), depending on the values of the two
expressions.
Note. The analytic calculation engine always interprets a nonzero value as True and a zero value as False.
The expressions in a comparison can contain mathematical operators, parentheses, and functions, as well as data
cubes and numbers. The analytic calculation engine evaluates the expressions on both sides of the comparison
operator before it evaluates the truth of the comparison. Following are some examples of comparisons:
ADVERTISING >= 10000
ADVERTISING + PROMOTION < 0.5 * (MARKETING_EXPENSE - MARKETING_SALARIES)
The following table describes PeopleSoft Analytic Calculation Engine’s comparison operators:
Comparison
Operator
Example of Comparison
Meaning of Comparison
=
A=B
A is equal to B.
<>
A <> B
A is not equal to B.
>
A>B
A is greater than B.
<
A<B
A is less than B.
>=
A >= B
A is greater than or equal to B.
<=
A <= B
A is less than or equal to B.
Truth Functions
A truth function is a function that returns 1 (True) or 0 (False), depending on whether the arguments of the
function satisfy a condition. The analytic calculation engine uses truth functions to evaluate conditions that are
too complex to express easily with comparison operators.
For example:
IF(FIRST(MONTH),
0, SET(&RunningTotal , &RunningTotal + THISCUBE())
In this example, if the current month that is calculated is the first month, the function returns 0. If the current
month that is calculated is not the first month, the function returns the running total.
See Chapter 11, “Using Built-in Functions in Analytic Models,” FIRST, page 155 and Chapter 11, “Using
Built-in Functions in Analytic Models,” MATCH, page 169.
122
Copyright © 1988-2007, Oracle. All rights reserved.
Chapter 10
Creating Rules, Formulas, and User Functions
Logical Operators
A logical operator determines whether a condition is true. This table describes the logical operators:
Logical Operator
Meaning
Syntax
.NOT.
Condition is not True.
.NOT. Condition
.AND.
Condition1 is True and
Condition2 is True.
Condition1 .AND. Condition2
.OR.
Condition1 is True or
Condition2 is True.
Condition1 .OR. Condition2
Compound Conditions
A compound condition tests whether some combination of conditions is true by combining two or more
comparisons or truth functions using logical operators.
The analytic calculation engine evaluates the .NOT. operator before the .AND. and .OR. operators, and
evaluates the .AND. and .OR. operators from left to right. You can override the precedence of the logical
operators with parentheses, just as you can with the mathematical operators. This table provides some
examples of compound conditions:
Example of Compound Condition
Meaning of Compound Condition
SALES > 50000 .AND. ADVERTISING <⇒
10000
Returns True if SALES is greater than 50000 and
ADVERTISING is less than 10000.
CASH_REMAINING < 1000 .OR.⇒
PROJECT_DONE
Returns True if CASH_REMAINING is less than 1000 or if
PROJECT_DONE is True.
.NOT. IS_FIRST .AND. .NOT. IS_LAST
Returns True if IS_FIRST is not True and IS_LAST is not True.
.NOT. (IS_FIRST .OR. IS_LAST)
Returns True if the condition (IS_FIRST or IS_LAST) is
not True. Note that this has the same effect as the previous
condition.
Predefined Constants
PeopleSoft Analytic Calculation Engine provides several predefined constants that you can use in rules. You
can use constants in the same way that you use numbers in rules. For example, you can test whether a data
cube equals the constant, or you can return the constant as a result.
This table describes predefined constants:
Copyright © 1988-2007, Oracle. All rights reserved.
123
Creating Rules, Formulas, and User Functions
Predefined Constant
#ALL
Chapter 10
Definition
Use this predefined constant as the last argument of the CHILDCOUNT or
FORCHILDREN functions to return all of a dimension member’s children,
including grandchildren. If you do not specify a dimension member, this constant
returns all of the children and grandchildren of the dimension member that is
attached to the data cube that is currently being calculated.
Note. You can also use the #DETAILS or #DIRECT predefined constants as the
last argument for the CHILDCOUNT or FORCHILDREN functions.
See Chapter 11, “Using Built-in Functions in Analytic Models,” CHILDCOUNT,
page 145 and Chapter 11, “Using Built-in Functions in Analytic Models,”
FORCHILDREN, page 156.
#BLANK
A blank value. Use this constant to test whether a value in a data cube is blank or to
return a blank value as a result.
#DETAILS
Use this predefined constant with trees as the last argument of the CHILDCOUNT
or FORCHILDREN functions to return only the dimension members that are
details. If you do not specify a dimension member, this constant returns only the
details of the dimension member that is attached to the data cube that is currently
being calculated.
Note. You can also use the #ALL or #DIRECT predefined constants as the last
argument for the CHILDCOUNT or FORCHILDREN functions.
See Chapter 11, “Using Built-in Functions in Analytic Models,” CHILDCOUNT,
page 145 and Chapter 11, “Using Built-in Functions in Analytic Models,”
FORCHILDREN, page 156.
#DEFAULT
Use this predefined constant as the last condition in a CASE function to return a
default result when all other conditions are false. For example:
CASE(Condition 1 : Result 1, Condition 2 : Result 2,⇒
#DEFAULT : Default Result)
See Chapter 11, “Using Built-in Functions in Analytic Models,” CASE, page 144.
#DIRECT
Use this predefined constant with trees as the last argument of the CHILDCOUNT
or FORCHILDREN functions to return a dimension member’s direct children only.
If you do not specify a dimension member, this constant returns only the direct
children of the dimension member that is attached to the data cube that is currently
being calculated.
Note. You can also use the #ALL or #DETAILS predefined constants as the last
argument for the CHILDCOUNT or FORCHILDREN functions.
See Chapter 11, “Using Built-in Functions in Analytic Models,” CHILDCOUNT,
page 145 and Chapter 11, “Using Built-in Functions in Analytic Models,”
FORCHILDREN, page 156.
124
#E
The value of e (2.7182818285), which is the base of natural logarithms.
#FALSE
A false value. Use this constant to test whether a data cube is false or to return a
false value as a result.
Copyright © 1988-2007, Oracle. All rights reserved.
Chapter 10
Creating Rules, Formulas, and User Functions
Predefined Constant
Definition
Use this predefined constant as the second argument in the FORMEMBERS
function to loop through the dimension members in a forward direction.
#FORWARD
See Chapter 11, “Using Built-in Functions in Analytic Models,” FORMEMBERS,
page 157.
#N/A
Use this predefined constant to test whether a value in a data cube is not available,
or to return N/A as a result.
#PI
The value of Π (3.1415926536), which is the ratio of a circle’s circumference to
its diameter.
#REVERSE
Use this predefined constant as the second argument in the FORMEMBERS
function to loop through the dimension members in a reverse direction.
See Chapter 11, “Using Built-in Functions in Analytic Models,” FORMEMBERS,
page 157.
A true value. Use this predefined constant to test whether a data cube is true or to
return a true value as a result.
#TRUE
Mathematical Operators
This table describes PeopleSoft Analytic Calculation Engine’s operators and their order of execution:
Symbol
Mathematical Operation
Order of Execution
^
Exponentiation
1
*
Multiplication
2
/
Division
3
+
Addition
4
-
Subtraction
5
Order of Precedence
If you use more than one kind of operator in a rule, you must understand the precedence that the analytic
calculation engine follows with the operators. Precedence refers to the order in which the different operators
are evaluated.
For an example of precedence, the rule 3 + 2 * 4 evaluates as 11, not as 20. The analytic calculation
engine performs the multiplication of 2 and 4 before it adds the number 3 because multiplication has a higher
precedence than addition.
Copyright © 1988-2007, Oracle. All rights reserved.
125
Creating Rules, Formulas, and User Functions
Chapter 10
You can use parentheses to override the precedence of operators. For example, the rule (3 + 2) * 4
evaluates as 20, because the analytic calculation engine first evaluates the operation within parentheses. You
can nest parentheses to exercise more control of precedence; the operations within the inner sets of parentheses
are evaluated first. For example, the analytic calculation engine calculates the rule (8 + (3 + 2) * 4)
* (6 + 7) in the order described in this table:
Order of Execution
Operation
Resulting Value
1
3+2
=5
2
5*4
= 20
3
8 + 20
= 28
4
6+7
= 13
5
28 * 13
= 364
The analytic calculation engine performs the multiplication of 5 * 4 before the addition of 8. The analytic
calculation engine performs multiplication before addition unless you override this order of execution with
parentheses.
Note. If you use parentheses, you must balance each opening parenthesis with a closing parenthesis. If you
do not balance the parentheses, the analytic calculation engine generates an Unbalanced parentheses error.
When this situation occurs, you must correct the rule.
See Chapter 10, “Creating Rules, Formulas, and User Functions,” Understanding Rule Error Messages,
page 114.
Values
A value is a number or a text string. For example, the NET_PRESENT_VALUE data cube contains this rule:
NPV(MONTHS, ANNUAL_DISCOUNT_RATE / 12, NET_REVENUE_BY_PRODUCT). In this rule, the
value is 12.
Data Cube References
Use a data cube reference to refer to a specific data cube. For example, you can use data cube references to
multiply the values of two data cubes and place the calculation totals in a result data cube. Using this example,
the PROD_SALES data cube contains the following rule: UNIT_COST * UNITS_SOLD.
Member References
Use a member reference to refer to a dimension member to access its data or to perform a calculation. Use the
following syntax to refer to a member:
[DIMENSION_NAME:Member]
For example, you could use this member reference to refer to the Hard Drives member from the PRODUCTS
dimension: [PRODUCTS: Hard Drives]
126
Copyright © 1988-2007, Oracle. All rights reserved.
Chapter 10
Creating Rules, Formulas, and User Functions
If an aggregate member and detail/leaf member share the same name, use the following syntax to reference the
desired member:
• [DIMENSION_NAME:NODE.Member]
Access an aggregate member.
• [DIMENSION_NAME:DETAIL.Member]
Access a detail or leaf member.
Note. Navigation related functions such as PREV, NEXT, and PREVSELF operate on detail member names
that are persisted in the main record. These functions do not use trees to determine the order of members.
See Chapter 9, “Creating Hierarchies,” Understanding Dimension Members, page 73 and Chapter 9, “Creating
Hierarchies,” Logic for Determining the Order of Members, page 78.
Blank Member References
You reference blank members in user functions by using the MBR2TEXT or TEXT2MBR built-in function
with this string: “” (two quotation marks). Do not include spaces between the quotation marks. For example:
AT(Product, TXT2MBR(""), SALES)
Or
IF(MBR2TXT(Product) = "", X, Y)
Note. When blank members are mapped to date fields, they are written to the database as values of 1/1/1900.
See Chapter 9, “Creating Hierarchies,” Types of Dimension Members, page 73.
Variables
When referencing variables in rules, you must always begin the variable reference with the & symbol,
followed by the variable name.
Note. The variable name can only contain letters or numbers; it cannot contain spaces.
To set a value to a variable, use the following:
&Index := 1
The following formula sets the first character of an account number to a variable, and then uses that variable to
set the account category:
&AcctCode := LEFT(MBR2TEXT(ACCOUNTS), 1);
CASE(&AcctCode = "1" : [ACCT_CAT:Assets],
&AcctCode = "2" : [ACCT_CAT:Liabilities],
&AcctCode = "3" : [ACCT_CAT:Income],
#DEFAULT : [ACCT_CAT: Expense]
)
Setting the value to a variable makes it unnecessary to repeat the expression for each condition of the CASE
function, or to create an intermediate cube to hold the account code.
You can increment or decrement a variable with the INC:
INC(&Index);
DEC(&Index);
Copyright © 1988-2007, Oracle. All rights reserved.
127
Creating Rules, Formulas, and User Functions
Chapter 10
INC(&Profit, REVENUE);
DEC(&Profit, EXPENSE)
The lifetime of a variable is a single evaluation of the rule; the value of a variable is not preserved across
multiple evaluations.
Inserting a Built-in Function into a Rule
To insert a built-in function into a rule:
1. Select the place in the rule where you want to add the function.
2. Click the Paste Built-in Function button.
The Choose Built-in Function drop-down list box appears.
3. Use the scroll bar to scroll through the list of built-in functions.
4. Click the desired built-in function.
PeopleSoft Analytic Calculation Engine pastes the built-in function and argument names into the
rule bar.
5. For each argument:
a. Highlight the argument.
b. Replace the highlighted argument with the argument value.
6. Complete your work on the rule, and then:
• Click the Accept Changes button to accept the changes.
• Click the Exit Formula Mode button to keep the changes without validating the rule.
• Click the Cancel Changes button to cancel the changes.
See Also
Chapter 11, “Using Built-in Functions in Analytic Models,” Built-in Function Reference, page 139
Inserting a User Function into a Rule
To insert a user function into a rule:
1. Select the place in the rule where you want to add the user function.
2. Click the name of the user function in the part browser.
PeopleSoft Analytic Calculation Engine pastes the user function into the rule bar.
Note. If you enter a user function name that does not exist, the analytic calculation engine returns
an error when validating the analytic model.
Inserting a Numeric Value or Text Value into a Rule
To insert a numeric value in a rule, enter the value (for example, 12).
To use a text value in a rule, enter the value and enclose it in double quotes (for example, "Smith").
128
Copyright © 1988-2007, Oracle. All rights reserved.
Chapter 10
Creating Rules, Formulas, and User Functions
Note. PeopleSoft recommends that you do not enter an assumption directly into a rule. Instead, you should
create a data cube for the assumption and refer to the data cube in the formula. For example, do not calculate
TAXES by multiplying INCOME by 0.38. Instead, create a data cube called TAX_RATE and enter 0.38 as its
value. Then calculate TAXES by multiplying INCOME by TAX_RATE. Performing the procedure in this
fashion simplifies the process of changing the assumptions and makes the analytic model easier to understand
and audit.
See Chapter 10, “Creating Rules, Formulas, and User Functions,” Inserting a Data Cube Reference into a
Rule, page 129.
Inserting a Data Cube Reference into a Rule
To insert a data cube reference into a rule:
• Place the cursor where you want to insert the data cube reference.
• Perform one of these actions:
- In the part browser, click on the data cube to which you want to refer.
- Enter the name of the data cube.
Note. If you enter a data cube reference for a data cube that does not exist, the analytic calculation engine
returns an error when validating the analytic model.
- Select Edit, Paste Cube Name and click on the data cube to which you want to refer.
Inserting a Dimension Reference into a Rule
To insert a dimension reference into a rule:
• Place the cursor at the location of the rule into which you want to insert the dimension reference.
• Perform one of these actions:
- In the part browser, click the dimension to which you want to refer.
- Enter the name of the dimension.
Note. If you enter a dimension reference for a dimension that does not exist, the analytic calculation
engine returns an error when validating the analytic model.
- Select Edit, Paste Dimension and click on the dimension to which you want to refer.
Inserting a Dimension Member Reference into a Rule
This section discusses how to:
• Enter a member reference into a rule.
• Refer to one slice of a data cube.
Entering a Member Reference into a Rule
To enter a member reference into a rule:
Copyright © 1988-2007, Oracle. All rights reserved.
129
Creating Rules, Formulas, and User Functions
Chapter 10
1. Place the cursor at the position in the rule where you want to enter a member reference.
2. Select Edit, Paste Member Ref...
The Choose Member Reference dialog box appears.
3. Click the dimension for which you want to enter a member reference.
The dimension and a generic member reference appears in the rule bar.
4. Highlight the word member.
5. Replace the word member with the name of the dimension member.
Referring to One Slice of a Data Cube
When you want to access particular values within a data cube, use member references to refer to a slice
of the data cube.
To refer to one slice of a data cube:
1. Define or edit a rule.
2. Enter the data cube in the rule (for example, SALES, which uses the MONTHS, PRODUCTS, and
REGIONS dimensions).
3. Enter a member reference (for instance, the East region from the REGIONS dimension).
The rule bar now displays: SALES [REGIONS.East]. This rule returns SALES for the East
region for all PRODUCTS and all MONTHS.
4. Repeat step 3 to make the slice as small as you want.
A single value from the data cube is the smallest possible slice.
For example, to access SALES for the East region for the Hard Drives product for 2004/03, use the
following rule:
SALES [REGIONS.East] [PRODUCTS.Hard Drives] [MONTHS.2004/03]
See Also
Enterprise PeopleTools 8.49 PeopleBook: Using PeopleSoft Applications, “Working With Pages,” Slicing
Analytic Grid Data
Inserting a Blank Line into a Rule
You can insert a blank line into a rule to enhance legibility. To insert a blank line into a rule, press CTRL+ENTER.
Inserting a Comment into a Rule
To insert a comment into a rule, use the symbols << and >>. This is an example of a comment in a rule:
<< Loop through all products >>
Performing Exceptions to the Rule
This section provides an overview of exceptions to the rule and discusses how to:
130
Copyright © 1988-2007, Oracle. All rights reserved.
Chapter 10
Creating Rules, Formulas, and User Functions
• Create different calculations for different dimension members.
• Create different calculations for different groups of members.
Understanding Exceptions to the Rule
A typical rule contains a formula for an entire data cube that the analytic calculation engine uses to calculate
every value in the data cube. If you want some values of a data cube to calculate in a different manner than
other values, you must create an exception to the rule. You can create exceptions to:
• Perform different calculations for different members.
• Perform different calculations for different groups of members.
Create Different Calculations for Different Members
This section provides an overview of the calculation of only one member and the calculation of more than one
member and discusses how to:
• Create a calculation for only one member.
• Create a calculation for more than one member.
Understanding the Calculation of Only One Member
The following example describes the reason for and process of creating a special calculation for one member.
Suppose your company must allocate the Administration department’s expense equally to all of the other
departments. To ensure proper allocation, the Administration department requires a different calculation than
the other departments. To create this allocation, you must back out the expense for Administration and divide
that expense equally among the other departments.
You company’s analytic model contains data cubes called EXPENSE and ADMIN_ALLOCATION. The
DEPARTMENTS dimension is attached to both data cubes. Create the following formula to calculate
ADMIN_ALLOCATION:
IF([DEPARTMENTS:Administration], - EXPENSE, EXPENSE[DEPARTMENTS:Administration] / ⇒
(NUMMEMBERS(DEPARTMENTS) - 1))
The formula uses the IF function to calculate one result if a condition is true, and another result if the condition
is false. Here is how the formula works:
The analytic calculation engine uses the[DEPARTMENTS:Administration] member reference to check
whether Administration is the department that is being calculated.
• If Administration is the department that is being calculated, the formula returns minus EXPENSE, backing
out the expense for Administration.
• If Administration is not the department that is being calculated, the formula returns the expense for
Administration divided by the number of departments minus one.
In other words, the formula divides the Administration expense equally among the other departments.
Note. The formula uses the data cube slice EXPENSE[DEPARTMENTS:Administration] to refer
to the expense for Administration. The NUMMEMBERS function returns the number of members in
the specified dimension.
Copyright © 1988-2007, Oracle. All rights reserved.
131
Creating Rules, Formulas, and User Functions
Chapter 10
Understanding the Calculation of More Than One Member
The following formula provides an example of a calculation for more than one member. The formula returns
one result for Administration, another result for Data Processing, and a third result for all other departments:
CASE([DEPARTMENTS:Administration] : ADMINISTRATION_RESULT, [DEPARTMENTS:Data⇒
Processing] : DATA_PROCESSING_RESULT, #DEFAULT : RESULT_FOR_ALL_OTHER_DEPARTMENTS)
Creating a Calculation for Only One Member
To create a calculation for only one member:
1. Define a formula for the result data cube.
2. Enter IF and an opening parenthesis.
You are using the IF function to return different results, depending on a condition.
See Chapter 11, “Using Built-in Functions in Analytic Models,” IF, page 164.
3. Insert the member reference for the exceptional member.
Note. When you use a member reference as a condition, it returns True if the analytic calculation
engine is calculating values for that member; otherwise, it returns False.
See Chapter 10, “Creating Rules, Formulas, and User Functions,” Inserting a Dimension Member
Reference into a Rule, page 129.
4. Enter a comma, and then enter the result that should be returned if the exceptional member is being
calculated.
5. Enter another comma, and then enter the result that should be returned if one of the nonexceptional
members is being calculated.
6. Enter a closing parenthesis.
Note. To perform the same calculation for several members, combine two or more member
references with .OR. operators. For example: [DEPARTMENTS:Administration] .OR.
[DEPARTMENTS:Data Processing].
Creating a Calculation for More Than One Member
To create a calculation for more than one member:
1. Define a formula for the result data cube.
2. Enter CASE and an opening parenthesis.
You are using the CASE function to evaluate a Condition:Result pair for each special case.
See Chapter 11, “Using Built-in Functions in Analytic Models,” CASE, page 144.
3. Enter a Condition:Result pair for each special calculation:
a. Insert a member reference for one of the members in the dimension.
For example:[DEPARTMENTS:Administration]
This condition tests whether results are being calculated for the specified member.
b. Enter a colon to separate the condition from the result.
c. Enter the appropriate result for the specified member.
132
Copyright © 1988-2007, Oracle. All rights reserved.
Chapter 10
Creating Rules, Formulas, and User Functions
d. Enter a comma.
4. Perform these steps to enter a final Condition:Result pair to return a result for all other members in
the dimension:
a. Enter #DEFAULT as the condition.
#DEFAULT instructs the function to return the final result for all other members.
b. Enter a colon to separate the condition from the result.
c. Enter the result for all other members in the dimension.
d. Enter a closing parenthesis.
Creating Different Calculations for Different Groups of Members
Sometimes you may want to calculate a data cube in different ways for different groups of members. To
perform different calculations for different groups of members:
1. Create an association data cube that associates each member with a group.
See Chapter 5, “Creating Data Cubes,” Creating Association Data Cubes, page 39.
2. Define a formula for the result data cube.
3. Use the CASE function to evaluate two or more Condition:Result pairs.
Perform the following steps for each Condition:Result pair:
See Chapter 11, “Using Built-in Functions in Analytic Models,” CASE, page 144.
a. Use a member reference to compare the association data cube to one of the members in the group
dimension.
This example is a formula for the INVEST_TYPE data cube:
[TYPES:Stock]
See Chapter 10, “Creating Rules, Formulas, and User Functions,” Inserting a Dimension
Member Reference into a Rule, page 129.
b. Enter a colon to separate the condition and result.
c. Enter the appropriate result for that group.
d. To add another Condition:Result pair, enter a comma; otherwise, enter a closing parenthesis.
Example: Creating Different Calculations for Different Groups of Members
Suppose that you create an analytic model to track your investments in stocks, bonds, and rental properties,
and you want to know your monthly income. Because the income for stocks, bonds, and rental properties is
calculated differently, you need to perform different calculations for different groups of these investments.
Create a data cube that associates each investment with an investment type. Suppose the dimension of
investment types is called TYPES, and the association data cube is called INVEST_TYPE. You can calculate
the investment income for each investment as follows:
CASE(INVEST_TYPE = [TYPES:Stock] : NUMBER_OF_SHARES * DIVIDENDS_PER_SHARE, INVEST_⇒
TYPE = [TYPES:Bond] : BOND_RATE * BOND_AMOUNT / 12, INVEST_TYPE = [TYPES:Rent] :⇒
MONTHLY_RENT)
See Chapter 5, “Creating Data Cubes,” Creating Association Data Cubes, page 39.
Copyright © 1988-2007, Oracle. All rights reserved.
133
Creating Rules, Formulas, and User Functions
Chapter 10
The CASE function evaluates multiple conditions and returns the result for the first true condition. Each
Condition:Result pair is separated by a comma.
See Chapter 11, “Using Built-in Functions in Analytic Models,” CASE, page 144.
In the preceding formula, the CASE function compares the invest type for an investment to each member
in the TYPES dimension. The formula uses a member reference (for example, [TYPES:Stock] ) to
refer to each member. When the CASE function finds the matching member from the TYPES dimension,
it returns the corresponding result. For example, if the invest type for an investment is Bond, the formula
returns BOND_RATE * BOND_AMOUNT / 12.
Working with Circular Formulas and Circular Systems
This section provides overviews of circular formulas, circular systems, recursive system resolution, and
circular system resolution and discusses how to change circular formula and circular system options.
See Also
“Circular Reference”
Understanding Circular Formulas
When a data cube’s formula refers either directly or indirectly to that same data cube, it is considered to
be a circular formula.
Note. The analytic calculation engine determines—on the data cube level—whether formulas are circular.
However, the analytic calculation engine resolves circular systems and recursive systems on the cell level.
Direct Circular Formulas
This is an example of a direct circular formula for the SALES data cube:
SALES + SALES_GROWTH
This formula states that sales equals sales plus the sales growth.
It is a direct circular formula because the data cube’s formula refers directly to that same data cube.
Indirect Circular Formulas
In an indirect circular formula, a data cube’s formula refers indirectly to that same data cube, as in this example:
• Formula for BONUS data cube
BONUS_PERCENTAGE * NET_INCOME
• Formula for EXPENSE data cube
SALARY + BONUS
• Formula for NET_INCOME data cube
INCOME - EXPENSE
134
Copyright © 1988-2007, Oracle. All rights reserved.
Chapter 10
Creating Rules, Formulas, and User Functions
In this example, none of the data cubes refer directly to themselves. However, each data cube refers indirectly
to itself by means of the other data cubes:
• BONUS refers to NET_INCOME.
• NET_INCOME refers to EXPENSE.
• EXPENSE refers to BONUS.
Understanding Circular Systems and Recursive Systems
When the analytic calculation engine determines—on the data cube level—that a circular formula exists, it
analyzes the calculation conditions of the cells within the circular formula to determine whether the cells
are dependent on those same cells for their values. If so, these cells either create a recursive system or a
circular system.
In a recursive system, the values of the cells are not dependent on the values of those same cells.
In a circular system, the values of the cells are dependent the values of those same cells.
Understanding Recursive System Resolution
The analytic calculation engine resolves recursive systems immediately without using the process of iteration.
To understand the process of how the analytic calculation engine determines and resolves recursive systems,
consider the following formula for the SALES data cube:
PREVSELF(MONTHS) + SALES_GROWTH
The analytic calculation engine determines that this is a recursive system by performing the following:
1. The analytic calculation engine determines that this is a circular formula because the PREVSELF
built-in function – which refers to the SALES data cube – exists within the formula.
2. The analytic calculation engine analyzes the calculation conditions of the cells within this formula
and determines that these cells create a recursive system, because the cells within this formula are not
dependent on the values of those same cells.
The analytic engine then resolves this recursive system immediately without iteration.
Understanding Circular System Resolution
The analytic calculation engine uses the process of iteration to attempt to resolve all of an analytic model’s
circular systems. You set the iteration parameters by using the General tab of the analytic model’s properties.
If the cells converge on a solution within the iteration parameters, the circular system is resolved. If the cells
do not converge on a solution within the iteration parameters, the analytic calculation engine returns an error.
All cells within the circular system remain unresolved.
Note. Because you enable or disable iteration for all circular systems, you cannot enable or disable iteration
for a particular circular system.
When you enable the resolution of circular systems through iteration, you must select one of the following
iteration options:
• Maximum number of iterations: When the values of the cells have not changed more than the specified
maximum amount, the circular system is considered to be resolved.
Copyright © 1988-2007, Oracle. All rights reserved.
135
Creating Rules, Formulas, and User Functions
Chapter 10
• Maximum change in values: When the analytic calculation engine has calculated the cells within the circular
system for the specified maximum number of times, the circular system is considered to be resolved.
Example of Resolving a Circular System
In this example, an analytic model contains the following formulas (for simplicity, assume that each data
cube contains only a single cell):
• Formula for BONUS data cube
BONUS_PERCENTAGE * NET_INCOME
• Formula for EXPENSE data cube
SALARY + BONUS
• Formula for NET_INCOME data cube
INCOME - EXPENSE
First, the analytic calculation engine determines that this is an indirect circular formula because the data cubes’
formulas refer indirectly to those same data cubes.
Next, the analytic calculation engine analyzes the calculation conditions of the cells within this indirect circular
formula and determines that these cells create a circular system. This is because the cells within this formula
are dependent on the same values of those same cells.
Assuming that the value for the BONUS_PERCENTAGE cell = 5, the value for the INCOME cell = 10,000,
and the value for the SALARY cell = 6,000, then the circular system is resolved when the analytic calculation
engine iterates until it returns these solutions:
• Cell for BONUS = 190.48.
• Cell EXPENSE = 6,190.48.
• Cell for NET_INCOME = 3,809.52.
If you plug these values into the preceding formulas, each formula is true: the left side of the formula is (almost)
equal to the right side of the formula. Once this occurs, the circular system is considered to be resolved.
Changing Circular Formula and Circular System Options
Select the analytic model in the part browser.
136
Copyright © 1988-2007, Oracle. All rights reserved.
Chapter 10
Creating Rules, Formulas, and User Functions
General tab
Description
Enter a description of the analytic model.
Note. This field pertains to the analytic model as a whole, not to circular
formula options.
Resolve circular system
through iteration
Select to attempt to resolve all of an analytic model’s circular systems through
iteration. By default, this option is disabled.
See Chapter 10, “Creating Rules, Formulas, and User Functions,” Changing
Circular Formula and Circular System Options, page 136.
Maximum number of
iterations
Enter the number of iterations in which the analytic calculation engine is to
resolve circular systems. By default, the maximum number of iterations is 100.
If the analytic calculation engine cannot resolve a circular system during this
number of iterations, the analytic calculation engine returns an error.
Note. You must select the Resolve circular system through iteration check
box to activate this option.
Maximum change in values
Enter the maximum change in values. By default, the maximum change in
values is 0.001000.
A circular system is considered to be resolved when the values of its cells do
not change more than the specified maximum change. If you enter a smaller
value, the solution is more accurate but may require a longer calculation
time. If you enter a larger value, the solution not as accurate but requires a
shorter calculation time.
Note. You must enable the Resolve circular system through iteration check
box to activate this option.
Warn about circular
formulas
Every time a circular formula is defined: Select for the analytic calculation
engine to provide a circular formula warning every time a circular formula is
defined.
Copyright © 1988-2007, Oracle. All rights reserved.
137
Creating Rules, Formulas, and User Functions
138
Chapter 10
Copyright © 1988-2007, Oracle. All rights reserved.
CHAPTER 11
Using Built-in Functions in Analytic Models
This chapter provides reference information about the functions that are delivered with PeopleSoft Analytic
Calculation Engine.
Built-in Function Reference
Use the following built-in functions in an analytic model’s rules and user functions:
ABS
Syntax
ABS(Data)
Description
The ABS function returns the absolute (positive) value of Data.
Returns
The absolute (positive) value of Data.
Example
The following examples employ the ABS built-in function:
• ABS(5) returns 5.
• ABS(-5) returns 5.
• ABS(0) returns 0.
ACOS
Syntax
ACOS(Data)
Description
The ACOS function returns the arc-cosine of Data. The result is the angle (in radians) whose cosine equals
Data.
The value of Data must fall between –1 and 1; otherwise, ACOS returns an error value.
To convert from radians to degrees, multiply by 180 / PI( ). (The PI function returns the value of PI.)
Copyright © 1988-2007, Oracle. All rights reserved.
139
Using Built-in Functions in Analytic Models
Chapter 11
Returns
The arc-cosine of Data.
Example
The following examples employ the ACOS built-in function:
• ACOS(0.5) returns 1.0471975512 (angle in radians).
• ACOS(0.5) * 180 / PI( ) returns 60 (angle in degrees).
• ACOS(SQRT(2) / 2) returns 0.7853981634 (angle in radians).
• ACOS(SQRT(2) / 2) * 180 / PI( ) returns 45 (angle in degrees).
ARGUMENTS Declaration
Syntax
ARGUMENTS(argument1), argument2... argumentN
Description
The ARGUMENTS declaration passes values to functions within a user function.
Use the following guidelines to make user functions more powerful by giving them arguments:
Enter an ARGUMENTS declaration at the beginning of the rule, followed by an opening parenthesis.
Enter any dimension arguments next, separated by commas. A dimension argument always begins with a
$, as in $Dim. Unlike the built-in functions, which never have more than one dimension argument, user
functions can have multiple dimension arguments.
Include any expression arguments next, separated by commas. An expression argument always begins with a
@, as in @Expr. To give the argument a default value, follow it with := and any valid expression.
Note. All optional arguments (that is, those with default values) must appear after all required arguments.
Enter a closing parenthesis and a semicolon.
Example
ARGUMENTS($Dim, @ExprToLookup, @Condition, @Direction := #FORWARD);
FORMEMBERS($Dim, @Direction,
IF(@Condition, RETURN(@ExprToLookup))
);
RETURN(0)
ASC
Syntax
ASC(Text)
140
Copyright © 1988-2007, Oracle. All rights reserved.
Chapter 11
Using Built-in Functions in Analytic Models
Description
The ASC function returns the first character of the Text argument to its ASCII equivalent number (for example,
a number between 0-255). Use this function to convert a character into its ASCII value.
Returns
The first character of the Text argument to its ASCII equivalent number.
Example
For a cube formatted as a number, ASC("ABC") returns the 65.
ASIN
Syntax
ASIN(Data)
Description
The ASIN function returns the arc-sine of Data. The result is the angle (in radians) whose sine equals Data.
The value of Data must fall between –1 and 1; otherwise, ASIN returns an error value.
To convert from radians to degrees, multiply by 180 / PI( ). (The PI function returns the value of PI.)
Returns
The arc-sine of Data.
Example
The following examples employ the ASIN built-in function:
• ASIN(0.5) returns 0.5235987756 (angle in radians).
• ASIN(0.5) * 180 / PI( ) returns 30 (angle in degrees).
• ASIN(SQRT(2) / 2) returns 0.7853981634 (angle in radians).
• ASIN(SQRT(2) / 2) * 180 / PI( ) returns 45 (angle in degrees).
AT
Syntax
AT(Dimension, Member, Data)
Description
The AT function looks up the value of Data for a particular member in a dimension.
You can use the AT function in the following ways:
• You can look up a value at a particular position in the dimension.
• You can look up a value for a particular member by name.
Copyright © 1988-2007, Oracle. All rights reserved.
141
Using Built-in Functions in Analytic Models
Chapter 11
• You can associate members in one dimension with members in another dimension, and then look up an
associated value for each member in the first dimension. For example, you can associate each employee with
a job, and then look up the job salary for each employee.
Looking Up a Value at a Position
To look up a value at a particular position, use the position number for the member argument. You can also
use an expression that returns the position number.
For example, to look up the value of SALES for the first member in the PRODUCTS dimension, use
the following formula:
AT(PRODUCTS, 1, SALES)
To look up the value of SALES for the last member in the PRODUCTS dimension, use the following formula:
AT(PRODUCTS, NUMMEMBERS(PRODUCTS), SALES)
This works because the NUMMEMBERS function returns the number of members in the Products dimension,
which is the position of the last member.
See Chapter 11, “Using Built-in Functions in Analytic Models,” NUMMEMBERS, page 177.
Looking Up a Value for a Member by Name
To look up a value for a particular member by name, use a member reference for the member argument.
For example, the following formula returns UNIT_COST divided by UNIT_PRICE for the Monitors product:
AT(PRODUCTS, [PRODUCTS:Monitors], UNIT_COST / UNIT_PRICE)
You can achieve the same result using member references after the data cube names, as follows:
UNIT_COST [PRODUCTS:Monitors] / UNIT_PRICE [PRODUCTS:Monitors]
To evaluate a complex expression for a single member, the AT function is more concise because you are not
required to repeat the member reference for every data cube.
Looking Up an Associated Value
You can associate members in one dimension with members in another dimension, and then look up an
associated value for each member in the first dimension. For example, suppose that you would like to associate
each employee with a job, and then look up the job salary for each employee. To do this, perform the following:
1. Create a dimension called JOBS.
2. Create a data cube called EMPLOYEE_JOB. Format this data cube as a member of the JOBS dimension.
3. Create a dimension called EMPLOYEE. Attach this dimension to the EMPLOYEE_JOB data cube.
4. Create a data cube called SALARY_BY_JOB, which contains the salary for each job.
5. Create a data cube called EMPLOYEE_SALARY. Create the following formula for this data cube.
You can look up the salary for each employee by using the name of the association data cube as
the member argument:
AT(JOBS, EMPLOYEE_JOB, SALARY_BY_JOB)
For each employee, the formula looks up the number in SALARY_BY_JOB that is at the member
indicated by EMPLOYEE_JOB.
142
Copyright © 1988-2007, Oracle. All rights reserved.
Chapter 11
Using Built-in Functions in Analytic Models
Pushing Down Parent Member Data
The following are examples of user functions that push down parent member data:
• AT (DIMENSION, Parent(DIMENSION), THISCUBE() * 0.2)
• AT (DIMENSION, Parent(DIMENSION), THISCUBE() / CHILDCOUNT(DIMENSION,
#DIRECT))
ATAN
Syntax
ATAN(Data)
Description
The ATAN function returns the arc-tangent of Data. The result is the angle (in radians) whose tangent equals
Data.
To convert from radians to degrees, multiply by 180 / PI( ). The PI function returns the value of PI
Returns
The arc-tangent of Data
Example
The following examples employ the ATAN built-in function:
• ATAN(0.5) returns 0.463647609 (angle in radians).
• ATAN(0.5) * 180 / PI( ) returns 26.5650511771 (angle in degrees).
• ATAN(1) returns 0.7853981634 (angle in radians).
• ATAN(1) * 180 / PI( ) returns 45 (angle in degrees).
BREAK
Syntax
BREAK()
Description
The BREAK function causes an immediate break out of the current loop.
Example
SET(&Value, 1);
WHILE(&Value < THE_ABSOLUTE_MAXIMUM,
SET(&Value, &Value * 2);
IF(&Value = ENOUGH_ALREADY, BREAK());
INC(&Value)
);
IF(&Value > ENOUGH_ALREADY, "More than enough", "Just right")
Copyright © 1988-2007, Oracle. All rights reserved.
143
Using Built-in Functions in Analytic Models
Chapter 11
You normally use the BREAK function within an IF function to break out of a loop when a specified condition
is achieved. To return Just right from the formula, ENOUGH_ALREADY must contain a value from the
sequence 2, 6, 14, 30, and so on.
CASE
Syntax
CASE(Condition A : Result A, Condition B : Result B {,...})
Description
The CASE function returns the Result that corresponds to the first true Condition; if none of the conditions
is true, it returns zero.
Returns
The Result that corresponds to the first true Condition; if none of the conditions is true, it returns zero.
Example
Suppose a company awards its salespeople the following commissions:
• A 10 percent commission if their sales are at least 50,000 USD.
• An 8 percent commission if their sales are at least 30,000 USD.
• A 5 percent commission if their sales are at least 15,000 USD.
You can calculate the commission rate for a salesperson with the following formula:
CASE(SALES >= 50000 : 0.10, SALES >= 30000 : 0.08, SALES >= 15000 : 0.05)
If SALES is 45000, this formula returns 0.08. Notice that the CASE function returns the result for the first true
condition, even if some of the remaining conditions are true.
The above formula returns zero if SALES is less than 15000. Suppose that the company awards a 3 percent
commission on all sales under 15,000 USD. You can model this with the following formula:
CASE(SALES >= 50000 : 0.10, SALES >= 30000 : 0.08, SALES >= 15000 : 0.05, #DEFAULT⇒
: 0.03)
The last condition (#DEFAULT) is always equivalent to TRUE, so the CASE function returns 0.03 if SALES
is less than 15000. If you want the CASE function to return a default value other than zero, use #DEFAULT as
the last condition.
CHANGE
Syntax
CHANGE(Dimension, Data, {Count})
Description
The CHANGE function returns the difference between the value of Data for the member being calculated and
the value of Data for Count members back. If Count is omitted, it is assumed to be 1.
144
Copyright © 1988-2007, Oracle. All rights reserved.
Chapter 11
Using Built-in Functions in Analytic Models
Example
Suppose you wish to calculate the monthly and yearly change in a data cube called SALES. If SALES uses a
dimension called MONTHS, use the following formula to calculate the MONTHLY_CHANGE data cube:
CHANGE(MONTHS, SALES)
Because the Count argument is omitted, the program assumes it to be 1. Consequently, the program calculates
the change in SALES from the previous month to the month being calculated.
Calculate the YEARLY_CHANGE data cube by using 12 for the third argument:
CHANGE(MONTHS, SALES, 12)
This formula calculates the change in SALES from 12 months ago to the month being calculated.
CHILDCOUNT
Syntax
CHILDCOUNT(Dimension, {#DIRECT/#ALL/#DETAILS, {Parent Member}})
Description
The CHILDCOUNT function returns the number of a Parent member’s children. This function takes the
following one required argument and two optional arguments:
• Dimension: The dimension to use.
• For the second optional argument, select from these predefined constants:
- #DIRECT.
- #ALL.
- #DETAILS.
See Chapter 10, “Creating Rules, Formulas, and User Functions,” Understanding the Elements of Rules,
page 120.
• Parent Member: This is an optional argument. If you do not use this optional argument, the function applies
to the member that is currently being evaluated.
Returns
The number of a parent member’s children.
Example
CHILDCOUNT (Region, #DIRECT, [Region:All_regions])
See Also
Chapter 9, “Creating Hierarchies,” Pushed Down Data, page 80
CHR
Syntax
CHR(Number)
Copyright © 1988-2007, Oracle. All rights reserved.
145
Using Built-in Functions in Analytic Models
Chapter 11
Description
The CHR function returns the equivalent ASCII character of the number argument. The number must be in
range from 0 to 255; otherwise, an invalid type error with be thrown.
Returns
The equivalent ASCII character of the number argument.
Example
For a cube formatted as text, CHR(65) returns the character A.
CONSOL
Syntax
CONSOL(Dimension, Data)
Description
The CONSOL function returns the value of Data for the total member of Dimension.
Returns
The value of Data for the total member of Dimension
Example
Suppose an analytic model contains a data cube called SALES that uses a dimension called PRODUCTS. Use
the following formula to calculate each product’s sales as a percentage of total sales:
SALES / CONSOL(PRODUCTS, SALES)
This formula divides each product’s sales by the consolidated value for SALES.
COS
Syntax
COS(Data)
Description
The COS function returns the cosine of Data, where Data represents an angle in radians.
To convert from degrees to radians, multiply by PI( ) / 180. The PI function returns the value of PI
Example
The following examples employ the COS built-in function:
• COS(PI( ) / 3) returns 0.5 (cosine of PI / 3 radians).
• COS(PI( ) / 2) returns 0 (cosine of PI / 2 radians).
• COS(45 * PI( ) / 180) returns 0.7071067812 (cosine of 45 degrees).
146
Copyright © 1988-2007, Oracle. All rights reserved.
Chapter 11
Using Built-in Functions in Analytic Models
CUBEID
Syntax
CUBEID(Cube)
Description
The CUBEID function returns the internal ID of the cube in the analytic calculation engine. Note that the
actual ID for the cube may vary in the analytic calculation engine when the model has been changed. For
example, when a part is added or deleted. Do not use absolute numbers to compare the return of the CUBEID
function. The CUBEID function may be useful if you have a generic user function and you want to pass
different data cubes as expression arguments.
Returns
The internal ID of the cube in the analytic calculation engine.
Example
IF(CUBEID(@MyCube) = CUBEID(REVENUE), SPECIAL_CONDITION_CALCULATION, DEFAULT_⇒
CALCULATION)
This is an example of incorrect usage of the CUBEID function:
IF( CUBEID(@MYCUBE) = 512, SPECIAL_CONDITION, DEFAULT_CONDITION)
CUMAVG
Syntax
CUMAVG(Dimension, Data, {Count})
Description
The CUMAVG function returns the cumulative average of Data for the last Count members of Dimension. If
Count is omitted, CUMAVG returns the cumulative average of all members up to the member being calculated.
Example
The following examples provide uses of the CUMAVG function:
Example 1
Suppose an analytic model contains a data cube called SCORES that uses a dimension called TESTS. Use the
following formula to compute the average of all test scores up to the test being calculated:
CUMAVG(TESTS, SCORES)
This formula calculates Cum_Avg_Score for Test 2 by averaging the scores for Test 1 and Test 2; it calculates
Cum_Avg_Score for Test 3 by averaging the scores for Test 1, 2, and 3; and so on. Because the third argument
is omitted, the function averages the scores for all tests up to the test being calculated.
Example 2
Suppose an analytic model contains a data cube called SALES that uses a dimension called MONTHS. Compute
the average sales for the last six months as follows:
Copyright © 1988-2007, Oracle. All rights reserved.
147
Using Built-in Functions in Analytic Models
Chapter 11
CUMAVG(MONTHS, SALES, 6)
Note that for the first five months, the CUMAVG function cannot look back six months, because this would go
back before the first month in the MONTHS dimension. The program solves this problem by averaging the
sales for all months up to the month being calculated. After the first five months, the function averages the
sales for the six months up to the month being calculated.
CUMSUM
Syntax
CUMSUM(Dimension, Data, {Count})
Description
The CUMSUM function returns the cumulative sum of Data for the last Count members of Dimension. If
Count is omitted, CUMSUM returns the cumulative sum of all members up to the member being calculated.
Returns
The cumulative sum of Data for the last Count members of Dimension.
If Count is omitted, CUMSUM returns the cumulative sum of all members up to the member being calculated.
Example
Suppose an analytic model contains a data cube called PROFIT that uses a dimension called MONTHS. Use
the following formula to calculate the cumulative profit for all months up to the month being calculated:
CUMSUM(MONTHS, PROFIT)
Use the following formula to calculate the cumulative profit for the three months up to the month being
calculated:
CUMSUM(MONTHS, PROFIT, 3)
DAVG
Syntax
DAVG(Dimension, {Data}, {Condition})
Description
The DAVG function returns the average of Data for the members in Dimension where Condition is True. If
Condition is omitted, DAVG returns the average of Data for all members in Dimension. If Data is omitted,
DAVG returns the average of the data cube being calculated, for all members up to the current member in
Dimension.
Example
The following examples provide uses of the DAVG function:
148
Copyright © 1988-2007, Oracle. All rights reserved.
Chapter 11
Using Built-in Functions in Analytic Models
Example 1
Suppose an analytic model contains a data cube called ADVERTISING_BY_PRODUCT and a data cube called
UNITS_SOLD. Both data cubes use a dimension called PRODUCTS. Use the following formula to calculate
the average units sold for all products:
DAVG(PRODUCTS, UNITS_SOLD)
The DAVG function does not include a condition, so the function averages UNITS_SOLD for all members in
the PRODUCTS dimension. Use the following formula to calculate the average units sold for all products
with advertising of at least USD 10,000:
AVG(PRODUCTS, UNITS_SOLD, ADVERTISING_BY_PRODUCT >= 10000)
In this case, the function averages UNITS_SOLD only for the products where ADVERTISING_BY_PRODUCT
is greater than or equal to 10000.
Example 2
You can make the analysis more flexible by creating a dimension called RANGES and attaching it to
AVG_UNITS_SOLD. Define a new data cube called AD_COST_MIN that uses the RANGES dimension. Each
number in AD_COST_MIN defines the minimum value for the range, while the next number defines the upper
limit for the range. Calculate the average units sold for each range as follows:
DAVG(PRODUCTS, UNITS_SOLD, ADVERTISING_BY_PRODUCT >= AD_COST_MIN .AND. ADVERTISING_⇒
⇒
⇒
BY_PRODUCT < NEXT(RANGES, AD_COST_MIN))
For each range, the formula averages only those products whose advertising cost is greater than or equal
to the current AD_COST_MIN and less than the next AD_COST_MIN. (The NEXT function returns
AD_COST_MIN for the next member in the RANGES dimension.)
See Also
Chapter 11, “Using Built-in Functions in Analytic Models,” NEXT, page 175
DAY
Syntax
DAY({Date})
Description
The DAY function returns the day of the specified date. If Date is omitted, DAY returns the day of the
calculation date.
Example
If A = 2004/03/15 and B = 2005/06/22, then DAY(A) returns 15 and DAY(B) returns 22.
Now suppose an analytic model contains a data cube called DAY_EXAMPLE that uses a dimension called
DAYS, and contains the formula DAY_EXAMPLE = DAY( ). Because the argument is omitted, DAY returns the
day for each date in the DAYS dimension.
Copyright © 1988-2007, Oracle. All rights reserved.
149
Using Built-in Functions in Analytic Models
Chapter 11
Following is a more useful example of the DAY function: suppose you define a data cube called
DAILY_RECEIPTS that uses a dimension called DAYS. You want to calculate the average receipts for each day
of the month. In other words, you want to know the average receipts for the first day of each month, the average
receipts for the second day of each month, and so on. To do this, create a dimension called DAY_NUM that
contains members numbered 1 to 31. Then define a data cube called AVG_RECEIPTS_BY_DAY that uses the
DAY_NUM dimension. Finally, enter the following formula for the AVG_RECEIPTS_BY_DAY data cube:
DAVG(DAYS, DAILY_RECEIPTS, DAY( ) = MEMBER(DAY_NUM))
For each DAY_NUM member in AVG_RECEIPTS_BY_DAY, the formula averages all DAILY_RECEIPTS
where the day of the month equals the index of the DAY_NUM member. Thus, if the program is calculating
the fifth DAY_NUM member for AVG_RECEIPTS_BY_DAY, it averages the receipts for the dates
2005/01/05, 2005/02/05, 2005/03/05, 2005/04/05, and so on, because these are the dates where the DAY( )
function returns 5.
See Also
Chapter 11, “Using Built-in Functions in Analytic Models,” DAVG, page 148 and Chapter 11, “Using Built-in
Functions in Analytic Models,” MEMBER, page 172.
DCOUNT
Syntax
DCOUNT(Dimension, {Condition})
Description
The DCOUNT function returns the number of members in Dimension for which Condition is true. If Condition
is omitted, DCOUNT returns the number of members in Dimension.
Returns
The number of members in Dimension for which Condition is true. If Condition is omitted, DCOUNT returns
the number of members in Dimension.
Example
Suppose an analytic model contains a data cube called UNITS_SOLD that uses a dimension called PRODUCTS.
Use the following formula to find the number of products that sold more than 5000 units:
DCOUNT(PRODUCTS, UNITS_SOLD > 5000)
For an example of how to tabulate data for a series of ranges, see the entry for the DAVG function.
See Also
Chapter 11, “Using Built-in Functions in Analytic Models,” DAVG, page 148
DDB
Syntax
DDB(Cost, Salvage, Life, Period)
150
Copyright © 1988-2007, Oracle. All rights reserved.
Chapter 11
Using Built-in Functions in Analytic Models
Description
The DDB function returns the depreciation on an asset using the Double Declining Balance method. This
is an accelerated depreciation method.
Parameters
Parameter
Description
Cost
The cost of the asset.
Salvage
The worth of the asset at the end of its useful life.
Life
The number of periods in the asset’s useful life.
Period
The period for which you wish to determine the depreciation.
Returns
The depreciation on an asset using the Double Declining Balance method.
Example
Suppose you purchase a machine for USD 6,000, and you plan to sell it for USD 500 after 5 years. You can
calculate the depreciation for each year as follows:
• DDB(6000, 500, 5, 1) = 2400
• DDB(6000, 500, 5, 2) = 1440
• DDB(6000, 500, 5, 3) = 864
• DDB(6000, 500, 5, 4) = 518
• DDB(6000, 500, 5, 5) = 278
DEC
Syntax
DEC(Number Original Value, Number Amount to Decrement)
Description
The DEC function returns an decremented value based on an original value and the amount to increment.
Returns
An decremented value based on an original value and the amount to increment.
Example
DEC(&NumMonths, &EndMonth - &StartMonth - 1)
This formula subtracts the months between the start and end month to the variable &NumMonths. DEC
function is useful in FOR or WHILE functions to decrement loop variables.
Copyright © 1988-2007, Oracle. All rights reserved.
151
Using Built-in Functions in Analytic Models
Chapter 11
See Also
Chapter 11, “Using Built-in Functions in Analytic Models,” FOR, page 156 and Chapter 11, “Using Built-in
Functions in Analytic Models,” WHILE, page 197.
DLOOKUP
Syntax
DLOOKUP(Dimension, Data, Condition, {Direction})
Description
The DLOOKUP function returns Data for the first Member in Dimension where Condition is true. If Direction
is omitted or zero, the function scans forward from the first member. If Direction is nonzero, the function scans
backward from the last member. If no member in Dimension fulfills the Condition, the function returns zero.
Returns
Data for the first member in Dimension where Condition is true. If Direction is omitted or zero, the function
scans forward from the first member. If Direction is nonzero, the function scans backward from the last
member. If no member in Dimension fulfills the Condition, the function returns zero.
Example
Suppose that a company awards its salespeople a 10 percent commission if their sales are at least USD 50,000,
an 8 percent commission if their sales are at least USD 30,000, a 5 percent commission if their sales are at least
USD 15,000, and a 1 percent commission if their sales are less than USD 15,000. One way to calculate the
commission is to create a lookup table. Define a dimension called RANGES and attach it to data cubes called
SALES_MINIMUM and LOOKUP_RATE. Each number in SALES_MINIMUM defines the minimum value
for the sales range, while the next number defines the upper limit for the range. LOOKUP_RATE holds the
commission rate for each range. Use the following formula to calculate the commission rate:
DLOOKUP(RANGES, LOOLUP_RATE, SALES >= SALES_MINIMUM, 1)
Because the last argument of DLOOKUP is 1, the function starts with the last member of RANGES and scans
backwards until SALES is greater than or equal to SALES_MINIMUM. It is important to scan backwards
to find the highest lookup rate for which the condition is true. Otherwise, the formula returns the lowest
lookup rate no matter how high the value of SALES is.
DMAX
Syntax
DMAX(Dimension, Data, {Condition})
Description
The DMAX function returns the maximum of Data for the members in Dimension where Condition is True.
If Condition is omitted, DMAX returns the maximum of Data for all members in Dimension. If Data is
omitted, DMAX returns the maximum of the data cube being calculated, for all members up to the current
member in Dimension.
152
Copyright © 1988-2007, Oracle. All rights reserved.
Chapter 11
Using Built-in Functions in Analytic Models
Returns
The maximum of Data for the members in Dimension where Condition is True. If Condition is omitted,
DMAX returns the maximum of Data for all members in Dimension. If Data is omitted, DMAX returns the
maximum of the data cube being calculated, for all members up to the current member in Dimension.
Example
Suppose that an analytic model contains a data cube called ADVERTISING_BY_PRODUCT and a data cube
called UNITS_SOLD. Both data cubes use a dimension called PRODUCTS. Use the following formula to
calculate the maximum units sold for all products:
MAX(PRODUCTS, UNITS_SOLD)
The DMAX function does not include a condition, so the function finds the maximum of UNITS_SOLD for all
members in the PRODUCTS dimension. Use the following formula to calculate the maximum units sold for
all products with advertising under USD 10,000:
DMAX(PRODUCTS, UNITS_SOLD, ADVERTISING_BY_PRODUCT < 10000)
In this case, the function finds the maximum units sold only for the products where
ADVERTISING_BY_PRODUCT is less than 10000.
For an example of how to tabulate data for a series of ranges, see the entry for the DAVG function.
See Also
Chapter 11, “Using Built-in Functions in Analytic Models,” DAVG, page 148
DMIN
Syntax
DMIN(Dimension, Data, {Condition})
Description
The DMIN function returns the minimum of Data for the members in Dimension where Condition is True.
If Condition is omitted, DMIN returns the minimum of Data for all members in Dimension. If Data is
omitted, DMIN returns the minimum of the data cube being calculated, for all members up to the current
member in Dimension.
Returns
The minimum of Data for the members in Dimension where Condition is True. If Condition is omitted, DMIN
returns the minimum of Data for all members in Dimension. If Data is omitted, DMIN returns the minimum of
the data cube being calculated, for all members up to the current member in Dimension.
Example
Suppose that an analytic model contains a data cube called ADVERTISING_BY_PRODUCT and a data cube
called UNITS_SOLD. Both data cubes use a dimension called PRODUCTS. Use the following formula to
calculate the minimum units sold for all products:
DMIN(PRODUCTS, UNITS_SOLD)
The DMIN function does not include a condition, so the function finds the minimum of UNITS_SOLD for all
members in the PRODUCTS dimension. Use the following formula to calculate the minimum units sold for all
products with advertising of at least 10,000 USD:
Copyright © 1988-2007, Oracle. All rights reserved.
153
Using Built-in Functions in Analytic Models
Chapter 11
MIN(PRODUCTS, UNITS_SOLD, ADVERTISING_BY_PRODUCT >= 10000)
In this case, the function finds the minimum units sold only for the products where
ADVERTISING_BY_PRODUCT is greater than or equal to 10000.
For an example of how to tabulate data for a series of ranges, see the entry for the DAVG function.
See Also
Chapter 11, “Using Built-in Functions in Analytic Models,” DAVG, page 148
DSUM
Syntax
DSUM(Dimension, {Data}, {Condition})
Description
The DSUM function returns the sum of Data for the members in Dimension where Condition is True. If
Condition is omitted, DSUM returns the sum of Data for all members in Dimension. If Data is omitted, DSUM
returns the sum of the data cube being calculated for all members up to the current member in Dimension.
Example
Suppose that an analytic model contains a data cube called ADVERTISING_BY_PRODUCT and a data cube
called UNITS_SOLD. Both data cubes use a dimension called PRODUCTS. Use the following formula to
calculate the total units sold for all products:
DSUM(PRODUCTS, UNITS_SOLD)
The DSUM function does not include a condition, so the function computes the sum of UNITS_SOLD for all
members in the PRODUCTS dimension. Use the following formula to calculate the sum of units sold for all
products with advertising of at least 10,000 USD:
DSUM(PRODUCTS, UNITS_SOLD, ADVERTISING_BY_PRODUCT >= 10000)
In this case, the function finds the sum of UNITS_SOLD only for the products where
ADVERTISING_BY_PRODUCT is greater than or equal to 10000.
For an example of how to tabulate data for a series of ranges, see the entry for the DAVG function.
You can use the DSUM function without the Data argument to exercise complete control over the calculation
of dimension totals for a particular data cube.
See Also
Chapter 11, “Using Built-in Functions in Analytic Models,” DAVG, page 148
E
Syntax
E( )
Description
Use the E function to return the value of e, which is the base of natural logarithms.
154
Copyright © 1988-2007, Oracle. All rights reserved.
Chapter 11
Using Built-in Functions in Analytic Models
Returns
The value of e.
Example
These examples employ the E built-in function:
• E( ) returns 2.7182818285.
• E( ) ^ 5 returns 148.4131591026 (e raised to the 5th power).
FIND
Syntax
FIND(Text Original String, Text Sub String, Number Starting Position)
Description
Use the FIND function to find a substring in the original string passed in starting from a specified start
position in the original string.
Parameters
Parameter
Description
Text Original String
The text of the original string.
Text Sub String
The substring text to find.
Number Starting Position
The start position in the original string.
Returns
The position of the substring in the original string. The index is 1-based.
Example
The following formula finds the account name that begins with Expense:
IF(FIND(ACCOUNT_NAME, "Expense", 1) = 1, #TRUE, #FALSE)
FIRST
Syntax
FIRST(Dimension)
Description
Use the FIRST function to test for special cases that occur when the first member of a dimension is being
calculated.
Copyright © 1988-2007, Oracle. All rights reserved.
155
Using Built-in Functions in Analytic Models
Chapter 11
Parameters
Parameter
Dimension
Description
The dimension to test.
Returns
The FIRST function returns the first detail member regardless if the detail member is created out of a tree that
is attached to the dimension. The FIRST function also returns True if the first member of Dimension is being
calculated; otherwise, it returns False.
FOR
Syntax
FOR(Index, Start, Finish, Loop Body)
Description
The FOR function loops through a series of values.
Parameters
Parameter
Description
Index
The name of the variable that holds the index number.
Start
The index value at which to start the loop.
Finish
The index value at which to finish the loop.
Loop Body
The action to take at the current index.
Example
The following formula raises a base to an integral exponent without using the ^ operator:
IF(EXPONENT <> TRUNC(EXPONENT), RETURN(0.0));
SET(&Result, 1);
FOR(&Index, 1, ABS(EXPONENT),
SET(&Result, &Result * BASE)
);
IF(EXPONENT >= 0, &Result, 1 / &Result)
In this formula, the FOR function sets the specified variable to each value at the beginning of the loop,
counting up if Finish is greater than Start, and counting down if Start is greater than Finish.
FORCHILDREN
Syntax
FORCHILDREN(Dimension, Expression, {#DIRECT/#ALL/#DETAILS, {Parent Member}})
156
Copyright © 1988-2007, Oracle. All rights reserved.
Chapter 11
Using Built-in Functions in Analytic Models
Note. The third and fourth arguments are optional.
Description
The FORCHILDREN function loops through all child members of a dimension’s parent member, unless you
interrupt the FORCHILDREN function with a BREAK function.
Parameters
The FORCHILDREN function takes two required arguments and two optional arguments. The first and second
arguments are required. The third and fourth arguments are optional.
Parameter
Description
Dimension
The dimension to use.
Expression
The expression to evaluate for each iteration.
#DIRECT, #ALL, #DETAILS
This argument is optional. Select from one of these predefined constants.
Note. #DIRECT is the default constant.
Parent Member
This argument is optional. If you do not use this argument, the function applies to the
member that is currently being evaluated.
Example
FORCHILDREN(Region,
IF(Sales > & MaxSales,
&MaxSales := Sales;
&Region:= Member;
),
#DIRECT,
[Region:USA]
);
&Region;
See Also
Chapter 9, “Creating Hierarchies,” Pushed Down Data, page 80
FORMEMBERS
Syntax
FORMEMBERS(Dimension, Direction, Expression)
Description
The FORMEMBERS function loops through all of the members of a dimension (unless you interrupt it with
the BREAK function).
Copyright © 1988-2007, Oracle. All rights reserved.
157
Using Built-in Functions in Analytic Models
Chapter 11
Parameters
Parameter
Description
Dimension
The dimension to use.
Direction
The direction to loop through the members (#FORWARD or #REVERSE).
Expression
The expression to evaluate for each iteration.
Example
Consider the following formula that uses DLOOKUP:
DLOOKUP(RANGES, COMMISSION_RATE, SALES >= SALES_LEVEL, #REVERSE)
You could achieve the same thing with the FORMEMBERS function:
FORMEMBERS(RANGES, #REVERSE,
IF(SALES >= SALES_LEVEL, RETURN(COMMISSION_RATE))
);
RETURN(0)
Of course, in this case it is simpler just to use the DLOOKUP function, but the FORMEMBERS function
makes it possible to perform more sophisticated lookups and tabulations. For example, the following formula
returns the product that has the highest sales:
FORMEMBERS(PRODUCTS, #FORWARD,
IF(SALES > &MaxSales,
SET(&MaxSales, SALES);
SET(&Product, MEMBER(PRODUCTS))
)
);
&Product
Following is how you would have to do it without procedural logic:
DLOOKUP(PRODUCTS, MEMBER(PRODUCTS), SALES = DMAX(PRODUCTS, SALES))
The above version is shorter, but it is much less efficient than the version that uses procedural logic, because it
calculates the DMAX repeatedly for every product.
You could eliminate some of the redundancy by using an expression block and a variable:
SET(&MaxSales, DMAX(PRODUCTS, SALES));
DLOOKUP(PRODUCTS, MEMBER(PRODUCTS), SALES = &MaxSales)
The previous version is more effective than the version that does not use procedural logic, but it is not as
effective as the version that uses procedural logic. This is because in the version that does not use procedural
logic, the FORMEMBERS function only loops through the products once. In the previous version, it loops
through them twice—once for the DMAX and once for the DLOOKUP—although the DLOOKUP stops
when it finds the right product.
FV
Syntax
FV(Rate, NPer, Pmt, PV, {Type})
158
Copyright © 1988-2007, Oracle. All rights reserved.
Chapter 11
Using Built-in Functions in Analytic Models
Description
The FV function returns the Future Value of an investment with a present value of PV, where Pmt is invested
for NPer periods at Rate per period. If Type is omitted or zero, FV assumes the investment is an ordinary
annuity. If Type is nonzero, FV assumes the investment is an annuity due.
Note. Enter negative amounts for money out of your pocket, or positive amounts for money coming to you.
Example
Suppose that you deposit USD 1,000 at the end of each year in a savings account that earns 6 percent per year.
To determine the value of the account after 8 years, use the following formula:
FV(0.06, 8, -1000, 0) = 9897
If you deposit the USD 1,000 at the start of each year, use the following formula for the VALUE_OF_ACCT
data cube. The 1 for the Type argument indicates an annuity due:
FV(0.06, 8, -1000, 0, 1) = 10491
If the account already has USD 3,000 in it at the start of the 8 years, use the following formula:
FV(0.06, 8, -1000, -3000, 1) = 15273
GROUPAVG
Syntax
GROUPAVG(Dimension to Group, Expression, Association 1, {Association 2 ...})
Description
Use the GROUPAVG function to average information by group. Expression contains the data to sum. The
Assocation(s) indicate for which group(s) to average.
Example
Suppose that you want to average employee salaries by department. Create an analytic model definition
that contains the following data cubes:
1. EMPLOYEE_SALARY, which uses a dimension called EMPLOYEES.
This data cube contains the salary for each employee.
2. AVERAGE_DEPARTMENT_SALARY, which uses a dimension called DEPARTMENTS.
This data cube contains the average salaries for each department.
3. An association data cube called EMPLOYEE_DEPT by performing the following:
• Create the EMPLOYEE_DEPT data cube.
• Format the EMPLOYEE_DEPT data cube as a member of the DEPARTMENTS dimension.
• Attach the EMPLOYEES dimension to the EMPLOYEE_DEPT data cube.
Calculate Department Salary with the following formula:
GROUPAVG(EMPLOYEES, EMPLOYEE_SALARY, EMPLOYEE_DEPT)
You can read this formula as follows: Average the employees’ salaries by department.
Copyright © 1988-2007, Oracle. All rights reserved.
159
Using Built-in Functions in Analytic Models
Chapter 11
To calculate group averages of all members that meet a condition, use an IF function as the expression, with
#N/A as the third argument. For example, to calculate average officer salaries by department, you could use
IF(IS_OFFICER, EMPLOYEE_SALARY, #N/A) instead of EMPLOYEE_SALARY in the formula above.
GROUPBY
Syntax
GROUPBY(Association)
Description
Use the GROUPBY function in a condition to group detail members by summary members (for example,
employees by department). The argument must be an association data cube; otherwise, the function returns an
error.
Example
Suppose that an analytic model contains an association data cube called DEPARTMENTS, which associates
each employee with a particular department. The following formula for the EMPLOYEES_IN_DEPT cube
uses DCOUNT and GROUPBY to calculate the number of employees in each department:
DCOUNT(EMPLOYEES, GROUPBY(DEPARTMENTS))
The following formula for the AVG_SALARY_BY_DEPT data cube uses DAVG and GROUPBY to calculate
the average salary for each department :
DAVG(EMPLOYEES, EMPLOYEE_SALARY, GROUPBY(DEPARTMENTS))
You can combine the GROUPBY function with other conditions. For example, the following formula for
the OFFICER_SALARIES_BY_DEPT cube uses the DSUM function to calculate the total officer salaries
in each department. By combining IS_OFFICER with the GROUPBY function, the formula ensures that
only officers are included in the sum:
DSUM(EMPLOYEES, EMPLOYEE_SALARY, GROUPBY(DEPARTMENTS) .AND. IS_OFFICER)
Note that DSUM(EMPLOYEES, EMPLOYEE_SALARY, GROUPBY(DEPARTMENTS)) is equivalent to
GROUPSUM(EMPLOYEES, EMPLOYEE_SALARY, DEPARTMENTS). Using DSUM with GROUPBY is
more flexible, because you can include other conditions, as shown in the formula above. On the other hand, the
GROUPSUM function calculates significantly faster. For this reason, if you want to sum by group and you do
not need to include other conditions, use the GROUPSUM function.
See Also
Chapter 11, “Using Built-in Functions in Analytic Models,” DCOUNT, page 150, Chapter 11, “Using Built-in
Functions in Analytic Models,” DAVG, page 148, Chapter 11, “Using Built-in Functions in Analytic Models,”
DSUM, page 154 and Chapter 11, “Using Built-in Functions in Analytic Models,” GROUPSUM, page 162.
GROUPMAX
Syntax
GROUPMAX(Dimension to Group, Expression, Association 1, {Association 2 ...})
Description
Use the GROUPMAX function to maximize information by group. Expression contains the data to maximize.
The Association(s) indicate for which group(s) to maximize.
160
Copyright © 1988-2007, Oracle. All rights reserved.
Chapter 11
Using Built-in Functions in Analytic Models
Example
Suppose that you want to maximize sales information by product. Create an analytic model definition that
contains the following dimensions:
1. TRANSACTIONS, which contains a series of sales transactions.
2. PRODUCTS, which contains a dimension of products.
Define the following data cubes:
1. SALE_AMOUNT, which uses the TRANSACTIONS dimension. This data cube contains the amount
of each sale.
2. An association data cube called PRODUCT_SOLD, which associates TRANSACTIONS with
PRODUCTS.
See Chapter 5, “Creating Data Cubes,” Creating Association Data Cubes, page 39.
3. MAXIMUM_SALES_BY_PRODUCT, which uses the PRODUCTS dimension.
Calculate this data cube with the following formula:
GROUPMAX(TRANSACTIONS, SALE_AMOUNT, PRODUCT_SOLD)
You can read this formula as follows: Find the maximum transactions’ sale amounts by product.
To calculate group maximums of all members that meet a condition, use an IF function as the expression,
with #N/A as the third argument. For example, use IF(VALID, SALE_AMOUNT, #N/A) instead of
SALE_AMOUNT in the formula above.
GROUPMIN
Syntax
GROUPMIN(Dimension to Group, Expression, Association 1, {Association 2 ...})
Description
Use the GROUPMIN function to minimize information by group. Expression contains the data to minimize.
The Association(s) indicate for which group(s) to minimize.
Example
Suppose that you want to minimize sales information by product. Create an analytic model definition that
contains the following dimensions:
1. TRANSACTIONS, which contains a series of sales transactions.
2. PRODUCTS, which contains a series of products.
Define the following data cubes:
1. SALE_AMOUNT, which uses the TRANSACTIONS dimension.
This data cube contains the amount of each sale.
2. An association data cube called PRODUCT_SOLD, which associates TRANSACTIONS with
PRODUCTS.
See Chapter 5, “Creating Data Cubes,” Creating Association Data Cubes, page 39.
Copyright © 1988-2007, Oracle. All rights reserved.
161
Using Built-in Functions in Analytic Models
Chapter 11
3. MINIMUM_SALES_BY_PRODUCT, which uses the PRODUCTS dimension. Calculate this data
cube with the following formula:
GROUPMAX(TRANSACTIONS, SALE_AMOUNT, PRODUCT_SOLD)
You can read this formula as follows: Find the maximum transactions’ sale amounts by product.
To calculate group maximums of all members that meet a condition, use an IF function as the expression,
with #N/A as the third argument. For example, use IF(VALID, SALE_AMOUNT, #N/A) instead of
SALE_AMOUNT in the formula above.
GROUPSUM
Syntax
GROUPSUM(Dimension to Group, Expression, Association 1, {Association 2 ...})
Description
Use the GROUPSUM function to sum information by group. Expression contains the data to sum. The
Association(s) indicate what group(s) to sum by.
Example
The following examples provide uses of the GROUPSUM function:
Example 1
For example, suppose you want to sum employee salaries by department. Create an analytic model definition
that contains the following data cubes:
1. EMPLOYEE_SALARY, which uses a dimension called EMPLOYEES.
This data cube contains the salary for each employee.
2. DEPARTMENT_SALARY, which uses a dimension called DEPARTMENTS.
This data cube contains the total salaries for each department.
3. An association data cube called EMPLOYEE_DEPT, which associates each employee with a particular
department.
Calculate DEPARTMENT_SALARY with the following formula:
GROUPSUM(EMPLOYEES, EMPLOYEE_SALARY, EMPLOYEE_DEPT)
You can read this formula as follows: Sum the employees’ salaries by department.
Example 2
The GROUPSUM function can also perform more complex groupings. For example, suppose you want to sum
employee salaries by branch and department. To do this, perform the following additional steps:
1. Create a dimension called BRANCHES, which contains a dimension of the branches.
2. Create an association data cube called EMPLOYEE_BRANCH, which associates the EMPLOYEES
dimension with the BRANCHES dimension.
3. Define a data cube called SALARY_BY_BRANCH_AND_DEPT, which uses both the BRANCHES and
DEPARTMENTS dimensions. Calculate this data cube with the following formula:
162
Copyright © 1988-2007, Oracle. All rights reserved.
Chapter 11
Using Built-in Functions in Analytic Models
GROUPSUM(EMPLOYEES, EMPLOYEE_SALARY, EMPLOYEE_BRANCH, EMPLOYEE_DEPT)
You can read this formula as follows: Sum the employees’ salaries by branch and department.
As this example demonstrates, you can summarize detail information for a combination of dimensions by
using an association for each dimension.
Example 3
In many cases, it is useful to summarize information by date. In these cases, use a data cube with a Date
format instead of an association.
For example, suppose you want to summarize sales information by product and month. Create an analytic
model definition that contains the following dimensions:
1. TRANSACTIONS, which contains a series of sales transactions.
2. PRODUCTS, which contains a dimension of products.
3. MONTHS, which contains a series of months.
Define the following data cubes:
1. SALE_AMOUNT, which uses the TRANSACTIONS dimension.
This data cube contains the amount of each sale.
2. An association data cube called PRODUCT_SOLD, which associates TRANSACTIONS with
PRODUCTS.
3. SALE_DATE, which uses the TRANSACTIONS dimension and the YYYY/MM/DD format. This
data cube contains the date for each transaction.
4. MONTHLY_SALES, which uses the PRODUCTS and MONTHS dimension. Calculate this data cube
with the following formula:
GROUPSUM(TRANSACTIONS, SALE_AMOUNT, PRODUCT_SOLD, SALE_DATE)
You can read this formula as follows: Sum the transactions’ sale amounts by product and sale date. Because
SALE_DATE is Date formatted (YYYY/MM/DD), the GROUPSUM function knows to sum by date.
To calculate group sums of all members which meet a condition, use an IF function as the expression,
with #N/A as the third argument. For example, use IF(Valid, SALE_AMOUNT, #N/A) instead of
SALE_AMOUNT in the MONTHLY_SALES formula above.
GROW
Syntax
GROW(Dimension, Start Value, Growth Rate)
Description
The GROW function returns a number representing the specified Growth Rate per Member from Start Value.
This is a straight line growth function.
Example
Suppose that an analytic model contains single value data cubes called SALES_START and
ANNUAL_GROWTH. You can project the monthly sales with the following formula:
Copyright © 1988-2007, Oracle. All rights reserved.
163
Using Built-in Functions in Analytic Models
Chapter 11
GROW(MONTHS, SALES_START, ANNUAL_GROWTH / 12)
Note that you must divide ANNUAL_GROWTH by 12, because the GROW function expects a growth rate
per member, and the members in this case are months.
Note. For the GROW function to return meaningful results, the Start Value and Growth Rate arguments should
not use the dimension indicated by the dimension argument. For example, if you are calculating monthly
values, the Start Value and Growth Rate arguments should not use the MONTHS dimension.
IF
Syntax
IF(Condition, Result if True, Result if False)
Description
The IF function returns Result if True if Condition is true; otherwise, the function returns Result if False.
Returns
Result if True if Condition is true; otherwise, the function returns Result if False.
Example
For example, suppose a company awards its salespeople a 10 percent commission on sales of at least USD
20,000, and a 5 percent commission on sales under USD 20,000. You create a COMMISSION cube and can
compute the commission for each person as follows:
IF(SALES >= 20000, 0.1 * SALES, 0.05 * SALES)
The IF function in this formula tests whether SALES is greater than or equal to 20000. If so, the function
returns 10 percent of SALES; otherwise, the function returns 5 percent of SALES.
INC
Syntax
INC(Original Value, Amount to Increment)
Description
The INC function returns an incremented value based on an original value and the amount to increment.
Returns
An incremented value based on an original value and the amount to increment.
Example
INC(&NumMonths, &EndMonth - &StartMonth - 1)
This formula adds the months between the start and end month to the variable &NumMonths.
164
Copyright © 1988-2007, Oracle. All rights reserved.
Chapter 11
Using Built-in Functions in Analytic Models
INCDATE
Syntax
INCDATE(Date, Months, Years)
Description
The INCDATE returns the value of Date incremented by Months and Years.
Returns
The value of Date incremented by Months and Years.
Example
If Date contains the date 2001/04/18, INCDATE(Date, 3, 2) returns the date 2003/07/18.
If Date falls on the last day of a month, INCDATE returns a date that falls on the last day of a month, even
if it has to change the day. For example, if Date contains the date 2003/04/30, then INCDATE(Date,
3, 2) returns the date 2005/07/31 rather than 2005/07/30. Because Date contains the last day of April,
INCDATE returns the last day of July.
Suppose that an analytic model contains a data cube called HIRE_DATE that uses a dimension called
EMPLOYEES. Company policy starts benefits for an employee three months after the hire date. The following
formula calculates the benefits date for each employee as follows:
INCDATE(HIRE_DATE, 3, 0)
See Also
Chapter 11, “Using Built-in Functions in Analytic Models,” IF, page 164
INPUT
Syntax
INPUT()
Description
The INPUT function returns the value that an end user has entered into a cell, and supports both calculated
cells and input cells in a single data cube.
Returns
The value that an end user has entered into a cell.
Example
You can use the INPUT function in both an IF function and a CASE function. For example:
IF([SCENARIOS:Actual], INPUT( ), FORECAST_REVENUE_CALCULATION)
This formula returns 88 if the Scenario value is Actual and the end user enters 88. This formula causes all
cells for the Actual dimension member to become input cells, leaving the remaining cells to be calculated.
Copyright © 1988-2007, Oracle. All rights reserved.
165
Using Built-in Functions in Analytic Models
Chapter 11
When a formula uses the INPUT function, the analytic calculation engine evaluates the formula for a particular
cell to determine whether it should be an input cell. As long as the input condition in the formula refers to
input cubes and member references, no recalculation is necessary to ensure that the correct cells are treated as
input cells.
The INPUT function works a lot like the RETURN function; it causes the analytic calculation engine to stop
evaluating the formula and to immediately return a value, which in this case is the current value of the cell.
The INPUT function works like RETURN(SELF( )), and additionally makes the cell editable.
See Also
Chapter 5, “Creating Data Cubes,” Input Data Cubes, page 32 and Chapter 11, “Using Built-in Functions in
Analytic Models,” ISINPUT, page 166.
INSUBTREE
Syntax
INSUBTREE(Dimension, Parent Member, {Child Member})
Description
The INSUBTREE function returns a boolean value identifying whether a child member is in a subtree that
contains a parent member as its root.
Parameters
The INSUBTREE function takes two required arguments and one optional argument. The first and second
arguments are required. The third argument is optional.
Parameter
Description
Dimension
The dimension to use.
Parent Member
The parent member to use.
Child Member
This optional argument tests whether the child member lies within a subtree that
contains the parent member (as supplied in the second argument) as its root.
Example
INSUBTREE(Region, [Region:USA], [Region:Oakland]);
ISINPUT
Syntax
ISINPUT(Cube)
Description
The ISINPUT function returns True if the user has entered the current value of the cube.
Example
ISINPUT(Cube with no formula) returns True.
166
Copyright © 1988-2007, Oracle. All rights reserved.
Chapter 11
Using Built-in Functions in Analytic Models
ISINPUT(Cube with formula) returns False.
The ISINPUT function provides an easy way to filter tables so that they show input cells. The ISINPUT
function takes a single argument, which must be a cube.
To work well with filter functions, the function maps totals to the first member of the dimension if a first
member exists. Because the row filters are not aware of members in the columns—and vice versa—the
analytic calculation engine usually evaluates totals in formulas. The analytic calculation engine already bends
the total mapping rules for filters for this reason; the behavior of ISINPUT is just an extension of this behavior.
INTERCEPT
Syntax
INTERCEPT(Dimension, Y, X, {Condition})
Description
The INTERCEPT function returns the Y-intercept of the line that has the closest fit to the points represented
by Y and X. (The Y-intercept is the point at which the line crosses the Y axis.) If Condition is omitted, the
function fits the line to all of the members in Dimension. If Condition is included, the function fits the
line only to those members that meet the condition.
Use the INTERCEPT function together with the SLOPE function to find the line with the closest fit to a set of
points. You can use these functions to analyze a historical trend, and then use the trend to make forecasts. For
interesting examples of how to use these functions, see the entry for the SLOPE function.
Returns
The Y-intercept of the line that has the closest fit to the points represented by Y and X. (The Y-intercept is
the point at which the line crosses the Y axis.) If Condition is omitted, the function fits the line to all of
the members in Dimension. If Condition is included, the function fits the line only to those members that
meet the condition.
See Also
Chapter 11, “Using Built-in Functions in Analytic Models,” SLOPE, page 189
IRR
Syntax
IRR(Dimension, Cash Flow, {Guess}, {Condition})
Description
The IRR function returns the Internal Rate of Return for Cash Flow. Guess can be omitted (or zero) in most
cases. If IRR is unable to find the Internal Rate of Return, it returns an error value. In such cases, you can use a
nonzero Guess to nudge IRR toward the correct answer.
Note. Some cash flows have no valid Internal Rate of Return, in which case IRR returns an error value for
any Guess.
If Condition is omitted, the function uses all values of Cash Flow. If Condition is included, the function uses
only those values of Cash Flow for which Condition is True.
Copyright © 1988-2007, Oracle. All rights reserved.
167
Using Built-in Functions in Analytic Models
Chapter 11
The initial values in the cash flow should be negative to represent a cash outflow. The remaining values may
be all positive (representing cash inflows) or a combination of positive and negative.
Returns
The Internal Rate of Return for Cash Flow. Guess can be omitted (or zero) in most cases. If IRR is unable
to find the Internal Rate of Return, it returns an error value. In such cases, you can use a nonzero Guess to
nudge IRR toward the correct answer.
Example
You can calculate the internal rate of return for a data cube called IRR_OF_CASH_FLOW with this formula:
IRR(MONTHS, CASH_FLOW)
You can calculate the internal rate of return for the first 12 months for a data cube called
RR_FOR_1ST_12_MONTHS with this formula:
RR(MONTHS, CASH_FLOW, 0, MEMBER(MONTHS) <= 12)
The Condition ensures that the IRR function uses only those values for which the month index is 12 or less.
LN
Syntax
LN(Data)
Description
The LN function returns the natural logarithm of Data. The value of Data must be greater than zero; otherwise,
LN returns an error value.
Example
These examples employ the LN built-in function:
• LN(7)returns 1.9459101491.
• LN(E( ) ^ 5) returns 5.
• LN(25) / LN(5) returns 2.
• LN(-7)returns an error.
LEFT
Syntax
LEFT(Text, Count)
Description
The LEFT function returns the first Count characters of Text.
Returns
The first Count characters of Text.
168
Copyright © 1988-2007, Oracle. All rights reserved.
Chapter 11
Using Built-in Functions in Analytic Models
Example
LEFT("StringFun", 6) returns String.
LEN
Syntax
LEN(Text)
Description
The LEN FUNCTION returns the number of characters in text string.
Returns
The number of characters in text string.
Example
LEN("StringFun") returns 9.
LOWER
Syntax
LOWER(Text)
Description
The LOWER FUNCTION returns text converted to lower case.
Returns
Text converted to lower case.
Example
LOWER("StringFun") returns stringfun.
MATCH
Syntax
MATCH(Text Expression or Text Cube, Pattern, {Case Sensitive}, {Match Type})
Description
The MATCH function returns True if Text Expression or Text Cube matches Pattern.
Pattern can be any of the following:
• A text value in quotes (for example, "hello").
• A data cube with a Text format.
• The VALUE function, as in VALUE("Name").
Copyright © 1988-2007, Oracle. All rights reserved.
169
Using Built-in Functions in Analytic Models
Chapter 11
If Case Sensitive is omitted or zero, the function ignores case. If Case Sensitive is nonzero, the function
performs a case sensitive match.
Match Type can be one of these values:
• 0: Text contains Pattern.
• 1: Text matches Pattern exactly.
• 2: Text begins with Pattern.
• 3: Text ends with Pattern.
If the Match Type argument is omitted, it is assumed to be zero (text contains Pattern).
Returns
True if Text Expression or Text Cube matches Pattern.
Example
Suppose that Title = "A Quick Brown Fox" and Pattern = "brown." These results occur:
• MATCH(Title, "A quick brown fox") returns True. (Case Sensitive argument is omitted, so the
case does not have to match.)
• MATCH(Title, "a quick brown fox", 1) returns False. (Case Sensitive argument is 1, and the
case does not match.)
• MATCH(Title, "A Quick Brown", 1, 1) returns False. (Match Type argument is 1, and the
pattern does not match exactly.)
• MATCH(Title, "brown") returns True. (Title contains Brown.)
• MATCH(Title, Pattern) returns True. (Pattern equals brown, and Title contains the word Brown.)
• MATCH(Title, "a quick", 0, 2) returns True. (Title begins with A Quick.)
• MATCH(Title, "fox", 0, 2) returns False. (Title does not begin with fox.)
• MATCH(Title, "fox", 0, 3) returns True. (Title ends with Fox.)
• MATCH(LEFT(Title, 6), "Brown Fox", 1, 2) returns False (Title does not begin with Brown
Fox.)
• MATCH(MID(Title, 0, 7), "A Quick", 1) returns True (Title contains A Quick.)
• MATCH(RIGHT(Title, 9), "Brown Fox", 1, 3) returns True (Title ends with Brown Fox.)
MAX
Syntax
MAX(arg1, arg2, . . . arg16)
Description
The MAX Function returns the maximum of a series of values. The MAX Function accepts up to 16 arguments.
Example
Given A = 4, B = 3, C = 2, D = 1
170
Copyright © 1988-2007, Oracle. All rights reserved.
Chapter 11
Using Built-in Functions in Analytic Models
MAX(A, B, C, D) returns A.
You can sometimes simplify formulas by using the MAX function instead of the IF function. For example,
suppose an analytic model contains data cubes called CASH_BALANCE and CASH_MINIMUM. You might
be tempted to calculate the CASH_NEEDED cube by using the following formula:
IF(CASH_BALANCE < CASH_MINIMUM,CASH_MINIMUM - CASH_BALANCE, 0)
In other words, if CASH_BALANCE is less than CASH_MINIMUM, return the amount required to attain the
minimum cash level; otherwise, return zero. Although the IF function does the job, it is simpler to use the
MAX function:
MAX(CASH_MINIMUM - CASH_BALANCE, 0)
If CASH_BALANCE is greater than CASH_MINIMUM, the first argument is negative, so the formula returns
zero for CASH_NEEDED. If CASH_BALANCE is less than CASH_MINIMUM, the first argument is
positive, so the formula returns the amount required to attain the minimum cash level.
See Also
Chapter 11, “Using Built-in Functions in Analytic Models,” IF, page 164 and Chapter 11, “Using Built-in
Functions in Analytic Models,” MIN, page 173.
MBR2TEXT
Syntax
MBR2TEXT(Dimension, {Member})
Description
The MBR2TEXT function converts a member to text by returning its name. The Member argument can be an
association data cube, a member reference, a member index, or a function or expression that returns a member.
If Member is omitted, the function returns the name of the current member in Dimension. In other words, it is
equivalent to MBR2TEXT(DIMENSION, MEMBER(DIMENSION)).
Example
MBR2TEXT(MONTH) returns January.
MEDIAN
Syntax
MEDIAN(Dimension, Values, {Condition})
Description
The MEDIAN function returns the median of Values. If Condition is omitted, the function uses all Values. If
Condition is included, the function uses only those Values for which Condition is true.
Returns
The median of Values. If Condition is omitted, the function uses all Values. If Condition is included, the
function uses only those Values for which Condition is true.
Copyright © 1988-2007, Oracle. All rights reserved.
171
Using Built-in Functions in Analytic Models
Chapter 11
Example
Suppose that a cube collection contains a data cube called SALES that uses dimensions called PEOPLE and
MONTHS. It also contains a data cube called MEDIAN_OF_SALES that contains the following formula for
calculating the median over time for each person:
MEDIAN(MONTHS, SALES)
The cube collection also contains a data cube called MEDIAN_OF_SALES_IN_FIRST_6_MONTHS that
contains this formula:
MEDIAN(MONTHS, SALES, MEMBER(MONTHS) <= 6)
MEMBER
Syntax
MEMBER(Dimension)
Description
The MEMBER function returns the Member being calculated.
Returns
The member being calculated.
Example
The following examples employ the MEMBER function:
Example 1
You can perform different calculations for different ranges of members by comparing the MEMBER function
to a number. For example, to perform a special calculation for the first six months, use the MEMBER
function with the IF function:
IF(MEMBER(MONTHS) <= 6, EXPR_FOR_1ST_6_MONTHS, EXPR_FOR_OTHER_MONTHS)
Example 2
You can perform special calculations for a particular member in a dimension by comparing the MEMBER
function to a member reference. For example, suppose that your company allocates the Administration
department’s expense equally to all of the other departments. Your analytic model contains a DEPARTMENTS
dimension, of which Admin is a member. Your analytic model also contains a data cube, TOTAL_EXPENSE,
that contains the total expense for each department. The following formula describes how you would calculate
the administration allocation for each department in a data cube called ADMIN_ALLOCATION:
IF(MEMBER(DEPARTMENTS) = [DEPARTMENTS:Admin], -TOTAL_EXPENSE, TOTAL_EXPENSE ⇒
[DEPARTMENTS:Admin] / (NUMMEMBERS(DEPARTMENTS) - 1))
The NUMMEMBERS function returns the number of members in a dimension. The key to this formula is that
the allocation for each department is the same except for Admin. The IF function checks which department is
being calculated. If the department is Admin, the result is minus Total Expense so that it backs out the expense
for the Admin department. If the department is not Admin, the result is Total Expense for Admin—notice the
data cube slice—divided by the number of departments other than Admin.
172
Copyright © 1988-2007, Oracle. All rights reserved.
Chapter 11
Using Built-in Functions in Analytic Models
See Also
Chapter 11, “Using Built-in Functions in Analytic Models,” IF, page 164 and Chapter 11, “Using Built-in
Functions in Analytic Models,” NUMMEMBERS, page 177.
MID
Syntax
MID(Text, Start, {Count})
Description
The MID function returns Count characters from text, beginning with Start. If Count is omitted, returns all
characters to the end of text.
Example
MID("StringFun", 6, 3) returns Fun.
MIN
Syntax
MIN(X, Y)
MIN(arg1, arg2, . . . arg16)
Description
The MIN function returns the minimum of a series of values. It accepts up to 16 arguments.
Example
Given A = 4, B = 3, C = 2, D = 1
MIN(A, B, C, D) returns D.
You can sometimes simplify formulas by using the MIN function instead of the IF function. For example,
suppose that an analytic model contains data cubes called CASH_NEEDED, CREDIT_BALANCE, and
MAX_CREDIT. You might be tempted to calculate the CREDIT_DRAW by using the following formula:
IF(CASH_NEEDED <= MAX_CREDIT - CREDIT_BALANCE, CASH_NEEDED, MAX_CREDIT - CREDIT_⇒
BALANCE)
In other words, if CASH_NEEDED is less than or equal to the available credit, draw the full CASH_NEEDED;
otherwise, draw the available credit. Although the IF function does the job, the MIN function is simpler:
MIN(CASH_NEEDED, MAX_CREDIT - CREDIT_BALANCE)
If CASH_NEEDED is less than the available credit, the formula returns CASH_NEEDED; otherwise, the
formula returns the available credit.
See Also
Chapter 11, “Using Built-in Functions in Analytic Models,” IF, page 164 and Chapter 11, “Using Built-in
Functions in Analytic Models,” MAX, page 170.
Copyright © 1988-2007, Oracle. All rights reserved.
173
Using Built-in Functions in Analytic Models
Chapter 11
MOD
Syntax
MOD(X, Y)
Description
The MOD function returns the remainder of X divided by Y. If Y is zero, MOD returns an error value.
Returns
The remainder of X divided by Y. If Y is zero, MOD returns an error value.
Example
The following examples employ the MOD built-in function:
• MOD(10, 4) returns 2.
• MOD(15, 10) returns 5.
• MOD(15, 5) returns 0.
• MOD(15, 0) returns an error value.
MONTH
Syntax
MONTH({Date})
Description
The MONTH function returns the month of Date. If Date is omitted, the function returns the month of the
calculation date.
Returns
The month of Date. If Date is omitted, the function returns the month of the calculation date.
Example
If A = 2004/03/15 and B = 2005/06/22, MONTH(A) returns 3 and MONTH(B) returns 6.
Now suppose that an analytic model contains a data cube called MONTH_EXAMPLE that uses a dimension
called MONTHS and has the formula MONTH_EXAMPLE = MONTH( ). Because the argument is omitted,
MONTH returns the month for each date in the MONTHS dimension.
Following is a useful example of the MONTH function. Suppose that you define a data cube called
MONTHLY_SALES that uses a dimension called MONTHS. You want to calculate the average sales
for each month of the year. In other words, you want to know the average sales for the first month of
each year, the average sales for the second month of each year, and so on. To do this, create a dimension
called MONTH_NUM that contains members numbered 1 to 12. Then define a data cube called
AVG_SALES_BY_MONTH that uses the MONTH_NUM dimension. Finally, enter the following formula for
the AVG_SALES_BY_MONTH cube:
DAVG(MONTHS, MONTHLY_SALES, MONTH( ) = MEMBER(MONTH_NUM))
174
Copyright © 1988-2007, Oracle. All rights reserved.
Chapter 11
Using Built-in Functions in Analytic Models
See the entries for DAVG and MEMBER if you are unfamiliar with these functions. For each MONTH_NUM
member in AVG_SALES_BY_MONTH, the formula averages all Monthly Sales for which the month of the
year equals the index of the MONTH_NUM member. Thus, if the analytic calculation engine calculates the
fifth MONTH_NUM member for AVG_SALES_BY_MONTH, it averages the sales for the dates 2004/05/03,
2004/05/04, and 2004/05/05, because these are the dates for which the MONTH( ) function returns 5.
See Also
Chapter 11, “Using Built-in Functions in Analytic Models,” DAVG, page 148 and Chapter 11, “Using Built-in
Functions in Analytic Models,” MEMBER, page 172.
NEXT
Syntax
NEXT(Dimension, Data, {Count})
Description
The NEXT function returns the value of Data from Count members forward in Dimension. If Count is
omitted, it is assumed to be 1.
Note. The NEXT function operates on detail member names that are persisted in the main record. This
function does not use trees to determine the order of members.
Returns
The value of Data from Count members forward in Dimension. If Count is omitted, it is assumed to be 1.
Example
To refer to the next month’s sales in a rule, use NEXT(MONTHS, SALES).
The NEXT function can be used together with the CUMAVG function to calculate a centered moving average ,
such as the average sales for the six months before and after a given month. The centered moving average
gives a sense of the normal monthly value for the year surrounding a particular month. You can then compare
the actual monthly value to the normal monthly value to see how seasonality affected the sales. Thus, if the
actual monthly value for August is higher than the normal monthly value for the year surrounding August,
this may indicate that sales tend to be higher than average in August.
Suppose that the actual monthly sales are stored in a data cube called ACTUAL_SALES. Calculate the
CENTERED_AVG_SALES cube as follows:
NEXT(MONTHS, CUMAVG(MONTHS, ACTUAL_SALES, 13), 6)
This formula looks six months ahead (NEXT(MONTHS, ..., 6)), and then calculates the cumulative
average of the 13 months of sales preceding that time (CUMAVG(MONTHS, ACTUAL_SALES, 13)). For
example, when the analytic calculation engine calculates CENTERED_AVG_SALES for 2005/03, it looks
ahead six months to 2005/09, and then calculates the average sales for the 13 months preceding 2005/09.
Thus, the analytic calculation engine calculates the average sales for 2004/09 to 2005/09, which is the year
surrounding 2005/03.
Actually, this formula is not quite complete. You cannot calculate accurate results for the first six months or
the last six months of the analytic model because the analytic calculation engine is unable to look six months
back and six months ahead during those months. Therefore, the formula should return zero for those months:
IF(MEMBER(MONTHS) > 6 .AND. MEMBER(MONTHS) <= NUMMEMBERS(MONTHS) - 6, NEXT(MONTHS,⇒
CUMAVG(MONTHS, ACTUAL_SALES, 13), 6), 0)
Copyright © 1988-2007, Oracle. All rights reserved.
175
Using Built-in Functions in Analytic Models
Chapter 11
The condition of the IF statement ensures that the month being calculated is after the first six months and
before the last six months of the analytic model. If the condition is true, the IF function returns the centered
moving average calculated by the second argument; otherwise, the IF function returns zero.
See Also
Chapter 11, “Using Built-in Functions in Analytic Models,” DAVG, page 148, Chapter 11, “Using Built-in
Functions in Analytic Models,” MEMBER, page 172 and Chapter 11, “Using Built-in Functions in Analytic
Models,” NUMMEMBERS, page 177.
NPER
Syntax
NPER(Rate, Pmt, PV, FV, {Type})
Description
The NPER function returns the number of payment periods required to accumulate a future value of FV when
the present value is PV, the payment is Pmt, and the rate is Rate. If Type is omitted or zero, NPER assumes that
the investment is an ordinary annuity. If Type is nonzero, NPER assumes that the investment is an annuity due.
Note. Enter negative amounts for money out of your pocket, or positive amounts for money coming to you.
Example
Suppose that you deposit 1,000 USD at the end of each year in a savings account that earns 6 percent per
year. To determine how many years it takes before the account is worth 20,000 USD , use the following
formula for the YEARS_REQUIRED cube:
NPER(0.06, -1000, 0, 20000) = 13.53
Note. The decimal part of the answer is not particularly meaningful; you cannot be sure of getting the 20,000
USD until the end of the 14th year.
If you deposit the 1,000 USD at the start of each year, use the following formula. The 1 for the Type argument
indicates an annuity due:
NPER(0.06, -1000, 0, 20000, 1) = 12.99
If the account already has 5,000 USD in it at the start, use the following formula:
NPER(0.06, -1000, -5000, 20000, 1) = 8.72
NPV
Syntax
NPV(Dimension, Rate, Cash Flow, {Type}, {Condition})
Description
The NPV function returns the Net Present Value for Cash Flow, where Rate is the rate per period. If Type is
zero or omitted, NPV treats the investment as an ordinary annuity; otherwise, NPV treats the investment as an
annuity due. If Condition is omitted, the function uses all values of Cash Flow. If Condition is included, the
function uses only those values of Cash Flow for which Condition is true.
176
Copyright © 1988-2007, Oracle. All rights reserved.
Chapter 11
Using Built-in Functions in Analytic Models
The initial values in the cash flow should be negative to represent a cash outflow. The remaining values may
be all positive (representing cash inflows), or a combination of positive and negative values.
Example
You can create a data cube called NET_PRESENT_VALUE and calculate the net present value for a data cube
called CASH_FLOW with the following formula:
NPV(MONTHS, ANNUAL_RATE / 12, CASH_FLOW)
You can calculate the net present value for the first 12 months with the following formula:
NPV(MONTHS, ANNUAL_RATE / 12, CASH_FLOW, 0, MEMBER(MONTHS) <= 12)
The Condition ensures that the NPV function uses only those values for which the month index is 12 or less.
See Also
Chapter 11, “Using Built-in Functions in Analytic Models,” MEMBER, page 172
NUM2TEXT
Syntax
NUM2TEXT(Number, {Decimal Places})
Description
The NUM2TEXT function converts Number to Text. Decimal Places specifies the number of decimal places
that are used to convert the number to text.
Example
NUM2TEXT(SALESPRICE, 3) for SALESPRICE’s value of 10.23457 as the string 10.234.
NUMMEMBERS
Syntax
NUMMEMBERS(Dimension)
Description
The NUMMEMBERS function returns the number of members in Dimension.
Returns
Returns the number of members in Dimension.
Example
If a dimension called PRODUCTS contains eight members; NUMMEMBERS(Products) returns 8.
OPRID
Syntax
OPRID()
Copyright © 1988-2007, Oracle. All rights reserved.
177
Using Built-in Functions in Analytic Models
Chapter 11
Description
The OPRID function returns the userID of the user who currently has the analytic instance checked out.
Use the OPRID function within a filter user function whose purpose is to limit userID access to only certain
rows of data.
Example
IF(AT(USERID, TXT2MBR(USERID, OPERID()), DEPT_CUBE) =
RETURN(0))
MEMBER(DEPT_DIM),RETURN(1),⇒
This filter user function restricts user access to bonus amount data. Each userID has access to only the bonus
amount that pertains to them. The filter user function contains these data cubes and dimensions:
• USERID dimension, which is mapped to the USERID field.
The USERID field contains the userIDs of the users that currently have the analytic instance loaded.
• DEPT_CUBE data cube, which is mapped to the DEPT_CUBE field.
This data cube is formatted as a member of the DEPT_DIM dimension.
• DEPT_DIM dimension, which is mapped to the DEPT_DIM field.
Note. The filter user function is applied to this dimension.
• BONUS_AMT data cube, which is mapped to the BONUS_AMT field.
These are the values of the fields that are mapped to the USERID dimension and DEPT_CUBE data cube:
USERID
DEPT_CUBE
Juan
Doc
Albert
Dev
Nigel
PM
These are the values of the fields that are mapped to the DEPT_DIM dimension and BONUS_AMT data cube:
DEPT_DIM
BONUS_AMT
Dev
5000
Doc
4000
PM
7000
The analytic calculation engine performs these steps to calculate the filter user function:
1. The OPRID function returns the userID of the current user in text format.
2. The TXT2MBR function compares the userID with the member in the USERID dimension to
determine if they match.
178
Copyright © 1988-2007, Oracle. All rights reserved.
Chapter 11
Using Built-in Functions in Analytic Models
If the userID matches the member in the USERID dimension, the AT function searches for the
coordinates of the userID member that is returned by TXT2MBR and returns the corresponding
value of DEPT_CUBE.
On the right-hand side of the equation, the MEMBER function returns the corresponding member
of DEPT_DIM.
3. The analytic calculation performs one of these actions:
• If the value returned from DEPT_CUBE matches the member returned from DEPT_DIM, the
userID can see the bonus amount.
For example, the Dev value returned from DEPT_CUBE matches the Dev member returned from
DEPT_DIM. For this reason, Albert can see his bonus amount of 5000.
• If the value returned from DEPT_CUBE does not match the member returned from DEPT_DIM, the
userID cannot see the bonus amount.
See Also
Chapter 11, “Using Built-in Functions in Analytic Models,” AT, page 141, Chapter 11, “Using Built-in
Functions in Analytic Models,” MEMBER, page 172, Chapter 11, “Using Built-in Functions in Analytic
Models,” TEXT2MBR, page 194 and Chapter 10, “Creating Rules, Formulas, and User Functions,” Filter User
Functions, page 113.
PARENT
Syntax
PARENT(Dimension, {Child Member})
Description
The PARENT function returns the member reference to the parent of the specified member.
Parameters
The PARENT function takes one required argument and one optional argument. The first argument is required.
The second argument is optional.
Parameter
Description
Dimension
The dimension to use.
Child Member
If this optional argument is not supplied, use the current calculated member for this
dimension.
Note. If the child member is the root, this function returns –1.
Returns
The member reference to the parent of the specified member.
Example
PARENT (Region, [Region:West]) returns a reference to the parent of [Region:West], which
is [Region:USA].
Copyright © 1988-2007, Oracle. All rights reserved.
179
Using Built-in Functions in Analytic Models
Chapter 11
See Also
Chapter 9, “Creating Hierarchies,” Pushed Down Data, page 80
PCT
Syntax
PCT(Dimension, Data, {Count})
Description
The PCT function returns the percentage change between the value of Data for the Member being calculated
and the value of Data for Count members back. If Count is omitted, it is assumed to be 1.
Returns
The percentage change between the value of Data for the Member being calculated and the value of Data
for Count members back. If Count is omitted, it is assumed to be 1.
Example
Suppose that you wish to calculate the monthly and yearly percentage change in a data cube called SALES. If
SALES uses a dimension called MONTHS, use the following formula:
PCT(MONTHS, SALES)
Because the Count argument is omitted, the program assumes it to be 1. Thus, the program calculates
the percentage change in sales from the previous month to the month being calculated. Calculate the
YEARLY_PERCENT_CHANGE cube by using 12 for the third argument:
PCT(MONTHS, SALES, 12)
This formula calculates the percentage change in SALES from 12 months ago to the month being calculated.
PERCENTILE
Syntax
PERCENTILE(Dimension, Values, Percentile, {Type}, {Condition})
Description
The PERCENTILE function returns a percentile of Values. The Percentile argument sets which percentile
is calculated. If Type is zero or omitted, PERCENTILE calculates a population percentile; otherwise,
PERCENTILE calculates a sample percentile. If Condition is omitted, the function uses all Values. If
Condition is included, the function uses only those Values for whichCondition is true.
Example
Suppose that an analytic model contains a data cube called SCORES that uses dimensions called STUDENTS
and TESTS.
The following formula calculates the 90th percentile of the scores for each test:
PERCENTILE(STUDENTS, SCORES, 90%)
The following formula calculates the 50th percentile of the first 10 students:
PERCENTILE(STUDENTS, SCORES, 50%, MEMBER(STUDENTS) <= 10)
180
Copyright © 1988-2007, Oracle. All rights reserved.
Chapter 11
Using Built-in Functions in Analytic Models
This formula calculates the 50th percentile (also knows as median) of the first 10 students for each test.
PI
Syntax
PI( )
Description
The PI function returns the value of PI (3.1415926536), the ratio of a circle’s circumference to its diameter.
The following formula calculates the area of a circle:
PI( ) * RADIUS ^ 2
Returns
The value of PI (3.1415926536), the ratio of a circle’s circumference to its diameter.
Example
The following examples employ the PI function:
Example 1
PI( ) * 7 = 21.99 (circumference of a circle with a diameter of 7).
Example 2
PI( ) * 36 ^ 2 = 4071.50 (area of a circle with a radius of 36).
PMT
Syntax
PMT(Rate, NPer, PV, FV, {Type})
Description
The PMT function returns the payment required to repay a loan of PV, at an interest rate of Rate, where there
are NPer payments and an ending balance of FV. If Type is omitted or zero, PMT assumes that the loan is an
ordinary annuity. If Type is nonzero, PMT assumes that the loan is an annuity due.
Note. Enter negative amounts for money out of your pocket, or positive amounts for money coming to you.
Returns
The payment required to repay a loan of PV, at an interest rate of Rate, where there are NPer payments and an
ending balance of FV. If Type is omitted or zero, PMT assumes that the loan is an ordinary annuity. If Type is
nonzero, PMT assumes that the loan is an annuity due.
Note. Enter negative amounts for money out of your pocket, or positive amounts for money coming to you.
Copyright © 1988-2007, Oracle. All rights reserved.
181
Using Built-in Functions in Analytic Models
Chapter 11
Example
If you take out a loan for 50,000 USD at a rate of 14 percent per year and 120 monthly payments, you can
create a PAYMENT cube and compute the payment required to repay the loan as follows:
PMT(0.14 / 12, 120, 50000, 0) = -776.33
If the loan has a balloon payment of 30,000 USD at the end of the 120 months, compute the payment as follows:
PMT(0.14 / 12, 120, 50000, -30000) = -660.53
If the payments are made at the start of the month rather than the end of the month, use the following formula:
PMT(0.14 / 12, 120, 50000, -30000, 1) = -652.92
PREV
Syntax
PREV(Dimension, Data, {Count})
Description
The PREV function returns the value of Data from Count members back in Dimension. If Count is omitted,
it is assumed to be 1.
Note. The PREV function operates on detail member names that are persisted in the main record. This
function does not use trees to determine the order of members.
Returns
The PREV function returns the value of Data from Count members back in Dimension. If Count is omitted,
it is assumed to be 1.
Example
To refer to the previous month’s sales in a formula, use PREV(MONTHS, SALES).
Suppose that you want to forecast the total monthly receipts for a company, assuming that some of each
month’s sales are received immediately, some are received in one month, some are received in two months,
and some are received in three months. First, define data cubes that contain the estimated percentage
of sales received for each time period: PCT_RECV_IMMEDIATELY, PCT_RECV_IN_1_MONTH,
PCT_RECV_IN_2_MONTHS, PCT_RECV_IN_3_MONTHS. Next, define a monthly data cube called
SALES that contains the sales forecast for each month. Calculate the TOTAL_MONTHLY_RECEIPTS
data cube with these formulas:
• RECV_IMMEDIATELY data cube formula:
PCT_RECV_IMMEDIATELY * SALES
• RECV_IN_1_MONTH data cube formula:
PCT_RECV_IN_1_MONTH * PREV(MONTHS, SALES)
• RECV_IN_2_MONTHS data cube formula:
PCT_RECV_IN_2_MONTHS * PREV(MONTHS, SALES, 2)
• RECV_IN_3_MONTHS data cube formula:
182
Copyright © 1988-2007, Oracle. All rights reserved.
Chapter 11
Using Built-in Functions in Analytic Models
PCT_RECV_IN_2_MONTHS * PREV(MONTHS, SALES, 3)
• TOTAL_MONTHLY_RECEIPTS data cube formula:
RECV_IMMEDIATELY + RECV_IN_1_MONTH + RECV_IN_2_MONTHS + RECV_IN_3_MONTHS
RECV_IMMEDIATELY contains the amount received from the current month’s sales, RECV_IN_1_MONTH
contains the amount received from the previous month’s sales, and so on. Add all of these amounts together to
calculate the total receipts for the month.
PREVSELF
Syntax
PREVSELF(Dimension, {Start Value}, {Count})
Description
The PREVSELF function returns the value of the current data cube from Count members back in Dimension.
When the program is calculating the first Count members of Dimension, PREVSELF returns Start Value. If
Start Value is omitted, it is assumed to be 0. If Count is omitted, it is assumed to be 1.
Note. The PREVSELF function operates on detail member names that are persisted in the main record. This
function does not use trees to determine the order of members.
Returns
The PREVSELF function returns the value of the current data cube from Count members back in Dimension.
When the program is calculating the first Count members of Dimension, PREVSELF returns Start Value. If
Start Value is omitted, it is assumed to be 0. If Count is omitted, it is assumed to be 1.
Example
Suppose that you want to forecast sales. For each month, you want to add an estimated Sales Growth to the
previous month’s sales. When calculating the first month, you want to add sales growth to starting sales. You
can do this with the following formula for the SALES cube:
PREVSELF(MONTHS, STARTING_SALES) + SALES_GROWTH
For the first month, this formula returns the starting sales plus sales growth. For every other month, the
formula returns the previous month’s sales plus sales growth.
The PREVSELF function is useful for keeping a running balance of transactions. For example, suppose that
an analytic model contains monthly data cubes called DEPOSITS, WITHDRAWALS, and BALANCE,
and a single value data cube called START_BALANCE. You can calculate the BALANCE cube with
the following formula:
PREVSELF(MONTHS, START_BALANCE) + DEPOSITS - WITHDRAWALS
This formula calculates the ending balance for each month by adding DEPOSITS and subtracting
WITHDRAWALS from the ending balance for the previous month. Because no previous balance is available
for the first month, the PREVSELF function returns the value of Start Balance.
Copyright © 1988-2007, Oracle. All rights reserved.
183
Using Built-in Functions in Analytic Models
Chapter 11
PV
Syntax
PV(Rate, NPer, Pmt, FV, {Type})
Description
The PV function returns the Present Value of an investment with a future value of FV, where Pmt is received
for NPer periods and is discounted at the rate of Rate per period. If Type is omitted or zero, PV assumes that
the investment is an ordinary annuity. If Type is nonzero, PV assumes that the investment is an annuity due.
Note. Enter negative amounts for money out of your pocket, or positive amounts for money coming to you.
Example
Suppose that a machine that sells for 80,000 USD saves your company 11,000 USD a year for 10
years. Assuming that the money saved could be invested at 8 percent per year, you can calculate the
PRESENT_VALUE cube as follows:
PV(0.08, 10, 11000, 0) = -73811
The present value of the machine is 73,811 USD, indicating that you might be better off investing the 80,000
USD in another way. But suppose that you can sell the machine for 30,000 USD at the end of the 10 years.
You can calculate the PRESENT_VALUE cube as follows:
PV(0.08, 10, 11000, 30000) = -87707
In this case, the present value is higher than the cost of the machine, indicating a profitable investment.
QUARTILE
Syntax
QUARTILE(Dimension, Values, Quartile, {Type}, {Condition})
Description
The QUARTILE function returns a quartile of Values.
The Quartile argument sets which quartile (0, 1 ,2 , 3, or 4) is calculated. If Type is zero or omitted,
QUARTILE calculates a population quartile; otherwise, QUARTILE calculates a sample quartile. If Condition
is omitted, the function uses all Values. If Condition is included, the function uses only those Values for
which Condition is true.
Returns
The QUARTILE function returns a quartile of Values. The Quartile argument sets the quartile (0, 1 ,2 , 3,
or 4) that is calculated. If Type is zero or omitted, QUARTILE calculates a population quartile; otherwise,
QUARTILE calculates a sample quartile. If Condition is omitted, the function uses all Values. If Condition is
included, the function uses only those Values for which Condition is true.
Example
For example, suppose that an analytic model contains a data cube called SCORES that uses dimensions
called STUDENTS and TESTS.
184
Copyright © 1988-2007, Oracle. All rights reserved.
Chapter 11
Using Built-in Functions in Analytic Models
The following formula calculates the third quartile of the scores for each test.
QUARTILE(STUDENTS, SCORES, 3)
The following formula calculates the second quartile (also known as the median) of the first ten students:
QUARTILE(STUDENTS, SCORES, 2, MEMBER(STUDENTS) <= 10)
RAND
Syntax
RAND()
Description
The RAND function returns a random decimal number greater than or equal to zero and less than one.
The RAND function uses an industrial strength random number generator with an extremely long period.
Thus, it is suitable for use in statistical simulation.
The PeopleSoft Analytic Calculation Engine RAND function does not cause a cube to be calculated during
every recalculation, unlike in Microsoft Excel. Formulas that use RAND typically refer to some other data in
the analytic model, and the analytic calculation engine recalculates the cube only when the other data changes.
If you use the RAND function to populate a cube with data for demos or testing — and you do not refer to
other cubes — the data in the cube does not change unless you edit the formula or calculate the data cube.
Returns
A random decimal number greater than or equal to zero and less than one.
Example
RAND() returns 0.938119738.
RATE
Syntax
RATE(NPer, Pmt, PV, FV, {Type})
Description
The RATE function returns the rate required to accumulate a future value of FV when the present value is PV,
the number of periods is NPer, and the payment is Pmt. If Type is omitted or zero, RATE assumes that the
investment is an ordinary annuity. If Type is nonzero, RATE assumes that the investment is an annuity due.
Note. Enter negative amounts for money out of your pocket, or positive amounts for money coming to you.
Returns
The RATE function returns the rate required to accumulate a future value of FV when the present value is PV,
the number of periods is NPer, and the payment is Pmt. If Type is omitted or zero, RATE assumes that the
investment is an ordinary annuity. If Type is nonzero, RATE assumes that the investment is an annuity due.
Note. Enter negative amounts for money out of your pocket, or positive amounts for money coming to you.
Copyright © 1988-2007, Oracle. All rights reserved.
185
Using Built-in Functions in Analytic Models
Chapter 11
Example
Suppose that you wish to invest 5,000 USD at the end of each year for 10 years. You can create a data cube
called RATE_REQUIRED and calculate the rate of return required to earn 100,000 USD as follows:
RATE(10, -5000, 0, 100000) = 14.69%
Now suppose that you initially invest 15,000 USD in addition to the yearly payments. Use the following
formula:
RATE(10, -5000, -15000, 100000) = 7.23%
Finally, suppose that you make the payments at the start of the year. You can use the following formula:
RATE(10, -5000, -15000, 100000, 1) = 6.50%
REPLACE
Syntax
REPLACE (Text, Old, New)
Description
The REPLACE function replaces all occurrences of Old with New in text and returns the result.
Example
REPLACE("StringFun", "Fun", "Number") returns StringNumber.
RETURN
Description
The RETURN function stops the evaluation of a rule and returns the value of the RETURN function’s argument.
Example
WHILE(&Balance < TARGET_BALANCE,
IF(&Month > NUMMEMBERS(MONTHS), RETURN(#N/A));
INC(&Month);
INC(&Balance, AT(MONTHS, &Month, CASH_FLOW))
);
RETURN(&Month)
This formula calculates the number of months required to accumulate a target balance, but returns an error
value if the maximum number of months is exceeded. This makes it unnecessary to repeat the condition at
the end of the formula.
Note. The RETURN at the end of the formula is not necessary; however, you can use it for clarity.
RIGHT
Description
The RIGHT function returns the right most Count characters of Text.
186
Copyright © 1988-2007, Oracle. All rights reserved.
Chapter 11
Using Built-in Functions in Analytic Models
Returns
The right most Count characters of Text.
Example
RIGHT("StringFun", 3) returns Fun.
ROUND
Syntax
ROUND(Data, Integer)
Note. The Integer argument is optional.
Description
The ROUND function—when you use only the first argument—returns the value of Data rounded to the
nearest whole number. If you use the optional second argument, the ROUND function returns the value of
Data rounded to the number of decimal places that you specify with the Integer argument.
The default value for the Integer argument is zero.
Example
The following examples employ the ROUND built-in function:
• ROUND(14) returns 14.
• ROUND(14.3) returns 14.
• ROUND(14, 0) returns 14.
• ROUND(14.3, 0) returns 14.
• ROUND(14.5, 0) returns 15.
• ROUND(14.7, 0) returns 15.
• ROUND(34.56789, 4) returns 34.5679.
SELF
Syntax
SELF( )
Description
The SELF function returns the current value of the data cube that is being calculated. The SELF function
recalculates the data cube only if a certain condition is true; otherwise, the data cube retains its current value.
Returns
The current value of the data cube being calculated.
Copyright © 1988-2007, Oracle. All rights reserved.
187
Using Built-in Functions in Analytic Models
Chapter 11
Example
Suppose that you would like to update your sales forecast on a monthly basis, but you also would like to save
the original forecast. If the current forecast is stored in a data cube called SALES_FORECAST, you can
calculate the ORIGINAL_SALES_FORECAST cube as follows:
IF(UPDATE_ORIGINAL, SALES_FORECAST, SELF( ))
(See the entry for the IF built-in function if you are unfamiliar with this function.) UPDATE_ORIGINAL is a
single value data cube that contains either a true or false value. If UPDATE_ORIGINAL is false, the SELF
function returns the current value of ORIGINAL_SALES_FORECAST, thereby leaving the original forecast
unchanged. If UPDATE_ORIGINAL is true, the IF function returns the value of SALES_FORECAST,
thereby updating the original forecast.
See Also
Chapter 11, “Using Built-in Functions in Analytic Models,” IF, page 164
SET
Syntax
SET(Variable, Expression)
Note. The second argument of the SET function can be any valid expression.
Description
The SET function sets a value to a variable.
Example
The following formula sets the &Index variable to 1.
SET(&Index, 1)
SIN
Syntax
SIN(Data)
Description
The SIN function returns the sine of Data, where Data represents an angle in radians.
To convert from degrees to radians, multiply by PI( ) / 180. (The PI function returns the value of PI.)
Returns
The sine of Data, where Data represents an angle in radians.
Example
The following examples employ the SIN built-in function:
• SIN(PI( ) / 6) returns 0.5 (sine of PI / 6 radians).
188
Copyright © 1988-2007, Oracle. All rights reserved.
Chapter 11
Using Built-in Functions in Analytic Models
• SIN(PI( ) / 2) returns 1 (sine of PI / 2 radians).
• SIN(45 * PI( ) / 180) returns 0.7071067812 (sine of 45 degrees).
SLN
Syntax
SLN(Cost, Salvage, Life)
Description
The SLN function returns the depreciation on an asset by using the straight line method, which is a single
programming statement. This function returns the same depreciation for each period.
Parameters
Parameter
Description
Cost
The cost of the asset.
Salvage
The worth of the asset at the end of its useful life.
Life
The number of periods in the asset’s useful life.
Returns
The depreciation on an asset using the Straight Line method. This function returns the same depreciation
for each period.
Example
Suppose that you purchase a machine for 6,000 USD, and you plan to sell it for 500 USD after five years. You
can calculate the depreciation for each year as follows:
SLN(6000, 500, 5) = 1100
SLOPE
Syntax
SLOPE(Dimension, Y, X, {Condition})
Description
The SLOPE function returns the slope of the line that has the closest fit to the points represented by Y and X.
(The slope is the change in Y divided by the change in X.) If Condition is omitted, the function fits the line to
all of the members in Dimension. If Condition is included, the function fits the line only to those members
that meet the condition.
Use the SLOPE function together with the INTERCEPT function to find the line with the closest fit to a set of
points. You can use these functions to analyze a historical trend, and then use the trend to make forecasts.
You can also use these functions to analyze the relationship between different variables, such as sales and
travel expense.
Copyright © 1988-2007, Oracle. All rights reserved.
189
Using Built-in Functions in Analytic Models
Chapter 11
Analyzing a Historical Trend
To analyze a historical trend:
1. Calculate the slope for the trend line with this formula for the TREND_SLOPE cube:
SLOPE(DATE_DIMENSION, HISTORICAL_DATA, MEMBER(DATE_DIMENSION), MEMBER(MONTHS) <=⇒
LAST_ACTUAL_DATE)
HISTORICAL_DATA is the data cube that you want to analyze. DATE_DIMENSION is the
dimension used by the data cube, which is normally a date dimension. Because you want to know how
HISTORICAL_DATA is affected by time, use the date index—MEMBER(DATE_DIMENSION)—as
the independent (X) argument. LAST_ACTUAL_DATE is a data cube containing the last date that
you want to analyze. If you want to analyze all of the dates in DATE_DIMENSION, you may omit
the condition.
See Chapter 11, “Using Built-in Functions in Analytic Models,” MEMBER, page 172.
2. Calculate the intercept for the trend line with the following formula for the TREND_START cube:
INTERCEPT(DATE_DIMENSION, HISTORICAL_DATA, MEMBER(DATE_DIMENSION), MEMBER(MONTHS)⇒
<= LAST_ACTUAL_DATE)
3. You can now calculate the values for the trend line with the following formula for the
TREND_VALUES cube:
TREND_START + TREND_SLOPE * MEMBER(DATE_DIMENSION)
Analyzing the Relationship Between Two Data Cubes
To analyze the relationship between two data cubes:
1. Calculate the slope for the relationship line with this formula for the RELATION_SLOPE cube:
SLOPE(DIMENSION, DEPENDENT_VARIABLE, INDEPENDENT_VARIABLE)
DEPENDENT_VARIABLE is the variable whose values are influenced by INDEPENDENT_VARIABLE.
For example, if you want to know how sales are influenced by advertising, SALES is the dependent
variable and ADVERTISING is the independent variable. If necessary, you may restrict the analysis to
selected members of DIMENSION by using a condition for the fourth argument.
2. Calculate the intercept for the relationship line with this formula for the RELATION_START cube:
INTERCEPT(DIMENSION, DEPENDENT_VARIABLE, INDEPENDENT_VARIABLE)
If you included a condition in the formula for RELATION_SLOPE, be sure to include it in this
formula as well.
3. Given an independent variable, you can now estimate a corresponding dependent value with this
formula for the DEPENDENT_VALUE cube:
RELATION_START + INDEPENDENT_VALUE * RELATION_SLOPE
Returns
The slope of the line that has the closest fit to the points represented by Y and X. (The slope is the change
in Y divided by the change in X.) If Condition is omitted, the function fits the line to all of the members in
Dimension. If Condition is included, the function fits the line only to those members that meet the condition.
190
Copyright © 1988-2007, Oracle. All rights reserved.
Chapter 11
Using Built-in Functions in Analytic Models
Example
The following sections provide examples of analyzing a historical trend and analyzing a relationship between
data cubes.
Example 1: Analyzing a Historical Trend
Suppose that you want to analyze the trend in historical sales to forecast future sales. The historical sales
are stored in a data cube called ACTUAL_SALES that uses a dimension called MONTHS. The date of the
last actual value is stored in a data cube called LAST_ACTUAL_DATE. Calculate the sales trend with
the following formulas:
• TREND_SLOPE data cube formula:
SLOPE(MONTHS, ACTUAL_SALES, MEMBER(MONTHS), MEMBER(MONTHS) <= LAST_ACTUAL_DATE)
• TREND_START data cube formula:
INTERCEPT(MONTHS, ACTUAL_SALES, MEMBER(MONTHS), MEMBER(MONTHS) <= LAST_ACTUAL-DATE)
• SALES_TREND data cube formula:
TREND_START + TREND_SLOPE * MEMBER(MONTHS)
Note. TREND_SLOPE and TREND_START do not use the MONTHS dimension.
Example 2: Analyzing the Relationship Between Data Cubes
Suppose that you want to analyze how UNITS_SOLD has affected SUPPORT_COSTS. Both of these data
cubes use a dimension called MONTHS. The date of the last actual value is stored in a data cube called
LAST_ACTUAL_DATE. Enter the estimates for future unit sales in a data cube called SALES_FORECAST,
and then calculate the resulting SUPPORT_FORECAST data cube as follows:
• RELATION_SLOPE data cube formula:
SLOPE(MONTHS, SUPPORT_COSTS, UNITS_SOLD, MEMBER(MONTHS) <= LAST_ACTUAL_DATE)
• RELATION_START data cube formula:
INTERCEPT(MONTHS, SUPPORT_COSTS, UNITS_SOLD, MEMBER(MONTHS) <= LAST_ACTUAL_DATE)
• SUPPORT_FORECAST data cube formula:
IF(DATE( ) > LAST_ACTUAL_DATE, RELATION_START + SALES_FORECAST * RELATION_SLOPE, 0)
Notice that this example uses a different approach than the previous example. In the first example, you
analyzed how sales were affected by time, and then used the results to predict future sales based on the
passage of time. In this example, you analyzed how support was affected by sales, and then used the results to
predict future support costs based on future sales.
SQRT
Syntax
SQRT(Data)
Copyright © 1988-2007, Oracle. All rights reserved.
191
Using Built-in Functions in Analytic Models
Chapter 11
Description
The SQRT function returns the square root of Data. If the value of Data is negative, SQRT returns an error
value.
Returns
The square root of Data. If the value of Data is negative, SQRT returns an error value.
Example
These examples employ the SQRT built-in function:
• SQRT(25) returns 5.
• SQRT(2) returns 1.4142135624.
• SQRT(-25) returns an error value.
STDEV
Syntax
STDEV(Dimension, Values, {Type}, {Condition})
Description
The STDEV function returns the standard deviation of Values. If Type is zero or omitted, STDEV calculates
a population standard deviation; otherwise, STDEV calculates a sample standard deviation. If Condition is
omitted, the function uses all Values. If Condition is included, the function uses only those Values where
Condition is true.
Example
Suppose that an analytic model contains a data cube called SALES that uses dimensions called PEOPLE and
MONTHS.
Use this formula to calculate the standard deviation over time for each person:
STDEV(MONTHS, SALES, 0)
Use this formula to calculate the standard deviation of sales over 5000 for each month:
STDEV(PEOPLE, SALES, 0, SALES > 5000)
SYD
Syntax
SYD(Cost, Salvage, Life, Period)
Description
The SYD function returns the depreciation on an asset using the Sum-of-the-Years’-Digits method, an
accelerated depreciation method. The SYD function takes these arguments:
192
Copyright © 1988-2007, Oracle. All rights reserved.
Chapter 11
Using Built-in Functions in Analytic Models
Parameters
Parameter
Description
Cost
The cost of the asset.
Salvage
The worth of the asset at the end of its useful life.
Life
The number of periods in the asset’s useful life.
Period
The period for which you wish to determine the depreciation.
Example
Suppose that you purchase a machine for 6,000 USD , and you plan to sell it for 500 USD after five years. You
can calculate the depreciation for each year as follows:
• SYD(6000, 500, 5, 1) = 1833
• SYD(6000, 500, 5, 2) = 1467
• SYD(6000, 500, 5, 3) = 1100
• SYD(6000, 500, 5, 4) = 733
• SYD(6000, 500, 5, 5) = 367
TAN
Syntax
TAN(Data)
Description
The TAN function returns the tangent of Data, where Data represents an angle in radians.
To convert from degrees to radians, multiply by PI( ) / 180. (The PI function returns the value of PI.)
Returns
Returns the tangent of Data, where Data represents an angle in radians.
Example
These examples employ the TAN built-in function:
• TAN(PI( )) returns 0 (tangent of p radians).
• TAN(PI( ) / 4) returns 1 (tangent of p / 4 radians).
• TAN(45 * PI( ) / 180) returns 1 (tangent of 45 degrees).
See Also
Chapter 11, “Using Built-in Functions in Analytic Models,” PI, page 181
Copyright © 1988-2007, Oracle. All rights reserved.
193
Using Built-in Functions in Analytic Models
Chapter 11
TEXT2MBR
Syntax
TEXT2MBR(Dimension, Text)
Description
Converts text to the member with that name in Dimension. If there is no member with that name, returns 0.
Note. This is essentially a linear lookup function, so be careful when using it with dimensions that have a
lot of members.
Example
TEXT2MBR(MONTHS, "January") returns a new member, January, in the MONTHS dimension.
TEXT2NUM
Syntax
TEXT2NUM (Text)
Description
Converts Text to a number. This performs a forgiving conversion. For example, dollar signs and commas are
ignored, parentheses or a minus sign make the number negative, and % causes the number to be converted as a
percentage. If there is no number in the text, the function returns 0.
Example
These examples employ the TEXT2NUM built-in function:
• TEXT2NUM("TEN") returns 10.
• TEXT2NUM("$TEN") returns 10.
• TEXT2NUM("-TEN") returns -10.
• TEXT2NUM("100,000") returns 100000.
• TEXT2NUM("10%") returns 10%.
THIS
Syntax
THIS(Expression)
Description
The THIS function returns the value of Expression for the members being calculated, even if Expression is
used in a database function. This function enables you to perform complex calculations that relate other
members in a dimension to the member being calculated.
194
Copyright © 1988-2007, Oracle. All rights reserved.
Chapter 11
Using Built-in Functions in Analytic Models
To understand the THIS function, you need to understand how database functions work. A database function
scans the members in a dimension to calculate a result. For example, suppose that you define the following
formula:
DAVG(PRODUCTS, ADVERTISING, SALES > 50000)
This formula calculates the average advertising for products with sales over 50,000 USD. The DAVG
function scans the PRODUCTS dimension and evaluates the condition SALES > 50000 for each product.
If the condition is true, the DAVG function includes the Advertising for that product in the average. The
important point here is that the DAVG function evaluates the condition (SALES > 50000) and the expression
(Advertising) for the product being scanned.
Now suppose that you want to calculate the following result for each product: the average advertising for
products whose sales are greater than the product being calculated.
Create a data cube called AVG_ADVERTISING_FOR_BETTER_PERFORMERS that uses the PRODUCTS
dimension. Its formula should look similar to:
DAVG(PRODUCTS, ADVERTISING, SALES > "Sales for the product being calculated")
To get the sales for the product being calculated, remember that the DAVG function uses the sales for the
product being scanned. The solution is to use the THIS function:
DAVG(PRODUCTS, ADVERTISING, SALES > THIS(SALES))
The THIS function forces the DAVG function to use the sales for the product being calculated. Thus, the
condition compares the sales for the product being scanned to the sales for the product being calculated. If the
condition is true, the DAVG function includes the Advertising for the product being scanned.
Returns
The value of Expression for the members being calculated, even if Expression is used in a database function.
THISCUBE
Syntax
THISCUBE()
Description
The THISCUBE function returns a reference to the current calculating data cube in a user function.
Returns
A reference to the current calculating data cube in a user function.
Example
CHANGE(MONTHS, THISCUBE())
The user function in this example calculates the monthly change for each data cube and is used inside
an aggregate override user function that affects the SALES, COST_OF_GOODS, and GROSS_MARGIN
data cubes.
In this example, the analytic calculation engine performs the same as if you entered these three functions:
• CHANGE(MONTHS, SALES)
• CHANGE(MONTHS, COST_OF_GOODS)
Copyright © 1988-2007, Oracle. All rights reserved.
195
Using Built-in Functions in Analytic Models
Chapter 11
• CHANGE(MONTHS, GROSS_MARGIN)
TRUNC
Syntax
TRUNC(Data)
Description
The TRUNC function returns the value of Data with the decimals truncated.
Returns
The value of Data with the decimals truncated.
Example
The following examples employ the TRUNC built-in function:
• TRUNC(14) returns 14.
• TRUNC(14.3) returns 14.
• TRUNC(14.7) returns 14.
UPPER
Syntax
UPPER(Text)
Description
The UPPER function returns Text converted to uppercase.
Returns
Text converted to upper case.
Example
UPPER("StringFun") returns STRINGFUN.
VAR
Syntax
VAR(Dimension, Values, {Type}, {Condition})
Description
The VAR function returns the variance of Values. If Type is zero or omitted, VAR calculates a population
variance; otherwise, VAR calculates a sample variance. If Condition is omitted, the function uses all Values. If
Condition is included, the function uses only those Values where Condition is true.
196
Copyright © 1988-2007, Oracle. All rights reserved.
Chapter 11
Using Built-in Functions in Analytic Models
Example
Suppose that an analytic model contains a data cube called SCORES that uses dimensions called STUDENTS
and TESTS.
Use the following formula to calculate the variance of the tests for each student:
VAR(TESTS, SCORES)
Use the following formula to calculate the variance of scores over 75 percent for each test:
VAR(STUDENTS, SCORES, 0, SCORES > 0.75)
WHILE
Syntax
WHILE(Condition, Expression)
Description
The WHILE function supports looping and takes two arguments: a condition that determines whether to
continue looping and an expression to evaluate for each iteration.
Example
WHILE(&Balance < TARGET_BALANCE .AND. &Month < NUMMEMBERS(MONTHS),
INC(&Month);
INC(&Balance, AT(MONTHS, &Month, CA)));
IF(&Month <= NUMMEMBERS(MONTHS), &Month, #N/A)
This formula calculates the number of months required to accumulate a target balance.
The IF function returns the value of &Month, or an error code if the target balance is not achieved. Notice
that it is not necessary to initialize &Balance and &Month because they are initialized to zero before the
formula is evaluated.
YEAR
Syntax
YEAR({Date})
Description
The YEAR function returns the year of Date. If Date is omitted, the function returns the year of the calculation
date.
Example
Suppose that an analytic model contains a data cube called YEAR_EXAMPLE that uses a dimension called
MONTHS, and has the following formula: YEAR( ). Because the argument is omitted, YEAR returns
the year for each date in the MONTHS dimension.
Copyright © 1988-2007, Oracle. All rights reserved.
197
Using Built-in Functions in Analytic Models
Chapter 11
Now suppose that you plan to build a new building in 2006, and you want to spread the building costs over the
quarters of that year. On the other hand, you do not want to allocate the building costs to any other years. If the
year and building costs are stored in data cubes called BUILDING_YEAR and TOTAL_BUILDING_COSTS,
you can calculate the QTRLY_BUILDING_COSTS data cube as follows:
IF(YEAR( ) = BUILDING_YEAR, TOTAL_BUILDING_COSTS / 4, 0)
See Also
Chapter 11, “Using Built-in Functions in Analytic Models,” IF, page 164
198
Copyright © 1988-2007, Oracle. All rights reserved.
PART 3
Working with Analytic Types
Chapter 12
Understanding the Relationship of Analytic Types to Analytic Models
CHAPTER 12
Understanding the Relationship of Analytic
Types to Analytic Models
This chapter discusses:
• Purpose of analytic type definitions.
• Relationship of record attributes to data caching behavior.
Purpose of Analytic Type Definitions
You create analytic type definitions for use with PeopleSoft Optimization Framework and PeopleSoft Analytic
Calculation Engine. In PeopleSoft Optimization Framework, you create analytic type definitions to group
optimization records, optimization transactions, and optimization plug-ins together as one entity.
See Enterprise PeopleTools 8.49 PeopleBook: PeopleSoft Optimization Framework, “Designing Analytic
Type Definitions,” Creating Analytic Type Definitions.
In PeopleSoft Analytic Calculation Engine, you create analytic type definitions to group records and an
analytic model together as one entity. You follow the same procedure to create analytic type definitions for
both PeopleSoft Optimization Framework and PeopleSoft Analytic Calculation Engine.
When creating a new analytic model definition, you create the analytic type definition in this developmental
sequence:
1. Create and save an analytic model definition.
See Chapter 4, “Creating Analytic Model Definitions,” Understanding the Analytic Model Definition
Creation Process, page 27.
2. Create an analytic type definition and define records.
See Chapter 12, “Understanding the Relationship of Analytic Types to Analytic Models,” Example:
Working with an Analytic Type and an Analytic Model, page 202 and Enterprise PeopleTools 8.49
PeopleBook: PeopleSoft Application Designer, “Creating Record Definitions”.
3. Associate the analytic model to the analytic type.
See Enterprise PeopleTools 8.49 PeopleBook: PeopleSoft Optimization Framework, “Designing
Analytic Type Definitions,” Creating Analytic Type Definitions.
4. In the cube collection properties, map a main record in the analytic type to the cube collection.
You can also map an aggregate record in the analytic type to the cube collection.
See Chapter 7, “Creating Cube Collections,” Mapping a Cube Collection to Main and Aggregate
Records, page 58.
Copyright © 1988-2007, Oracle. All rights reserved.
201
Understanding the Relationship of Analytic Types to Analytic Models
Chapter 12
5. In the cube collection properties, map the fields in the record to data cubes and dimensions.
See Chapter 7, “Creating Cube Collections,” Mapping Data Cubes and Dimensions to Fields, page 59.
When updating an analytic model definition, create an analytic type definition during this developmental
sequence:
1. Update the records in the analytic type definition.
See Enterprise PeopleTools 8.49 PeopleBook: PeopleSoft Optimization Framework, “Designing
Analytic Type Definitions,” Configuring Analytic Type Records.
2. Create a new cube collection in the analytic model definition.
See Chapter 7, “Creating Cube Collections,” page 53.
3. In the cube collection properties, map one of the updated records to the cube collection.
See Chapter 7, “Creating Cube Collections,” Mapping a Cube Collection to Main and Aggregate
Records, page 58.
4. In the cube collection properties, map fields of the updated record to data cubes and dimensions.
See Chapter 7, “Creating Cube Collections,” Mapping Data Cubes and Dimensions to Fields, page 59.
Example: Working with an Analytic Type and an Analytic Model
This example illustrates the typical process for creating an analytic type definition to be used with a new
analytic model.
Note. For simplicity, this example maps only one cube collection to a main record, although the analytic model
definition in this example contains several records which would be used with several cube collections. The
record used in this example is mapped to a read/write cube collection for loading data from the database,
receiving end user input, and persisting data back to the database.
See Chapter 7, “Creating Cube Collections,” Understanding Cube Collections, page 53.
You create an analytic type definition called QE_ACE_DGCPROB and define the records that are used in the
analytic model. You insert all of these records (except derived/work records) into the analytic type definition
and set the attributes of the records, as shown in this example:
Example of defining the records within the QE_ACE_DBCPROB analytic type definition
Next, you create an analytic model definition called QE_ACE_DGCMODEL, with data cubes and dimensions
that are related in this manner:
202
Copyright © 1988-2007, Oracle. All rights reserved.
Chapter 12
Understanding the Relationship of Analytic Types to Analytic Models
Data Cube
SALARY input data cube
Attached Dimensions
These dimensions are attached to the SALARY data cube:
• BUSINESS_UNIT
• DEPTID
• EMPLID
• JOBCODE
EXPENSE input data cube
These dimensions are attached to the EXPENSE data cube:
• BUSINESS_UNIT
• DEPTID
• EMPLID
• JOBCODE
BONUS_PERCENT input data cube
These dimensions are attached to the BONUS_PERCENT
data cube:
• BUSINESS_UNIT
• DEPTID
• EMPLID
• JOBCODE
Note. At this step in the process, you do not create the analytic model definition’s cube collections.
On the Models tab, you associate the analytic type to the QE_ACE_DGCMODEL analytic model, as shown
in this example:
Example of associating the QE_ACE_DBCPROB analytic type to the QE_ACE_DGCMODEL analytic model
Next, you open the analytic model definition and create a read/write cube collection called
QE_ACE_EMPLOYEE1_IN. On the General tab of the cube collection’s properties, you map the cube
collection to the QE_ACE_EMPL1 main record, as shown in this example:
Copyright © 1988-2007, Oracle. All rights reserved.
203
Understanding the Relationship of Analytic Types to Analytic Models
Chapter 12
Example of mapping the QE_ACE_EMPLOYEE1_IN cube collection to the QE_ACE_EMPL1 main record
Note. This cube collection does not use an aggregate record.
On the Field Map tab, you map the fields in the QE_ACE_EMPL1 record to the data cubes and dimensions, as
shown in this example:
204
Copyright © 1988-2007, Oracle. All rights reserved.
Chapter 12
Understanding the Relationship of Analytic Types to Analytic Models
Example of mapping data cubes and dimensions to the fields of the QE_ACE_EMPL1 record
When mapping dimensions and data cubes, you may want to map dimensions to the key fields in the main
record and data cubes to the non-key fields in the main record. The PeopleSoft system, however, does enable
you to map dimensions to non-key and data cubes to key fields. To perform the most appropriate mapping, you
must have a deeper understanding of the relationship between data cubes and dimensions.
See Chapter 3, “Understanding Analytic Models,” Data Cubes and Dimensions, page 16.
See Also
Enterprise PeopleTools 8.49 PeopleBook: PeopleSoft Optimization Framework, “Designing Analytic Type
Definitions”
Relationship of Record Attributes to Data Caching Behavior
When you create an analytic type definition, how you set the record attributes determines the caching behavior
of the data that is used in the analytic model. This section describes analytic type definition record attributes
and their effects on data caching.
Read Once
When you map a cube collection to a record that contains a Read Once attribute in the analytic type, the
application data is read only once during analytic model load time. Map cube collections to Read Once records
to load data that the user should not change during the analytic model’s life cycle. You can specify the Read
Once attribute for these record types:
Copyright © 1988-2007, Oracle. All rights reserved.
205
Understanding the Relationship of Analytic Types to Analytic Models
Chapter 12
• SQL tables.
• SQL views.
• Dynamic views.
• Query views.
Note. Data cubes that exist in a cube collection that is mapped to a main record with a Read Once attribute
cannot exist in any other cube collection that is mapped to a main record with the Read Once attribute.
Readable
When you map a cube collection to a record that contains a Readable attribute in the analytic type, the
application data is read during analytic instance load time and is updated with new data after:
• Each analytic model recalculation.
You recalculate an analytic model by using the AnalyticModel class Recalculate method. The AnalyticModel
class is one of the Analytic Calculation Engine classes.
See Enterprise PeopleTools 8.49 PeopleBook: PeopleCode API Reference, “Analytic Calculation Engine
Classes,” Recalculate.
• Each Save action that is triggered by a PeopleSoft Pure Internet Architecture page with an analytic grid.
• Each time data is updated using the CubeCollection class SetData method.
The CubeCollection class is one of the Analytic Calculation Engine classes.
See Enterprise PeopleTools 8.49 PeopleBook: PeopleCode API Reference, “Analytic Calculation Engine
Classes,” SetData.
Map cube collections to Readable records to load data that should be refreshed more than once during the
analytic model’s life cycle.
You can specify the Readable attribute for the SQL table record type.
Note. Data cubes that exist in a cube collection that is mapped to a main record with the Readable attribute
cannot exist in any other cube collection that is mapped to a main record with the Readable or Read Once
attributes.
Note. When a cube collection is mapped to either a Writable-only record or a record with the Readable and
Writable attributes, all data cubes in the cube collection should share the same set of dimensions.
Writable
When you map a cube collection to a record that contains a Writable attribute in the analytic type, the data in
the cube collection is written back to the application database after:
• Each analytic model recalculation.
You recalculate an analytic model by using the AnalyticModel class Recalculate method. The AnalyticModel
class is one of the Analytic Calculation Engine classes.
See Enterprise PeopleTools 8.49 PeopleBook: PeopleCode API Reference, “Analytic Calculation Engine
Classes,” Recalculate.
• Each Save action that is triggered by a PeopleSoft Pure Internet Architecture page with an analytic grid.
206
Copyright © 1988-2007, Oracle. All rights reserved.
Chapter 12
Understanding the Relationship of Analytic Types to Analytic Models
• Each time data is updated using the CubeCollection class SetData method.
The CubeCollection class is one of the Analytic Calculation Engine classes.
See Enterprise PeopleTools 8.49 PeopleBook: PeopleCode API Reference, “Analytic Calculation Engine
Classes,” SetData.
You can specify the Read Once attribute for the SQL table record type.
If the analytic type contains a writable-only record that uses a primary key field, you must set up the application
to clear the data in the database for the writable record before recalculating the analytic instance.
Note. After the data is written back to the database, the data cubes that are mapped to the writable-only record
are cleared from the analytic instance, resulting in 0 or empty values in the analytic grid.
Note. When a cube collection is mapped to either a Writable-only record or a record with the Readable and
Writable attributes, all data cubes in the cube collection should share the same set of dimensions.
Scen. Mgd (Scenario Managed)
Use the Scenario Managed attribute to indicate that the record pertains to multiple analytic instances. A
scenario managed record is read from and written back to the database according to the other attributes
that are specified for the record.
Typically, one user views and edits one analytic instance, although PeopleSoft Analytic Calculation Engine
supports multiple users per analytic instance.
Records that contain the scenario managed attribute must have a PROBINST key field. The PROBINST key
field is used to segment the data of scenario managed records, resulting in a different data set loaded for each
analytic instance. This is an example of a record with a PROBINST key field:
PROBINST key field
ACCT field
TRANS_DATE field
REGION field
BUDGET01
100
January
EUROPE
BUDGET01
100
Feb
EUROPE
BUDGET02
110
Feb
ASIA
BUDGET02
110
March
ASIA
BUDGET03
120
March
USA
In this example:
• The users of the BUDGET01 analytic instance can access only the first and second rows of this record.
• The users of the BUDGET02 analytic instance can access only the third and fourth rows of this record.
• The users of the BUDGET03 analytic instance can access only the fifth row of this record.
Note. Data cubes that exist in a cube collection that is mapped to a main record with the Scenario Managed
attribute cannot exist in any other cube collection that is mapped to a derived/work main record.
Copyright © 1988-2007, Oracle. All rights reserved.
207
Understanding the Relationship of Analytic Types to Analytic Models
Chapter 12
See Enterprise PeopleTools 8.49 PeopleBook: PeopleSoft Optimization Framework, “Designing Analytic
Type Definitions,” Scenario Management.
Records based on dynamic views can be Scenario Managed. For these records, the associated SQL must
contain a meta string for qualifying the analytic instance.
The following example shows a Dynamic View record :
SELECT PROBINST, QE_BAM_MONTH_FLD, QE_BAM_REGION_FLD, QE_BAM_PRODUCT_FLD,
QE_BAM_UNIT_FLD, QE_BAM_SALES_FLD, QE_BAM_PRDSALES_FL FROM PS_QE_BAM_FACT_TBL
WHERE PROBINST = %ProbInst
If a Union clause is present the WHERE PROBINST= %ProbInst must be added to the individual clauses
making up the SQL Union. In addition all the fields that are part of the dynamic view must be selected in the
analytic type definition. This is enforced by PeopleSoft Application Designer.
See Also
Enterprise PeopleTools 8.49 PeopleBook: PeopleCode API Reference, “Analytic Type Classes”
Enterprise PeopleTools 8.49 PeopleBook: PeopleSoft Optimization Framework, “Designing Analytic Type
Definitions,” Configuring Analytic Type Records
Synchronization Order
In PeopleSoft Analytic Calculation Engine, the synchronization order indicates the order in which the analytic
calculation engine reads the records in the analytic type definition. Records that are used as aggregate records
should have a higher synchronization order than records that are used as main records.
208
Copyright © 1988-2007, Oracle. All rights reserved.
PART 4
Working with Analytic Grids
Chapter 13
Creating Analytic Grids
CHAPTER 13
Creating Analytic Grids
This chapter provides an overview of analytic grid design and discusses how to:
• Insert and resize analytic grid controls.
• Set analytic grid analytics properties.
• Set analytic grid label properties.
• Set analytic grid use properties.
• Set analytic grid general properties.
• Insert and manipulate analytic grid columns.
• Set column properties for analytic grids.
• Manipulate the analytic grid at runtime.
Understanding Analytic Grid Design
The analytic grid retrieves data from the analytic server and displays it in a grid format on a PeopleSoft Pure
Internet Architecture page. This grid is the centerpiece for the Analytic Calculation Engine user interface,
enabling end users to view, edit, and drag and drop data from an analytic model’s cube collection.
Note. Within an application, a PeopleSoft Pure Internet Architecture page that contains an analytic grids
may be referred to as an interactive report. Interactive reports are typically read only, but in some cases
may also be editable.
Constructing a PeopleSoft Pure Internet Architecture pages that contain an analytic grid consists of these
basic steps:
1. Create an analytic model.
See Chapter 4, “Creating Analytic Model Definitions,” Understanding the Analytic Model Definition
Creation Process, page 27.
2. Use PeopleSoft Application Designer to design the page that contains the analytic grid.
See Enterprise PeopleTools 8.49 PeopleBook: PeopleSoft Application Designer, “Developing and
Customizing PeopleSoft Applications”.
3. Insert the analytic grid into the page and associate the grid with the analytic model by using the
Analytics tab on the Analytic Grid Properties dialog box.
See Chapter 13, “Creating Analytic Grids,” Setting Analytic Grid Analytics Properties, page 215.
4. Define the initial layout and characteristics of the analytic grid.
Copyright © 1988-2007, Oracle. All rights reserved.
211
Creating Analytic Grids
Chapter 13
Producing an analytic grid involves many of the same tasks as generating a regular grid. These include
inserting and resizing grid controls, inserting and manipulating grid columns, and setting column
properties. In addition, you set certain analytic grid properties by using the Analytics tab, Use tab,
Label tab, and General tab in the Analytic Grid Properties dialog box.
See Chapter 13, “Creating Analytic Grids,” Setting Column Properties for Analytic Grids, page 224.
See Chapter 13, “Creating Analytic Grids,” Setting Analytic Grid Label Properties, page 217.
See Chapter 13, “Creating Analytic Grids,” Setting Analytic Grid Use Properties, page 218.
See Chapter 13, “Creating Analytic Grids,” Setting Analytic Grid General Properties, page 220.
You can also control the analytic grid layout programmatically using analytic grid APIs.
See Enterprise PeopleTools 8.49 PeopleBook: PeopleCode API Reference, “Analytic Calculation
Engine Classes,” GetLayout.
See Enterprise PeopleTools 8.49 PeopleBook: PeopleCode API Reference, “Analytic Grid Classes,”
SetLayout.
You can populate the grid with data in two ways: use the PeopleCode analytic grid classes or have the system
populate the analytic grid with data automatically.
See Enterprise PeopleTools 8.49 PeopleBook: PeopleCode API Reference, “Analytic Grid Classes”.
To populate the analytic grid data automatically:
1. Insert into the page any control from which you can obtain analytic instance values—for example, an
edit box.
2. Set this control’s properties to the analytic instance (select the appropriate record and field name on
the Record tab); this will be the analytic instance field you select in the Analytics tab of the Analytic
Grid Properties dialog box.
3. Drag the appropriate record onto the grid.
Although the developer determines the initial layout of the analytic grid using PeopleSoft Application
Designer, one of the primary advantages of the analytic grid is that end users can also modify the layout of the
grid at runtime. Among other things, end users can use the analytic grid to:
• Pivot data—for example, swap row and column orientations.
• Perform hierarchy-related actions such as expanding, collapsing, drilling in, and drilling out in the data.
• Slice data—for example, view a subset of a multidimensional array.
• Hide non-dimensional fields.
• Modify data.
• Save the current view settings.
• Restore the defaults as specified by the application.
See Enterprise PeopleTools 8.49 PeopleBook: Using PeopleSoft Applications, “Working With Pages,”
Working with Analytic Grids.
Components for Working with Analytic Grids
You design analytic grids using PeopleSoft Application Designer. In addition, you may need to work with
analytic grids in the runtime environment.
212
Copyright © 1988-2007, Oracle. All rights reserved.
Chapter 13
Creating Analytic Grids
You use these PeopleSoft Application Designer areas to create analytic grids:
Analytic Grid button
Analytic Grid
Analytic grid in PeopleSoft Application Designer
Analytic Grid button
Select and then drag to insert an analytic grid into the page.
analytic grid
Contains the grid itself. You can modify the grid’s properties by
double-clicking to display the Analytic Grid Properties dialog box. (Click
anywhere except the column headings.) You can also double-click a grid
column to display the properties box for modifying the column. In addition,
you can change the order of columns on either the Layout or Order tab.
See Chapter 13, “Creating Analytic Grids,” Inserting and Manipulating
Analytic Grid Columns, page 222.
You use these areas to modify analytic grids in runtime:
Copyright © 1988-2007, Oracle. All rights reserved.
213
Creating Analytic Grids
Chapter 13
Navigation Bar
Slice Bar
Column Axis
Data Cubes
Dimensions
Row Axis
Analytic grid at runtime
Navigation Bar
Enables end users to navigate through the displayed data set. Also contains a
link to drag and drop instructional text.
Slice Bar
Enables end users to view selected portions, or slices, of the data—for
instance, the sales of one category of product or the sales from a single region.
Column Axis
Displays the designated cubes or dimensions across the top of the analytic
grid. Also contains icons for expanding or collapsing items.
Row Axis
Displays the designated cubes or dimensions along the left-hand side of the
analytic grid.
Data Set
Displays the data from the loaded analytic instance.
See Enterprise PeopleTools 8.49 PeopleBook: Using PeopleSoft Applications, “Working With Pages,”
Understanding Analytic Grids.
Inserting and Resizing Analytic Grid Controls
To insert an analytic grid on a page:
1. Select Insert, Analytic Grid.
2. Drag to place the grid on the page.
3. If you need to adjust the grid width, drag the horizontal or vertical control handles.
The grid width should be roughly equivalent to the columns that you insert into the grid. Otherwise, the
grid might appear too wide or narrow at runtime.
Note. The grid height depends on the data contained in the grid.
Note. These steps insert an analytic grid control on the page, but so far you have not associated this analytic
grid with the relevant model or record definition. You establish this association by means of the Analytic Grid
Properties dialog box.
214
Copyright © 1988-2007, Oracle. All rights reserved.
Chapter 13
Creating Analytic Grids
Setting Analytic Grid Analytics Properties
Access the Analytic Grid Properties dialog box by double-clicking anywhere on the analytic grid other than on
the column headings, and use the Analytics tab to set analytic model association and axis display properties:
Analytic Grid Properties dialog box, Analytics tab
Freeze Column Mode
Select this check box if you want to freeze the columns of the grid when it’s
displayed to the end user. If you select this check box, the only enabled field
in the dialog box is Record Name.
Model Name
Select the analytic model that you want to associate with the current analytic
grid. You can select from any of the analytic models in the database.
Cube Collection Name
Select a cube collection from the analytic model.
Note. This drop-down list box only displays presentation cube collections,
which have work/derived records associated with them. Any other cube
collections do not appear.
Copyright © 1988-2007, Oracle. All rights reserved.
215
Creating Analytic Grids
Chapter 13
See Chapter 7, “Creating Cube Collections,” Presentation Cube Collections,
page 56.
Record Name
Select either a main record or an aggregate record from the cube collection.
The aggregate record is selected by default, if applicable. If there’s no
aggregate record, this field is populated with the main record. If you’ve
selected Freeze Column Mode, only work/derived records are displayed.
Analytic Instance
Specify the page field containing the analytic instance ID—that is, the instance
of the analytic model that is displayed in this analytic grid.
Non-Dimensional Fields
Select Slicer Axis to set the non-dimensional fields axis to the slicer axis.
Select Column Axis to set the non-dimensional fields axis to the column axis.
Select Row Axis to set the non-dimensional fields axis to the row axis.
Warning! All fields that are mapped to dimensions are considered dimensional
fields. All fields that are mapped to data cubes are considered non-dimensional
fields. The non-dimensional fields referred to within this dialog box are
mapped to data cubes. However, any field that is not mapped to anything is
also considered a non-dimensional field. If the application developer wants
to include such non-dimensional fields (those not mapped to anything) with
the analytic grid, he or she must populate them using the RowInit method
or their value will be zero.
Note. If a field is designated as invisible, that property is sometimes honored
and sometimes not honored within the analytic grid. If the field is a dimension
on the slicer axis, the property is honored. If the field is a dimension on the
row or column axis, the invisible property is not honored. If the field is a cube,
the invisible property is honored on the column but not the row axis.
Dimensional Fields
Use the Slicer Axis option to set which dimensional fields are used for the
slice bar.
Dimensions that have filter functions applied will behave differently
depending on whether they reside on the column axis/row axis or the slice
bar. See the following for details.
See Chapter 10, “Creating Rules, Formulas, and User Functions,” Filter
User Functions, page 113.
Use the Column Axis option to set which dimensional fields are used for the
column axis.
Use the Row Axis option to set which dimensional fields are used for
the row axis.
You can select any dimensional field and move it from one list box to another
by using the appropriate arrow keys. (The arrow keys are grayed out if you do
not have a field selected.) The order of the fields on any particular axis—as
end users will see it—is determined by the order in which their columns
appear in the analytic grid, not by their order in the analytic model. You can
change the column order by using drag and drop. By default, all but the last
dimension appear on the slice bar axis; the last dimension appears on the row
axis, and the data cubes appear on the column axis.
216
Copyright © 1988-2007, Oracle. All rights reserved.
Chapter 13
Creating Analytic Grids
See Chapter 13, “Creating Analytic Grids,” Inserting and Manipulating
Analytic Grid Columns, page 222.
Setting Analytic Grid Label Properties
Access the Analytic Grid Properties dialog box by double-clicking the analytic grid, and then click the
Label tab:
Analytic Grid Properties dialog box, Label tab
Display Header
Select if you want to display Preferences and the link to download to Excel to
the end user in the header.
Title
Enter a title that displays in the upper-left corner of the analytic grid.
Copyright © 1988-2007, Oracle. All rights reserved.
217
Creating Analytic Grids
Chapter 13
Note. You can also modify this title at runtime by using the AnalyticGrid
classes.
Display Navigation Bar
Select if you want to display navigational elements for the grid in the header,
such as First, Last, View All, and so on. Preferences and the link to download
to Excel still display to the end user.
Display Slice Bar
Select for the slice bar to appear in the analytic grid. By default, this check
box is selected. This item is not available if Freeze Column Mode has been
selected.
Default Initial View to
Expanded State
Select to have the slice bar appear expanded to the end user initially. Clear to
have the slice bar initially appear collapsed to the end user. This item is not
available if Freeze Column Mode has been selected.
Note. The slice bar is expanded by default.
Show Grid Lines
Select to display grid lines to the end user.
Display Footer
Select if you want to display Preferences and the link to download to Excel to
the end user in the footer. No navigational elements are displayed in the footer.
Setting Analytic Grid Use Properties
Access the Analytic Grid Properties dialog box by double-clicking the analytic grid, and then click the Use tab:
Analytic Grid Properties dialog box, Use tab
218
Copyright © 1988-2007, Oracle. All rights reserved.
Chapter 13
No Auto Select
Creating Analytic Grids
Select to suppress the system from automatically retrieving data from the
analytic calculation engine. If you select No Auto Select, you must use the
LoadData method to load the analytic grid with data.
See Enterprise PeopleTools 8.49 PeopleBook: PeopleCode API Reference,
“Analytic Grid Classes,” LoadData.
This item is not available if Freeze Column Mode has been selected.
No Auto Load/Unload
Analytic Instance
Determines whether and how you load the analytic instance for the analytic
grid.
• If you do not select this option, you can supply an analytic instance ID on
the Analytics tab to have the analytic grid automatically load that analytic
instance. If the analytic grid auto loads the analytic instance, it uses the
default timeout setting and also recalculates the model. The analytic instance
is unloaded when the user navigates out of the component.
Another option for supplying the analytic instance ID is to use the Analytic
Grid Class SetAnalyticInstance method.
See Enterprise PeopleTools 8.49 PeopleBook: PeopleCode API Reference,
“Analytic Grid Classes,” SetAnalyticInstance.
• If you select this option, the analytic instance is not loaded automatically. In
this case, use the PeopleCode analytic instance classes to load the analytic
instance into the grid. If you do not use a PeopleCode program to load the
data, no analytic instance is loaded.
This item is not available if Freeze Column Mode has been selected.
Sort Order
This check box is enabled only if Freeze Column Mode has been selected.
Selecting this option enables the end user to sort the data in the frozen columns.
Display Only
In some cases, you might design grids that enable end users to view but not
change information. Select this check box if you do not want the end user to
enter data into the fields in any of the rows. End users can still manipulate the
grid to display a new view of their data, but they cannot update the actual
data displayed in the analytic grid.
If the grid is display only, obviously all the fields within the grid are display
only. However, if the grid is not display only, there are several possibilities:
• If fields are display only, the analytic grid honors that.
• If fields are not display only, they are editable as long as they are
nonaggregate values.
• If fields are dimensions, they are display only unless the dimension is
on the slicer axis.
Inactive
The analytic grid does not display to end users and no data is loaded into the
analytic grid data, thus no data is available to the application developer
using PeopleCode.
Wrap Column Label
Select whether column labels wrap if they are too long to fit within the column
at its current width. If you do not select this option, columns widen as needed
to accommodate long column labels.
Copyright © 1988-2007, Oracle. All rights reserved.
219
Creating Analytic Grids
Chapter 13
Collapsible Data Area
Select this option so that the data area for your analytic grid can be collapsed
into a header bar with an icon that the end user must click to expand it.
Selecting Collapsible Data Area enables the Default Initial View to Expanded
State check box.
Default Initial View to
Expanded State
Select whether the initial view of the grid is expanded or collapsed. It is
expanded by default.
Note. This check box is available only if you selected Collapsible Data Area.
No Drag and Drop
Specify whether the end user can drag and drop cubes, dimensions, and so on at
runtime. This item is not available if Freeze Column Mode has been selected.
Setting Analytic Grid General Properties
Access the Analytic Grid Properties dialog box by double-clicking the analytic grid, and then click the
General tab:
220
Copyright © 1988-2007, Oracle. All rights reserved.
Chapter 13
Creating Analytic Grids
Analytic Grid Properties dialog box, General tab
Page Field Name
Specify a grid name consisting of any combination of uppercase letters, digits,
and the symbols #, $, @, and _. The default is the name of the main record
for the analytic grid; however, you can rename the grid as long as you use a
unique name for the page or component. This name is used by the PeopleCode
GetAnalyticGrid function to create a grid definition.
See Enterprise PeopleTools 8.49 PeopleBook: PeopleCode Language
Reference, “PeopleCode Built-in Functions,” GetAnalyticGrid.
Occurs Count (rows)
Determines the vertical page size—that is, how many rows of data are
displayed initially at runtime. The occurs count is set to 1 by default. If you
set the occurs count to 30 rows, for example, the end user sees 30 rows of
data at a time.
Max Visible Row Count
Specify the maximum number of visible rows. This item is only available
when Freeze Column Mode has been selected.
Copyright © 1988-2007, Oracle. All rights reserved.
221
Creating Analytic Grids
Unlimited Occurs Count
(rows)
Chapter 13
Sets the occurs count to unlimited, which means that the end user sees all rows
of data. (Note that selecting this check box disables the Occurs Count option,
because it is no longer applicable.)
Note. In addition to setting an occurs count, the developer can set a threshold
(by using ACEGRDROWS in PeopleSoft Personalizations) to limit how many
rows of data are displayed in the grid. (The analytic grid supports a minimum
of 2 rows—one for column axis and one for data—and a maximum of 101
rows—one for column axis and 100 for data.) This threshold works with the
View All link in the grid. If the number of rows of data returned is less than
the threshold, this link reads View All and, when the end user clicks it, all
records appear. However, if the number of rows of data returned is more than
the threshold, the View All link changes to View X, where X is the value of the
threshold. (This link is a toggle: clicking it switches between displaying the
occurs count specified in the properties dialog box and the threshold specified
in user personalizations.) If the occurs count is greater than or equal to the
threshold, the threshold takes precedence.
See Enterprise PeopleTools 8.49 PeopleBook: Security Administration,
“Managing PeopleSoft Personalizations,” Working with Personalization
Options.
Enable as Page Anchor
Select to apply an anchor tag to serve as a jump destination on the page.
See Enterprise PeopleTools 8.49 PeopleBook: PeopleSoft Application
Designer, “Using Page Controls,” Specifying Destination Types.
See Enterprise PeopleTools 8.49 PeopleBook: PeopleSoft Application
Designer, “Creating Page Definitions,” Setting General Properties.
Inserting and Manipulating Analytic Grid Columns
This section discusses how to:
• Insert analytic grid columns.
• Delete analytic grid columns.
• Move analytic grid columns on the Layout tab.
• Move analytic grid columns on the Order tab.
• Resize analytic grid columns.
222
Copyright © 1988-2007, Oracle. All rights reserved.
Chapter 13
Creating Analytic Grids
Note. The analytic grid supports a minimum of 2 columns (one for row axis and one for data) and a
maximum of 101 columns (one for column axis and 100 for data). The default maximum number of columns
is 41. You can also use the ACEGRDCOLS option in PeopleSoft Personalizations to set the number of
columns displayed in the analytic grid. If necessary, the analytic grid provides a scroll bar that enables
end users to scroll through all columns.
When Freeze Column Mode is selected, all columns in the analytic grid are displayed. No threshold is
placed on the maximum number of columns. The user profile setting ACEGRDCOLS, has no affect if
Freeze Column Mode is selected. The analytic grid provides a horizontal scroll bar to scroll through all
the columns in the grid. The size of the analytic grid at runtime is a factor of the design time size of the
analytic grid and the actual browser page width. The browser width is used only when the page is generated,
so the size of the grid does not change as the user resizes the browser window. It does change on the next
server trip when the page is regenerated.
See Enterprise PeopleTools 8.49 PeopleBook: Security Administration, “Managing PeopleSoft
Personalizations,” Working with Personalization Options.
Note. The order of the dimensions in the analytic grid does not need to match the order of dimensions in the
analytic model. The order in the model is for the purposes of calculation, whereas the order of columns in
the analytic grid determines the order that displays to the end user.
Inserting Analytic Grid Columns
Use one of the following methods to insert an analytic grid column:
• Select a page control from the Insert menu and click the analytic grid.
Note. You can insert these page controls within analytic grids: edit boxes, long edit boxes, images, push
buttons, and check boxes.
Note. A cube formatted as dimension member should have field type of edit box.
• Drag a page field from within the current page, or from another page, into the analytic grid.
• Copy and paste a page field or record field.
• Drag a definition (such as a record field definition, a page field definition, or an entire record definition)
from the project workspace to the analytic grid.
The Analytic grid columns should all be bound to the same record definition to which the underlying cube
collection is attached; the only exception is the columns used for related display/related edit. All the fields in
the record definition that are mapped to either a dimension or a field should have a representative column in
the analytic grid.
Deleting Analytic Grid Columns
To delete an analytic grid column:
1. Select a column by clicking the column heading.
Be sure that you select only the column and not the analytic grid as a whole; otherwise, you might
delete the entire grid instead of just the column. The column is selected when it turns black. The whole
analytic grid is selected when control boxes appear around the edges of the grid.
Copyright © 1988-2007, Oracle. All rights reserved.
223
Creating Analytic Grids
Chapter 13
2. Press DELETE.
Moving Analytic Grid Columns on the Layout Tab
To move analytic grid columns on the Layout tab:
1. Select a column by clicking its column heading.
2. Drag the column to its new location.
3. Release the mouse button over the column that is to the left of the new location.
Note. Remember, the order of columns here determines the order in which they display to end users. However,
to determine the axis on which fields appear, you use the Analytics tab in the Analytic Grid Properties dialog
box. All non-dimensional fields can appear on one axis only.
Moving Analytic Grid Columns on the Order Tab
To move analytic grid columns on the Order tab:
1. Select the column row by clicking the row number.
The analytic grid is identified as such in the Type column and appears in green. All columns in the
analytic grid are directly below this analytic grid row and appear in a lighter green.
2. Drag the row to the new position in the grid.
A red line indicates the new position of the column before you release it.
Note. You cannot move a column outside of the grid when working on the Order tab. Similarly, you
cannot move an existing page control from elsewhere on the page into the grid. You can perform both
of these operations on the Layout tab.
Resizing Analytic Grids
You can resize analytic grids in PeopleSoft Application Designer by dragging the right border of the grid. The
size of individual columns is determined by the data they contain. The height of the analytic grid is determined
by the number of rows it contains. If the number of columns extends beyond the maximum width of the page,
a scroll bar is introduced to enable end users to scroll through the columns.
Note. When designing analytic grids, keep in mind that the row header, which you do not see in PeopleSoft
Application Designer, takes up some of the width of the analytic grid that is displayed to end users.
Setting Column Properties for Analytic Grids
After you insert the page control or field into your grid, you can set the properties for that field as you would
set properties for any other page control. Access the field properties by double-clicking the column heading.
This properties dialog box behaves much as it does for ordinary grids.
See Enterprise PeopleTools 8.49 PeopleBook: PeopleSoft Application Designer, “Creating Page Definitions,”
Setting Page Field Properties for Controls.
Note. Settings that you select in the properties dialog, which comes up when you click an individual column in
the analytic grid, override the settings that you select in the Analytic Grid Properties dialog box.
224
Copyright © 1988-2007, Oracle. All rights reserved.
Chapter 13
Creating Analytic Grids
In addition, related display fields and related edit fields behave the same for analytic grids as they do for
ordinary grids.
See Enterprise PeopleTools 8.49 PeopleBook: PeopleSoft Application Designer, “Creating Page Definitions,”
Creating Display Control and Related Fields.
Manipulating the Analytic Grid at Runtime
Your job as an application developer is not finished at design time. You can perform several tasks at runtime
to ensure that the analytic grid works as desired:
• All data for the analytic grid can be accessed using the PeopleCode RowSet class, as with the regular grid.
You can write business logic to manipulate this data.
See Enterprise PeopleTools 8.49 PeopleBook: PeopleCode Developer’s Guide, “Accessing the Data Buffer”.
See Enterprise PeopleTools 8.49 PeopleBook: PeopleCode API Reference, “Analytic Grid Classes,” Using
the Analytic Grid in PeopleCode.
• If necessary, use the RowInit event to populate data for application data fields.
The record definition associated with a cube collection—and, therefore, with the analytic grid—can have
fields that are not mapped to the cube collection’s cubes or dimensions. These extra application data fields
are treated as non-dimensional fields. They are not populated automatically by the PeopleSoft Analytic
Calculation Engine. The RowInit event is fired for each row as it is retrieved from the database, and provides
the opportunity for the application to populate these application fields with the appropriate data.
See Enterprise PeopleTools 8.49 PeopleBook: PeopleCode Developer’s Guide, “PeopleCode and the
Component Processor,” RowInit Event.
• Use PeopleCode to manipulate the analytic model and analytic grid data, as well as change the display of
the analytic grid.
See Enterprise PeopleTools 8.49 PeopleBook: PeopleCode API Reference, “Analytic Grid Classes”.
Copyright © 1988-2007, Oracle. All rights reserved.
225
Creating Analytic Grids
226
Chapter 13
Copyright © 1988-2007, Oracle. All rights reserved.
PART 5
Debugging Analytic Models
Chapter 14
Viewing and Debugging Analytic Models
Chapter 15
Capturing Analytic Instances
CHAPTER 14
Viewing and Debugging Analytic Models
This chapter provides an overview of the Analytic Model Viewer and discusses how to:
• View analytic model properties.
• Use Analytic Model Viewer alongside PeopleSoft Application Designer.
• Use the application log fence to provide additional debugging information.
Understanding the Analytic Model Viewer
The Analytic Model Viewer is a debugging tool with which you can view intermediate results from
calculations and modify data when testing calculations. This tool is provided in the runtime environment
through the PeopleSoft Pure Internet Architecture. Using the Analytic Model Viewer, you can view metadata
(such as virtual data cubes) that may not appear to the end user, and edit analytic model data to see how
your results would then change.
Even though you create analytic model definitions in PeopleSoft Application Designer, you need to view
an analytic instance of the analytic model during runtime to determine whether the analytic calculation
engine is performing its calculations as intended. Simply viewing an analytic instance within the application
during runtime is not sufficient, because some parts and data of the analytic model may not be visible to end
users. Using the Analytic Model Viewer you can view, analyze, and debug all cube collections in the model.
The Analytic Model Viewer operates during runtime because it depends on the analytic calculation engine
(for calculation) and the analytic server (for data transformation). In the Analytic Model Viewer, you view
a specific analytic instance of the analytic model.
Although you can modify data from within the Analytic Model Viewer, you cannot change metadata, including
rules, from this environment. Conversely, from within the analytic model in PeopleSoft Application Designer,
you can change metadata but cannot change the data itself. The ideal solution is to simultaneously view the
design time analytic model, in PeopleSoft Application Designer, and the runtime analytic model, in the
Analytic Model Viewer. This arrangement enables you to compare calculation results, and to change either
data or metadata, based upon your needs.
After you load an analytic instance for use in the Analytic Model Viewer, closing the viewer does not
automatically unload the analytic instance. You must do that manually from the Analytic Instance Load/Unload
page.
Note. You can view causes, effects, and inputs in both PeopleSoft Application Designer and the Analytic
Model Viewer. PeopleSoft Application Designer displays the causes, effects, and inputs of data cubes and cube
collections. The Analytic Model Viewer displays not only causes, effects, inputs, but also displays overrides
(which are determined during runtime), thus providing a more detailed display of causes, effects, and inputs.
Copyright © 1988-2007, Oracle. All rights reserved.
229
Viewing and Debugging Analytic Models
Chapter 14
Note. The Analytic Model Viewer utility is only available to system administrators. You cannot change its
security settings to make it available to other users.
Viewing Analytic Model Properties
This section provides an overview of the Analytic Model Viewer and discusses how to :
• View analytic models.
• View and debug cube collection properties.
• View and debug data cube properties.
• View cell properties.
• View dimension properties.
• View user function properties.
• View organizer properties.
Understanding Analytic Model Properties
If you have already created an analytic instance, and do not need to change any of its settings, you can use
the Analytic Model Viewer to search for, load, and open the analytic instance. (If the instance is not loaded,
clicking its name both loads and opens it; if it is loaded, clicking its name opens the instance.) When you
open an analytic instance, the Analytic Model Viewer opens to a Properties tab, which displays the parts,
properties, and data of the current analytic instance.
See Enterprise PeopleTools 8.49 PeopleBook: System and Server Administration, “Managing Analytic
Servers,” Creating, Deleting, and Copying Analytic Instances.
See Enterprise PeopleTools 8.49 PeopleBook: System and Server Administration, “Managing Analytic
Servers,” Loading and Unloading Analytic Instances.
This example shows the Properties tab of the Analytic Model Viewer:
230
Copyright © 1988-2007, Oracle. All rights reserved.
Chapter 14
Viewing and Debugging Analytic Models
Part Properties Dialog
Part Browser
Analytic Grid
Analytic Model Viewer, Properties tab
Part Browser
Contains hierarchies that you use to view and debug the parts of the current
analytic instance. This part browser is similar to the one in PeopleSoft
Application Designer. For example, if you drill into a cube collection it
expands to display the specific cube collections in the current analytic
instance. You can then expand each cube collection further into data cubes and
dimensions. When you click the name of any part, its associated properties
appear on the right side of the page, in the Part Property Dialog.
See Chapter 3, “Understanding Analytic Models,” PeopleSoft Application
Designer Window Components for Creating Analytic Model Definitions,
page 20.
Part Properties Dialog
Displays the properties of the selected part of the current analytic instance.
Analytic Grid
Displays the data for the part selected in the Part Browser. For example, if you
select the Product Sales data cube, an analytic grid displaying Product Sales
data appears. You can update the data in the analytic grid and recalculate the
analytic instance. This analytic grid looks and feels like the analytic grid that
you add to PeopleSoft pages to display data from the analytic server. You can
use it to view, edit, and drag and drop data from an analytic model.
See Chapter 13, “Creating Analytic Grids,” page 211.
See Enterprise PeopleTools 8.49 PeopleBook: Using PeopleSoft Applications,
“Working With Pages,” Working with Analytic Grids.
Debugging Tab
Contains options that enable you to audit the selected data cube, or from one to
three data cubes from the selected cube collection. You can use this feature
to view All Causes, All Effects, All Inputs, Circular System, Direct Causes,
and Direct Effects. Like the Properties tab, the Debugging tab includes a Part
Copyright © 1988-2007, Oracle. All rights reserved.
231
Viewing and Debugging Analytic Models
Chapter 14
Browser, a Part Property Dialog, and an analytic grid. In addition, it displays
an audit grid that displays the audited data when you click the View button.
Pages Used to View Analytic Model Properties
Page Name
Object Name
Navigation
Usage
Analytic Model Viewer Properties Tab
PTACEMDLVWR
PeopleTools, Utilities,
Administration, Analytic
Model Viewer
Enables you to view the
properties and data of the
selected part.
Analytic Model Viewer Debugging Tab
PTACEMDLVWRDBG
PeopleTools, Utilities,
Administration, Analytic
Model Viewer, Debugging
tab
Enables you to perform
debugging tasks related to
the selected data cube or
cube collection.
Filter/Sort Criteria
PTACEDIMPROP_SEC
PeopleTools, Utilities,
Administration, Analytic
Model Viewer, Filter/Sort
Criteria.
Enables you to filter and
sort the contents of the
cube collection based on a
specified dimension.
Cell Properties
PTACECELLPROP_SEC
PeopleTools, Utilities,
Administration, Analytic
Model Viewer, Cell
Properties
Enables you to view cell
properties for designated
member of the selected
dimension.
Tree Properties
PTACETREE_SEC
PeopleTools, Utilities,
Administration, Analytic
Model Viewer. Select to
view a dimension with a
tree attached, choose Tree
Properties.
View the properties of the
tree attached to the selected
dimension.
Viewing Analytic Models
Access the Analytic Model Viewer and select the name of an analytic instance:
232
Copyright © 1988-2007, Oracle. All rights reserved.
Chapter 14
Viewing and Debugging Analytic Models
Analytic Model Viewer, model properties
Resolve circular formulas
Indicates whether circular formulas will be resolved.
See Chapter 10, “Creating Rules, Formulas, and User Functions,” Working
with Circular Formulas and Circular Systems, page 134.
Maximum iteration in
value
Indicates maximum iteration in value.
Maximum change in value
Indicates maximum change in value.
Warning circular formulas
Specifies whether the model contains circular formulas.
Notes
Lists notes related to this analytic model that the developer entered when
creating the model.
See Chapter 4, “Creating Analytic Model Definitions,” Entering Notes for
an Analytic Model Definition’s Parts, page 30.
Reload Model
Reloads the analytic model. PeopleSoft recommends that you reload the
analytic model after you update the analytic model definition so that you can
view the resulting changes.
Viewing and Debugging Cube Collections
This section discusses how to:
• View cube collections and cube collection properties.
• Debug cube collections.
• Sort and filter cube collections.
See Chapter 12, “Understanding the Relationship of Analytic Types to Analytic Models,” page 201.
Copyright © 1988-2007, Oracle. All rights reserved.
233
Viewing and Debugging Analytic Models
Chapter 14
Viewing Cube Collections and Cube Collection Properties
Access the Analytic Model Viewer and select a cube collection whose properties you want to view. You see a
Cube Collection Properties panel displaying the properties of that cube collection.
The analytic grid underneath the Cube Collection Properties panel displays the cube collection data itself. You
can drag and drop data cubes and dimensions within this grid. In addition, you can view selected slices of
your data by choosing from the slice bar.
See Chapter 13, “Creating Analytic Grids,” page 211.
Analytic Model Viewer, cube collection Properties tab
Dimensions
Lists all of the dimensions that are attached to the data cubes within the
cube collection.
Main Record
Lists the main record to which the cube collection is mapped.
Aggregate Record
Lists the aggregate record that stores the cube collection’s aggregate data,
if applicable.
Notes
Lists notes related to this cube collection that the developer entered when
creating the model.
See Chapter 4, “Creating Analytic Model Definitions,” Entering Notes for
an Analytic Model Definition’s Parts, page 30.
Filter/Sort Criteria
Displays a secondary window enabling you to filter and/or sort a selected
dimension within the cube collection.
Cell Properties
Displays a secondary window from which you can view the properties of a
specified cell. You can view cell properties for data cubes and cube collections.
See Chapter 14, “Viewing and Debugging Analytic Models,” Viewing Cell
Properties, page 238.
234
Copyright © 1988-2007, Oracle. All rights reserved.
Chapter 14
Save Recalculate
Viewing and Debugging Analytic Models
Recalculates the results of your analytic instance, if you modified it.
Debugging Cube Collections
Access the Debugging tab of the Analytic Model Viewer. The part browser, filtering and sorting features, and
main grid on the Debugging tab work just like those features on the Properties tab. However, this tab also
enables you to audit the data.
Analytic Model Viewer, cube collections Debugging tab
Select up to 3 cubes for
comparison:
Choose from one to three cubes in the cube collection to audit.
Audit Type
Select from one of the audit types: all causes, all effects, all inputs, circular
system, direct causes, direct effects.
View
Displays the results of the audit in an audit grid below the analytic grid.
See Chapter 5, “Creating Data Cubes,” Auditing Data Cubes at Design Time, page 43.
Sorting and Filtering Cube Collections
Access the Filter/Sort Criteria page:
Copyright © 1988-2007, Oracle. All rights reserved.
235
Viewing and Debugging Analytic Models
Chapter 14
Filter/Sort Criteria window
Members are only filtered when the filter condition is met. In addition, if an aggregate member is filtered, all
its children are also filtered.
Select Dimension
Select the dimension upon which you want to base the filter or sort.
Select Filter
Select the filter.
Apply Filter
Apply the selected filter.
Clear Filter
Clear the selected filter.
Sort
Select whether to sort by key, by name, or by neither. When you elect to sort
by key, you can choose from one to three keys upon which to sort, and can
choose to sort each one of those keys either ascending or descending. When
you sort by name, you can choose to sort either ascending or descending.
Apply Sort
Apply the selected sort.
Clear Sort
Clear the selected sort.
Return
Go back to the main page.
Viewing and Debugging Data Cubes
This section discusses how to:
• View data cubes and data cube properties.
• Debug data cubes.
See Chapter 5, “Creating Data Cubes,” page 31.
Viewing Data Cubes and Data Cube Properties
Access the Analytic Model Viewer and select a data cube whose properties you want to view:
The analytic grid underneath the Cube Properties panel displays the data cube’s values. As with cube
collections, you can use drag and drop to manipulate this grid. You can also view slices of your data by
choosing from the drop-down lists of dimensions.
236
Copyright © 1988-2007, Oracle. All rights reserved.
Chapter 14
Viewing and Debugging Analytic Models
Analytic Model Viewer, data cube Properties tab
Format Type
Displays the format type of the data cube—such as Number, Char, Date, and
so on. These format types are attributes of the cube and are defined within
PeopleSoft Application Designer.
See Chapter 5, “Creating Data Cubes,” Understanding the Relationship
Between Field Definition Attributes and Data Cube Formats, page 38.
Virtual Cube
Indicates whether the selected data cube is a virtual cube.
See Chapter 5, “Creating Data Cubes,” Virtual Data Cubes, page 35.
Dimensions
Lists the dimensions that are attached to the selected data cube.
Calculation Aggregate
Indicates whether the analytic calculation engine calculates aggregates for
the data cube.
Rule
Displays any rules that the analytic calculation engine uses to calculate the
current data cube.
Notes
Lists notes related to this data cube that the developer entered when creating
the model.
See Chapter 4, “Creating Analytic Model Definitions,” Entering Notes for
an Analytic Model Definition’s Parts, page 30.
Cell Properties
Displays a secondary window from which you can view the properties of a
specified cell. You can view cell properties for data cubes and cube collections.
Copyright © 1988-2007, Oracle. All rights reserved.
237
Viewing and Debugging Analytic Models
Chapter 14
See Chapter 14, “Viewing and Debugging Analytic Models,” Viewing Cell
Properties, page 238.
Save Recalculate
Recalculates the results of your analytic instance if you modified it.
Debugging Data Cubes
Access the Analytic Model Viewer, select a data cube whose properties you want to view, and click the
Debugging tab:
You can also audit data cubes at design time.
See Chapter 5, “Creating Data Cubes,” Auditing Data Cubes at Design Time, page 43.
Analytic Model Viewer, data cube Debugging tab
Cell Properties
Displays a secondary window from which you can view the properties of a
specified cell. You can view cell properties for data cubes and cube collections.
Audit Type
Select from one of the audit types: all causes, all effects, all inputs, circular
system, direct causes, direct effects.
View
Displays the results of the audit in an audit grid below the analytic grid.
See Chapter 5, “Creating Data Cubes,” Auditing Data Cubes at Design Time, page 43.
Viewing Cell Properties
Access the Cell Properties page:
238
Copyright © 1988-2007, Oracle. All rights reserved.
Chapter 14
Viewing and Debugging Analytic Models
Cell Properties page
Select Cube
Choose which data cube in the selected cube collection you want to view.
Note. The Select Cube option is enabled only if you activated the Cell
Properties page while viewing a cube collection.
Dimension Name
Displays the names of dimensions attached to the selected cube.
Member
Enter the member in the selected dimension whose properties you want to view.
Display Properties
Displays the properties—including cell type, calculation, calculation
dimensions, reason for calculation choice, and rule—of the selected cell.
Return
Go back to the main page.
Viewing Dimension Properties
This section discusses how to view dimension properties.
See Chapter 6, “Creating Dimensions,” page 47.
Copyright © 1988-2007, Oracle. All rights reserved.
239
Viewing and Debugging Analytic Models
Chapter 14
Access the Analytic Model Viewer and select a dimension whose properties you want to view:
Analytic Model Viewer, dimension properties
When you select a dimension in the part browser, you see a Dimension Properties panel displaying the
properties of that dimension:
Total Member Name
Displays a different value depending on a fairly complex set of factors.
See Chapter 6, “Creating Dimensions,” Defining Dimension Properties,
page 48.
Aggregate Rule
Displays the user function that calculates the dimension’s aggregate fields,
if applicable.
See Chapter 6, “Creating Dimensions,” Defining Dimension Properties,
page 48.
See Chapter 9, “Creating Hierarchies,” Working with Overrides, page 81.
Notes
Lists notes related to this dimension that the developer entered when creating
the model.
See Chapter 4, “Creating Analytic Model Definitions,” Entering Notes for
an Analytic Model Definition’s Parts, page 30.
Dimension Members
240
Underneath the Dimension Properties panel are the dimension members. In
many cases, you will see a simple list of dimension members. In some cases,
however, a hierarchy will have been created for the dimension and you will see
Copyright © 1988-2007, Oracle. All rights reserved.
Chapter 14
Viewing and Debugging Analytic Models
a tree-like structure. In this case, you open and close each branch and leaf, and
see each member of this hierarchy.
Tree Properties
Click to display a secondary page that displays additional properties of the
selected tree, including:
• Tree name.
• Node name.
• Start level.
• Discard level.
• SetID.
• Record name.
• Effective date.
Viewing User Function Properties
This section discusses how to view user functions.
See Chapter 10, “Creating Rules, Formulas, and User Functions,” page 111.
Access the Analytic Model Viewer and select a user function whose properties you want to view:
Analytic Model Viewer, user function properties
Rule
Displays the user function’s rule.
Notes
Lists notes related to this user function that the developer entered when
creating the model.
See Chapter 4, “Creating Analytic Model Definitions,” Entering Notes for
an Analytic Model Definition’s Parts, page 30.
Viewing Organizer Properties
This section discusses how to view organizer properties.
See Chapter 3, “Understanding Analytic Models,” Organizers, page 20.
Copyright © 1988-2007, Oracle. All rights reserved.
241
Viewing and Debugging Analytic Models
Chapter 14
See Chapter 4, “Creating Analytic Model Definitions,” Creating Organizers, page 29.
Access the Analytic Model Viewer and select an organizer whose properties you want to view:
Analytic Model Viewer, organizer properties
Using Analytic Model Viewer Alongside PeopleSoft
Application Designer
It can be profitable to use the Analytic Model Viewer side by side with PeopleSoft Application Designer. This
approach enables you to update the analytic model within PeopleSoft Application Designer and then quickly
see the results of those updates by reloading the analytic instance within the Analytic Model Viewer. This
approach enables you to change both the data and metadata for your model at the same time.
To use the Analytic Model Viewer alongside PeopleSoft Application Designer:
1. Create an analytic model.
See Chapter 4, “Creating Analytic Model Definitions,” page 27.
2. Specify what analytic model works with what analytic type definition.
See Enterprise PeopleTools 8.49 PeopleBook: PeopleSoft Optimization Framework, “Designing
Analytic Type Definitions,” Defining an Analytic Type.
3. Access the Create Analytic Instance page, and create an analytic instance based upon the analytic
type definition.
See Enterprise PeopleTools 8.49 PeopleBook: System and Server Administration, “Managing Analytic
Servers,” Creating, Deleting, and Copying Analytic Instances.
4. Access the Analytic Model Viewer, and open the analytic instance you created.
See Chapter 14, “Viewing and Debugging Analytic Models,” Viewing Analytic Model Properties,
page 230.
5. From within PeopleSoft Application Designer, modify the analytic model.
242
Copyright © 1988-2007, Oracle. All rights reserved.
Chapter 14
Viewing and Debugging Analytic Models
6. From within the Analytic Model Viewer, click the Reload Model button.
Using the Application Log Fence
In addition to the model viewer, you can also use the application log fence settings to cause error messages
created on the analytic server to be written to the analytic server log file.
If you set the application log fence to 3 or above, all the detailed messages created on the analytic server to be
sent back to the application server are also logged in the analytic server log file.
In addition, if you set the application log fence to 4 or above, all tracing information is logged to the analytic
server log file.
See Also
Enterprise PeopleTools 8.49 PeopleBook: PeopleCode Developer’s Guide, “Debugging Your Application,”
Using Application Logging
Copyright © 1988-2007, Oracle. All rights reserved.
243
Viewing and Debugging Analytic Models
244
Chapter 14
Copyright © 1988-2007, Oracle. All rights reserved.
CHAPTER 15
Capturing Analytic Instances
This chapter provides an overview of the Analytic Instance Capture Utility and discusses how to:
• Capture analytic instance data.
• Import analytic instance data.
Understanding the Analytic Instance Capture Utility
When customers report a problem in an application that uses PeopleSoft Analytic Calculation Engine or
PeopleSoft Optimization Framework, they often need to send the relevant data and metadata to PeopleSoft
engineers who can then review the problem. Using the Analytic Instance Capture Utility, customers can
package the data and metadata in a form that they can send to PeopleSoft for analysis and debugging.
PeopleSoft developers than employ the Analytic Instance Capture Utility to “unpackage” (import) the data
for analysis.
The Analytic Instance Capture Utility works across platforms. For example, there should be no problem if a
customer exports data from an Oracle database and then PeopleSoft user support imports it into Microsoft SQL
Server. The same is true if the data is exported, for instance, from a UNIX platform and imported into Windows.
Note. The machines being used to import and export data must be on identical versions of PeopleTools.
The Analytic Instance Capture Utility is not intended to handle major problems, such as crashes. Instead, it
focuses on data problems—for example, when customers discover incorrectly calculated application data and
want PeopleSoft developers to help determine the source of these calculations errors.
Note. Before using the Analytic Instance Capture Utility to communicate with PeopleSoft support, you should
attempt to diagnose the problem by using the Analytic Model Viewer.
See Chapter 14, “Viewing and Debugging Analytic Models,” page 229.
Capturing Analytic Instance Data
You need to capture the relevant data and metadata before sending it to PeopleSoft support for diagnosis.
You can capture the data by loading an analytic instance and then exporting it with the Analytic Instance
Capture Utility.
Copyright © 1988-2007, Oracle. All rights reserved.
245
Capturing Analytic Instances
Chapter 15
By default, the Analytic Instance Capture Utility exports the analytic instance to a directory that it creates
entitled <PS_HOME>\appserv\<domain>\LOGS\<analytic instance><timestamp>. For example, if you
export an analytic instance named ACEINST, the resulting export directory is named something like
<PS_HOME>\appserv\<domain>\LOGS\ACEINST_20041113_015912. A valid export directory will by
default include the following files. If not, the export was not successful:
• The utility registration file items.reg.
• One or more data cache files named data_1.bin, data_2.bin, and so forth.
• Two .txt files, exportResults.txt and importDirections.txt. The exportResults.txt file contains explicit
details on how to export your metadata to a project. The importDirections.txt file contains details on
how to import this particular analytic instance.
See Enterprise PeopleTools 8.49 PeopleBook: System and Server Administration, “Managing Analytic
Servers,” Loading and Unloading Analytic Instances.
Pages Used to Export Analytic Instances
Page Name
Object Name
Navigation
Usage
Analytic Instance
Load/Unload
PTACEMDLLOAD
PeopleTools, Utilities,
Administration, Analytic
Instance Load/Unload
Load or unload an analytic
instance.
Export Instance
PTATEXPORT
PeopleTools, Utilities,
Export an analytic instance.
Administration, Analytic
Server Administration. Click
the Export Instance tab.
Exporting Analytic Instances
Access the Export Instance page:
246
Copyright © 1988-2007, Oracle. All rights reserved.
Chapter 15
Capturing Analytic Instances
Export Instance page
To export an analytic instance:
1. Load the analytic instance.
See Enterprise PeopleTools 8.49 PeopleBook: System and Server Administration, “Managing Analytic
Servers,” Loading and Unloading Analytic Instances.
2. Access the Export Instance page.
3. Optionally, select whether to filter the loaded analytic instances, either by analytic type or by model
name.
4. Click Search to display the designated loaded analytic instances.
5. Click the option button to the left of the analytic instance that you want to export.
Although you can load multiple analytic instances, you can export only one at a time.
6. Click Export Instance.
Under Export Result, a message indicates the status of the export operation. This message lists:
• The instance name and whether it was exported successfully.
• The export machine.
• The export directory.
• A message about the exportResults.txt file.
Copyright © 1988-2007, Oracle. All rights reserved.
247
Capturing Analytic Instances
Chapter 15
7. Retrieve the exportResults.txt file for specific details on how to export this analytic instance.
8. In PeopleSoft Application Designer, create a project that has the same name as the export directory
that was created during the export procedure.
Remember, the export process creates a directory whose name consists of the analytic instance name
followed by the date and timestamp. For example, if the analytic instance is named ACEINST, the
directory might be named ACEINST_20041113_015912.
See Enterprise PeopleTools 8.49 PeopleBook: PeopleSoft Application Designer, “Working With
Projects”.
9. Select Insert, Definitions into Project and insert the items listed in the exportResults.txt file into
the project.
10. Save the project.
11. Select Tools, Copy Project, To File.
12. Select <PS_HOME>\appserv\<domain>\LOGS\<analytic instance><timestamp> as the export
directory and then click Copy.
13. Zip the contents of <PS_HOME>\appserv\<domain>\LOGS\<analytic instance><timestamp> and
send it to PeopleSoft user support.
Importing Analytic Instance Data
After the customer packages the analytic instance and sends it to PeopleSoft user support, user support
must import that data to diagnose the customer issue.
Pages Used to Import Analytic Instances
Page Name
Object Name
Navigation
Usage
Create Analytic Instance
PTACECRTINST
PeopleTools, Utilities,
Administration, Analytic
Inst. Create/Del/Copy
Create an analytic instance.
Analytic Instance
Load/Unload
PTACEMDLLOAD
PeopleTools, Utilities,
Administration, Analytic
Instance Load/Unload
Load or unload an analytic
instance.
Importing Analytic Instances
To import an analytic instance:
1. Unzip the packaged analytic instance into the directory of your choice—for example, c:\TEMP.
2. Read the importDirections.txt file for explicit details about how to import this analytic instance.
3. In PeopleSoft Application Designer, select Tools, Copy Project, From File.
4. Search for the project named <analytic instance><timestamp>.
This project, which is the result of the export functionality, should be located in the c:\TEMP\<analytic
instance> directory. For example, if the analytic instance is named ACEINST, the directory would be
named something like c:\TEMP\ACEINST_20041113_015912.
248
Copyright © 1988-2007, Oracle. All rights reserved.
Chapter 15
Capturing Analytic Instances
5. Access the Create Analytic Instance page and create an analytic instance named <analytic
instance>—for example, ACEINST.
See Enterprise PeopleTools 8.49 PeopleBook: System and Server Administration, “Managing Analytic
Servers,” Creating, Deleting, and Copying Analytic Instances.
6. Access the Analytic Instance Load/Unload page and perform these steps:
See Enterprise PeopleTools 8.49 PeopleBook: System and Server Administration, “Managing Analytic
Servers,” Loading and Unloading Analytic Instances.
a. Select the name of the directory you just created.
b. Select the Import From File check box.
c. Enter the import directory name under File Directory.
d. Click the Load Analytic Instance button.
Copyright © 1988-2007, Oracle. All rights reserved.
249
Capturing Analytic Instances
250
Chapter 15
Copyright © 1988-2007, Oracle. All rights reserved.
PART 6
Converting Analytic Models
Chapter 16
Converting BAM 8.8 Models to Analytic Models
CHAPTER 16
Converting BAM 8.8 Models to Analytic Models
This chapter provides overviews of the conversion process and part conversion details and discusses how to:
• Export BAM 8.8 models.
• Run the PTAEACECONV Application Engine Program.
• Examine the PTAEACECONV log file.
Understanding the Conversion Process
PeopleSoft Business Analysis Modeler (BAM) is a standalone application that enables developers to create
multidimensional models for the purposes of reporting and analysis. BAM models are not integrated into
the PeopleTools framework. Integrating BAM models with PeopleSoft applications takes many steps and
a significant amount of time.
PeopleSoft Analytic Calculation Engine analytic models are integrated into the PeopleTools framework and
include much of the same functionality and many of the same parts as BAM models. You may want to convert
existing BAM 8.8 models into PeopleSoft Analytic Calculation Engine analytic models to reduce the extra
steps and time needed to integrate these models with PeopleSoft applications. You use the PTAEACECONV
Application Engine program for this purpose.
Because PTAEACECONV does not convert all BAM 8.8 model parts, you must manually complete the
analytic model after conversion.
Note. The PTAEACECONV Application Engine program does not convert application data. Application
developers are responsible for converting application data.
Converting BAM 8.8 models into analytic models involves these steps:
1. Analyze the BAM 8.8 model.
If the existing model contains rules that use the TEXT2MBR function, you must hard-code the
function’s second argument (Text) if the use of the function meets both of these conditions:
• The TEXT2MBR function’s second argument (Text) is not hard-coded.
• The second argument matches the name of any dimension or data cube in the model.
Note. If the second argument matches the name of a dimension member reference—for example,
[COUNTRY:Belgium]—you do not need to hard-code the second argument of this instance of
the TEXT2MBR function.
2. Export the BAM 8.8 model.
Copyright © 1988-2007, Oracle. All rights reserved.
253
Converting BAM 8.8 Models to Analytic Models
Chapter 16
See Chapter 16, “Converting BAM 8.8 Models to Analytic Models,” Exporting BAM 8.8 Models,
page 262.
3. Run the PTAEACECONV Application Engine program.
See Chapter 16, “Converting BAM 8.8 Models to Analytic Models,” Running the PTAEACECONV
Application Engine Program, page 262.
4. Examine the Application Engine log file.
See Chapter 16, “Converting BAM 8.8 Models to Analytic Models,” Examining the PTAEACECONV
Log File, page 264.
5. Map the new analytic model to main and aggregate records that hold the application and aggregation
data.
See Chapter 7, “Creating Cube Collections,” Mapping a Cube Collection to Main and Aggregate
Records, page 58.
6. Map data cubes and dimensions to fields in the main and aggregate records.
See Chapter 7, “Creating Cube Collections,” Mapping Data Cubes and Dimensions to Fields, page 59.
7. Create PeopleSoft Pure Internet Architecture pages with analytic grids.
See Chapter 13, “Creating Analytic Grids,” page 211.
8. View the new analytic model in PeopleSoft Pure Internet Architecture.
See Chapter 14, “Viewing and Debugging Analytic Models,” page 229.
The PTAEACECONV Application Engine program converts most parts and circular formula options into
analytic models.
BAM 8.8 Parts That Can Be Converted
These BAM 8.8 parts can be converted into analytic models:
• Data cubes.
• Dimensions.
• User functions.
• Expression modifiers.
• Table views.
• Import maps.
• Organizers.
BAM 8.8 Parts That Cannot Be Converted
These BAM 8.8 parts cannot be converted into analytic models:
• Prefix modifiers.
• Styles.
• Option lists.
Note. References to option lists within the code of data cube rules; user functions and expression modifiers,
however, are converted.
254
Copyright © 1988-2007, Oracle. All rights reserved.
Chapter 16
Converting BAM 8.8 Models to Analytic Models
See Chapter 16, “Converting BAM 8.8 Models to Analytic Models,” Understanding Part Conversion
Details, page 255.
• Timelines.
• Roles.
• Chart views.
BAM 8.8 Circular Formula Options That Can Be Converted
These BAM 8.8 circular formula options can be converted into analytic models:
• Resolve circular formulas through iteration.
• Maximum number of iterations.
• Maximum change in values.
• Warn about circular formulas every time a circular formula is defined.
BAM 8.8 Circular Formula Options That Cannot Be Converted
The Only if iteration is not enabled BAM 8.8 circular formula option cannot be converted into an analytic
model.
See Also
Chapter 16, “Converting BAM 8.8 Models to Analytic Models,” Understanding Part Conversion Details,
page 255
Understanding Part Conversion Details
This section provides more detailed information about the conversion of BAM 8.8 parts.
Part Names Conversion Method
PTAEACECONV Application Engine program converts the names for each part that will be included
in the analytic model.
The following table describes BAM 8.8 part name attributes and the changes that PTAEACECONV makes to
these attributes:
BAM 8.8 Part Name Attribute
Attribute Change Upon Conversion
Lower case alphanumeric characters
All lower case alphanumeric characters are converted to upper
case alphanumeric characters. For example: Products converts to
PRODUCTS.
White spaces
All white spaces are converted to underscores. For example: Actual
Sales converts to ACTUAL_SALES.
Hyphens
All hyphens are converted to underscore characters. For example:
Gross-Margin converts to GROSS_MARGIN.
Copyright © 1988-2007, Oracle. All rights reserved.
255
Converting BAM 8.8 Models to Analytic Models
Chapter 16
BAM 8.8 Part Name Attribute
Attribute Change Upon Conversion
Non alphanumeric characters
Non alphanumeric characters are removed from the part name. For
example: Cost$ of delivery converts to COST_OF_DELIVERY.
Part names with more than 27 characters
Characters exceeding the 27 character limit are truncated. For
example: Moving STD by Country and Group converts to
MOVING_STD_BY_COUNTRY_AND_G
Duplicate part names
Numeric values are appended to duplicate part names. For example,
if the BAM 8.8 model contains the Actual Sales and Actual_Sales
part names, PTAEACECONV creates two new part names:
ACTUAL_SALES and ACTUAL_SALES1.
Note. Converted names of expression modifiers include the prefix EXP_.
Additionally, for each part that is converted, the original part name is converted into the new part’s description.
Note. Filter user functions that are referenced by dimensions that exist in table views are converted to user
functions. The user function names include the prefix DR_ plus the converted dimension name.
Code in Data Cube Rules, User Functions, and Expression Modifiers
PTAEACECONV uses the following order of execution when converting code in data cube rules, user
functions, and expression modifiers:
1. Replace all references to part names with resolved part names.
During conversion, PTAEACECONV searches through the code in data cube rules, user functions, and
expression modifiers for all part names and replaces these part names with new, converted part names.
For example, the EmployeeNetMonthlyIncome user function contains the following code:
Monthly Salary - Monthly Deductions
PTAEACECONV changes the user function’s code to:
MONTHLY_SALARY - MONTHLY_DEDUCTION
2. Replace all references to option lists with a literal string.
Because analytic models do not support option lists, PTAEACECONV converts references to option
lists within the code of data cube rules, user functions, and expression modifiers. For example, the
RevenueMethod option list exists in the following user function code:
&RevenueMethod := GetRevenueMethod( );
CASE(
&RevenueMethod = \Revenue Method\Data Entry\ :
Do_Something;
&RevenueMethod = \Revenue Method\Repeat Value\ :
Do_Something_ELSE;
)
The PTAEACECONV Application Engine program converts the user function’s code to:
&RevenueMethod := GetRevenueMethod( );
256
Copyright © 1988-2007, Oracle. All rights reserved.
Chapter 16
Converting BAM 8.8 Models to Analytic Models
CASE(&RevenueMethod = "Data Entry":
Do_Something;
&RevenueMethod = "Repeat Value":
Do_Something_ELSE;
)
3. Replace all references to original dimension names with converted dimension names.
4. Replace all references to original data cube names with converted data cube names.
Note. If a dimension name and data cube name share the same name in the original model and one or
both names contain more than 30 characters, the dimension name retains the original part name in
the converted analytic model. If the BAM model contains rules or user functions that reference data
cubes that share the same names as dimensions, the converted rules and user functions reference the
dimensions instead. Developers must resolve these issues. The PTAEACECONV conversion log file
indicates all data cubes and dimensions that fall into this category.
5. Replace all references to the original user function names with converted user function names.
Data Cubes
The PTAEACECONV Application Engine program converts all data cubes and most data cube attributes.
Note. Data cube values are not converted. Application developers are responsible for converting data cube
values.
The following data cube attributes are unaffected by the conversion:
• These data cube formats:
- Text.
Note. The Width property is not converted.
- Number
Note. Digit and Decimal properties are not converted.
- Member.
- Date.
Note. The Dimension Name property is not converted.
• These virtual data cube properties:
- Is virtual.
- Is not virtual.
• Notes.
• Attachments to dimensions.
The following data cube attributes are changed during conversion:
Copyright © 1988-2007, Oracle. All rights reserved.
257
Converting BAM 8.8 Models to Analytic Models
Chapter 16
• These data cube formats:
- General.
The General format is converted to the Text format.
- Currency.
The Currency format is converted to the Number format.
- Option List.
The Option List format is converted to the Text format.
- Percent.
The Percent format is converted to the Number format.
Note. Digit and Decimal properties are not converted.
- Yes/No.
The Yes/No format is converted to Text format.
• Code in data cube rules.
See “Code in Data Cube Rules, User Functions and Expression Modifiers”
• Data cube names:
- Original data cube names are converted into new data cube names using the part names conversion method.
See “Part Names Conversion Method”
Original data cube names are also converted into new data cube descriptions.
These data cube attributes are not converted:
• All methods for combining periods, including:
- Summing Values.
- Averaging Values.
- Last in Period.
- Using Formula.
- Blank.
• All methods for splitting periods, including:
- Dividing Value.
- Interpolating.
- Repeating Value.
- Using Formula.
- Blank.
• All methods for justification, including:
- Default.
- Left.
258
Copyright © 1988-2007, Oracle. All rights reserved.
Chapter 16
Converting BAM 8.8 Models to Analytic Models
- Center.
- Right.
• Formatting function names.
Dimensions
PTAEACECONV converts all dimensions and most dimension attributes.
The conversion does not change the notes for dimensions.
These dimension attributes are converted but are changed during the conversion process:
• Dimension names:
- Original dimension names are converted into new dimension names using the part names conversion
method.
See “Part Names Conversion Method”
- Original dimension names are also converted into new dimension descriptions
• Total member names.
If a dimension contains a Total member, the name of the Total member is converted to an alias of the
root node used in the analytic model.
These dimension attributes are not converted:
• Dimension members.
• Default Alias Function property.
User Functions
PTAEACECONV converts ll user functions.
These user function attributes are unaffected by conversion:
• Rules that have been defined to use within user functions.
• References to user functions from other parts.
See “Code in Data Cube Rules, User Functions and Expression Modifiers”
These user function attributes are changed during the conversion process:
• User function names:
- Original user function names are converted into new user function names using the part names conversion
method.
See “Part Names Conversion Method”
- Original user function names are also converted into new user function descriptions.
• Code used in user functions.
See “Code in Data Cube Rules, User Functions and Expression Modifiers”
PTAEACECONV does not convert these user function categories:
• Calculation Function.
• Alias Function.
Copyright © 1988-2007, Oracle. All rights reserved.
259
Converting BAM 8.8 Models to Analytic Models
Chapter 16
• Formatting Function.
Expression Modifiers
PTAEACECONV converts all expression modifiers. Converted expression modifiers exist as user functions
in the analytic model.
PTAEACECONV does not affect rules that are defined for expression modifiers.
These expression modifier attributes are converted but are changed during the conversion process.
• Expression modifier names:
- Original expression modifier names are converted into new expression modifier names using the part
names conversion method.
See “Part Names Conversion Method”
- Converted names of expression modifiers include the prefix EXP_.
- Original expression modifier names are also converted into new expression modifier descriptions.
• Code used in expression modifiers.
See “Code in Data Cube Rules, User Functions and Expression Modifiers”
PTAEACECONV does not convert references to the original expression modifiers.
Table Views
PTAEACECONV converts all table views into cube collections. Note that BAM 8.8 table views lack important
information needed to complete cube collections, including:
• Main and aggregate records.
• Field mapping between dimensions and data cubes to fields in the main and aggregate records.
See Chapter 7, “Creating Cube Collections,” Mapping Data Cubes and Dimensions to Fields, page 59.
For this reason, you must provide this information in the converted analytic model.
These table view attributes are unaffected by conversion:
• All references to data cubes.
• All references to dimensions.
• Notes.
PTAEACECONV changes table view names in the following manner:
• Original table view names are converted into new cube collection names using the part names conversion
method.
See “Part Names Conversion Method”
• Original table view names are also converted into new cube collection descriptions.
These table view attributes are not converted:
• All references to timelines.
• All references to expression modifiers.
• Prefix modifiers.
260
Copyright © 1988-2007, Oracle. All rights reserved.
Chapter 16
Converting BAM 8.8 Models to Analytic Models
• All table view-related properties, including:
- Coordinates.
- Positions of dimensions in table views.
- Table header cells.
- Sections of table views.
• Table data.
Import Maps
PTAEACECONV converts all import maps into cube collections. Note that BAM 8.8 import maps lack
important information needed to complete cube collections, including:
• Mapping between cube collections to main and aggregate records.
• Field mapping between dimensions and data cubes to fields in the main and aggregate records.
See Chapter 7, “Creating Cube Collections,” Mapping Data Cubes and Dimensions to Fields, page 59.
For this reason, it is necessary for application developers to provide this information in the converted analytic
model.
These import map attributes are unaffected by conversion:
• All references to dimensions.
• All references to data cubes.
• Notes.
PTAEACECONV converts import map names but changes the names in the following manner:
• Original import map names are converted into new cube collection names using the part names conversion
method.
See “Part Names Conversion Method”
• Original import map names are also converted into new cube collection descriptions.
PTAEACECONV does not convert all table view-related properties, including:
• Coordinates.
• Positions of dimensions in import maps.
Organizers
PTAEACECONV converts all organizers.
These organizer attributes are unaffected by conversion:
• Hierarchies within organizers (for example, folders within folders).
• Notes.
• References to all parts except:
- Expression modifiers.
- Prefix modifiers.
- Styles.
Copyright © 1988-2007, Oracle. All rights reserved.
261
Converting BAM 8.8 Models to Analytic Models
Chapter 16
PTAEACECONV converts organizer names but changes them in the following manner:
• Original organizer names are converted into new organizer names using the part names conversion method.
See “Part Names Conversion Method”
• Original organizer names are also converted into new organizer descriptions
PTAEACECONV does not convert organizer references to these parts:
• Expression modifiers.
• Prefix modifiers.
• Styles.
• Chart views.
Exporting BAM 8.8 Models
When you export a BAM 8.8 model, you create an XML file of the model. To export the BAM 8.8 model:
1. Launch PeopleSoft 8.8 Business Analysis Modeler.
2. Select File, Open.
The Open dialog box appears.
3. Select the model that you want to convert.
4. Click Open.
The model appears in the Model Designer.
5. Select File, XML, Export Schema.
The Export XML dialog box appears.
6. Select the location to which you want to export the model schema.
7. Enter a filename for the schema.
8. Click Save.
Running the PTAEACECONV Application Engine Program
This section discusses how to:
• Run PTAEACECONV from PeopleSoft Application Designer.
• Run PTAEACECONV from a PeopleSoft Pure Internet Architecture page.
262
Copyright © 1988-2007, Oracle. All rights reserved.
Chapter 16
Converting BAM 8.8 Models to Analytic Models
See Also
Enterprise PeopleTools 8.49 PeopleBook: PeopleSoft Application Engine, “Managing Application Engine
Programs,” Using the Command Line to Invoke Application Engine Programs
Enterprise PeopleTools 8.49 PeopleBook: PeopleSoft Application Engine, “Managing Application Engine
Programs,” Starting Programs with the Application Engine Process Request Page
Running PTAEACECONV from PeopleSoft Application Designer
Before running PTAEACECONV from PeopleSoft Application Designer, you must customize the program
to find the location and file name of the correct XML file. In PeopleSoft Application Designer, open the
PTAEACECONV Application Engine program definition and view the PeopleCode in Step01. Scroll down
to the following PeopleCode:
If (&modelName = "") Then
&modelName = "TEST";
End-If;
If (&xmlFilePath = "") Then
&xmlFilePath = "C:\PeopleSoft\text.xml";
End-If;
Replace the TEST variable with the XML filename of the exported BAM 8.8 model.
Replace the C:\PeopleSoft\text.xml variable with the full path to the XML file of the exported BAM 8.8 model.
Note. The path must include the full name and extension of the XML file—for example:
C:\User\employment\employment.xml.
When completing the run request, select to output a log to a file. Either use the default
path—c:\temp\PTAEACECONV.log—or create your own path.
See Also
Enterprise PeopleTools 8.49 PeopleBook: PeopleSoft Application Engine, “Managing Application Engine
Programs,” Using PeopleCode to Invoke Application Engine Programs
Running PTAEACECONV from a PeopleSoft Pure
Internet Architecture Page
You use PeopleSoft Application Designer to create a PeopleSoft Pure Internet Architecture page that can run
the PTAEACECONV Application Engine program. This page must contain the following PeopleCode event:
Local Record &staterec = CreateRecord(Record.PTACECONV_AET);
&staterec.ACEXMLFILEPATH.Value = <ACEXMLFILEPATH>;
&staterec.ACEMODELID.Value = <model_name>;
CallAppEngine("PTAEACECONV", &staterec);
Both the <ACEXMLFILEPATH> and <model_name> variables should be replaced by user input.
For example, you would enter C:\User\employment\employment.xml for the <ACEXMLFILEPATH> variable,
and Employment for the <model_name> variable.
Copyright © 1988-2007, Oracle. All rights reserved.
263
Converting BAM 8.8 Models to Analytic Models
Chapter 16
Examining the PTAEACECONV Log File
Use the log file to determine whether the BAM model successfully converted to an analytic model, or whether
there are conversion errors that you must resolve.
If the BAM model converted successfully to an analytic model, the message Application Engine program
PTAEACECONV ended normally appears at the bottom of the PTAEACECONV log file.
The PTAEACECONV log file contains detailed information about:
• All parts that were successfully converted.
• All parts that were not converted for either of these reasons:
- Conversion failure.
- Parts were not available in PeopleSoft Analytic Calculation Engine.
• All part names that were changed using the part name conversion method.
• All user functions and rules that contained changed part names.
• All expression modifiers that were converted to user functions.
• All part name conflicts, such as shared names between dimensions and data cubes.
This example shows the PTAEACECONV log file:
Example of a PTAEACECONV log file
264
Copyright © 1988-2007, Oracle. All rights reserved.
Glossary of PeopleSoft Enterprise Terms
absence entitlement
This element defines rules for granting paid time off for valid absences, such as sick
time, vacation, and maternity leave. An absence entitlement element defines the
entitlement amount, frequency, and entitlement period.
absence take
This element defines the conditions that must be met before a payee is entitled
to take paid time off.
academic career
In PeopleSoft Enterprise Campus Solutions, all course work that a student undertakes
at an academic institution and that is grouped in a single student record. For example,
a university that has an undergraduate school, a graduate school, and various
professional schools might define several academic careers—an undergraduate career,
a graduate career, and separate careers for each professional school (law school,
medical school, dental school, and so on).
academic institution
In PeopleSoft Enterprise Campus Solutions, an entity (such as a university or college)
that is independent of other similar entities and that has its own set of rules and
business processes.
academic organization
In PeopleSoft Enterprise Campus Solutions, an entity that is part of the administrative
structure within an academic institution. At the lowest level, an academic organization
might be an academic department. At the highest level, an academic organization can
represent a division.
academic plan
In PeopleSoft Enterprise Campus Solutions, an area of study—such as a major, minor,
or specialization—that exists within an academic program or academic career.
academic program
In PeopleSoft Enterprise Campus Solutions, the entity to which a student applies and is
admitted and from which the student graduates.
accounting class
In PeopleSoft Enterprise Performance Management, the accounting class defines how
a resource is treated for generally accepted accounting practices. The Inventory
class indicates whether a resource becomes part of a balance sheet account, such as
inventory or fixed assets, while the Non-inventory class indicates that the resource is
treated as an expense of the period during which it occurs.
accounting date
The accounting date indicates when a transaction is recognized, as opposed to the date
the transaction actually occurred. The accounting date and transaction date can be the
same. The accounting date determines the period in the general ledger to which the
transaction is to be posted. You can only select an accounting date that falls within an
open period in the ledger to which you are posting. The accounting date for an item
is normally the invoice date.
accounting split
The accounting split method indicates how expenses are allocated or divided among
one or more sets of accounting ChartFields.
accumulator
You use an accumulator to store cumulative values of defined items as they are
processed. You can accumulate a single value over time or multiple values over
time. For example, an accumulator could consist of all voluntary deductions, or all
company deductions, enabling you to accumulate amounts. It allows total flexibility
for time periods and values accumulated.
action reason
The reason an employee’s job or employment information is updated. The action
reason is entered in two parts: a personnel action, such as a promotion, termination, or
change from one pay group to another—and a reason for that action. Action reasons
are used by PeopleSoft Enterprise Human Resources, PeopleSoft Enterprise Benefits
Copyright © 1988-2007, Oracle. All rights reserved.
265
Glossary
Administration, PeopleSoft Enterprise Stock Administration, and the COBRA
Administration feature of the Base Benefits business process.
action template
In PeopleSoft Enterprise Receivables, outlines a set of escalating actions that the
system or user performs based on the period of time that a customer or item has been in
an action plan for a specific condition.
activity
In PeopleSoft Enterprise Learning Management, an instance of a catalog item
(sometimes called a class) that is available for enrollment. The activity defines
such things as the costs that are associated with the offering, enrollment limits and
deadlines, and waitlisting capacities.
In PeopleSoft Enterprise Performance Management, the work of an organization and
the aggregation of actions that are used for activity-based costing.
In PeopleSoft Enterprise Project Costing, the unit of work that provides a further
breakdown of projects—usually into specific tasks.
In PeopleSoft Workflow, a specific transaction that you might need to perform in a
business process. Because it consists of the steps that are used to perform a transaction,
it is also known as a step map.
266
address usage
In PeopleSoft Enterprise Campus Solutions, a grouping of address types defining the
order in which the address types are used. For example, you might define an address
usage code to process addresses in the following order: billing address, dormitory
address, home address, and then work address.
adjustment calendar
In PeopleSoft Enterprise Campus Solutions, the adjustment calendar controls how a
particular charge is adjusted on a student’s account when the student drops classes
or withdraws from a term. The charge adjustment is based on how much time has
elapsed from a predetermined date, and it is determined as a percentage of the original
charge amount.
administrative function
In PeopleSoft Enterprise Campus Solutions, a particular functional area that processes
checklists, communication, and comments. The administrative function identifies
which variable data is added to a person’s checklist or communication record when a
specific checklist code, communication category, or comment is assigned to the
student. This key data enables you to trace that checklist, communication, or comment
back to a specific processing event in a functional area.
admit type
In PeopleSoft Enterprise Campus Solutions, a designation used to distinguish
first-year applications from transfer applications.
agreement
In PeopleSoft Enterprise eSettlements, provides a way to group and specify processing
options, such as payment terms, pay from a bank, and notifications by a buyer and
supplier location combination.
allocation rule
In PeopleSoft Enterprise Incentive Management, an expression within compensation
plans that enables the system to assign transactions to nodes and participants. During
transaction allocation, the allocation engine traverses the compensation structure
from the current node to the root node, checking each node for plans that contain
allocation rules.
alternate account
A feature in PeopleSoft Enterprise General Ledger that enables you to create
a statutory chart of accounts and enter statutory account transactions at the
detail transaction level, as required for recording and reporting by some national
governments.
analysis database
In PeopleSoft Enterprise Campus Solutions, database tables that store large amounts
of student information that may not appear in standard report formats. The analysis
database tables contain keys for all objects in a report that an application program can
use to reference other student-record objects that are not contained in the printed
report. For instance, the analysis database contains data on courses that are considered
Copyright © 1988-2007, Oracle. All rights reserved.
Glossary
for satisfying a requirement but that are rejected. It also contains information on
courses captured by global limits. An analysis database is used in PeopleSoft
Enterprise Academic Advisement.
Application Messaging
PeopleSoft Application Messaging enables applications within the PeopleSoft
Enterprise product family to communicate synchronously or asynchronously with
other PeopleSoft Enterprise and third-party applications. An application message
defines the records and fields to be published or subscribed to.
AR specialist
Abbreviation for receivables specialist. In PeopleSoft Enterprise Receivables, an
individual in who tracks and resolves deductions and disputed items.
arbitration plan
The arbiter when multiple price rules match the transaction. This plan determines the
order in which the price rules are applied to the transaction base price.
assessment rule
In PeopleSoft Enterprise Receivables, a user-defined rule that the system uses to
evaluate the condition of a customer’s account or of individual items to determine
whether to generate a follow-up action.
asset class
An asset group used for reporting purposes. It can be used in conjunction with the asset
category to refine asset classification.
attribute/value pair
In PeopleSoft Enterprise Directory Interface, relates the data that makes up an entry in
the directory information tree.
auction event
In PeopleSoft Strategic Sourcing, a sourcing event where bidders actively compete
against one another to achieve the best price or score.
audience
In PeopleSoft Enterprise Campus Solutions, a segment of the database that relates
to an initiative, or a membership organization that is based on constituent attributes
rather than a dues-paying structure. Examples of audiences include the Class of ’65
and Undergraduate Arts & Sciences.
authentication server
A server that is set up to verify users of the system.
base time period
In PeopleSoft Enterprise Business Planning, the lowest level time period in a calendar.
benchmark job
In PeopleSoft Enterprise Workforce Analytics Solution, a benchmark job is a job
code for which there is corresponding salary survey data from published, third-party
sources.
bid response
In PeopleSoft Strategic Sourcing, the response by a bidder to an event.
billing career
In PeopleSoft Enterprise Campus Solutions, the one career under which other careers
are grouped for billing purposes if a student is active simultaneously in multiple
careers.
bio bit or bio brief
In PeopleSoft Enterprise Campus Solutions, a report that summarizes information
stored in the system about a particular constituent. You can generate standard or
specialized reports.
book
In PeopleSoft Enterprise Asset Management, used for storing financial and tax
information, such as costs, depreciation attributes, and retirement information
on assets.
branch
A tree node that rolls up to nodes above it in the hierarchy, as defined in PeopleSoft
Tree Manager.
budgetary account only
An account used by the system only and not by users; this type of account does
not accept transactions. You can only budget with this account. Formerly called
“system-maintained account.”
Copyright © 1988-2007, Oracle. All rights reserved.
267
Glossary
budget check
In commitment control, the processing of source transactions against control budget
ledgers, to see if they pass, fail, or pass with a warning.
budget control
In commitment control, budget control ensures that commitments and expenditures
don’t exceed budgets. It enables you to track transactions against corresponding
budgets and terminate a document’s cycle if the defined budget conditions are not met.
For example, you can prevent a purchase order from being dispatched to a vendor if
there are insufficient funds in the related budget to support it.
budget period
The interval of time (such as 12 months or 4 quarters) into which a period is divided
for budgetary and reporting purposes. The ChartField allows maximum flexibility to
define operational accounting time periods without restriction to only one calendar.
business activity
The name of a subset of a detailed business process. This might be a specific
transaction, task, or action that you perform in a business process.
business event
In PeopleSoft Enterprise Receivables, defines the processing characteristics for the
Receivable Update process for a draft activity.
In PeopleSoft Enterprise Sales Incentive Management, an original business transaction
or activity that may justify the creation of a PeopleSoft Enterprise Incentive
Management event (a sale, for example).
business process
A standard set of 17 business processes are defined and maintained by the PeopleSoft
Enterprise product families and are supported by the Business Process Engineering
group. An example of a business process is Order Fulfillment, which is a business
process that manages sales orders and contracts, inventory, billing, and so forth.
See also detailed business process.
268
business unit constraints
In PeopleSoft Strategic Sourcing, these constraints apply to a selected Strategic
Sourcing business unit. Spend is tracked across all of the events within the selected
Strategic Sourcing business unit.
business task
The name of the specific function depicted in one of the business processes.
business unit
A corporation or a subset of a corporation that is independent with regard to one or
more operational or accounting functions.
buyer
In PeopleSoft Enterprise eSettlements, an organization (or business unit, as opposed
to an individual) that transacts with suppliers (vendors) within the system. A buyer
creates payments for purchases that are made in the system.
buy event
In PeopleSoft Strategic Sourcing, for event creators, the purchase of goods or services,
most typically associated with a request for quote, proposal, or reverse auction.For
bidders, the sale of goods or services.
campus
In PeopleSoft Enterprise Campus Solutions, an entity that is usually associated with
a distinct physical administrative unit, that belongs to a single academic institution,
that uses a unique course catalog, and that produces a common transcript for students
within the same academic career.
cash drawer
A repository for monies and payments taken locally.
catalog item
In PeopleSoft Enterprise Learning Management, a specific topic that a learner can
study and have tracked. For example, “Introduction to Microsoft Word.” A catalog
item contains general information about the topic and includes a course code,
description, categorization, keywords, and delivery methods. A catalog item can
have one or more learning activities.
catalog map
In PeopleSoft Enterprise Catalog Management, translates values from the catalog
source data to the format of the company’s catalog.
Copyright © 1988-2007, Oracle. All rights reserved.
Glossary
catalog partner
In PeopleSoft Enterprise Catalog Management, shares responsibility with the
enterprise catalog manager for maintaining catalog content.
categorization
Associates partner offerings with catalog offerings and groups them into enterprise
catalog categories.
category
In PeopleSoft Enterprise Campus Solutions, a broad grouping to which specific
comments or communications (contexts) are assigned. Category codes are also linked
to 3C access groups so that you can assign data-entry or view-only privileges across
functions.
channel
In PeopleSoft MultiChannel Framework, email, chat, voice (computer telephone
integration [CTI]), or a generic event.
ChartField
A field that stores a chart of accounts, resources, and so on, depending on the
PeopleSoft Enterprise application. ChartField values represent individual account
numbers, department codes, and so forth.
ChartField balancing
You can require specific ChartFields to match up (balance) on the debit and the credit
side of a transaction.
ChartField combination edit
The process of editing journal lines for valid ChartField combinations based on
user-defined rules.
ChartKey
One or more fields that uniquely identify each row in a table. Some tables contain only
one field as the key, while others require a combination.
checkbook
In PeopleSoft Enterprise Promotions Management, enables you to view financial data
(such as planned, incurred, and actual amounts) that is related to funds and trade
promotions.
checklist code
In PeopleSoft Enterprise Campus Solutions, a code that represents a list of planned
or completed action items that can be assigned to a staff member, volunteer, or unit.
Checklists enable you to view all action assignments on one page.
claimback
In the wholesale distribution industry, a contract between supplier and distributor, in
which monies are paid to the distributor on the sale of specified products or product
groups to targeted customers or customer groups.
class
In PeopleSoft Enterprise Campus Solutions, a specific offering of a course component
within an academic term.
See also course.
Class ChartField
A ChartField value that identifies a unique appropriation budget key when you
combine it with a fund, department ID, and program code, as well as a budget period.
Formerly called sub-classification.
clearance
In PeopleSoft Enterprise Campus Solutions, the period of time during which
a constituent in PeopleSoft Enterprise Contributor Relations is approved for
involvement in an initiative or an action. Clearances are used to prevent development
officers from making multiple requests to a constituent during the same time period.
clone
In PeopleCode, to make a unique copy. In contrast, to copy may mean making a
new reference to an object, so if the underlying object is changed, both the copy and
the original change.
cohort
In PeopleSoft Enterprise Campus Solutions, the highest level of the three-level
classification structure that you define for enrollment management. You can define a
cohort level, link it to other levels, and set enrollment target numbers for it.
See also population and division.
Copyright © 1988-2007, Oracle. All rights reserved.
269
Glossary
collection
To make a set of documents available for searching in Verity, you must first create
at least one collection. A collection is set of directories and files that allow search
application users to use the Verity search engine to quickly find and display source
documents that match search criteria. A collection is a set of statistics and pointers
to the source documents, stored in a proprietary format on a file server. Because a
collection can only store information for a single location, PeopleTools maintains a set
of collections (one per language code) for each search index object.
collection rule
In PeopleSoft Enterprise Receivables, a user-defined rule that defines actions to
take for a customer based on both the amount and the number of days past due for
outstanding balances.
comm key
See communication key.
communication key
In PeopleSoft Enterprise Campus Solutions, a single code for entering a combination
of communication category, communication context, communication method,
communication direction, and standard letter code. Communication keys (also called
comm keys or speed keys) can be created for background processes as well as for
specific users.
compensation object
In PeopleSoft Enterprise Incentive Management, a node within a compensation
structure. Compensation objects are the building blocks that make up a compensation
structure’s hierarchical representation.
compensation structure
In PeopleSoft Enterprise Incentive Management, a hierarchical relationship of
compensation objects that represents the compensation-related relationship between
the objects.
component interface
A component interface is a set of application programming interfaces (APIs) that you
can use to access and modify PeopleSoft Enterprise database information using a
program instead of the PeopleSoft client.
condition
In PeopleSoft Enterprise Receivables, occurs when there is a change of status for a
customer’s account, such as reaching a credit limit or exceeding a user-defined balance
due.
configuration parameter
catalog
Used to configure an external system with PeopleSoft Enterprise. For example, a
configuration parameter catalog might set up configuration and communication
parameters for an external server.
configuration plan
In PeopleSoft Enterprise Incentive Management, configuration plans hold allocation
information for common variables (not incentive rules) and are attached to a node
without a participant. Configuration plans are not processed by transactions.
constituents
In PeopleSoft Enterprise Campus Solutions, friends, alumni, organizations,
foundations, or other entities affiliated with the institution, and about which the
institution maintains information. The constituent types delivered with PeopleSoft
Enterprise Contributor Relations Solutions are based on those defined by the Council
for the Advancement and Support of Education (CASE).
constraint
A business policy or rule that affects how a sourcing event is awarded. There are three
types of constraints: business, global, and event.
content reference
Content references are pointers to content registered in the portal registry. These are
typically either URLs or iScripts. Content references fall into three categories: target
content, templates, and template pagelets.
context
In PeopleCode, determines which buffer fields can be contextually referenced and
which is the current row of data on each scroll level when a PeopleCode program
is running.
In PeopleSoft Enterprise Campus Solutions, a specific instance of a comment or
communication. One or more contexts are assigned to a category, which you link to
270
Copyright © 1988-2007, Oracle. All rights reserved.
Glossary
3C access groups so that you can assign data-entry or view-only privileges across
functions.
In PeopleSoft Enterprise Incentive Management, a mechanism that is used to
determine the scope of a processing run. PeopleSoft Enterprise Incentive Management
uses three types of context: plan, period, and run-level.
control table
Stores information that controls the processing of an application. This type of
processing might be consistent throughout an organization, or it might be used only by
portions of the organization for more limited sharing of data.
cost plus contract line
A rate-based contract line associated with a fee component of Award, Fixed, Incentive,
or Other. Rate-based contract lines associated with a fee type of None are not
considered cost-plus contract lines.
cost plus pricing
In PeopleSoft Enterprise Pricer, a pricing method that begins with cost of goods as
the basis.
cost profile
A combination of a receipt cost method, a cost flow, and a deplete cost method. A
profile is associated with a cost book and determines how items in that book are
valued, as well as how the material movement of the item is valued for the book.
cost row
A cost transaction and amount for a set of ChartFields.
counter sale
A face-to-face customer transaction where the customer typically selects items from
the storefront or picks up products that they ordered ahead of time. Customers pay
for the goods at the counter and take the goods with them instead of having the goods
shipped from a warehouse.
course
In PeopleSoft Enterprise Campus Solutions, a course that is offered by a school and
that is typically described in a course catalog. A course has a standard syllabus and
credit level; however, these may be modified at the class level. Courses can contain
multiple components such as lecture, discussion, and lab.
See also class.
course share set
In PeopleSoft Enterprise Campus Solutions, a tag that defines a set of requirement
groups that can share courses. Course share sets are used in PeopleSoft Enterprise
Academic Advisement.
current learning
In PeopleSoft Enterprise Learning Management, a self-service repository for all of a
learner’s in-progress learning activities and programs.
data acquisition
In PeopleSoft Enterprise Incentive Management, the process during which raw
business transactions are acquired from external source systems and fed into the
operational data store (ODS).
data cube
In PeopleSoft Analytic Calculation Engine, a data cube is a container for one kind
of data (such as Sales data) and works with in tandem with one or more dimensions.
Dimensions and data cubes in PeopleSoft Analytic Calculation Engine are unrelated
to dimensions and online analytical processing (OLAP) cubes in PeopleSoft Cube
Manager.
data elements
Data elements, at their simplest level, define a subset of data and the rules by which
to group them.
For Workforce Analytics, data elements are rules that tell the system what measures to
retrieve about your workforce groups.
dataset
A data grouping that enables role-based filtering and distribution of data. You can
limit the range and quantity of data that is displayed for a user by associating dataset
rules with user roles. The result of dataset rules is a set of data that is appropriate
for the user’s roles.
Copyright © 1988-2007, Oracle. All rights reserved.
271
Glossary
delivery method
In PeopleSoft Enterprise Learning Management, identifies the primary type of
delivery method in which a particular learning activity is offered. Also provides
default values for the learning activity, such as cost and language. This is primarily
used to help learners search the catalog for the type of delivery from which they learn
best. Because PeopleSoft Enterprise Learning Management is a blended learning
system, it does not enforce the delivery method.
In PeopleSoft Enterprise Supply Chain Management, identifies the method by which
goods are shipped to their destinations (such as truck, air, and rail). The delivery
method is specified when creating shipment schedules.
delivery method type
In PeopleSoft Enterprise Learning Management, identifies how learning activities can
be delivered—for example, through online learning, classroom instruction, seminars,
books, and so forth—in an organization. The type determines whether the delivery
method includes scheduled components.
detailed business process
A subset of the business process. For example, the detailed business process named
Determine Cash Position is a subset of the business process called Cash Management.
dimension
In PeopleSoft Analytic Calculation Engine, a dimension contains a list of one kind
of data that can span various contexts, and it is a basic component of an analytic
model. Within the analytic model, a dimension is attached to one or more data cubes.
In PeopleSoft Cube Manager, a dimension is the most basic component of an OLAP
cube and specifies the PeopleSoft metadata to be used to create the dimension’s rollup
structure. Dimensions and data cubes in PeopleSoft Analytic Calculation Engine are
unrelated to dimensions and OLAP cubes in PeopleSoft Cube Manager.
direct receipt
Items shipped from a warehouse or vendor to another warehouse.
direct ship
Items shipped from the vendor or warehouse directly to the customer (formerly
referred to as drop ship).
directory information tree
In PeopleSoft Enterprise Directory Interface, the representation of a directory’s
hierarchical structure.
division
In PeopleSoft Enterprise Campus Solutions, the lowest level of the three-level
classification structure that you define in PeopleSoft Enterprise Recruiting and
Admissions for enrollment management. You can define a division level, link it to
other levels, and set enrollment target numbers for it.
See also population and cohort.
272
document sequencing
A flexible method that sequentially numbers the financial transactions (for example,
bills, purchase orders, invoices, and payments) in the system for statutory reporting
and for tracking commercial transaction activity.
dynamic detail tree
A tree that takes its detail values—dynamic details—directly from a table in the
database, rather than from a range of values that are entered by the user.
edit table
A table in the database that has its own record definition, such as the Department table.
As fields are entered into a PeopleSoft Enterprise application, they can be validated
against an edit table to ensure data integrity throughout the system.
effective date
A method of dating information in PeopleSoft Enterprise applications. You can
predate information to add historical data to your system, or postdate information in
order to enter it before it actually goes into effect. By using effective dates, you don’t
delete values; you enter a new value with a current effective date.
EIM ledger
Abbreviation for Enterprise Incentive Management ledger. In PeopleSoft Enterprise
Incentive Management, an object to handle incremental result gathering within the
scope of a participant. The ledger captures a result set with all of the appropriate traces
to the data origin and to the processing steps of which it is a result.
Copyright © 1988-2007, Oracle. All rights reserved.
Glossary
elimination set
In PeopleSoft Enterprise General Ledger, a related group of intercompany accounts
that is processed during consolidations.
entry event
In PeopleSoft Enterprise General Ledger, Receivables, Payables, Purchasing, and
Billing, a business process that generates multiple debits and credits resulting from
single transactions to produce standard, supplemental accounting entries.
equitization
In PeopleSoft Enterprise General Ledger, a business process that enables parent
companies to calculate the net income of subsidiaries on a monthly basis and adjust
that amount to increase the investment amount and equity income amount before
performing consolidations.
equity item limit
In PeopleSoft Enterprise Campus Solutions, the amounts of funds set by the institution
to be awarded with discretionary or gift funds. The limit could be reduced by amounts
equal to such things as expected family contribution (EFC) or parent contribution.
Students are packaged by Equity Item Type Groups and Related Equity Item Types.
This limit can be used to assure that similar student populations are packaged equally.
event
A predefined point either in the Component Processor flow or in the program flow.
As each point is encountered, the event activates each component, triggering any
PeopleCode program that is associated with that component and that event. Examples
of events are FieldChange, SavePreChange, and RowDelete.
In PeopleSoft Enterprise Human Resources, also refers to an incident that affects
benefits eligibility.
event constraints
In PeopleSoft Strategic Sourcing, these constraints are associated with a specific
sourcing event. Spend is tracked within the selected event.
event propagation process
In PeopleSoft Enterprise Sales Incentive Management, a process that determines,
through logic, the propagation of an original PeopleSoft Enterprise Incentive
Management event and creates a derivative (duplicate) of the original event to
be processed by other objects. PeopleSoft Enterprise Enterprise Sales Incentive
Management uses this mechanism to implement splits, roll-ups, and so on. Event
propagation determines who receives the credit.
exception
In PeopleSoft Enterprise Receivables, an item that either is a deduction or is in dispute.
exclusive pricing
In PeopleSoft Enterprise Order Management, a type of arbitration plan that is
associated with a price rule. Exclusive pricing is used to price sales order transactions.
fact
In PeopleSoft Enterprise applications, facts are numeric data values from fields from a
source database as well as an analytic application. A fact can be anything you want
to measure your business by, for example, revenue, actual, budget data, or sales
numbers. A fact is stored on a fact table.
financial aid term
In PeopleSoft Enterprise Campus Solutions, a combination of a period of time that the
school determines as an instructional accounting period and an academic career. It
is created and defined during the setup process. Only terms eligible for financial aid
are set up for each financial aid career.
financial sanctions
For U.S. based companies and their foreign subsidiaries, a federal regulation from the
Office of Foreign Assets Control (OFAC) requires that vendors be validated against a
Specially Designated Nationals (SDN) list prior to payment.
For PeopleSoft Payables, eSettlements, Cash Management, and Order to Cash, you
can validate your vendors against any financial sanctions list (for example, the SDN
list, a European Union list, and so on).
forecast item
A logical entity with a unique set of descriptive demand and forecast data that is used
as the basis to forecast demand. You create forecast items for a wide range of uses, but
they ultimately represent things that you buy, sell, or use in your organization and for
which you require a predictable usage.
Copyright © 1988-2007, Oracle. All rights reserved.
273
Glossary
fund
In PeopleSoft Enterprise Promotions Management, a budget that can be used to fund
promotional activity. There are four funding methods: top down, fixed accrual,
rolling accrual, and zero-based accrual.
gap
In PeopleSoft Enterprise Campus Solutions, an artificial figure that sets aside an
amount of unmet financial aid need that is not funded with Title IV funds. A gap can
be used to prevent fully funding any student to conserve funds, or it can be used to
preserve unmet financial aid need so that institutional funds can be awarded.
generic process type
In PeopleSoft Process Scheduler, process types are identified by a generic process
type. For example, the generic process type SQR includes all SQR process types,
such as SQR process and SQR report.
gift table
In PeopleSoft Enterprise Campus Solutions, a table or so-called donor pyramid
describing the number and size of gifts that you expect will be needed to successfully
complete the campaign in PeopleSoft Enterprise Contributor Relations. The gift table
enables you to estimate the number of donors and prospects that you need at each
gift level to reach the campaign goal.
GDS
Abbreviation for Global Distribution System. Broad-based term to describe all
computer reservation systems for making travel plans.
GL business unit
Abbreviation for general ledger business unit. A unit in an organization that is an
independent entity for accounting purposes. It maintains its own set of accounting
books.
See also business unit.
GL entry template
Abbreviation for general ledger entry template. In PeopleSoft Enterprise Campus
Solutions, a template that defines how a particular item is sent to the general ledger.
An item-type maps to the general ledger, and the GL entry template can involve
multiple general ledger accounts. The entry to the general ledger is further controlled
by high-level flags that control the summarization and the type of accounting—that is,
accrual or cash.
GL Interface process
Abbreviation for General Ledger Interface process. In PeopleSoft Enterprise Campus
Solutions, a process that is used to send transactions from PeopleSoft Enterprise
Student Financials to the general ledger. Item types are mapped to specific general
ledger accounts, enabling transactions to move to the general ledger when the GL
Interface process is run.
global constraints
In PeopleSoft Strategic Sourcing, these constraints apply across multiple Strategic
Sourcing business units. Spend is tracked across all of the events from the multiple
Strategic Sourcing business units.
group
In PeopleSoft Enterprise Billing and Receivables, a posting entity that comprises one
or more transactions (items, deposits, payments, transfers, matches, or write-offs).
In PeopleSoft Enterprise Human Resources Management and Supply Chain
Management, any set of records that are associated under a single name or variable to
run calculations in PeopleSoft business processes. In PeopleSoft Enterprise Time and
Labor, for example, employees are placed in groups for time reporting purposes.
274
ideal response
In PeopleSoft Strategic Sourcing, a question that requires the response to match the
ideal value for the bid to be considered eligible for award. If the response does not
match the ideal value, you can still submit the bid, but it will be disqualified and
ineligible for award.
incentive object
In PeopleSoft Enterprise Incentive Management, the incentive-related objects that
define and support the PeopleSoft Enterprise Incentive Management calculation
process and results, such as plan templates, plans, results data, and user interaction
objects.
Copyright © 1988-2007, Oracle. All rights reserved.
Glossary
incentive rule
In PeopleSoft Enterprise Sales Incentive Management, the commands that act on
transactions and turn them into compensation. A rule is one part in the process of
turning a transaction into compensation.
incur
In PeopleSoft Enterprise Promotions Management, to become liable for a promotional
payment. In other words, you owe that amount to a customer for promotional
activities.
initiative
In PeopleSoft Enterprise Campus Solutions, the basis from which all advancement
plans are executed. It is an organized effort targeting a specific constituency, and it can
occur over a specified period of time with specific purposes and goals. An initiative
can be a campaign, an event, an organized volunteer effort, a membership drive, or
any other type of effort defined by the institution. Initiatives can be multipart, and
they can be related to other initiatives. This enables you to track individual parts of an
initiative, as well as entire initiatives.
inquiry access
In PeopleSoft Enterprise Campus Solutions, a type of security access that permits the
user only to view data.
See also update access.
institution
In PeopleSoft Enterprise Campus Solutions, an entity (such as a university or college)
that is independent of other similar entities and that has its own set of rules and
business processes.
integration
A relationship between two compatible integration points that enables communication
to take place between systems. Integrations enable PeopleSoft Enterprise applications
to work seamlessly with other PeopleSoft Enterprise applications or with third-party
systems or software.
integration point
An interface that a system uses to communicate with another PeopleSoft Enterprise
application or an external application.
integration set
A logical grouping of integrations that applications use for the same business purpose.
For example, the integration set ADVANCED_SHIPPING_ORDER contains all of the
integrations that notify a customer that an order has shipped.
item
In PeopleSoft Enterprise Inventory, a tangible commodity that is stored in a business
unit (shipped from a warehouse).
In PeopleSoft Enterprise Demand Planning, Inventory Policy Planning, and Supply
Planning, a noninventory item that is designated as being used for planning purposes
only. It can represent a family or group of inventory items. It can have a planning bill
of material (BOM) or planning routing, and it can exist as a component on a planning
BOM. A planning item cannot be specified on a production or engineering BOM or
routing, and it cannot be used as a component in a production. The quantity on hand
will never be maintained.
In PeopleSoft Enterprise Receivables, an individual receivable. An item can be an
invoice, a credit memo, a debit memo, a write-off, or an adjustment.
item shuffle
In PeopleSoft Enterprise Campus Solutions, a process that enables you to change a
payment allocation without having to reverse the payment.
itinerary
In PeopleSoft Expenses, a collection of travel reservations. Itineraries can have
reservations that are selected and reserved with the travel vendor. These itineraries are
not yet paid for and can be referred to as pending reservations. Reservations that have
been paid for are referred to as confirmed reservations.
joint communication
In PeopleSoft Enterprise Campus Solutions, one letter that is addressed jointly to two
people. For example, a letter might be addressed to both Mr. Sudhir Awat and Ms.
Samantha Mortelli. A relationship must be established between the two individuals in
the database, and at least one of the individuals must have an ID in the database.
Copyright © 1988-2007, Oracle. All rights reserved.
275
Glossary
276
keyword
In PeopleSoft Enterprise Campus Solutions, a term that you link to particular elements
within PeopleSoft Enterprise Student Financials, Financial Aid, and Contributor
Relations. You can use keywords as search criteria that enable you to locate specific
records in a search dialog box.
KPI
An abbreviation for key performance indicator. A high-level measurement of how well
an organization is doing in achieving critical success factors. This defines the data
value or calculation upon which an assessment is determined.
KVI
Abbreviation for Known Value Item. Term used for products or groups of products
where the selling price cannot be reduced or increased.
landlord
In PeopleSoft Real Estate Management, an entity that owns real estate and leases the
real estate to tenants.
LDIF file
Abbreviation for Lightweight Directory Access Protocol (LDAP) Data Interchange
Format file. Contains discrepancies between PeopleSoft Enterprise data and directory
data.
learner group
In PeopleSoft Enterprise Learning Management, a group of learners who are linked
to the same learning environment. Members of the learner group can share the same
attributes, such as the same department or job code. Learner groups are used to control
access to and enrollment in learning activities and programs. They are also used to
perform group enrollments and mass enrollments in the back office.
learning components
In PeopleSoft Enterprise Learning Management, the foundational building blocks
of learning activities. PeopleSoft Enterprise Learning Management supports six
basic types of learning components: web-based, session, webcast, test, survey, and
assignment. One or more of these learning component types compose a single
learning activity.
learning environment
In PeopleSoft Enterprise Learning Management, identifies a set of categories and
catalog items that can be made available to learner groups. Also defines the default
values that are assigned to the learning activities and programs that are created within a
particular learning environment. Learning environments provide a way to partition the
catalog so that learners see only those items that are relevant to them.
learning history
In PeopleSoft Enterprise Learning Management, a self-service repository for all of a
learner’s completed learning activities and programs.
lease
In PeopleSoft Real Estate Management, a legally binding agreement between a
landlord and a tenant, where the tenant rents all or part of a physical property from the
landlord.
lease abstract
In PeopleSoft Real Estate Management, a summarized version of the complete lease
contract with only the important terms. The lease abstract usually fits on one page
and does not include legal terminology.
ledger mapping
You use ledger mapping to relate expense data from general ledger accounts to
resource objects. Multiple ledger line items can be mapped to one or more resource
IDs. You can also use ledger mapping to map dollar amounts (referred to as rates)
to business units. You can map the amounts in two different ways: an actual amount
that represents actual costs of the accounting period, or a budgeted amount that can be
used to calculate the capacity rates as well as budgeted model results. In PeopleSoft
Enterprise Warehouse, you can map general ledger accounts to the EW Ledger table.
library section
In PeopleSoft Enterprise Incentive Management, a section that is defined in a plan (or
template) and that is available for other plans to share. Changes to a library section are
reflected in all plans that use it.
line
In PeopleSoft Strategic Sourcing, an individual item or service upon which there
can be a bid.
Copyright © 1988-2007, Oracle. All rights reserved.
Glossary
linked section
In PeopleSoft Enterprise Incentive Management, a section that is defined in a plan
template but appears in a plan. Changes to linked sections propagate to plans using
that section.
linked variable
In PeopleSoft Enterprise Incentive Management, a variable that is defined and
maintained in a plan template and that also appears in a plan. Changes to linked
variables propagate to plans using that variable.
LMS
Abbreviation for learning management system. In PeopleSoft Enterprise Campus
Solutions, LMS is a PeopleSoft Enterprise Student Records feature that provides a
common set of interoperability standards that enable the sharing of instructional
content and data between learning and administrative environments.
load
In PeopleSoft Enterprise Inventory, identifies a group of goods that are shipped
together. Load management is a feature of PeopleSoft Enterprise Inventory that is used
to track the weight, the volume, and the destination of a shipment.
local functionality
In PeopleSoft Enterprise HRMS, the set of information that is available for a specific
country. You can access this information when you click the appropriate country flag
in the global window, or when you access it by a local country menu.
location
Locations enable you to indicate the different types of addresses—for a company, for
example, one address to receive bills, another for shipping, a third for postal deliveries,
and a separate street address. Each address has a different location number. The
primary location—indicated by a 1—is the address you use most often and may be
different from the main address.
logistical task
In PeopleSoft Enterprise Services Procurement, an administrative task that is related to
hiring a service provider. Logistical tasks are linked to the service type on the work
order so that different types of services can have different logistical tasks. Logistical
tasks include both preapproval tasks (such as assigning a new badge or ordering a
new laptop) and postapproval tasks (such as scheduling orientation or setting up the
service provider email). The logistical tasks can be mandatory or optional. Mandatory
preapproval tasks must be completed before the work order is approved. Mandatory
postapproval tasks, on the other hand, must be completed before a work order is
released to a service provider.
market template
In PeopleSoft Enterprise Incentive Management, additional functionality that is
specific to a given market or industry and is built on top of a product category.
mass change
In PeopleSoft Enterprise Campus Solutions, mass change is a SQL generator that can
be used to create specialized functionality. Using mass change, you can set up a
series of Insert, Update, or Delete SQL statements to perform business functions that
are specific to the institution.
See also 3C engine.
match group
In PeopleSoft Enterprise Receivables, a group of receivables items and matching offset
items. The system creates match groups by using user-defined matching criteria for
selected field values.
MCF server
Abbreviation for PeopleSoft MultiChannel Framework server. Comprises the
universal queue server and the MCF log server. Both processes are started when MCF
Servers is selected in an application server domain configuration.
merchandising activity
In PeopleSoft Enterprise Promotions Management, a specific discount type that is
associated with a trade promotion (such as off-invoice, billback or rebate, or lump-sum
payment) that defines the performance that is required to receive the discount. In the
industry, you may know this as an offer, a discount, a merchandising event, an event,
or a tactic.
Copyright © 1988-2007, Oracle. All rights reserved.
277
Glossary
meta-SQL
Meta-SQL constructs expand into platform-specific SQL substrings. They are used in
functions that pass SQL strings, such as in SQL objects, the SQLExec function, and
PeopleSoft Application Engine programs.
metastring
Metastrings are special expressions included in SQL string literals. The metastrings,
prefixed with a percent (%) symbol, are included directly in the string literals. They
expand at run time into an appropriate substring for the current database platform.
multibook
In PeopleSoft Enterprise General Ledger, multiple ledgers having multiple-base
currencies that are defined for a business unit, with the option to post a single
transaction to all base currencies (all ledgers) or to only one of those base currencies
(ledgers).
multicurrency
The ability to process transactions in a currency other than the business unit’s base
currency.
national allowance
In PeopleSoft Enterprise Promotions Management, a promotion at the corporate level
that is funded by nondiscretionary dollars. In the industry, you may know this as a
national promotion, a corporate promotion, or a corporate discount.
NDP
Abbreviation for Non-Discountable Products. Term used for products or groups of
products where the selling price cannot be decreased.
need
In PeopleSoft Enterprise Campus Solutions, the difference between the cost of
attendance (COA) and the expected family contribution (EFC). It is the gap between
the cost of attending the school and the student’s resources. The financial aid package
is based on the amount of financial need. The process of determining a student’s
need is called need analysis.
node-oriented tree
A tree that is based on a detail structure, but the detail values are not used.
Optimization Engine
A PeopleTools component that Strategic Sourcing leverages to evaluate bids and
determine an ideal award allocation. The award recommendation is based on
maximizing the value while adhering to purchasing and company objectives and
constraints.
pagelet
Each block of content on the home page is called a pagelet. These pagelets display
summary information within a small rectangular area on the page. The pagelet provide
users with a snapshot of their most relevant PeopleSoft Enterprise and non-PeopleSoft
Enterprise content.
participant
In PeopleSoft Enterprise Incentive Management, participants are recipients of the
incentive compensation calculation process.
participant object
Each participant object may be related to one or more compensation objects.
See also compensation object.
278
partner
A company that supplies products or services that are resold or purchased by the
enterprise.
pay cycle
In PeopleSoft Enterprise Payables, a set of rules that define the criteria by which it
should select scheduled payments for payment creation.
payment shuffle
In PeopleSoft Enterprise Campus Solutions, a process allowing payments that have
been previously posted to a student’s account to be automatically reapplied when a
higher priority payment is posted or the payment allocation definition is changed.
pending item
In PeopleSoft Enterprise Receivables, an individual receivable (such as an invoice,
a credit memo, or a write-off) that has been entered in or created by the system, but
hasn’t been posted.
Copyright © 1988-2007, Oracle. All rights reserved.
Glossary
PeopleCode
PeopleCode is a proprietary language, executed by the PeopleSoft Enterprise
component processor. PeopleCode generates results based on existing data or user
actions. By using various tools provided with PeopleTools, external services are
available to all PeopleSoft Enterprise applications wherever PeopleCode can be
executed.
PeopleCode event
See event.
PeopleSoft Pure Internet
Architecture
The fundamental architecture on which PeopleSoft 8 applications are constructed,
consisting of a relational database management system (RDBMS), an application
server, a web server, and a browser.
performance measurement
In PeopleSoft Enterprise Incentive Management, a variable used to store data (similar
to an aggregator, but without a predefined formula) within the scope of an incentive
plan. Performance measures are associated with a plan calendar, territory, and
participant. Performance measurements are used for quota calculation and reporting.
period context
In PeopleSoft Enterprise Incentive Management, because a participant typically
uses the same compensation plan for multiple periods, the period context associates
a plan context with a specific calendar period and fiscal year. The period context
references the associated plan context, thus forming a chain. Each plan context has a
corresponding set of period contexts.
person of interest
A person about whom the organization maintains information but who is not part of
the workforce.
personal portfolio
In PeopleSoft Enterprise Campus Solutions, the user-accessible menu item that
contains an individual’s name, address, telephone number, and other personal
information.
phase
A level 1 task, meaning that if a task had subtasks, the level 1 task would be considered
the phase.
pickup quantity
The product quantity that the customer is taking with them from the counter sales
environment.
plan
In PeopleSoft Enterprise Sales Incentive Management, a collection of allocation rules,
variables, steps, sections, and incentive rules that instruct the PeopleSoft Enterprise
Incentive Management engine in how to process transactions.
plan context
In PeopleSoft Enterprise Incentive Management, correlates a participant with
the compensation plan and node to which the participant is assigned, enabling
the PeopleSoft Enterprise Incentive Management system to find anything that is
associated with the node and that is required to perform compensation processing.
Each participant, node, and plan combination represents a unique plan context—if
three participants are on a compensation structure, each has a different plan context.
Configuration plans are identified by plan contexts and are associated with the
participants that refer to them.
plan template
In PeopleSoft Enterprise Incentive Management, the base from which a plan is created.
A plan template contains common sections and variables that are inherited by all plans
that are created from the template. A template may contain steps and sections that
are not visible in the plan definition.
planned learning
In PeopleSoft Enterprise Learning Management, a self-service repository for all of
a learner’s planned learning activities and programs.
planning instance
In PeopleSoft Enterprise Supply Planning, a set of data (business units, items, supplies,
and demands) constituting the inputs and outputs of a supply plan.
population
In PeopleSoft Enterprise Campus Solutions, the middle level of the three-level
classification structure that you define in PeopleSoft Enterprise Recruiting and
Copyright © 1988-2007, Oracle. All rights reserved.
279
Glossary
Admissions for enrollment management. You can define a population level, link it to
other levels, and set enrollment target numbers for it.
See also division and cohort.
280
portal registry
In PeopleSoft Enterprise applications, the portal registry is a tree-like structure in
which content references are organized, classified, and registered. It is a central
repository that defines both the structure and content of a portal through a hierarchical,
tree-like structure of folders useful for organizing and securing content references.
predecessor task
A task that you must complete before you start another task.
price breaks
In PeopleSoft Strategic Sourcing, a price discount or surcharge that a bidder may
apply based on the quantity awarded.
price components
In PeopleSoft Strategic Sourcing, the various components, such as material costs,
labor costs, shipping costs, and so on that make up the overall bid price.
price list
Enables you to select products and conditions for which the price list applies to a
transaction. During a transaction, the system either determines the product price
based on the predefined search hierarchy for the transaction or uses the product’s
lowest price on any associated, active price lists. This price is used as the basis for
any further discounts and surcharges.
price rule
The conditions that must be met for adjustments to be applied to the base price.
Multiple rules can apply when conditions of each rule are met.
price rule conditions
Conditions that select the price-by fields, the values for the price-by fields, and the
operator that determines how the price-by fields relate to the transaction.
price rule key
The fields that are available to define price rule conditions (which are used to match a
transaction) on the price rule.
primacy number
In PeopleSoft Enterprise Campus Solutions, a number that the system uses to prioritize
financial aid applications when students are enrolled in multiple academic careers and
academic programs at the same time. The Consolidate Academic Statistics process
uses the primacy number indicated for both the career and program at the institutional
level to determine a student’s primary career and program. The system also uses the
number to determine the primary student attribute value that is used when you extract
data to report on cohorts. The lowest number takes precedence.
primary name type
In PeopleSoft Enterprise Campus Solutions, the name type that is used to link the name
stored at the highest level within the system to the lower-level set of names that an
individual provides.
process category
In PeopleSoft Process Scheduler, processes that are grouped for server load balancing
and prioritization.
process group
In PeopleSoft Enterprise Financials, a group of application processes (performed in a
defined order) that users can initiate in real time, directly from a transaction entry page.
process definition
Process definitions define each run request.
process instance
A unique number that identifies each process request. This value is automatically
incremented and assigned to each requested process when the process is submitted to
run.
process job
You can link process definitions into a job request and process each request serially
or in parallel. You can also initiate subsequent processes based on the return code
from each prior request.
Copyright © 1988-2007, Oracle. All rights reserved.
Glossary
process request
A single run request, such as a Structured Query Report (SQR), a COBOL or
Application Engine program, or a Crystal report that you run through PeopleSoft
Process Scheduler.
process run control
A PeopleTools variable used to retain PeopleSoft Process Scheduler values needed
at runtime for all requests that reference a run control ID. Do not confuse these with
application run controls, which may be defined with the same run control ID, but only
contain information specific to a given application process request.
product
A PeopleSoft Enterprise or third-party product. PeopleSoft organizes its software
products into product families and product lines. Interactive Services Repository
contains information about every release of every product that PeopleSoft sells, as
well as products from certified third-party companies. These products appear with
the product name and release number.
product adds
The pricing functionality where buying product A gets product B for free or at a price
(formerly referred to as giveaways).
product bidding
In PeopleSoft Strategic Sourcing, the placing of a bid on behalf of the bidder, up or
down to the bidder’s specified amount, so that the bidder can be the leading bidder.
product category
In PeopleSoft Enterprise Incentive Management, indicates an application in the
PeopleSoft Enterprise Incentive Management suite of products. Each transaction in
the PeopleSoft Enterprise Incentive Management system is associated with a product
category.
product family
A group of products that are related by common functionality. The family names
that can be searched using Interactive Service Repository are Oracle’s PeopleSoft
Enterprise, PeopleSoft EnterpriseOne, PeopleSoft World, and third-party, certified
partners.
product line
The name of a PeopleSoft Enterprise product line or the company name of a third-party
certified partner. Integration Services Repository enables you to search for integration
points by product line.
programs
In PeopleSoft Enterprise Learning Management, a high-level grouping that guides the
learner along a specific learning path through sections of catalog items. PeopleSoft
Enterprise Learning Systems provides two types of programs—curricula and
certifications.
progress log
In PeopleSoft Enterprise Services Procurement, tracks deliverable-based projects.
This is similar to the time sheet in function and process. The service provider contact
uses the progress log to record and submit progress on deliverables. The progress
can be logged by the activity that is performed, by the percentage of work that is
completed, or by the completion of milestone activities that are defined for the project.
project transaction
In PeopleSoft Enterprise Project Costing, an individual transaction line that represents
a cost, time, budget, or other transaction row.
promotion
In PeopleSoft Enterprise Promotions Management, a trade promotion, which is
typically funded from trade dollars and used by consumer products manufacturers to
increase sales volume.
prospects
In PeopleSoft Enterprise Campus Solutions, students who are interested in applying to
the institution.
In PeopleSoft Enterprise Contributor Relations, individuals and organizations that are
most likely to make substantial financial commitments or other types of commitments
to the institution.
proxy bidding
In PeopleSoft Strategic Sourcing, the placing of a bid on behalf of the bidder, up or
down to the bidder’s specified amount, so that the bidder can be the leading bidder.
Copyright © 1988-2007, Oracle. All rights reserved.
281
Glossary
publishing
In PeopleSoft Enterprise Incentive Management, a stage in processing that makes
incentive-related results available to participants.
rating components
In PeopleSoft Enterprise Campus Solutions, variables used with the Equation Editor to
retrieve specified populations.
record group
A set of logically and functionally related control tables and views. Record groups
help enable TableSet sharing, which eliminates redundant data entry. Record groups
ensure that TableSet sharing is applied consistently across all related tables and views.
record input VAT flag
Abbreviation for record input value-added tax flag. Within PeopleSoft Enterprise
Purchasing, Payables, and General Ledger, this flag indicates that you are recording
input VAT on the transaction. This flag, in conjunction with the record output VAT
flag, is used to determine the accounting entries created for a transaction and to
determine how a transaction is reported on the VAT return. For all cases within
Purchasing and Payables where VAT information is tracked on a transaction, this
flag is set to Yes. This flag is not used in PeopleSoft Enterprise Order Management,
Billing, or Receivables, where it is assumed that you are always recording only output
VAT, or in PeopleSoft Enterprise Expenses, where it is assumed that you are always
recording only input VAT.
record output VAT flag
Abbreviation for record output value-added tax flag.
See record input VAT flag.
282
recname
The name of a record that is used to determine the associated field to match a value
or set of values.
recognition
In PeopleSoft Enterprise Campus Solutions, the recognition type indicates whether
the PeopleSoft Enterprise Contributor Relations donor is the primary donor of a
commitment or shares the credit for a donation. Primary donors receive hard credit that
must total 100 percent. Donors that share the credit are given soft credit. Institutions
can also define other share recognition-type values such as memo credit or vehicle
credit.
reference data
In PeopleSoft Enterprise Sales Incentive Management, system objects that represent
the sales organization, such as territories, participants, products, customers, and
channels.
reference object
In PeopleSoft Enterprise Incentive Management, this dimension-type object further
defines the business. Reference objects can have their own hierarchy (for example,
product tree, customer tree, industry tree, and geography tree).
reference transaction
In commitment control, a reference transaction is a source transaction that is
referenced by a higher-level (and usually later) source transaction, in order to
automatically reverse all or part of the referenced transaction’s budget-checked
amount. This avoids duplicate postings during the sequential entry of the transaction at
different commitment levels. For example, the amount of an encumbrance transaction
(such as a purchase order) will, when checked and recorded against a budget, cause
the system to concurrently reference and relieve all or part of the amount of a
corresponding pre-encumbrance transaction, such as a purchase requisition.
regional sourcing
In PeopleSoft Enterprise Purchasing, provides the infrastructure to maintain, display,
and select an appropriate vendor and vendor pricing structure that is based on a
regional sourcing model where the multiple ship to locations are grouped. Sourcing
may occur at a level higher than the ship to location.
relationship object
In PeopleSoft Enterprise Incentive Management, these objects further define a
compensation structure to resolve transactions by establishing associations between
compensation objects and business objects.
remote data source data
Data that is extracted from a separate database and migrated into the local database.
Copyright © 1988-2007, Oracle. All rights reserved.
Glossary
REN server
Abbreviation for real-time event notification server in PeopleSoft MultiChannel
Framework.
requester
In PeopleSoft Enterprise eSettlements, an individual who requests goods or services
and whose ID appears on the various procurement pages that reference purchase
orders.
reservations
In PeopleSoft Expenses, travel reservations that have been placed with the travel
vendor.
reversal indicator
In PeopleSoft Enterprise Campus Solutions, an indicator that denotes when a
particular payment has been reversed, usually because of insufficient funds.
RFI event
In PeopleSoft Strategic Sourcing, a request for information.
RFx event
In PeopleSoft Strategic Sourcing, a request for proposal or request for a quote event
when bidders submit their overall best bids and during which bidders do not actively
compete against one another.
role
Describes how people fit into PeopleSoft Workflow. A role is a class of users who
perform the same type of work, such as clerks or managers. Your business rules
typically specify what user role needs to do an activity.
role user
A PeopleSoft Workflow user. A person’s role user ID serves much the same purpose as
a user ID does in other parts of the system. PeopleSoft Workflow uses role user IDs
to determine how to route worklist items to users (through an email address, for
example) and to track the roles that users play in the workflow. Role users do not need
PeopleSoft user IDs.
roll up
In a tree, to roll up is to total sums based on the information hierarchy.
run control
A run control is a type of online page that is used to begin a process, such as the
batch processing of a payroll run. Run control pages generally start a program that
manipulates data.
run control ID
A unique ID to associate each user with his or her own run control table entries.
run-level context
In PeopleSoft Enterprise Incentive Management, associates a particular run (and batch
ID) with a period context and plan context. Every plan context that participates in a run
has a separate run-level context. Because a run cannot span periods, only one run-level
context is associated with each plan context.
saved bid
In PeopleSoft Strategic Sourcing, a bid that has been created but not submitted. Only
submitted bids are eligible for award.
score
In PeopleSoft Strategic Sourcing, the numerical sum of answers (percentages) to bid
factors on an event. Scores appear only to bidders on auction events.
SCP SCBM XML message
Abbreviation for Supply Chain Planning Supply Chain Business Modeler Extensible
Markup Language message. Supply Chain Business Modeler uses XML as the format
for all data that it imports and exports.
search query
You use this set of objects to pass a query string and operators to the search engine.
The search index returns a set of matching results with keys to the source documents.
search/match
In PeopleSoft Enterprise Campus Solutions and PeopleSoft Enterprise Human
Resources Management Solutions, a feature that enables you to search for and identify
duplicate records in the database.
seasonal address
In PeopleSoft Enterprise Campus Solutions, an address that recurs for the same length
of time at the same time of year each year until adjusted or deleted.
Copyright © 1988-2007, Oracle. All rights reserved.
283
Glossary
section
In PeopleSoft Enterprise Incentive Management, a collection of incentive rules that
operate on transactions of a specific type. Sections enable plans to be segmented to
process logical events in different sections.
security event
In commitment control, security events trigger security authorization checking, such
as budget entries, transfers, and adjustments; exception overrides and notifications;
and inquiries.
sell event
In PeopleSoft Strategic Sourcing, for event creators, the sale of goods or services most
typically associated with forward auctions. For bidders, the purchase of goods or
services.
serial genealogy
In PeopleSoft Enterprise Manufacturing, the ability to track the composition of a
specific, serial-controlled item.
serial in production
In PeopleSoft Enterprise Manufacturing, enables the tracing of serial information for
manufactured items. This is maintained in the Item Master record.
service impact
In PeopleSoft Enterprise Campus Solutions, the resulting action triggered by a service
indicator. For example, a service indicator that reflects nonpayment of account
balances by a student might result in a service impact that prohibits registration for
classes.
service indicator
In PeopleSoft Enterprise Campus Solutions, indicates services that may be either
withheld or provided to an individual. Negative service indicators indicate holds that
prevent the individual from receiving specified services, such as check-cashing
privileges or registration for classes. Positive service indicators designate special
services that are provided to the individual, such as front-of-line service or special
services for disabled students.
session
In PeopleSoft Enterprise Campus Solutions, time elements that subdivide a term into
multiple time periods during which classes are offered. In PeopleSoft Enterprise
Contributor Relations, a session is the means of validating gift, pledge, membership,
or adjustment data entry . It controls access to the data entered by a specific user ID.
Sessions are balanced, queued, and then posted to the institution’s financial system.
Sessions must be posted to enter a matching gift or pledge payment, to make an
adjustment, or to process giving clubs or acknowledgements.
In PeopleSoft Enterprise Learning Management, a single meeting day of an activity
(that is, the period of time between start and finish times within a day). The session
stores the specific date, location, meeting time, and instructor. Sessions are used for
scheduled training.
284
session template
In PeopleSoft Enterprise Learning Management, enables you to set up common
activity characteristics that may be reused while scheduling a PeopleSoft Enterprise
Learning Management activity—characteristics such as days of the week, start and
end times, facility and room assignments, instructors, and equipment. A session
pattern template can be attached to an activity that is being scheduled. Attaching a
template to an activity causes all of the default template information to populate
the activity session pattern.
setup relationship
In PeopleSoft Enterprise Incentive Management, a relationship object type that
associates a configuration plan with any structure node.
share driver expression
In PeopleSoft Enterprise Business Planning, a named planning method similar to a
driver expression, but which you can set up globally for shared use within a single
planning application or to be shared between multiple planning applications through
PeopleSoft Enterprise Warehouse.
short-term customer
A customer not in the system who is entered during sales order entry using a template.
Copyright © 1988-2007, Oracle. All rights reserved.
Glossary
single signon
With single signon, users can, after being authenticated by a PeopleSoft Enterprise
application server, access a second PeopleSoft Enterprise application server without
entering a user ID or password.
source key process
In PeopleSoft Enterprise Campus Solutions, a process that relates a particular
transaction to the source of the charge or financial aid. On selected pages, you can drill
down into particular charges.
source transaction
In commitment control, any transaction generated in a PeopleSoft Enterprise or
third-party application that is integrated with commitment control and which can be
checked against commitment control budgets. For example, a pre-encumbrance,
encumbrance, expenditure, recognized revenue, or collected revenue transaction.
sourcing objective
For constraints, the option to designate whether a business rule is required (mandatory)
or is only recommended (target).
speed key
See communication key.
SpeedChart
A user-defined shorthand key that designates several ChartKeys to be used for voucher
entry. Percentages can optionally be related to each ChartKey in a SpeedChart
definition.
SpeedType
A code representing a combination of ChartField values. SpeedTypes simplify the
entry of ChartFields commonly used together.
staging
A method of consolidating selected partner offerings with the offerings from the
enterprise’s other partners.
standard letter code
In PeopleSoft Enterprise Campus Solutions, a standard letter code used to identify
each letter template available for use in mail merge functions. Every letter generated in
the system must have a standard letter code identification.
statutory account
Account required by a regulatory authority for recording and reporting financial
results. In PeopleSoft Enterprise, this is equivalent to the Alternate Account
(ALTACCT) ChartField.
step
In PeopleSoft Enterprise Sales Incentive Management, a collection of sections in a
plan. Each step corresponds to a step in the job run.
storage level
In PeopleSoft Enterprise Inventory, identifies the level of a material storage location.
Material storage locations are made up of a business unit, a storage area, and a storage
level. You can set up to four storage levels.
subcustomer qualifier
A value that groups customers into a division for which you can generate detailed
history, aging, events, and profiles.
Summary ChartField
You use summary ChartFields to create summary ledgers that roll up detail amounts
based on specific detail values or on selected tree nodes. When detail values are
summarized using tree nodes, summary ChartFields must be used in the summary
ledger data record to accommodate the maximum length of a node name (20
characters).
summary ledger
An accounting feature used primarily in allocations, inquiries, and PS/nVision
reporting to store combined account balances from detail ledgers. Summary ledgers
increase speed and efficiency of reporting by eliminating the need to summarize
detail ledger balances each time a report is requested. Instead, detail balances are
summarized in a background process according to user-specified criteria and stored on
summary ledgers. The summary ledgers are then accessed directly for reporting.
summary time period
In PeopleSoft Enterprise Business Planning, any time period (other than a base time
period) that is an aggregate of other time periods, including other summary time
periods and base time periods, such as quarter and year total.
Copyright © 1988-2007, Oracle. All rights reserved.
285
Glossary
summary tree
A tree used to roll up accounts for each type of report in summary ledgers. Summary
trees enable you to define trees on trees. In a summary tree, the detail values are really
nodes on a detail tree or another summary tree (known as the basis tree). A summary
tree structure specifies the details on which the summary trees are to be built.
syndicate
To distribute a production version of the enterprise catalog to partners.
system function
In PeopleSoft Enterprise Receivables, an activity that defines how the system
generates accounting entries for the general ledger.
system source
The system source identifies the source of a transaction row in the database. For
example, a transaction that originates in PeopleSoft Enterprise Expenses contains a
system source code of BEX (Expenses Batch).
When PeopleSoft Enterprise Project Costing prices the source transaction row for
billing, the system creates a new row with a system source code of PRP (Project
Costing pricing), which represents the system source of the new row. System
source codes can identify sources that are internal or external to the PeopleSoft
Enterprise system. For example, processes that import data from Microsoft Project
into PeopleSoft Enterprise applications create transaction rows with a source code
of MSP (Microsoft Project).
286
TableSet
A means of sharing similar sets of values in control tables, where the actual data values
are different but the structure of the tables is the same.
TableSet sharing
Shared data that is stored in many tables that are based on the same TableSets. Tables
that use TableSet sharing contain the SETID field as an additional key or unique
identifier.
target currency
The value of the entry currency or currencies converted to a single currency for budget
viewing and inquiry purposes.
task
A deliverable item on the detailed sourcing plan.
tax authority
In PeopleSoft Enterprise Campus Solutions, a user-defined element that combines a
description and percentage of a tax with an account type, an item type, and a service
impact.
template
A template is HTML code associated with a web page. It defines the layout of the page
and also where to get HTML for each part of the page. In PeopleSoft Enterprise, you
use templates to build a page by combining HTML from a number of sources. For a
PeopleSoft Enterprise portal, all templates must be registered in the portal registry,
and each content reference must be assigned a template.
tenant
In PeopleSoft Real Estate Management, an entity that leases real estate from a
landlord.
territory
In PeopleSoft Enterprise Sales Incentive Management, hierarchical relationships of
business objects, including regions, products, customers, industries, and participants.
third party
A company or vendor that has extensive PeopleSoft Enterprise product knowledge
and whose products and integrations have been certified and are compatible with
PeopleSoft Enterprise applications.
tiered pricing
Enables different portions of a schedule to be priced differently from one another.
time span
A relative period, such as year-to-date or current period, that various PeopleSoft
General Ledger functions and reports can use when a rolling time frame, rather than
a specific date, is required.
total cost
In PeopleSoft Strategic Sourcing, the estimated dollar cost (sum of real price dollars
and potential “soft” or non-price dollars) of a particular award approach.
Copyright © 1988-2007, Oracle. All rights reserved.
Glossary
travel group
In PeopleSoft Expenses, the organization’s travel rules and polices that are associated
with specific business units, departments, or employees. You must define at least one
travel group when setting up the PeopleSoft Expenses travel feature. You must define
and associate at least one travel group with a travel vendor.
travel partner
In PeopleSoft Expenses, the travel vendor with which the organization has a
contractual relationship.
3C engine
Abbreviation for Communications, Checklists, and Comments engine. In PeopleSoft
Enterprise Campus Solutions, the 3C engine enables you to automate business
processes that involve additions, deletions, and updates to communications, checklists,
and comments. You define events and triggers to engage the engine, which runs
the mass change and processes the 3C records (for individuals or organizations)
immediately and automatically from within business processes.
3C group
Abbreviation for Communications, Checklists, and Comments group. In PeopleSoft
Enterprise Campus Solutions, a method of assigning or restricting access privileges. A
3C group enables you to group specific communication categories, checklist codes,
and comment categories. You can then assign the group inquiry-only access or update
access, as appropriate.
trace usage
In PeopleSoft Enterprise Manufacturing, enables the control of which components will
be traced during the manufacturing process. Serial- and lot-controlled components can
be traced. This is maintained in the Item Master record.
transaction allocation
In PeopleSoft Enterprise Incentive Management, the process of identifying the owner
of a transaction. When a raw transaction from a batch is allocated to a plan context,
the transaction is duplicated in the PeopleSoft Enterprise Incentive Management
transaction tables.
transaction state
In PeopleSoft Enterprise Incentive Management, a value assigned by an incentive
rule to a transaction. Transaction states enable sections to process only transactions
that are at a specific stage in system processing. After being successfully processed,
transactions may be promoted to the next transaction state and “picked up” by a
different section for further processing.
Translate table
A system edit table that stores codes and translate values for the miscellaneous fields in
the database that do not warrant individual edit tables of their own.
tree
The graphical hierarchy in PeopleSoft Enterprise systems that displays the relationship
between all accounting units (for example, corporate divisions, projects, reporting
groups, account numbers) and determines roll-up hierarchies.
tuition lock
In PeopleSoft Enterprise Campus Solutions, a feature in the Tuition Calculation
process that enables you to specify a point in a term after which students are charged a
minimum (or locked) fee amount. Students are charged the locked fee amount even if
they later drop classes and take less than the normal load level for that tuition charge.
unclaimed transaction
In PeopleSoft Enterprise Incentive Management, a transaction that is not claimed
by a node or participant after the allocation process has completed, usually due to
missing or incomplete data. Unclaimed transactions may be manually assigned to the
appropriate node or participant by a compensation administrator.
universal navigation header
Every PeopleSoft Enterprise portal includes the universal navigation header, intended
to appear at the top of every page as long as the user is signed on to the portal. In
addition to providing access to the standard navigation buttons (like Home, Favorites,
and signoff) the universal navigation header can also display a welcome message for
each user.
update access
In PeopleSoft Enterprise Campus Solutions, a type of security access that permits the
user to edit and update data.
Copyright © 1988-2007, Oracle. All rights reserved.
287
Glossary
See also inquiry access.
288
user interaction object
In PeopleSoft Enterprise Sales Incentive Management, used to define the reporting
components and reports that a participant can access in his or her context. All
PeopleSoft Enterprise Sales Incentive Management user interface objects and reports
are registered as user interaction objects. User interaction objects can be linked to a
compensation structure node through a compensation relationship object (individually
or as groups).
variable
In PeopleSoft Enterprise Sales Incentive Management, the intermediate results of
calculations. Variables hold the calculation results and are then inputs to other
calculations. Variables can be plan variables that persist beyond the run of an engine or
local variables that exist only during the processing of a section.
VAT exception
Abbreviation for value-added tax exception. A temporary or permanent exemption
from paying VAT that is granted to an organization. This terms refers to both VAT
exoneration and VAT suspension.
VAT exempt
Abbreviation for value-added tax exempt. Describes goods and services that are not
subject to VAT. Organizations that supply exempt goods or services are unable to
recover the related input VAT. This is also referred to as exempt without recovery.
VAT exoneration
Abbreviation for value-added tax exoneration. An organization that has been granted a
permanent exemption from paying VAT due to the nature of that organization.
VAT suspension
Abbreviation for value-added tax suspension. An organization that has been granted a
temporary exemption from paying VAT.
warehouse
A PeopleSoft Enterprise data warehouse that consists of predefined ETL maps, data
warehouse tools, and DataMart definitions.
weight or weighting
In PeopleSoft Strategic Sourcing, how important the line or question is to the
overall event. Weighting is used to score and analyze bids. For RFx and RFI events,
weightings may or may not appear to bidders.
work order
In PeopleSoft Enterprise Services Procurement, enables an enterprise to create
resource-based and deliverable-based transactions that specify the basic terms and
conditions for hiring a specific service provider. When a service provider is hired, the
service provider logs time or progress against the work order.
worker
A person who is part of the workforce; an employee or a contingent worker.
workset
A group of people and organizations that are linked together as a set. You can use
worksets to simultaneously retrieve the data for a group of people and organizations
and work with the information on a single page.
worksheet
A way of presenting data through a PeopleSoft Enterprise Business Analysis Modeler
interface that enables users to do in-depth analysis using pivoting tables, charts,
notes, and history information.
worklist
The automated to-do list that PeopleSoft Workflow creates. From the worklist, you
can directly access the pages you need to perform the next action, and then return to
the worklist for another item.
XML link
The XML Linking language enables you to insert elements into XML documents to
create a links between resources.
XML schema
An XML definition that standardizes the representation of application messages,
component interfaces, or business interlinks.
XPI
Abbreviation for eXtended Process Integrator. PeopleSoft XPI is the integration
infrastructure that enables both real-time and batch communication with JD Edwards
EnterpriseOne applications.
Copyright © 1988-2007, Oracle. All rights reserved.
Glossary
yield by operation
In PeopleSoft Enterprise Manufacturing, the ability to plan the loss of a manufactured
item on an operation-by-operation basis.
zero-rated VAT
Abbreviation for zero-rated value-added tax. A VAT transaction with a VAT code that
has a tax percent of zero. Used to track taxable VAT activity where no actual VAT
amount is charged. Organizations that supply zero-rated goods and services can still
recover the related input VAT. This is also referred to as exempt with recovery.
Copyright © 1988-2007, Oracle. All rights reserved.
289
Glossary
290
Copyright © 1988-2007, Oracle. All rights reserved.
Index
A
A dimension argument cannot be used here
(error message) 115
ABS function 139
ACE, See PeopleSoft Analytic Calculation
Engine
ACOS function 139
addition (operator) 125
additional documentation xvi
aggregate data
pushing down 80
understanding the calculation of 78
understanding the persistence of 79
aggregate functions
selecting for dimensions on data
cubes 42
understanding 48
aggregate members
creating 76
data types of 81
dimension order impact on 78
understanding 74
aggregate records
mapping to cube collections 58
properties of 80
aggregates
calculating 42
persisting 60
aggregation
example of default 84
understanding default 81
All Causes command 24
All dimension arguments must be declared
before any expression arguments are
declared (error message) 115
All Effects command 25
All Inputs command 24
#ALL predefined constant 124
All required arguments must be declared
before any optional arguments are declared
(error message) 115
ALL, selecting 80
Analytic Calculation Engine classes 8
Analytic Calculation Engine Metadata
classes 9
Copyright © 1988-2007, Oracle. All rights reserved.
analytic calculation engines 8
analytic grids
components for working with 212
creating 211
defining general properties of 220
deleting columns in 223
displaying data in 231
inserting columns in 223
inserting controls in 214
manipulating at runtime 225
manipulating columns in 222
manipulating with AnalyticGrid
classes 9
modifying layout in 212
moving columns on Layout tab 224
moving columns on Order tab 224
ordering fields in 216
populating with data 212
resizing 224
resizing controls in 214
setting analytics properties in 215
setting column properties in 224
setting label properties in 217
setting use properties in 218
understanding 211
Analytic Instance Capture Utility 245
analytic instances
capturing 245
clearing data before recalculating 207
exporting 246
importing 248
loading 53
understanding 8
viewing 229
analytic model definitions 20
See Also analytic models
creating 29
entering notes for 30
opening 29
understanding the process of
creating 27
analytic model properties 230
Analytic Model Viewer
diagnosing problems with 245
part browser 231
291
Index
part properties dialog box 231
security 230
understanding 229
using alongside PeopleSoft Application
Designer 242
viewing tree properties with 72
Analytic model with name %1 not found
(error message) 115
analytic models 15
See Also analytic model definitions
converting BAM models to 253
editing data in Analytic Model
Viewer 229
entering descriptions of 137
naming conventions for 28
understanding relationship to analytic
types 201
validating 30
viewing properties with Analytic Model
Viewer 230
viewing with Analytic Model
Viewer 232
analytic server
using log fence settings 243
analytic server instances
enabling during implementation 3
relationship to analytic calculation
engines 8
relationship to analytic instances 8
understanding 8
viewing 8
analytic types
developmental sequence of
creating 201
understanding 8
understanding relationship to analytic
models 201
understanding the process of
creating 202
AnalyticGrid classes 9
AnalyticInstance classes 8
analytics properties 215
AnalyticType classes 9
Application Designer, See PeopleSoft
Application Designer
application fundamentals xv
application server domains 8
architecture 10
ARGUMENTS declaration 140
ASC function 140
292
ASIN function 141
associated values, looking up 142
association data cubes
creating 39
example of creating 33
understanding 33
AT function 141
ATAN function 143
Attach, Data Cubes command 23
Attach, Dimensions command 23
AttachTree method
NodeName parameter of 74
setting node levels with 76
setting tree discard level with 77
understanding 72
B
BAM models
convertible parts of 254
converting 253
exporting 262
nonconvertible parts of 254
BAM total members
creating names for 48
relationship to dimension members
relationship to hierarchies 73
understanding 73
bars
docking 22
floating 22
resizing 22
understanding the behavior of 22
blank lines, inserting into rules 130
blank member references 127
blank members
creating 76
understanding 76
#BLANK predefined constant 124
blank spaces in names 28
BREAK function 143
built-in functions
ABS 139
ACOS 139
ARGUMENTS declaration 140
ASC 140
ASIN 141
AT 141
ATAN 143
BREAK 143
CASE 144
73
Copyright © 1988-2007, Oracle. All rights reserved.
Index
CHANGE 144
CHILDCOUNT 145
CHR 145
CONSOL 146
COS 146
CUBEID 147
CUMAVG 147
CUMSUM 148
DAVG 148
DAY 149
DCOUNT 150
DDB 150
DEC 151
DLOOKUP 152
DMAX 152
DMIN 153
DSUM 154
E 154
FIND 155
FIRST 155
FOR 156
FORCHILDREN 156
FORMEMBERS 157
FV 158
GROUPAVG 159
GROUPBY 160
GROUPMAX 160
GROUPMIN 161
GROUPSUM 162
GROW 163
IF 164
INC 164
INCDATE 165
INPUT 165
inserting into rules 128
INSUBTREE 166
INTERCEPT 167
IRR 167
ISINPUT 166
LEFT 168
LEN 169
LN 168
LOWER 169
MATCH 169
MAX 170
MBR2TEXT 171
MEDIAN 171
MEMBER 172
MID 173
MIN 173
Copyright © 1988-2007, Oracle. All rights reserved.
MOD 174
MONTH 174
NEXT 175
NPER 176
NPV 176
NUM2TEXT 177
NUMMEMBERS 177
OPRID 177
PARENT 179
PCT 180
PERCENTILE 180
PI 181
PMT 181
PREV 182
PREVSELF 183
PV 184
QUARTILE 184
RAND 185
RATE 185
REPLACE 186
RETURN 186
RIGHT 186
ROUND 187
SELF 187
SET 188
SIN 188
SLN 189
SLOPE 189
SQRT 191
STDEV 192
SYD 192
TAN 193
TEXT2MBR 194
TEXT2NUM 194
THIS 194
THISCUBE 195
TRUNC 196
understanding 120
understanding arguments of
UPPER 196
VAR 196
WHILE 197
YEAR 197
120
C
calculating aggregates
calculation data cubes
creating 39
understanding 33
calculations
42
293
Index
creating for groups of members 133
creating for members 131
CASE function 144
causes 44
See Also Causes and Effects Tool
displaying 45
viewing with Analytic Model
Viewer 229
Causes and Effects tool 46
See Also causes; effects
cells, viewing properties of 238
centered moving averages, creating 175
CHANGE function 144
CHILDCOUNT function 145
CHR function 145
circular formulas
changing options for handling 136
convertible options 255
nonconvertible options 255
understanding 134
Circular reference (error message) 115
circular references
direct 118
indirect 118
understanding 118
circular systems
changing options of 136
understanding 135
understanding the resolution of 135
Clone Part command 23
columns, manipulating in analytic
grids 222
Comment is not terminated (error
message) 115
comments, inserting into rules 130
comments, submitting xx
common elements xx
comparison operators 122
compound conditions 123
conditional formulas 121
conditions 121
CONSOL function 146
contact information xx
COS function 146
Could not find the user function rule with
the name %1 (error message) 117
Could not find the user function with the
name %1 (error message) 117
cross-references xix
cube collections 53
294
See Also intermediate/calculation
cube collections; presentation
cube collections; read/write cube
collections
creating 57
debugging with Analytic Model
Viewer 235
defining properties of 58
dimension properties of 54
entering notes for 30
example of 56
finding 30
mapping to records 58
naming conventions for 28
relationship to data cubes 53
setting dimension properties of 60
sorting and filtering with Analytic Model
Viewer 235
viewing dimension properties of 61
viewing in part browser 25
viewing with Analytic Model
Viewer 234
CUBEID function 147
cubes, See data cubes
CUMAVG function 147
CUMSUM function 148
Customer Connection website xvi
D
data cache
behavior of 205
clearing before recalculating 207
Data cube name is not terminated by a
single quote (error message) 115
data cubes 31
See Also association data cubes;
calculation data cubes; input data
cubes; virtual data cubes
analyzing the relationship between 190
attaching dimensions to 50
auditing at design time 43
converting 257
Date format 41
debugging with Analytic Model
Viewer 238
defining 31
defining formulas for 119
defining general properties of 40
editing formulas for 119
entering notes for 30
Copyright © 1988-2007, Oracle. All rights reserved.
Index
example of working with
dimensions 32
finding 30
formats and field definition
attributes 38
formatting 41
mapping to fields 59
Member format 41
naming conventions for 28
Number format 41
populating with data 31
referring to in rules 129
referring to one slice of 130
relationship to cube collections 53
Text format 42
understanding references of 126
using in cube collections 31
viewing in part browser 25
viewing with Analytic Model
Viewer 236
data types of aggregate members 81
database, installing during
implementation 3
Date format 41
DAVG function 148
DAY function 149
DCOUNT function 150
DDB function 150
Debugging tab 231
DEC function 151
default aggregation
example of 84
understanding 81
#DEFAULT predefined constant 124
Delete Part command 24
dependents, See effects
descriptions
entering for analytic models 137
entering for cube collections 58
Detach, Data Cubes command 24
Detach, Dimensions command 24
DetachTree method 72
detail data, persistence of 79
detail members
creating 76
understanding 74
detail nodes 74
#DETAILS predefined constant 124
details start level 76
development process 11
Copyright © 1988-2007, Oracle. All rights reserved.
dimension member references 129
dimension members
aggregate 74
blank 76
blank references of 127
creating at runtime 78
creating calculations for 131
creating calculations for groups of 133
creating from trees 76
detail 74
determining order of 78
hierarchy root 74
leaf 74
looking up values of 142
orphan 75
pushing down parent data 143
referring to in rules 129
types of 73
understanding 16, 47
understanding references of 126
understanding types of 73
dimensional fields 216
dimensions
attaching to data cubes 50
changing order in part browser 51
converting 259
creating 48
defining properties of 48
editing properties in cube
collections 60
entering notes for 30
example of working with data cubes 32
finding 30
mapping to fields 59
naming conventions for 28
order impact on calculation 78
referring to in rules 129
understanding 47
viewing in part browser 25
viewing names of 43
viewing properties in cube
collections 61
viewing properties with Analytic Model
Viewer 239
Direct Causes command 24
direct causes, understanding 44
direct circular formulas,
understanding 134
direct circular references 118
direct effects
295
Index
displaying 45
understanding 44
Direct Effects command 25
#DIRECT predefined constant 124
division (operator) 125
DLOOKUP function 152
DMAX function 152
DMIN function 153
documentation
printed xvi
related xvi
updates xvi
drag and drop
in analytic grids 9
of bars 22
of parts 25
DSUM function 154
Duplicate argument name %1 (error
message) 115
Duplicate dimensions in member references
(error message) 116
F
#FALSE predefined constant 124
field definition attributes, relationship to
data cube formats 38
fields 59
See Also dimensional fields; invisible
fields; key fields; non-dimensional
fields; non-key fields
mapping to data cubes and
dimensions 59
ordering in analytic grid 216
filter user functions
selecting 61
understanding 113
filtering
of data 113
of dimension members 114
FIND function 155
Find Part command 24
FIRST function 155
FOR function 156
FORCHILDREN function 156
forecasting, using presentation cube
collections for 56
FORMEMBERS function 157
formula bar 21
formulas 112
See Also circular formulas; conditional
formulas; direct circular formulas;
indirect circular formulas; rules
absence in virtual data cubes 42
defining 119
editing 119
in calculation data cubes 33
#FORWARD predefined constant 125
Function not allowed in this context (error
message) 116
functions, See built-in functions, filter user
functions, truth functions, user functions
Functions are nested too deeply (error
message) 116
FV function 158
E
E function 154
#E predefined constant 124
Edit menu commands 22
effects 44
See Also Causes and Effects Tool
displaying 45
viewing with Analytic Model
Viewer 229
Error in ARGUMENTS of user function
%1 (error message) 116
error messages 114, 115
explicit dimension sets
creating and editing 68
understanding 63
viewing properties of 67
explicit dimension subsets 63
explicit dimension supersets 63
explicit tuples 66
exponentiation (operator) 125
export directory 246
exportResults.txt 246
expression modifiers
converting 260
converting code in 256
296
G
general properties 220
GetData method 56
glossary 265
GROUPAVG function 159
GROUPBY function 160
Copyright © 1988-2007, Oracle. All rights reserved.
Index
Invalid constant (error message) 116
Invalid dimension %1 (error
message) 116
Invalid function %1 (error message) 116
Invalid member reference (error
message) 117
Invalid member reference syntax. Valid
syntax is [DIMENSION:Member]. (error
message) 117
Invalid number (error message) 117
invisible fields 216
IRR function 167
ISINPUT function 166
iterations
specifying the maximum number
of 137
understanding 135
GROUPMAX function 160
GROUPMIN function 161
GROUPSUM function 162
GROW function 163
H
hierarchies
creating 71
default 71
example of creating with aggregate and
detail members 109
relationship to PeopleSoft trees 71
understanding 71
hierarchy root members 74
historical trends, analyzing 190
I
IF function 164
implicit tuples 66
import maps, converting 261
importDirections.txt 246
INC function 164
INCDATE function 165
indirect causes, understanding 44
indirect circular formulas,
understanding 134
indirect circular references 118
indirect effects
displaying 45
understanding 44
input data cubes
and formulas 39
creating 38
understanding 32
INPUT function 165
inputs
displaying 45
understanding 44
viewing with Analytic Model
Viewer 229
INSUBTREE function 166
interactive reports 211
INTERCEPT function 167
intermediate/calculation cube collections
data cube types allowed in 55
understanding 55
Internal error. Uncompiled user function
reference made in the formula. (error
message) 116
Copyright © 1988-2007, Oracle. All rights reserved.
K
key fields, suggestions for mapping
60
L
label properties, setting 217
Layout tab, moving columns on 224
leaf members
creating 76
understanding 74
leaf ranges, relationship to new
members 78
LEFT function 168
LEN function 169
levels 76
LN function 168
Load method 8
log fence
PeopleSoft Analytic Calculation
Engine 243
log file 264
logical operators 123
LOWER function 169
M
main records, mapping to cube
collections 58
MATCH function 169
mathematical operators 125
MAX function 170
MBR2TEXT function
referencing blank members with
127
297
Index
understanding 171
MEDIAN function 171
Member format 41
MEMBER function 172
members, See dimension members
menu bar 21, 22
metadata
changing using PeopleCode 9
viewing with Analytic Model
Viewer 229
Metadata classes 9
MID function 173
MIN function 173
MOD function 174
Model Viewer, See Analytic Model Viewer
MONTH function 174
Move, Down command 23
Move, Up command 23
multiplication (operator) 125
NUMMEMBERS function
O
operators
comparison 122
execution order of 126
logical 123
mathematical 125
OPRID function 177
order of precedence 125
Order tab, moving columns on 224
organizers
converting 261
creating 29
entering notes for 30
naming conventions for 28
understanding 20
viewing in part browser 25
viewing properties with Analytic Model
Viewer 241
orphan members 75
output window 22
overrides
assigning to trees 84
example of creating 91
understanding 81
understanding order of precedence
in 82
viewing with Analytic Model
Viewer 229
N
#N/A predefined constant 125
names
blank spaces in 28
of total members 48
underscores in 28
viewing for dimensions 43
naming conventions 28
New, Cube Collection command 23
New, Data Cube command 23
New, Dimension command 23
New, Organizer command 23
New, User Function command 23
NEXT function 175
node levels 76
NodeName parameter 74
non-dimensional fields 216
non-key fields, mapping 60
nonalphanumeric characters 28
NONE, selecting 80
notes xix
notes bar
understanding 21
using 30
Notes Bar command 23
notes, entering 30
NPER function 176
NPV function 176
NUM2TEXT function 177
Number format 41
298
177
P
PARENT function 179
parent member data, pushing down 143
part browser
changing order of dimensions in 51
in Analytic Model Viewer 231
in PeopleSoft Application Designer 25
Part menu commands 23
part properties dialog box 231
part property editor 21
parts
converting names of 255
dragging and dropping 25
entering notes for 30
finding 30
naming conventions for 28
understanding 15
Paste Cube Name command 22
Copyright © 1988-2007, Oracle. All rights reserved.
Index
Paste Dimension command 22
Paste Function command 22
Paste Member Ref command 22
Paste User Function command 22
PCT function 180
PeopleBooks
ordering xvi
PeopleCode, typographical
conventions xviii
PeopleSoft Analytic Calculation Engine 3
See Also Analytic Calculation Engine
classes; Analytic Calculation Engine
Metadata classes; analytic calculation
engines
components of 7
development process using existing
record structures 12
development process without existing
record structures 11
implementing 3
security 12
tools for creating analytic models 20
understanding the architecture of 10
using log fence settings 243
PeopleSoft Application Designer
running PTAEACECONV from 263
using alongside Analytic Model
Viewer 242
PeopleSoft Application Engine, running
PTAEACECONV 262
PeopleSoft Application Server, configuring
during implementation 3
PeopleSoft Optimization Framework 8
PeopleSoft Performance Monitor 9
PeopleSoft Pure Internet Architecture
creating pages containing analytic
grids 211
running PTAEACECONV from 263
PeopleSoft trees
attaching to dimensions 72
detaching from dimensions 72
relationship to hierarchies 71
updating at runtime 72
viewing properties with Analytic Model
Viewer 241
PeopleTools, installing during
implementation 3
PERCENTILE function 180
Performance Monitor, See PeopleSoft
Performance Monitor
Copyright © 1988-2007, Oracle. All rights reserved.
PI function 181
#PI predefined constant 125
PIA, See PeopleSoft Pure Internet
Architecture
PMT function 181
positions, looking up values at 142
precedence 125
precedents, See causes
predefined constants 123
prerequisites xv
presentation cube collections
data cube types allowed in 56
understanding 56
PREV function 182
PREVSELF function 183
printed documentation xvi
PROBINST key field 207
PSACETREEOVRD subrecord 84
PSANALYTICSRV table, viewing analytic
server instances with 8
PTAEACECONV
examining the log file for 264
running 262
pushed down data 80
PV function 184
Q
QUARTILE function
184
R
RAND function 185
RATE function 185
Read Once record attribute 205
read/write cube collections
creating views for 12
data cube types allowed in 54
understanding 54
Readable record attribute 206
Recalculate function 36
recalculating virtual data cubes 36
records 58
See Also aggregate records; main records
relationship of attributes to data caching
behavior 205
setting reading order of 208
recursive systems
resolving 135
understanding 135
references
299
Index
inserting for dimension members 129
inserting for dimensions 129
of blank members 127
of data cubes 126
of dimension members 126
related documentation xvi
REPLACE function 186
reporting, using cube collections for 56
RETURN function 186
#REVERSE predefined constant 125
RIGHT function 186
right-click menus 23
ROOT, selecting 80
ROUND function 187
rule bar
display behavior of 114
understanding 21
Rule Bar command 23
rules 112
See Also formulas; user functions
converting code in 256
entering member references into 129
inserting blank lines into 130
inserting built-in functions into 128
inserting comments into 130
inserting user functions into 128
performing exceptions to 130
referring to data cubes in 129
referring to dimension members in 129
referring to dimensions in 129
understanding elements of 120
understanding error messages for 114
using predefined constants in 123
using values in 128
S
Scenario Managed record attribute 207
security 12
SELF function 187
Servers page 8
SET function 188
SetData method 56
Show Circular System command 25
SIN function 188
slices, referring to 130
SLN function 189
SLOPE function 189
SmartViews, See interactive reports
sorting
300
with Analytic Model Viewer 235
with PeopleSoft Application
Designer 61
spaces in names 28
SQRT function 191
status bar 22
STDEV function 192
strictly enforced method 76
sub-organizers 20
subtraction (operator) 125
suggestions, submitting xx
Summary page 8
SYD function 192
synchronization order, setting 208
Syntax error (error message) 117
syntax errors, understanding 119
T
table views, converting 260
TAN function 193
terms 265
Text format 42
Text not terminated by quote (error
message) 117
TEXT2MBR function
referencing blank members with 127
understanding 194
TEXT2NUM function 194
The ARGUMENTS declaration must
appear at the beginning of a user function
(error message) 117
The following error occurred while
preprocessing user function %1 – %2
(error message) 116
This argument has not been declared
in the ARGUMENTS section (error
message) 117
THIS function 194
THISCUBE function 195
tool bar 21
Tools menu commands 24
Total Member Name field 49
total members, See BAM total members
tree discard level 77
trees, See PeopleSoft trees
#TRUE predefined constant 125
TRUNC function 196
truth functions 122
typographical conventions xviii
Copyright © 1988-2007, Oracle. All rights reserved.
Index
U
Unbalanced parentheses (error
message) 117
Undefined data cube %1 (error
message) 117
underscores in names 28
UPPER function 196
uppercase letters 28
use properties 218
user functions 112
See Also aggregate functions; filter user
functions; formulas; rules
converting 259
converting code in 256
defining 119
editing 119
entering notes for 30
finding 30
inserting into rules 128
naming conventions for 28
viewing in part browser 25
viewing properties with Analytic Model
Viewer 241
user profiles, establishing during
implementation 4
restrictions of 36
understanding 35
visual cues xix
W
warnings xix
WHILE function 197
Writable record attribute
206
Y
YEAR function
197
V
Validate command 24
values
looking up associated 142
looking up at a position 142
looking up for members by name
persisting aggregates 60
understanding 126
using in rules 128
VAR function 196
variables
decrementing 151
incremeting 164
naming 127
referencing 127
View menu commands 23
views, creating for read/write cube
collections 12
virtual data cubes
creating 40
disabling 42
enabling 42
recalculating 36
142
Copyright © 1988-2007, Oracle. All rights reserved.
301
Index
302
Copyright © 1988-2007, Oracle. All rights reserved.