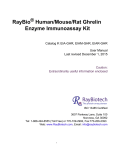
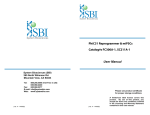
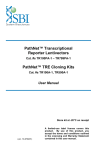
1
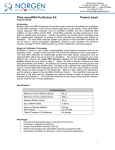
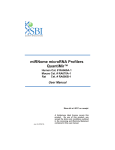
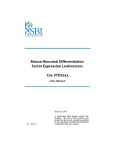
Neural Lineage qPCR Profiler with RNA-Quant™ Cat. # RA500A-1 User Manual Store kit at -20°C on receipt A limited-use label license covers this product. By use of this product, you accept the terms and conditions outlined in the Licensing and Warranty Statement contained in this user manual. Neural Lineage qPCR Profiler Cat. # RA500A-1 Contents I. Introduction and Background A. B. C. D. E. Overview Track Neural Differentiation Using qPCR Applications of SBI’s Neural Lineage Profiler List of Components Additional Required Materials 2 2 3 4 5 II. Protocol A. B. C. RT Reaction Setup Real-time qPCR Reaction Setup Details of qPCR Primer Design 6 7 9 III. Quality Control and Sample Data A. B. C. D. E. F. Neural Lineage qPCR Profiler Primer Validation……………11 Specificity for Human Genes……………………………………11 Testing of Internal Reference Controls……………………….12 Validation of General Pluripotency Markers.........................13 Validation of Lineage-Specific Markers……………………….13 Sample Data………………………………………………………..14 IV. Troubleshooting V. References 16 16 VI. Appendix A. Technical Support VII. Licensing and Warranty Statement 888-266-5066 (Toll Free) 650-968-2200 (outside US) 19 20 Page 1 System Biosciences (SBI) I. User Manual Introduction and Background A. Overview During embryonic development, pluripotent stem cells differentiate into three germ layers: ectoderm, mesoderm and endoderm [1]. These germ layers differentiate into multipotent stem cells and progenitor cells, which progress into terminally differentiated cells. For neural differentiation, cells from ectoderm differentiate into neural stem cells, neural progenitor cells and eventually terminally differentiated neurons, oligodendrocytes and astrocytes (Fig. 1). This developmental process is accompanied by highly regulated changes in gene expression [2] and expression of non-coding RNAs, such as microRNAs (miRNAs) [3, 4] and long non-coding RNAs (lncRNAs) [5]. For example, neural stem cells and precursor cells are characterized by the expression of Nestin, Sox2 and Pax6; dopaminergic neurons are characterized by the expression of tyrosine hydroxylase (TH); and astrocytes are characterized by the expression of GFAP [6, 7]. Analysis of specific cellular markers during the differentiation process is important for identifying intermediately or terminally differentiated neural cells. B. Track Neural Differentiation Using qPCR Reverse transcription quantitative polymerase chain reaction (RTqPCR) is very well suited for monitoring neural differentiation, as it allows accurate messenger RNA quantification during the differentiation process, and can also be used to monitor expression from different populations of neural cells. SBI’s Neural Lineage qPCR Profiler provides a comprehensive system for reliable and robust characterization of different stages of human neural differentiation and different populations of terminally differentiated neural cells. The system can simultaneously quantitate fold-change differences for 95 separate genes, microRNAs and lncRNAs between two or more experimental RNA samples. All of the genes were carefully curated from published Page 2 ver. 2-140820 www.systembio.com Neural Lineage qPCR Profiler Cat. # RA500A-1 literature with regards to potential roles in neural differentiation or cell-specific expression for different types of neural cells. C. Applications of SBI’s Neural Lineage qPCR Profiler 1. Testing neural differentiation from human ES/iPS cells The development of induced pluripotent stem cells (iPS cells) has changed the way neurological disorders are studied. Neural cells can be obtained through differentiation of iPS cells derived from patients with characterized neurological disorders. The Neural Lineage qPCR Profiler offers an accurate platform for characterization and validation of different neural cell types, which is important for choosing the optimal cell population for study or modeling of different neurological diseases. 2. Monitoring the formation of cerebral organoids The latest breakthrough in the field of brain development is creating cerebral organoid (“mini brains”) from either human embryonic stem cells (hESCs) or human induced pluripotent stem cells (hiPSCs) [8]. Cerebral organoids have great potential as a tool to study human brain development and neural diseases. The Neural Lineage qPCR Profiler can help to closely monitor the development and formation of cerebral organoids during the differentiation process. 888-266-5066 (Toll Free) 650-968-2200 (outside US) Page 3 System Biosciences (SBI) User Manual Fig. 1. Schematic Diagram of Neural Lineage Differentiation from Neural Stem Cells (NSCs) D. List of Components SBI’s Neural Lineage qPCR Profiler contains the following components with enough material to perform 20 RNA-Quant™ cDNA synthesis reactions and sufficient primer stock in the concentrated Primer Array plate to fully profile 10 96-well qPCR plates as outlined in this manual: 40 l 5X PolyA Polymerase Buffer 10 l Poly A Reaction 10 l PolyA Polymerase (enough for 20 reactions) 20 l 25 mM MnCl2 30 l 5 mM ATP 10 l Oligo dT Adaptor 5X Reverse Transcriptase 80 l Buffer 20 l Reverse Transcriptase 20 l RT Reaction (enough for 20 reactions) 30 l 0.1 M Dithiothreitol (DTT) 40 l dNTP Mix 30 l Random Primer Mix Array Primers, dried down Page 4 ver. 2-140820 www.systembio.com Neural Lineage qPCR Profiler Cat. # RA500A-1 in Primer plate (100 moles); resuspend in 15l RNase-free Water 1.2 ml RNase-free Water The kit is shipped on blue ice and should be stored at -20C upon arrival. Properly stored kits are stable for 1 year from the date received. The oligonucleotides for the specific target genes are dried-down in the wells of the optical qPCR plate. Resuspend in 15 µl of RNase-free water. E. Additional Required Materials Real-time qPCR Instrument Instrument-specific optical qPCR plates Thermocycler (with heated lid) 2X SYBR green Master Mix Thermocycler PCR tubes or plates for end-point reactions PCR Mastermix, including Taq polymerase for PCR 3.0-3.5% Agarose Gel in Tris-Borate EDTA (TBE) or TrisAcetate EDTA (TAE) Buffer DNA Size Ladder with markers from 50 to 2,000 bp (BioRad AmpliSize™ DNA Ladder; Cat. # 170-8200) Nuclease-Free H20 (qPCR-certified or equivalent) 888-266-5066 (Toll Free) 650-968-2200 (outside US) Page 5 System Biosciences (SBI) User Manual II. Protocol A. RT Reaction Setup (for 1 RNA sample to be assayed on 1 qPCR plate) It is important to start with total RNA that includes the small RNA fraction. For optimum signals, perform the following. Dilute your RNA to ~200 ng/l Start: In a thin-walled PCR tube or PCR-compatible plate well, combine: 5 l 2 l + 1 l 1.5 l 0.5 l 10 l STEP 1: PolyA Tail Total RNA (~1 µg) 5X PolyA Buffer 25mM MnCl2 5mM ATP PolyA Polymerase Total in tube Incubate for 30 min. at 37°C STEP 2: Anneal Anchor dT Adaptor Add: + 0.5 l Oligo dT Adaptor Heat for 5 min. at 60°C Let cool to room temp for 2 min. Add: STEP 3: Synthesize cDNAs 4 l 2 l 1.5 l + 1.5 l 1 l 20.5 l 5X RT Buffer dNTP mix 0.1M DTT Random Primer Mix Reverse Transcriptase Total in tube Incubate for 60 min. at 42°C Heat for 10 min. at 95°C * The cDNAs can be stored at -20°C. For more sensitive applications, a single phenol: chloroform extraction with ethanol precipitation can be performed on the cDNA to remove proteins, unutilized dNTPs, and primers. Typically, this is not necessary. Page 6 ver. 2-140820 www.systembio.com Neural Lineage qPCR Profiler Cat. # RA500A-1 B. Real-time qPCR Reaction Setup 1. Mastermix qPCR Reaction Setup for 1 entire 96- well qPCR plate To determine the expression profile for the target genes under study, mix the following for 1 entire qPCR plate: For 1 entire plate: + 1,810 20 1,670 3,500 l l l l 2X SYBR Green* qPCR Mastermix buffer User synthesized cDNA RNase-free water Total Aliquot 29l of Mastermix per well in your qPCR Plate. * SBI has tested and recommends SYBR Green Master mix from three vendors: 1. 2x Maxima SYBR GREEN-Fermentas 2. SYBR GreenER™ qPCR SuperMix for ABI PRISM® instrument from Invitrogen (Cat. #s 11760-100, 11760-500, and 11760-02K) 3. RT² Real-Time™ SYBR Green / ROX PCR (Cat. #s PA-012 and PA112) from SuperArray. Resuspend Primers in Primer plate with 15l RNase-free water per well before use. (The primers are dried-down in the Primer plate) Then : Load 1l per well of each of the Primers from the Primer plate into your qPCR plate (well A1 into qPCR plate A1, etc.) The Mastermix contents can be scaled up or down depending upon on your experimental needs. If you want to perform the reactions in triplicate, scale up the reactions by 3-fold and add 3X the RNA input. Or, simply follow the above recipe three times for each of the qPCR plates you want to run as replicates. Once reagents are loaded into the wells, cover the plate with an optical adhesive cover and spin briefly in a centrifuge to bring contents to bottom of wells. Place plate in the correct orientation (well A1, upper left) into the Real-time qPCR instrument and perform analysis run. 888-266-5066 (Toll Free) 650-968-2200 (outside US) Page 7 System Biosciences (SBI) User Manual Use a Multichannel pipette to load the qPCR plate with MasterMix and Primers: Pour the Mastermix into a reservoir trough and use a 8 or 12 channel pipette to load the entire 96-well qPCR plate with the Mastermix. Then load the primers from the primer plate to the qPCR plate using a separate multichannel pipette. 2. Real-time qPCR Instrument Parameters Follow the guidelines as detailed for your specific Realtime instrumentation. The following parameters tested by SBI were performed on an Applied Biosystems 7300 Realtime PCR System but can also apply to an ABI 7500 or an ABI 7900 96-well system. The details of the thermal cycling conditions used in testing at SBI are below. A screenshot from SBI’s ABI7300 Real-time instrument setup is shown below also. Default conditions are used throughout. Create a detector: Page 8 ver. 2-140820 www.systembio.com Neural Lineage qPCR Profiler Cat. # RA500A-1 Instrument Setup: qPCR cycling and data accumulation conditions: 1. 2. 3. 4. 50°C 2 min. 95°C 10 min. 95°C 15 sec. 60°C 1 min. (40 cycles of steps 3 and 4), data read at 60°C 15 sec. Step (gold rectangle) An additional recommendation is to include a melt analysis after the qPCR run to assess the Tm of the PCR amplicon to verify the specificity of the amplification reaction. Refer to the User Manual for your specific instrument to conduct the melt analysis and the data analyses of the amplification plots and Cycle Threshold (Ct) calculations. In general, Cycle thresholds should be set within the exponential phase of the amplification plots with software automatic baseline settings. C. Details of qPCR Primer Design Primers for mRNAs and lncRNAs were designed by taking the sequence from Pubmed (http://www.ncbi.nlm.nih.gov/nuccore/) representing the gene specific accession number for given target on interest. Primer3 design program (http://biotools.umassmed.edu/bioapps/primer3_www.cgi) was used to design forward and reverse primers whose amplicon size is 100 to 120 nucleotides. Each primer was checked using the genome browser website (http://genome.ucsc.edu/) to ensure that there are no significant homology to other sequences other than the gene of interest. Primers were also checked using the genome browser to ensure that it does not have any significant homology to known murine genomic sequences. 888-266-5066 (Toll Free) 650-968-2200 (outside US) Page 9 System Biosciences (SBI) User Manual For mature microRNAs whose size ranges from 19 – 24 nt, we designed primers using the exact sequence of the miRNA as the forward primer. We used the miRBase database to get the sequence of microRNA: (http://microrna.sanger.ac.uk/sequences/search.shtml). For the reverse primer to profile miRNAs, we used SBI’s proprietary universal reverse primer that primes to the adapter of the anchored oligo-dT adapter used in the RT reaction for specific and robust annealing to the polyadenylated RNA. All other genes include forward and reverse primer pairs. Fig. 2. qPCR Plate Layout of Neural Lineage Targets All 92 markers, which include mRNAs, microRNAs and lncRNAs, are chosen from published citations implicating their potential role(s) in neural stem cell self-renewal, neural development and differentiation (see Section V). The array plate also includes GAPDH, β-actin, and AluSq (more details in Section III below) as internal normalization controls. Additional details, including the associated lineage for each marker and gene accession numbers for primer design, can be found in our web-based Excel table here: http://www.systembio.com/downloads/neural-profiler-arrayanalysis_1.xlsx Page 10 ver. 2-140820 www.systembio.com Neural Lineage qPCR Profiler Cat. # RA500A-1 III. Quality Control and Sample Data A. Neural Lineage qPCR Profiler Primer Validation All primers have been validated by using RNAs from several tissues such as Human Fetal Brain, Human Adult Brain, iPSC cells, neural precursor cells and Medulla Oblongata. All primers in the assay show a single peak during our dissociation melt curve analysis. Shown below are representative peaks for several wellknown markers. B. Specificity for Human Genes We designed primers for the markers in the Neural Lineage qPCR Profiler to ensure they are specific to human genes. MicroRNAs are an exception because there is strong homology between human and mouse microRNAs. Total RNA from mouse brain tissue was converted to cDNA by the kit and marker expression 888-266-5066 (Toll Free) 650-968-2200 (outside US) Page 11 System Biosciences (SBI) User Manual was tested by qPCR. As shown below, other than microRNAs, most primers did not give any significant signal by qPCR. C. Testing of Internal Reference Controls For our reference controls we have provided primers for GAPDH, β-actin and AluSq[9]. AluSq is an Alu element belonging to the SINE family of repeats that many researchers believe are more stably expressed during the neural differentiation process than GAPDH or β-actin, thus should be considered for use as a reference control. We have included this control as an alternative to GAPDH or β-actin for normalization purposes. Specificity of Internal Controls (Melting Curve Analysis) Page 12 ver. 2-140820 www.systembio.com Neural Lineage qPCR Profiler Cat. # RA500A-1 D. Validation of General Pluripotency Markers SBI’s Neural Lineage qPCR Profiler was validated using cDNA from iPSC cells, human brain, fetal and medulla oblongata tissues. Real-time quantitative qPCR assays were performed with primers specific for known pluripotency markers OCT4, KLF4, c-MYC, and NANOG per the protocol in Section II. As expected, these markers showed relatively higher expression in iPSC cells compared to RNAs from other tissues (Fig. 3). The pluripotency markers are highly expressed in ES and iPSC cells but their expression decreases in differentiated cells [10, 11]. Fig. 3. Real-time qPCR Data for Pluripotency Markers in Various Neural Tissues and iPSC cells using Neural Profiler Array E. Validation of Lineage-Specific Markers Upon differentiation of neuronal precursor cells into various lineages, several lineage-specific markers are expressed. To validate if the primers can reliably detect lineage-specific genes, we converted cDNAs from total RNAs of iPSC cells, human brain, fetal brain, and medulla oblongata and checked the expression of all lineage-specific markers present in the array. Representative markers are shown in Fig. 4, which indicate robust induction of known lineage-specific markers as detected by SBI’s Neural Profiler Array. 888-266-5066 (Toll Free) 650-968-2200 (outside US) Page 13 System Biosciences (SBI) User Manual Fig. 4. Quantitative Analysis of Lineage-Specific Marker Expression in Neural Tissue and iPSC cells NCAM (Neural Cell Adhesion Molecule) is a Neural Precursor Marker[12] ALDOC (Aldolase C, FructoseBisphosphate) is a Marker for Astrocytes[13] miR-133b is a Marker for Dopaminergic Neurons [14] NSE (Neuron Specific Enolase) is a Marker for Oligodendrocytes [15] F. Sample Data Differentiation of Neural Stem Cells into Neurons Neural stem cells were differentiated into neurons [16]. Total RNA from iPSC cells, neural stem cells and differentiated neurons were isolated and converted into cDNA. Page 14 ver. 2-140820 www.systembio.com Neural Lineage qPCR Profiler Cat. # RA500A-1 Fig. 5. Phase Microscopy Images of Neural Stem Cells (NSCs), Differentiated Neurons, and iPSC cells Assayed for Lineage-Specific Marker Expression using Neural Profiler Array qPCR Validation of Lineage-Specific Marker Expression Fig. 6. Quantitative Analysis of Lineage-Specific Marker Expression in Neural Precursors, Differentiated Neurons, and iPSC cells SOX2 is a Neuronal Precursor Marker[17] PMP22 (Peripheral Myelin Protein) is a Schwann Cell Marker[18] SPARC1 is an Astrocyte Cell Marker[19] BFABP is a Schwann Cell Marker[20,21] miR-133b is a Marker for Dopaminergic Neurons [14] 888-266-5066 (Toll Free) 650-968-2200 (outside US) Page 15 System Biosciences (SBI) User Manual IV. Troubleshooting Problem Possible Solution Too much background in qPCR signals Use much less cDNA in the SYBR Green Mastermix. No qPCR signals 1. Did you select SYBR Green as the Detector’s Reporter Dye? 2. Did the internal controls work? 3. Use more cDNA in Mastermix. 4. Check Mastermix contents and try a subset with internal control assays. 5. Also try lowering the Annealing Temperature to 50ºC. How do I select the Threshold level for Ct analysis? Typically, place the threshold setting in the upper third of the exponential phase of the amplification curve. Also, see the User Manual for your specific instrument or contact their technical support team for guidance. V. References 1. 2. 3. Page 16 Baharvand, H., et al., Neural differentiation from human embryonic stem cells in a defined adherent culture condition. Int J Dev Biol, 2007. 51(5): p. 371-8. Pang, Z.P., et al., Induction of human neuronal cells by defined transcription factors. Nature. 476(7359): p. 220-3. Wei, H., et al., Comparative profiling of microRNA expression between neural stem cells and motor neurons in embryonic spinal cord in rat. Int J Dev Neurosci. 28(6): p. 545-51. ver. 2-140820 www.systembio.com Neural Lineage qPCR Profiler 4. 5. 6. 7. 8. 9. 10. 11. 12. 13. Cat. # RA500A-1 Yoo, A.S., et al., MicroRNA-mediated conversion of human fibroblasts to neurons. Nature. 476(7359): p. 228-31. Ng, S.Y., et al., The long noncoding RNA RMST interacts with SOX2 to regulate neurogenesis. Mol Cell. 51(3): p. 349-59. Kamphuis, W., et al., GFAP isoforms in adult mouse brain with a focus on neurogenic astrocytes and reactive astrogliosis in mouse models of Alzheimer disease. PLoS One. 7(8): p. e42823. Kuegler, P.B., et al., GFAP-independent inflammatory competence and trophic functions of astrocytes generated from murine embryonic stem cells. Glia. 60(2): p. 218-28. Lancaster, M.A., et al., Cerebral organoids model human brain development and microcephaly. Nature. 501(7467): p. 373-9. Vossaert, L., et al., Reference loci for RT-qPCR analysis of differentiating human embryonic stem cells. BMC Mol Biol. 14: p. 21. Ilieva, M. and M. Dufva, SOX2 and OCT4 mRNA-expressing cells, detected by molecular beacons, localize to the center of neurospheres during differentiation. PLoS One. 8(8): p. e73669. Qin, S. and C.L. Zhang, Role of Kruppel-like factor 4 in neurogenesis and radial neuronal migration in the developing cerebral cortex. Mol Cell Biol. 32(21): p. 4297-305. Dallerac, G., C. Rampon, and V. Doyere, NCAM function in the adult brain: lessons from mimetic peptides and therapeutic potential. Neurochem Res. 38(6): p. 1163-73. Buono, P., et al., Diverse human aldolase C gene promoter regions are required to direct specific LacZ expression in the hippocampus 888-266-5066 (Toll Free) 650-968-2200 (outside US) Page 17 System Biosciences (SBI) 14. 15. 16. 17. 18. 19. 20. 21. Page 18 User Manual and Purkinje cells of transgenic mice. FEBS Lett, 2004. 578(3): p. 337-44. Kim, J., et al., A MicroRNA feedback circuit in midbrain dopamine neurons. Science, 2007. 317(5842): p. 1220-4. Laerum, O.D., et al., Differentiation markers (S100, GFAP, NSE and D2) in fetal rat brain cells during malignant transformation in cell culture. J Neurooncol, 1985. 3(2): p. 137-46. Banda, E. and L. Grabel, Directed Differentiation of Human Embryonic Stem Cells into Neural Progenitors. Methods Mol Biol. Foshay, K.M. and G.I. Gallicano, Regulation of Sox2 by STAT3 initiates commitment to the neural precursor cell fate. Stem Cells Dev, 2008. 17(2): p. 269-78. Saberan-Djoneidi, D., et al., Molecular dissection of the Schwann cell specific promoter of the PMP22 gene. Gene, 2000. 248(1-2): p. 223-31. Singh, S.K., et al., The unique transcriptional activation domain of nuclear factor-I-X3 is critical to specifically induce marker gene expression in astrocytes. J Biol Chem. 286(9): p. 7315-26. Mita, R., et al., B-FABP-expressing radial glial cells: the malignant glioma cell of origin? Neoplasia, 2007. 9(9): p. 734-44. Bisgrove, D.A., et al., Regulation of brain fatty acid-binding protein expression by differential phosphorylation of nuclear factor I in malignant glioma cell lines. J Biol Chem, 2000. 275(39): p. 30668-76. ver. 2-140820 www.systembio.com Neural Lineage qPCR Profiler Cat. # RA500A-1 VI. Appendix A. Technical Support For more information about SBI products and to download manuals in PDF format, please visit our web site: http://www.systembio.com For additional information or technical assistance, please call or email us at: System Biosciences (SBI) 265 N. Whisman Rd. Mountain View, CA 94043 Phone: (650) 968-2200 (888) 266-5066 (Toll Free) Fax: (650) 968-2277 E-mail: General Information: [email protected] Technical Support: [email protected] Ordering Information: [email protected] 888-266-5066 (Toll Free) 650-968-2200 (outside US) Page 19 System Biosciences (SBI) User Manual VII. Licensing and Warranty Statement Limited Use License Use of the Neural Profiler Kit (i.e., the “Product”) is subject to the following terms and conditions. If the terms and conditions are not acceptable, return all components of the Product to System Biosciences (SBI) within 7 calendar days. Purchase and use of any part of the Product constitutes acceptance of the above terms. Purchase of the product does not grant any rights or license for use other than those explicitly listed in this Licensing and Warranty Statement. Use of the Product for any use other than described expressly herein may be covered by patents or subject to rights other than those mentioned. SBI disclaims any and all responsibility for injury or damage which may be caused by the failure of the buyer or any other person to use the Product in accordance with the terms and conditions outlined herein. SBI has pending patent applications related to the Product. For information concerning licenses for commercial use, contact SBI. Limited Warranty SBI warrants that the Product meets the specifications described in the accompanying Product Analysis Certificate. If it is proven to the satisfaction of SBI that the Product fails to meet these specifications, SBI will replace the Product or provide the purchaser with a refund. This limited warranty shall not extend to anyone other than the original purchaser of the Product. Notice of nonconforming products must be made to SBI within 30 days of receipt of the Product. SBI’s liability is expressly limited to replacement of Product or a refund limited to the actual purchase price. SBI’s liability does not extend to any damages arising from use or improper use of Page 20 ver. 2-140820 www.systembio.com Neural Lineage qPCR Profiler Cat. # RA500A-1 the Product, or losses associated with the use of additional materials or reagents. This limited warranty is the sole and exclusive warranty. SBI does not provide any other warranties of any kind, expressed or implied, including the merchantability or fitness of the Product for a particular purpose. SBI is committed to providing our customers with high-quality products. If you should have any questions or concerns about any SBI products, please contact us at (888) 266-5066. © 2014 System Biosciences (SBI) 888-266-5066 (Toll Free) 650-968-2200 (outside US) Page 21