1
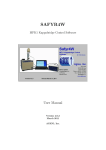
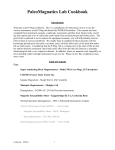
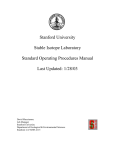
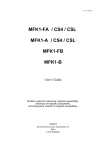
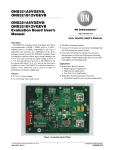
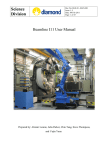
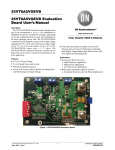
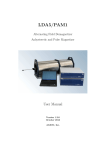
SUFYTE5W
MFK1 Thermomagnetic Curve Control Software
User Manual
Version 5.0.0
March 2011
AGICO, Inc.
Sufyte5W – User Manual
Agico, Inc.
User Manual conventions
• Mathematical equations and variable names are in Italic font
Heff =
Hpeak
√
2
• Menu items are in Slanted font
File|Open new file
• Paths, file names and keyboard shortcuts are in Courier font
Ctrl+O, Sufyte5W.exe
• User interface button names are in small caps
the new specimen button
• User interface window names and items are in Sans serif font
the New data file window, the Results frame
i
Sufyte5W – User Manual
Agico, Inc.
ii
Sufyte5W – User Manual
Agico, Inc.
Contents
1 Introduction
1
2 Installing and running Sufyte5W
2.1 System requirements . . . . . .
2.2 Installing Sufyte5W . . . . . . .
2.3 Uninstalling Sufyte5W . . . . .
2.4 Starting Sufyte5W . . . . . . .
3
3
3
3
3
.
.
.
.
.
.
.
.
.
.
.
.
.
.
.
.
.
.
.
.
.
.
.
.
.
.
.
.
.
.
.
.
.
.
.
.
.
.
.
.
.
.
.
.
.
.
.
.
.
.
.
.
.
.
.
.
.
.
.
.
.
.
.
.
.
.
.
.
3 Instrument initialization
5
4 Calibration
9
5 Settings
5.1 Temperature mode .
5.2 Temperature range .
5.3 Temperature rate . .
5.4 Field intensity . . . .
5.5 Operating frequency
5.6 Repeated heating . .
.
.
.
.
.
.
.
.
.
.
.
.
.
.
.
.
.
.
.
.
.
.
.
.
.
.
.
.
.
.
.
.
.
.
.
.
.
.
.
.
.
.
.
.
.
.
.
.
.
.
.
.
.
.
.
.
.
.
.
.
.
.
.
.
.
.
.
.
.
.
.
.
.
.
.
.
.
.
.
.
.
.
.
.
.
.
.
.
.
.
.
.
.
.
.
.
.
.
.
.
.
.
.
.
.
.
.
.
.
.
.
.
.
.
.
.
.
.
.
.
11
12
12
13
15
16
16
6 Measurements
6.1 Low temperature mode . . .
6.1.1 Opening data file . .
6.1.2 Cooling the specimen
6.1.3 Measurement . . . .
6.2 High temperature mode . .
6.2.1 Opening data file . .
6.2.2 Measurement . . . .
.
.
.
.
.
.
.
.
.
.
.
.
.
.
.
.
.
.
.
.
.
.
.
.
.
.
.
.
.
.
.
.
.
.
.
.
.
.
.
.
.
.
.
.
.
.
.
.
.
.
.
.
.
.
.
.
.
.
.
.
.
.
.
.
.
.
.
.
.
.
.
.
.
.
.
.
.
.
.
.
.
.
.
.
.
.
.
.
.
.
.
.
.
.
.
.
.
.
.
.
.
.
.
.
.
.
.
.
.
.
.
.
.
.
.
.
.
.
.
.
.
.
.
.
.
.
.
.
.
.
.
.
.
17
17
17
18
19
19
19
20
.
.
.
.
.
.
.
.
.
.
.
.
.
.
.
.
.
.
7 References
23
iii
Sufyte5W – User Manual
Agico, Inc.
iv
Sufyte5W – User Manual
1
Agico, Inc.
Introduction
Sufyte5W is a Microsoft Windows instrument control software for measurement of temperature variation of magnetic susceptibility (thermomagnetic
curves) using the Agico MFK1-FA/A Kappabridge in conjunction with the
CS4/CSL high/low temperature control unit 1 . The software is an updated
and improved version of the Microsoft DOS Sufyte42 software (and previous versions). While all features of Sufyte42 were retained, Sufyte5W additionally provides a user-friendly graphical interface enabling easy instrument
control and instant visualization of the acquired data.
The main features of Sufyte5W include measurements of magnetic susceptibility as a function of temperature in variable fields and, depending upon
the Kappabridge model, at one (MFK1-A) or three (MFK1-FA) operating
frequencies. Depending upon your CS model, magnetic susceptibility can be
measured in the following temperature modes:
• CSL: Low temperature mode (−192 ◦ C to room temperature)
• CS4: High temperature mode (room temperature to 700 ◦ C)
Acquired data are stored in the ASCII text files which can be further processed using Cureval software of Agico (available at www.agico.com).
1
For details concerning instrument specification, operation and maintenance please
refer to “MFK1 User’s Guide” and “Apparatus CS4/CSL User’s Manual” by Agico, Inc.
(available at www.agico.com)
1
Sufyte5W – User Manual
Agico, Inc.
2
Sufyte5W – User Manual
2
Agico, Inc.
Installing and running Sufyte5W
2.1
System requirements
Sufyte5W requires that your computer has Microsoft Windows operating
system installed (Windows 98 up to Windows 7). Please note that the appearance of the user interface may vary according to the default settings of
the respective version of operating systems.
2.2
Installing Sufyte5W
Installation is very straightforward and consists of several easy steps (you
can navigate a step forward or backward by clicking on the Next or Back
buttons):
1. Run the installation wizard Sufyte5W-Setup.exe by double-clicking
on the file name. The Setup - Sufyte5W window appears (Fig. 1).
2. Select the installation directory (Fig. 2). It is recommended to keep the
default directory (C:\Program Files\Sufyte5W) as set by the installation wizard.
3. Choose the Start Menu Folder name.
4. Choose whether you want to create a desktop icon.
5. After making/revising your preferences start the installation by clicking
on the install button (Fig. 3).
6. During installation a default working directory (C:\MFKData) is created. Finish the installation by clicking on the finish button (Fig. 4).
2.3
Uninstalling Sufyte5W
To remove Sufyte5W from your computer, select the Uninstall Sufyte5W
item in the Start|Programs|Sufyte5W menu option. All program files, desktop icons, and shortcuts will be deleted. Note that any data files stored in
default working directory will not be removed.
2.4
Starting Sufyte5W
Sufyte5W can be started by a double-click on the respective desktop icon
or by clicking on the Sufyte5W item in the Start|Programs|Sufyte5W Start
menu of the operating system.
3
Sufyte5W – User Manual
Agico, Inc.
Figure 1: Installation wizard.
Figure 2: Installation directory.
Figure 3: Revising installation preferences.
Figure 4: Completing the installation.
4
Sufyte5W – User Manual
3
Agico, Inc.
Instrument initialization
Before performing any measurement the instrument must be initialized. Prior
to initialization you must do the following (see “Apparatus CS4/CSL User’s
Manual” for details).
1. Check whether the Thermometer is connected to the Kappabridge Pick
Up Unit via the 15-pin connector (the same connector which is used
to connect the Rotator for the automatic anisotropy measurements).
Note that the Kappabridge must be switched OFF when you connect/disconnect the Thermometer (or the Rotator)!
2. Check whether the Kappabridge is connected to the computer via serial
port or the USB/serial adapter.
3. Install the Cryostat/Furnace, for the low or high temperature modes,
respectively.
• Cryostat: Install the Cryostat and connect its cable into the
9-pin connector of the MFK1 Pick Up Unit.
• Furnace: Install the Furnace. Note that the Furnace is an integral part of the CS4 system and its heating wires and water
cooling system are firmly connected to the MFK1 Pick Up Unit.
4. Switch ON the Kappabridge and CS4 Unit.
The initialization is started by clicking on the initialize button in the
control panel (keyboard shortcut: Ctrl+Ins). Initialization routine is monitored in the Instrument initialization window (Fig. 5), result of each initialization step is displayed and successfully completed steps are highlighted in
green. The initialization routine consist of the following steps:
1. Searching for instrument connection via serial port.
2. Testing firmware version.
3. Listing the maximum field intensities for each operating frequency.
4. Setting auto ranging.
5. Setting default operating frequency (i.e. F1 = 976 Hz).
6. Setting default field intensity (i.e. 200 A/m).
5
Sufyte5W – User Manual
Agico, Inc.
7. Testing the Up/Down mechanism. Duration of the Up movement is
displayed.
8. Zeroing the instrument.
9. Activating CS4 Unit.
According to whether the Cryostat or the Furnace is connected the
instrument was activated in the Low or High temperature mode, respectively. To indicate the current temperature mode the status bar is
highlighted in blue or red for Low or High temperature modes, respectively. You may switch between the Low and High temperature modes
prior to start of each thermomagnetic curve (see page 12).
10. Testing temperature sensor. Actual temperature is displayed.
11. Testing water cooling system. The water flow is displayed (high temperature measurements only).
Figure 5: Instrument initialization window.
After successful initialization press ok to start a 10 min countdown necessary for the stabilization of the instrument coils. You can reduce the
6
Sufyte5W – User Manual
Agico, Inc.
stabilization time by clicking on the reduce waiting time button (each
click reduces waiting time by one min, not recommended!)
User interface consists of the main window (Fig. 6) and several auxiliary
windows. The main window includes:
1. Caption contains the name of the currently opened data file.
2. Data table contains data of the currently measured thermomagnetic
curve in numerical form.
3. Data plot displays a graph of the currently measured thermomagnetic
curve with graph properties panel.
4. Current state bar displays the current state of the instrument i.e. actual specimen temperature, and in the high temperature mode, heating
current and voltage, water flow of the cooling system.
5. Instruction bar displays the instructions for the operator (e.g. during
filling of liquid nitrogen).
6. Control panel contains the command buttons for controlling the instrument.
7. Status bar displays the currently executed action and current setting
of the instrument.
7
Sufyte5W – User Manual
Agico, Inc.
8
Figure 6: Sufyte5W main window.
Sufyte5W – User Manual
4
Agico, Inc.
Calibration
After successful initialization of Sufyte5W the instrument should be calibrated. If the instrument was never calibrated or the calibration is out of
date (30 days or older), you will be prompted to calibrate when trying to
start a new measurement. The instrument should be always calibrated when
the operating frequency is changed.
Calibration routine (Fig. 7) can be accessed by clicking on the calibration button in the control panel of the main window. Prior to the calibration, check the nominal value of the calibration standard (the higher value
marked on the calibration standard)2 . To set/change the calibration standard nominal value, click on the change button. To enable value change
press the change button, to save new values hit ok; clicking on cancel
will retain the previous calibration standard values.
Figure 7: Calibration routine window.
Fix the calibration standard into the manual holder for cylindric specimens with the cylinder axis oriented vertically. Start the calibration routine by pressing the start button. The calibration routine consists of one
measurement of total susceptibility. In the case of emergency, the calibration routine can be stopped anytime by pressing the stop button (Space
Bar). Note that for the purpose of the calibration the field intensity is set to
200 A/m; when finished the field intensity is reset back to its original value.
2
Calibration standard nominal value is stored in the configuration file from the last
calibration. With the purchase of a new instrument, calibration standard nominal value
is set by Agico technician during the instrument installation.
9
Sufyte5W – User Manual
Agico, Inc.
After calibration, the new calibration constant—Gain Bulk—is calculated. Gain Bulk is the correction applied to the total susceptibility. Successful calibration can be saved by pressing the save button; clicking on
cancel will retain the previous calibration constant.
10
Sufyte5W – User Manual
5
Agico, Inc.
Settings
After successful initialization, the instrument settings will be enabled. The
Settings window (Fig. 8) can be accessed by clicking on the settings button
in the control panel. According to your needs you are able to set (each item
is discussed below):
• Temperature mode
• Temperature range
• Temperature rate
• Field intensity
• Operating frequency
• Repeated heating (available as special option only)
Figure 8: Instrument settings window.
To apply the settings click ok; clicking on cancel will retain the previous
settings. There is a 30 s timeout before the Settings window is automatically
closed.
Note that some settings are still accessible when the actual measurement
of thermomagnetic curve is running. During the measurement time you may
modify the Temperature range, Temperature rate, and, optionally, the
Repeated heating parameters.
11
Sufyte5W – User Manual
5.1
Agico, Inc.
Temperature mode
During the initialization the instrument was activated in the Low or High
temperature mode according to whether the Cryostat or the Furnace was
connected, respectively. You can switch between the Low and High temperature modes prior to the start of each thermomagnetic curve. This option
may be useful if you want to measure the same specimen in both Low and
High temperature ranges.
• Low temperature (Cryostat): Temperature variation of magnetic susceptibility in the low temperature range (−192 ◦ C to the room temperature) using the Cryostat.
• High temperature (Furnace): Temperature variation of magnetic susceptibility in the high temperature range (the room temperature up to
700 ◦ C and back to the room temperature) using the Furnace in conjunction with the water cooling system.
Switching between the Low and High temperature modes can be executed as
follows.
1. Select the desired temperature mode and hit ok.
2. The instrument is deactivated.
3. Install (and connect) the Furnace/Cryostat and hit ok.
4. The instrument is activated again in the respective Low or High temperature mode according to whether the Cryostat or the Furnace is
connected.
5.2
Temperature range
Limits of the temperature ranges have slightly different meanings in the Low
and High temperature modes.
• Low temperature mode. Prior to the measurement of a thermomagnetic curve, the specimen is cooled down to the temperature of liquid
nitrogen (approx. −196 ◦ C). The specimen is then heated spontaneously
to the room temperature. Magnetic susceptibility is measured approx.
every 20 s in the temperature interval between the minimum and maximum temperatures.
12
Sufyte5W – User Manual
Agico, Inc.
– Tmin is the temperature threshold for the start of measurement;
the measurement can be started as soon as the actual specimen
temperature gets higher than Tmin (−192 to 0 ◦ C).
– Tmax is the temperature threshold for the termination of measurement; the thermomagnetic curve is terminated when the actual specimen temperature gets higher than Tmax (0 to 25 ◦ C).
• High temperature mode. During one measurement cycle, the specimen is heated from the room temperature up to the desired maximum
temperature and then cooled down to the desired minimum temperature while magnetic susceptibility is measured approx. every 20 s.
– Tmax is the temperature threshold for the heating of the specimen; the heating is stopped when the actual specimen temperature gets higher than Tmax (90 to 700 ◦ C).
– Linger at Tmax is the time during which the maximum temperature is maintained before the specimen is cooled down (0 to 20
min).
– Tmin is the temperature threshold for the termination of measurement cycle; the measurement cycle terminates when the actual
specimen temperature drops below Tmin (40 to 100 ◦ C).
5.3
Temperature rate
Settings of the temperature rate depends on the selected temperature mode.
• Low temperature mode. The specimen is heated spontaneously
from the temperature of liquid nitrogen up to the desired maximum
temperature. The heating rate cannot be set manually and the Temperature rate option is disabled in the Settings window.
The actual heating rate is proportional to the temperature difference
between the actual specimen temperature and the room temperature.
The heating rate is therefore relatively fast in the beginning, slowing
down towards the room temperature (see Fig. 9). Spontaneous heating
from the temperature of liquid nitrogen up to 25 ◦ C takes almost 2 21 hr
(depending on the actual room temperature). In order to speed up the
measurement you may set the maximum temperature lower than the
room temperature (see Table 1 for approximate duration of measurements).
13
Sufyte5W – User Manual
Agico, Inc.
50
0
T [°C]
-50
-100
-150
-200
0
30
60
90
120
150
180
t [min]
Figure 9: Specimen temperature as a function of time during spontaneous
heating in the Low temperature mode (room temperature was approx. 25 ◦ C).
Tmax Duration
0 ◦C
1:00 hr.
◦
5 C
1:10 hr.
10 ◦ C
1:15 hr.
◦
15 C
1:25 hr.
◦
20 C
1:45 hr.
Table 1: Approximate duration of the low temperature measurements according to the maximum desired temperature (room temperature was approx. 25 ◦ C)..
• High temperature mode. The specimen is heated at controlled rate
to the maximum temperature and then cooled down at the same controlled rate to the minimum temperature. There are four temperature
rates available (Fig. 10).
Default temperature rate (Fast) is suitable for most rocks and environmental materials (heating up to 700 ◦ C and cooling down to 40 ◦ C
takes ca. 1 43 hr., temperature increase/decrease between individual
measurements is about 5 ◦ C). For special studies, slower temperature
rates (Slow, Medium) can be used but one must realize that such measurements take correspondingly longer time (see Table 2). To speed
up the measurement you may use the Extra fast temperature rate
(ca. 42 ◦ C/min). It has to be kept in mind that there is a certain thermal inertia of the specimen and the heating rate must be slowed down
(ca. 9 ◦ C/min) when approaching the desired maximum temperature.
14
Sufyte5W – User Manual
Agico, Inc.
The Change rate temperature is set automatically or manually; it
should be at least 30 ◦ C below the desired maximum temperature.
Extra fast Fast Medium Slow
800
700
600
T [°C]
500
400
300
200
100
0
0
30
60
90
120
150
180
t [min]
Figure 10: Specimen temperature as a function of time for four available
high temperature rates.
Temperature rate
Slow
Medium
Fast
Extra fast
(Slowed-down rate)
8.6 C/min
11.8 ◦ C/min
13.7 ◦ C/min
42.5 ◦ C/min
(9.4 ◦ C/min)
◦
Cycle duration
2:45 hr.
2:00 hr.
1:45 hr.
1:00 hr.
Table 2: High temperature rates together with approximate duration of a
standard measurement cycle (from the room temperature up to 700 ◦ C and
down to 40 ◦ C). Default heating rate is highlighted in gray.
5.4
Field intensity
Field intensity can be set in A/m in peak values, Hpeak . Field intensity
ranges vary according to the operating frequency (see below). Default field
intensity is the maximum field common to all three operating frequencies,
Hpeak = 200 A/m.
Note that with the KLY series of Kappabridges, the field intensity was expressed in terms
Hpeak
. To set the same field intensity
of root mean square (rms) or effective value, Heff = √
2
using the MFK instrument you have to set Hpeak = 425 A/m. This may be useful if you
want to compare the previously acquired data with new measurements.
15
Sufyte5W – User Manual
5.5
Agico, Inc.
Operating frequency
There are one or three operating frequencies (depending upon the instrument
model):
• F1
976 Hz <2–700 A/m>
• F2 3904 Hz <2–350 A/m> (FA and FB models only)
• F3 15616 Hz <2–200 A/m> (FA and FB models only)
Note that the default field intensity (Hpeak = 200 A/m) is reset any time you
change the operating frequency. Changing the operating frequency requires
some execution time, after frequency change you will be prompted to wait
at least 10 min to stabilize the instrument coils.
5.6
Repeated heating
Repeated heating option is available in the high temperature mode and only
upon the special settings in the configuration file. The specimen is subjected to several heating/cooling cycles with progressively increasing maximum temperature. The repeated heating procedure can be useful e.g. as the
paleotemperature indicator [1].
To enable the repeated heating options check the Repeated heating check
box in the Settings window. Input the Number of heating cycles (max. 9)
and the Increment of Tmax for next cycle (10–500 ◦ C). The actual repeated
heating procedure is performed as follows.
1. The specimen is heated up to the maximum temperature and cooled
down to the minimum temperature.
2. The maximum temperature is increased by the temperature increment.
3. The specimen is heated up to the increased maximum temperature and
cooled down to the minimum temperature.
4. The routine is repeated until the desired number of heating/cooling
cycles is measured or the maximum temperature gets over 700 ◦ C.
16
Sufyte5W – User Manual
6
Agico, Inc.
Measurements
After instrument initialization, calibration and settings the actual measurement of thermomagnetic curves may begin. The measuring procedures differ
slightly in the Low or High temperature modes.
6.1
Low temperature mode
Measurements in the Low temperature mode consist of the following steps:
1. Opening data file.
2. Cooling the specimen (filling liquid nitrogen, waiting for required temperature and applying argon).
3. Measurement of thermomagnetic curve during spontaneous heating to
the desired maximum temperature.
6.1.1
Opening data file
Before the measurement you must open a file to store the acquired data. To
open new data file, click on the new specimen button in the control panel.
In the New data file dialog, input the file name and its directory, click open
when finished. Each thermomagnetic curve is stored in a separate data file
(extension *.clw); if you select already existing file you must confirm whether
you want to overwrite it.
In the Specimen type window select whether you measure:
• Specimen: Specimen is measured.
– Name of currently used empty cryostat: Optionally, you may
input the name of the file containing the respective empty cryostat thermomagnetic curve (it must be in the same directory as
the specimen data file). This thermomagnetic curve will be preferentially offered for the empty cryostat correction during the postprocessing using Cureval software. Note that you may use the
same empty cryostat thermomagnetic curve for many specimens
so it is not necessary to measure the empty cryostat before each
specimen.
• Empty Cryostat: Empty cryostat thermomagnetic curve is measured.
After pressing ok a new data file is created and its name is displayed in the
caption of the main window.
17
Sufyte5W – User Manual
6.1.2
Agico, Inc.
Cooling the specimen
After opening a data file you will be prompted to fill liquid nitrogen to
cool the specimen down. Follow the flashing instructions in the Instruction
bar of the main window. Actual specimen temperature is displayed in the
Current state bar. According to the actual specimen temperature the cooling
procedure consists of the following steps:
1. Wait for required temperature - Fill SLOWLY liquid nitrogen
Actual specimen temperature is higher than desired minimum temperature. Slowly fill liquid nitrogen until the Cryostat is half-full. Wait as
the specimen cools down.
2. Wait for required temperature
Actual specimen temperature is approaching the desired minimum temperature. Wait as the specimen cools down.
3. Be ready to apply argon
(accompanied by three short beeps)
Actual specimen temperature gets below the desired minimum temperature. Make the argon blow gun ready to flush out liquid nitrogen.
4. Apply argon → Start measurement
(accompanied by five short beeps)
Actual specimen temperature gets approx. 2.4 ◦ C below the minimum
temperature. Apply argon to flush out liquid nitrogen. When done,
start the measurement by clicking on the start button (Enter).
5. Start measurement
(accompanied by a longer beep)
Actual specimen temperature starts to increase after liquid nitrogen
has been flushed out. Start the measurement immediately by clicking
on the start button (Enter).
Note: If you do not start the measurement immediately, the actual
specimen temperature increases very fast above the desired minimum
temperature. You will be prompted to fill liquid nitrogen again to cool
the specimen down.
18
Sufyte5W – User Manual
6.1.3
Agico, Inc.
Measurement
The measurement of thermomagnetic curve is started by pressing the start
button (Enter). Magnetic susceptibility is automatically measured approx.
every 20 s as the specimen is spontaneously heated. After each measuring
step, the results are displayed in the Data table and appended into the
currently opened data file.
Additionally, a graph depicting magnetic susceptibility as a function of
temperature (k(T ) curve) is drawn in the Data plot area. The graph can be
customized by clicking on the arrow located in the right upper corner of the
Data plot area (Fig. 6). Drawing a rectangle (left mouse button pressed)
will enlarge the enclosed area; a mouse click in the Data plot area will restore
a full view. Upper bar in the Data plot area displays current cursor position.
The instrument primarily measures the total susceptibility that is independent of the
specimen volume [2]. The total susceptibility is defined as the induced magnetic moment
of the specimen divided by the nominal volume of the instrument (being 10 cm3 for MFK1
Kappabridge). The bulk/mass susceptibility can be calculated after correction for empty
cryostat using post-processing Cureval software (available at www.agico.com).
In the case of emergency, the measuring procedure can be stopped anytime by pressing the stop button (Space bar).
The thermomagnetic curve is terminated when the actual specimen temperature gets higher than the desired maximum temperature. A message box
displaying termination time and measurement duration appears. In addition,
you will be notified by a ring tone.
When the curve is finished, you may start measuring another specimen.
After opening new data file, the Data table, and the Data plot are cleared.
6.2
High temperature mode
Measurements in the High temperature mode consist of the following steps:
1. Opening data file.
2. Measurement of thermomagnetic curve during controlled heating and
cooling of the specimen.
6.2.1
Opening data file
Before the measurement you must open a file to store the acquired data. To
open new data file, click on the new specimen button in the control panel.
19
Sufyte5W – User Manual
Agico, Inc.
In the New data file dialog, input the file name and its directory, click open
when finished. Each thermomagnetic curve is stored in a separate data file
(extension *.cur); if you select already existing file you must confirm whether
you want to overwrite it.
In the Specimen type window select whether you measure:
• Specimen: Specimen is measured.
– Name of currently used empty furnace: Optionally, you may
input the name of the file containing the respective empty furnace
thermomagnetic curve (it must be in the same directory as the
specimen data file). This thermomagnetic curve will be preferentially offered for the empty furnace correction during the postprocessing using Cureval software. Note that you may use the
same empty furnace thermomagnetic curve for many specimens
so it is not necessary to measure the empty furnace before each
specimen.
• Empty Furnace: Empty furnace thermomagnetic curve is measured.
After pressing ok a new data file is created and its name is displayed in the
caption of the main window.
6.2.2
Measurement
The measurement of thermomagnetic curve is started by pressing the start
button (Enter). Magnetic susceptibility is automatically measured approx.
every 20 s as the specimen is heated up to the desired maximum temperature
and cooled down to the desired minimum temperature. After each measuring
step, the results are displayed in the Data table and appended into the
currently opened data file.
Additionally, a graph depicting magnetic susceptibility as a function of
temperature (k(T ) curve) is drawn in the Data plot area. The graph can be
customized by clicking on the arrow located in the right upper corner of the
Data plot area (Fig. 6). Drawing a rectangle (left mouse button pressed)
will enlarge the enclosed area; a mouse click in the Data plot area will restore
a full view. Upper bar in the Data plot area displays current cursor position.
The instrument primarily measures the total susceptibility that is independent of the
specimen volume [2]. The total susceptibility is defined as the induced magnetic moment
of the specimen divided by the nominal volume of the instrument (being 10 cm3 for MFK1
Kappabridge). The bulk/mass susceptibility can be calculated after correction for empty
furnace using post-processing Cureval software (available at www.agico.com).
20
Sufyte5W – User Manual
Agico, Inc.
In the case of emergency, the measuring procedure can be stopped anytime by pressing the stop button (Space bar). Note that after the measurement is stopped, the temperature inside the furnace may be very high!
You will be warned by flashing bar
Wait – Temperature is too high!
Caution must be paid when opening the furnace. The furnace temperature spontaneously decreases towards room temperature. Warning is stopped
when the temperature drops below 100 ◦ C.
The thermomagnetic curve is terminated when the actual specimen temperature gets below the desired minimum temperature. A message box displaying termination time and measurement duration appears. In addition,
you will be notified by a ring tone.
When the curve is finished, you may start measuring another specimen.
After opening new data file, the Data table, and the Data plot are cleared.
21
Sufyte5W – User Manual
Agico, Inc.
22
Sufyte5W – User Manual
7
Agico, Inc.
References
[1] F. Hrouda, P. Müller, and J. Hanak. Repeated progressive heating in
susceptibility vs. temperature investigation: a new palaeotemperature
indicator? Physics and Chemistry of the Earth, 28:653–657, 2003.
[2] V. Jelı́nek. The statistical theory of measuring anisotropy of magnetic
susceptibility of rocks and its application. Geofyzika, Brno, (available at
www.agico.com), 1977.
23