1
A.K. Hartmann: Practical Guide to Computer Simulations
0
10
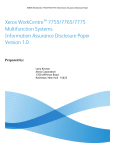
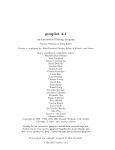
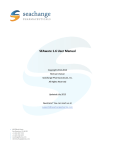
Fisher-Tippett
distribution
-1
10
-2
P(x)
86
10
10
-3
0.8
0.6
-4
10
0.4
0.2
0
-5
10 0
0
1
1
2
3
2
4
5
3
6
x
7
4
5
6
7
6. Chi-squared test
Design, implement and test a function, which
SOLUTION SOURCE CODE
calculates the χ2 test statistics for two hisDIR: randomness
tograms {hi }, {ĥi } according Eq. (7.69). The
FILE(S): chi2hh.c
function should return the p-value, i.e. the
cumulative probability (“p-value”) that a value of χ2 or larger is obtained under
the assumption that the two histograms were obtained by sampling from the
same (discrete) random variable.
The function prototype reads as follows:
/********************* chi2_hh() ***********************/
/** For chi^2 test: comparison of two histograms
**/
/** to probabilities: Probability to
**/
/** obtain the corresponding chi2 value or worse.
**/
/** It is assumed that the total number of data points**/
/*+ in the two histograms is equal !
**/
/**
**/
/** Parameters: (*) = return parameter
**/
/** n_bins: number of bins
**/
/**
h: array of histogram values
**/
/**
h2: 2nd array of histogram values
**/
/**
**/
/** Returns:
**/
/**
p-value
**/
/*******************************************************/
double chi2_hh(int n_bins, int *h, int *h2)
Hints: Use the functio chi2_hd() as example. Include a test, which verifies that
the total number of counts in the two histograms agree.
To test the function: Generate two histograms according to a binomial distribution with parameters n = par_n= 10 and p = 0.5 or p = par_p. Perform a


![reply_card [Converted] - TheMysticHelming.mono.net](http://vs1.manualzilla.com/store/data/005649301_1-3a046a309a634867449ff92cdd957a65-150x150.png)