1
Spectre Tutorial
•
•
•
•
More Docs
Spectre will be used for transistor level simulation
To place on path,do: ‘swsetup cadence-ncsu’
Use online help or PDF docs at ~reese/cadence_docs
Documentation
–
–
–
–
• Appendix D of Verilog-A reference gives a pre-defined
library of Analog Component library
• Source code for these models are at:
/opt/ecad/cadence/v4.45/ic_4.45qsr2/tools/dfII/samples/artist/ahdlLib/
Spectre User Manual – most helpful for first time users
Spectre Reference Manual – details on all available statements
Verilog-A Reference Manual – details on Verilog-A language
Spectre HDL – details Spectre HDL, a proprietary HDL. Has been
largely replaced by standard languages such as Verilog-A.
However, Analog library model detailed in Verilog-A reference
manual is written in Spectre HDL
BR 8/02
For model details, look at source code for a model under:
model_name/ahdl/ahdl.def
(e.g., delta_probe/ahdl/ahdl.def)
Note: These models are written in Spectre HDL.
1
Spectre
BR 8/02
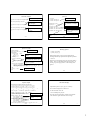
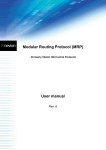
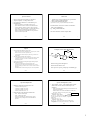
Example: Power, Delay Measurement
• Spectre accepts either SPICE or Spectre syntax
Pmtr
– Spectre syntax less restrictive than SPICE (I.e., in Spectre syntax, element
names do not have to start with a particular letter)
– In my files,will mix SPICE and Spectre syntax freely just because I am
used to SPICE
1x
Vdd
• The ‘awd’ program is used to view waveforms
– Verilog-A can be called like sub-circuits from Spectre files
– I will use Verilog-A for things like measurements because it is easier,
faster than popping up a waveform viewer. Will use waveform viewer for
debugging.
– Predefined models in Affirma Analog Library are written in SpectreHDL
3
Spectre Example Files
Measure average power through DUT
Measure TPLH, TPHL of DUT.
Grab zip archive ‘spectre_example.zip’ from WWW page
BR 8/02
4
Spectre Example Files (cont)
• ‘def.m’ defines ‘N_def’, ‘P_def’ models which calculate
default values for AS, AD, PS, PD based upon L, W
parameters
• BSIM3V3 Model files from http://mosis.com
ami06.m for AMI 0.6u process
tsmc025.m for TSMC 0.25 process
tsmc018.m for TSMC 0.18 process
Transistor model names are ‘N’, ‘P’.
– Handy if just testing pre-layout designs (extracted transistors will
always have these values).
– Default values for AS,AD, PS, PD in BSIM3V3 model is zero –
this is bad – always use non-zero geometry values.
• Parameters lmin, wmin have been added to files:
subckt N_def (d g s b)
‘def.m’
parameters L=lmin W=wmin
M0 (d g s b) N w=W l=L as=(W*1.5e-6) ad=(W*1.5e-6) \
ps=((2*1.5e-6)+W) pd=((2*1.5e-6)+W) region=sat
ends N_def
– Lmin – minimum channel length
– Wmin – minimum gate width
– Specify L,W parameters for transistors in terms of these
parameters and your designs can be tested with different
processes.
BR 8/02
4x
Load
• Verilog-A is an extension of Verilog that supports analog concepts
such as Voltage, Current
–
–
–
–
DUT
Driver
– A powerful waveform viewer, but can take many button clicks to produce
a value from a waveform. It is better to use HDL models for signal
measurement purposes.
BR 8/02
2
file
subckt P_def (d g s b)
parameters L=lmin W=wmin
M0 (d g s b) P w=W l=L as=(W*1.5e-6) ad=(W*1.5e-6) \
ps=((2*1.5e-6)+W) pd=((2*1.5e-6)+W) region=sat
ends P_def
5
BR 8/02
6
1
pmeas.va, delta_probe.def
•
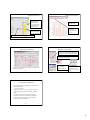
‘power_dly.sp’ File
pmeas.va is a Verilog-A model that implements a power
supply that reports average power usage
– Included by power_dly.sp which is the top level Spice file
•
delta_probe.def is a Spectre HDL model that implements
a probe for measuring delay between two events
//pwr=subckts saves power for subcircuts
opts options pwr=subckts save=allpub
aliasGnd (gnd 0 ) vsource type=dc dc=0
– Included by power_dly.sp which is the top level Spice file
– Provided in the sample Analog HDL model library in the Cadence
distribution
– A very flexible model, look at the source code for more
documentation or Appendix D in the Verilog-A language reference
guide. Very similar in capability to the HSPICE ‘.measure’
statement if you are used to that.
BR 8/02
Global nodes, can be used in
subcircuits without passing them
on parameter list.
simulator lang=spectre
global 0 gnd vdd
Save power info for all
subcircuits,
Vsupply for ground.
//include "ami06.m"
Include files for different
technologies
//include "tsmc025.m"
include "tsmc018.m"
include "def.m"
Defines ‘N_def’, ‘P_def’ default
devices based on ‘N’, ‘P’ models
from included tech file.
7
BR 8/02
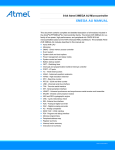
Parameter Definitions
8
Subcircuit Definitions
Using lmin, wmin so
// lmin, wmin defined in model file
can experiment with
subckt NAND2X1 A B Y vddc gndc
M3 (Y A net29 gndc) N_def w=2*wmin l=lmin different technologies.
M4 (net29 B gndc gndc) N_def w=2*wmin l=lmin
M2 (Y B vddc vddc) P_def w=2*wmin l=lmin
M1 (Y A vddc vddc) P_def w=2*wmin l=lmin
ends NAND2X1
parameters vdd_core=3.3 vss_core=0.0
parameters tr=.1n tf=.1n
parameters cload=15f
parameters pdelta=0.05n
parameters clkper=4n
parameters
subckt INVX1 A Y vddc gndc
M2 (Y A gndc gndc) N_def w=wmin l=lmin
M1 (Y A vddc vddc) P_def w=2*wmin l=lmin
ends INVX1
pwrstop=10*clkper
Should use parameter definitions for constant values – makes it
easier to experiment with different values.
subckt INVX4 A Y vddc gndc
M2 (Y A gndc gndc) N_def w=wmin*4 l=lmin
M1 (Y A vddc vddc) P_def w=2*wmin*4 l=lmin
ends INVX4
Using N_def, P_def so
that default values for
AS, AD, PS, PD are
calculated from W,L.
Passing in nodes for Vdd, Gnd so that power
supplies can be kept separate for power tracking.
BR 8/02
9
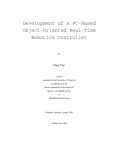
Sources, Circuit Instantiation
BR 8/02
10
Power, Delay Measurement
Default power supply
v_vdd (vdd gnd) vsource type=dc dc=vdd_core
ahdl_include "pmeas.va"
Verilog-A model for power supply
model
Pmtr (vdd_dut) pmeas vsrc=vdd_core deltatime=pdelta period=clkper
vpulse1 (a gnd) vsource type=pulse val0=vss_core
val1=vdd_core period=clkper rise=tr fall=tf width=clkper/2
Instantiate power supply,will report avg pwr used.
// delay measurement
Clock source for
input node.
ahdl_include "delta_probe.def"
Driver (a a_out vdd gnd) INVX1
dut_tplh (a_out 0 nand2_out 0) delta_probe start_val=0.7*vdd_core \
Dut (a_out vdd nand2_out vdd_dut gnd) NAND2X1
start_mode=fall stop_val=0.3*vdd_core stop_mode=rise
Load (nand2_out nand2_out1 vdd gnd) INVX4
dut_tphl (a_out 0 nand2_out 0) delta_probe start_val=0.3*vdd_core \
start_mode=rise stop_val=0.7*vdd_core stop_mode=fall
‘delta_probe’ model used to measure delay between two
events. Instantiate two probes to measure tplh, tphl of DUT
(input ‘a_out’ to output ‘nand2_out’).
Instantiate driver, dut, and load cells. Note that dut has a
separate power supply (defined later in file).
BR 8/02
11
BR 8/02
12
2
Transient Analysis
pmeas.va
First transient analysis.
typ_tran1 tran step=0.01n stop=pwrstop
Standard include files
//VerilogA
`include "constants.h"
`include "discipline.h"
Per2 alter param=clkper value=2n
typ_tran2 tran step=0.01n stop=pwrstop
Change clock period to
2ns, run again.
Functions as a power supply, so
single connection is an output
node.
module pmeas (psrc);
output psrc;
electrical psrc;
Per3 alter param=clkper value=8n
Voltage for supply output
parameter real vsrc=5.0;
typ_tran3 tran step=0.01n stop=pwrstop
Change clock period to 8 ns,
run again.
parameter real deltatime=0.05e-9;
parameter real period=1.0e-9;
Defines how often output
current is sampled for power
measurement.
Toggle frequency of DUT so can compute equivalent capacitance
value.
BR 8/02
13
BR 8/02
pmeas.va (cont.)
analog begin
@(initial_step)
begin
i_sum = 0.0;
avg_pwr = 0.0;
numsteps = 0;
end
Running Spectre
Internal variables.
integer numsteps;
real avg_pwr,real cap, i_sum ;
Triggered once at time=0, initialize
variables.
@(timer(0, deltatime))
begin
i_sum = i_sum + I(psrc);
numsteps = numsteps + 1;
end;
14
Triggered every deltatime, keep
output current sum, and # of steps.
Triggered at simulation end, compute/print
average power, capacitance.
@(final_step) begin
avg_pwr = (i_sum*vsrc)/numsteps;
cap = avg_pwr*period/(vsrc*vsrc);
$display("%M: Avg pwr = %g, Capacitance: %g\n",avg_pwr, cap);
%
swsetup ncsu-cadence
%
spectre power_dly.sp
When running Spectre, will get several warnings about
switching between Spice input mode and Spectre input mode
– this is ok.
Will also get a warning about ‘Only one connection found to
node 0’. Node ‘0’ is the default node name for ground – we
use the ‘gnd’ power supply for this, so this warning can be
ignored.
end
V(psrc)
end
<+ vsrc;
Assign output voltage.
BR 8/02
15
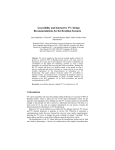
Spectre Output
BR 8/02
16
Waveform Display
Not all Spectre output is shown, only part of it.
*****************************************************
Transient Analysis `typ_tran1': time = (0 s -> 40 ns)
*****************************************************
...........9...........8...........7...........6...........5........
...4...........3...........2...........1...........0
Output from ‘pmeas’ model.
Module instance: dut_tphl
Start argument = 2.18142721893e-09 s. Output from ‘delta_probe’
Stop argument = 2.23273276011e-09 s.
instances.
Delta = 5.13055411827e-11 s.
Module instance: dut_tplh
Start argument = 7.69079045269e-11 s.
Stop argument = 1.40853531626e-10 s.
Delta = 6.3945627099e-11 s.
Total time required for tran analysis `typ_tran1' was 1.2 s.
BR 8/02
The waveform display tool is called ‘awd’.
To start waveform viewer, do:
Pmtr: Avg pwr = -6.71038e-05, Capacitance: -2.46479e-14
Number of accepted tran steps = 1582.
Initial condition solution time = 10 ms.
Intrinsic tran analysis time = 1.19 s.
Output data is placed in power_dly.raw/ directory.
17
% awd -dataDir power_dly.raw
This will open several windows. Chapter 2 of the Spectre
User Guide has a good introduction to ‘awd’ usage.
BR 8/02
18
3
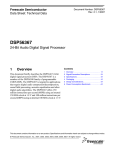
AWD Waveform Display
AWD Results Browser
Power waveform
selected subcircuit
(Dut). Must have
pwr=subckts option
in Spice file for this
to be generated.
Power Waveform for
DUT subcircuit.
Use Curves →Edit if
want to delete
waveforms, change
color, etc.
Waveforms for
internal nodes. Right
click to display them.
Results from 1st tran analysis, left click to expand.
BR 8/02
19
AWD Calculator Window
BR 8/02
20
Calculating Average Power
1. Left click on ‘wave’ , then left click on
waveform in waveform display. Should see
‘’wavew2sli()’ appear in calculator window.
2. Use ‘Special Functions’ button on
calculator to select ‘average’.
Used to perform calculations on waveforms, see Spectre User
manual for more details.
BR 8/02
21
3. Window now shows
‘average’ function
applied to waveform.
BR 8/02
4. Use ‘evaluate buffer’
option perform calculation.
Results will not be exact
match of ‘pmeas.va’ but will
22
be close.
General Notes on Simulation
• Use waveform display for debugging, use probes, models
for measuring values
– Much faster, repeatable
• Question your results – .ie, if you get a power in 10’s of
watts or delay in microseconds, something is probably
wrong.
• In reports, don’t use more than 3 significant digits.
Providing an answer like 67.0332459 is meaningless.
• Do not wait until the last minute – most simulation
assignments will take multiple tries.
BR 8/02
23
4