1
A Customizable SVG
Graph Visualization Engine
by
Yingyun Tony Lin
B.Sc., University of Victoria, 2004
B.Eng., HangZhou Institute of Electronic Engineering, 1993
A Thesis Submitted in Partial Fulfillment
of the Requirements for the Degree of
MASTER OF SCIENCE
in the Department of Computer Science
© Yingyun Tony Lin, 2008
University of Victoria
All rights reserved. This thesis may not be reproduced in whole or in part,
by photocopy or other means, without the permission of the author.
A Customizable SVG
Graph Visualization Engine
by
Yingyun Tony Lin
B.Sc., University of Victoria, 2004
B.Eng., HangZhou Institute of Electronic Engineering, 1993
Supervisory Committee
Dr. Hausi A. Müller, Supervisor
(Department of Computer Science)
Dr. Alex Thomo, Departmental Member
(Department of Computer Science)
Dr. Ulrike Stege, Departmental Member
(Department of Computer Science)
Dr. Kin Fun Li, External Examiner
(Department of Electrical & Computer Engineering)
ii
Supervisory Committee
Dr. Hausi A. Müller, Supervisor
(Department of Computer Science)
Dr. Alex Thomo, Departmental Member
(Department of Computer Science)
Dr. Ulrike Stege, Departmental Member
(Department of Computer Science)
Dr. Kin Fun Li, External Examiner
(Department of Electrical & Computer Engineering)
Abstract
This thesis describes our experience of creating an interactive and customizable
graph visualization engine, referred to as SVG graph visualization engine, or SVG Editor
for short, implemented entirely in SVG and ECMAScript. Typical operations of this
visualization engine include filtering, searching, collapsing, expanding of graph elements,
and hierarchical as well as historical viewing of graphs and subgraphs. This visualization
engine has great potential because it runs on many platforms and in many applications
due to the availability of SVG plug-ins.
SVG Editor can be customized to fit various domains. To illustrate the editor's
customizability, we discuss three sample applications of SVG Editor. The first example is
the instantiation of SVG Editor for the visualization of software structures. This kind of
iii
visualization is used by reverse engineering tools to support program comprehension. The
second example is the instantiation of SVG Editor for information modeling with the
Eclipse Modeling Framework (EMF). Another example is to use SVG Editor to show
three distinct viewpoints of a subject Web site: developer-view, server-view, and clientview in a web site reverse engineering tool, and for a reverse engineer to explore and
navigate mappings between them. Also, we assess selected aspects of SVG Editor’s
scalability, extensibility, customizability, usability, and reusability.
iv
Table of Contents
Supervisory Committee .................................................................................................... ii Abstract............................................................................................................................. iii Table of Contents .............................................................................................................. v List of Tables .................................................................................................................. viii List of Figures................................................................................................................... ix Acknowledgments ............................................................................................................ xi Dedication ........................................................................................................................ xii Chapter 1 Introduction ............................................................................................... 1 1.1 Motivation ............................................................................................................. 1 1.2 Approach ............................................................................................................... 4 1.3 Thesis Outline ........................................................................................................ 6 Chapter 2 Background ................................................................................................ 7 2.1 Reverse Engineering .............................................................................................. 7 2.2 Information Visualization ...................................................................................... 9 2.3 Reverse Engineering Tools and Visualization Tools .......................................... 11 2.4 Scalable Vector Graphics .................................................................................... 12 2.5 Eclipse and the Eclipse Plug-in ........................................................................... 15 2.6 Summary.............................................................................................................. 17 Chapter 3 Structure and Functionality ................................................................... 18 3.1 Main Visualization Window ................................................................................ 19 3.2 Menus .................................................................................................................. 21 3.2.1 Filter by Type ................................................................................................ 22 3.2.2 Node Selection .............................................................................................. 23 3.2.3 Collapse and Expand..................................................................................... 23 3.2.4 Customize ..................................................................................................... 24 v
3.2.5 Node Information .......................................................................................... 26 3.2.6 Database Exchange ....................................................................................... 27 3.3 History View........................................................................................................ 28 3.4 Hierarchical View ................................................................................................ 30 3.5 RCL Command Line Input .................................................................................. 31 3.6 Summary.............................................................................................................. 33 Chapter 4 Design and Implementation .................................................................... 34 4.1 MVC Design Pattern ........................................................................................... 34 4.2 Functionality Implementation in ECMAScript ................................................... 38 4.2.1 Adding ECMAScript to an SVG Document ................................................. 38 4.2.2 Node View and Node Selection .................................................................... 40 4.2.3 Collapsing and Expanding a Subsystem ....................................................... 44 4.2.4 Taking a Snapshot and Loading Filmstrips .................................................. 47 4.3 Summary.............................................................................................................. 50 Chapter 5 Applications.............................................................................................. 51 5.1 SVG Editor Eclipse Plug-in for EMF Model Visualization ................................ 51 5.2 Graph Visualization of Three Different Viewpoints Used in REGoLive ........... 60 5.3 Summary.............................................................................................................. 63 Chapter 6 Evaluation ................................................................................................ 64 6.1 Scalability ............................................................................................................ 65 6.2 Extensibility ......................................................................................................... 66 6.3 Customizability.................................................................................................... 66 6.4 Usability............................................................................................................... 67 6.5 Reusability ........................................................................................................... 68 6.6 Summary.............................................................................................................. 69 Chapter 7 Conclusions .............................................................................................. 70 7.1 Summary.............................................................................................................. 70 7.2 Contributions ....................................................................................................... 71 7.3 Future Work......................................................................................................... 72 References ........................................................................................................................ 74 vi
Appendix A: Export SVGEditor Plug-in ...................................................................... 78 Appendix B: Verify SVGEditor Plug-in ....................................................................... 80 Appendix C: Create an EMF Project............................................................................ 81 Appendix D: Create an SVG Editor.............................................................................. 83 Appendix E: Source Code for Creating an SVG Editor Plug-in Wizard .................. 87 Appendix F: Source Code for plugin.xml ..................................................................... 88 Appendix G: Library.ecore ............................................................................................ 89 Appendix H: Source Code for Demo Script ................................................................. 90 Appendix I: Export SVG from Rigi .............................................................................. 92 vii
List of Tables
Table 5-1: Type Definition of Nodes and Arcs in REGoLive ......................................... 61
viii
List of Figures
Figure 2-1: Eclipse Platform Architecture ....................................................................... 15 Figure 3-1: SVG Editor Structure .................................................................................... 19 Figure 3-2: Zoom Out, Original Size, and Zoom In ........................................................ 20 Figure 3-3: Find in SVG .................................................................................................. 21 Figure 3-4: Filter by Type Menu ..................................................................................... 22 Figure 3-5: Node Selection Menu .................................................................................... 23 Figure 3-6: Collapse and Expand Menu .......................................................................... 24 Figure 3-7: Change Opacity Menu .................................................................................. 25 Figure 3-8: Change Colour Menu .................................................................................... 25 Figure 3-9: Change Shape Menu ..................................................................................... 25 Figure 3-10: Node Information Menu ............................................................................. 26 Figure 3-11: Node Properties Window ............................................................................ 26 Figure 3-12: Send Graph and Get Graph Menu ............................................................... 27 Figure 3-13: SVG Editor Pop-up Menu ........................................................................... 28 Figure 3-14: SVG Editor History View ........................................................................... 29 Figure 3-15: SVG Editor Hierarchical View ................................................................... 30 Figure 3-16: SVG Editor RCL Command Input .............................................................. 32 Figure 4-1: ECMAScript Code for Domain Creation ...................................................... 36 Figure 4-2: ECMAScript Code for Model Creation ........................................................ 36 Figure 4-3: ECMAScript Code for Creation of Nodes and Arcs ..................................... 37 Figure 4-4: ECMAScript Code for View Creation .......................................................... 37 Figure 4-5: ECMAScript Embedded or in External Files................................................ 39 Figure 4-6: ECMAScript Code for Setting Properties ..................................................... 40 Figure 4-7: ECMAScript Code for Displaying Properties............................................... 41 Figure 4-8: ECMAScript Code for Changing Node View .............................................. 41 ix
Figure 4-9: ECMAScript Code for Adding Colour Button ............................................. 42 Figure 4-10: ECMAScript Code for Node Selection ....................................................... 44 Figure 4-11: Sample Code for Creating a New Node ...................................................... 45 Figure 4-12: Sample Code for Setting Location .............................................................. 45 Figure 4-13: Sample Code for Clearing NodeSelection .................................................. 46 Figure 4-14: Taking a Snapshot ....................................................................................... 48 Figure 4-15: Sample Code for Loading Filmstrips .......................................................... 49 Figure 5-1: A Sample Library Model Created in RSA .................................................... 54 Figure 5-2: A Sample Library Model Created in SVG Editor ......................................... 54 Figure 5-3: EMF Ecore Class Hierarchy ......................................................................... 55 Figure 5-4: Ecore Model Created in SVG Editor ............................................................ 55 Figure 5-5: Sample Code for plugin.xml ......................................................................... 56 Figure 5-6: Sample Code for build.properties ................................................................. 57 Figure 5-7: Generate SVG Editor for EMF Models ........................................................ 58 Figure 5-8: SVG Editor Generated by SVG Editor Eclipse Plug-in................................ 59 Figure 5-9: SVG Editor Generated with the ReGoLive Plug-in ...................................... 62 Figure 6-1: SQL/DS Graph in SVG ................................................................................. 65 x
Acknowledgments
I would like to say thank you to my supervisor, Dr. Hausi A. Müller, for the
opportunity to work in his research group at the University of Victoria, and most
importantly, for his patience, support, guidance and encouragement over the years of my
study. I would also like to thank my committee members, Dr. Alex Thomo, Dr. Ulrike
Stege and Dr. Kin Fun Li, for their valuable time and effort.
I am grateful to all the members of the Rigi research group for their contributions.
In particular, I would like to acknowledge the help I received from Qin Zhu, Grace Gui,
Holger Kienle, Piotr Kaminski, Scott Brousseau, Jing Zhou, Ingrid Zhou, Feng Zou, and
Lei Lin.
I acknowledge the support of the Natural Sciences and Engineering Research
Council of Canada (NSERC), the IBM Toronto Center for Advanced Studies (CAS), and
the Consortium for Software Engineering Research (CSER). The first version of the
interactive SVG Editor was developed by Jon Pipitone.
Finally, I would like to thank my friends and family for helping me through this
long process with their care and love.
xi
Dedication
To my wife and son
xii
Chapter 1 Introduction
1.1 Motivation
As applications continue to evolve with new functionality and technology
enhancements, the majority of software systems developed today has become quite
complicated. These systems are “difficult to understand and maintain due to their size and
complexity, as well as their evolution history” [1]. It is apparent that software developers
expect and require much more help from software development tools, because software
development and maintenance is tough to perform without a precise understanding of a
subject system [2].
Numerous research efforts have addressed the issue of providing tools to assist
programmers during the process of software development and maintenance. Tools used to
assist in this way are known as Computer-Aided Software Engineering (CASE) tools [3].
1
A good CASE tool should have sophisticated, specialized features that emphasize design
and architecture support. As a result, for many years CASE tools were sought after and
have successfully helped to automate the software development process [4]. The CASE
tools adopted a number of different approaches, including advanced visualization
techniques [5].
Software visualization is concerned with static or animated graphical
representation of different aspects of software such as its structure, execution, behaviour,
and evolution [6]. It is a way of presenting computer programs, processes, and algorithms
as diagrams of abstract graphs. Most software applications embody many information
models at different levels of abstraction. A well-designed graph visualization engine can
make plain nodes, entities, and constraints to help users interact with the information
model. Over the years, developers have increasingly relied on visualization techniques
and tools to help them explore, manipulate, and view software information.
One particularly useful visualization technique in software development is graph
visualization. A graph speaks louder than a thousand words. One well-known graph is the
node-linked graph. A node-linked graph consists of certain kinds of nodes and edges. A
hierarchical node may contain other nodes and edges at different levels. Each edge
connects two nodes. A directed edge is connecting an ordered pair of nodes. An edge
may cross the hierarchical boundaries to connect nodes of different kinds. In computer
science, node-linked graphs are particularly suitable for visually presenting software
artefacts. Nodes in the graphs typically represent system components such as subsystems,
2
procedures, variables, calls, data access elements, and interfaces. Directed edges can
represent dependencies among those components such as client-suppliers, composition,
and control and data-flow relations [7].
Two representation technologies for computer graphics are raster graphics and
vector graphics. Raster graphics, which is known as pixel-based or bitmap-based
graphics, represent an image as an array of pixels. The total number of pixels will
determine the quality of a raster image. Many visualization tools export results in the
format of raster graphics, which store information for every pixel of the graphic. The
other format, vector graphics, composes mathematically defined geometric shapes such
as points, lines, and polygons. Vector graphics do not support the inclusion or
manipulation of images well. While conversion from vector to raster graphics is easy,
conversion from raster to vector graphics is hard. Compared to vector graphics, raster
graphics has poor scalability and relatively large file sizes. Also, raster graphics are more
difficult to manipulate and change. Vector graphics are ideal for presenting graphs that
need some sophisticated operation such as rotation, movement, mirroring, stretching, and
so on.
SVG, which stands for Scalable Vector Graphics, is a platform-independent twodimensional vector graphics format, with a World Wide Web Consortium (W3C)
standard and a presentation integration platform with widespread browser, Commercial
Off-the-Shelf (COTS) product, and tool support [8]. As an Extensible Markup Language
(XML) vocabulary, it enables deep data integration with other XML languages such as
3
Extensible HyperText Markup Language (XHTML), and is an ideal generation target.
Most importantly, SVG has built-in support for scripting, enabling complex
applications to be written and transmitted as XML documents displayed on many
different platforms and host environments, including web browsers and some Office
products such as MS Word, MS PowerPoint and IBM Lotus Notes. There are many
software visualization tools, such as SHriMP views [9] implemented in Java, Rigi [10]
implemented in Tcl/Tk, and CodeCrawler [11] implemented in SmallTalk. Although
SVG has been applied to many areas, including graphic editors such as CorelDraw [12]
and Sketsa [13], interactive web-based applications, and as a common export format in
software visualization tools for example Poseidon for UML [14], to date, no interactive
software visualization tools has been implemented in SVG. Interactive and embeddable
SVG tools are important for live document generation and presentation purposes [7].
Hence, the aim of this thesis was to design and implement an SVG visualization engine
and report on this experience.
1.2 Approach
The objective is to develop a software visualization strategy to produce graph
visualization tools that are lightweight; run on common platforms such as web browsers
and office products; are highly customizable for different information domains; strictly
separate data and operations so that data and operations can come from different sources;
4
easily be generated from other tools which means that the input can comes from software
development tools such as Eclipse or reverse engineering tools such as Rigi; export
interactive and explorable output documents; and standards based.
This thesis reports on the development of a software visualization tool
implemented entirely in SVG and ECMAScript [15]. We refer to this tool as an SVG
graph visualization engine or SVG Editor for short [16]. It supports a normalized view of
all data available from complex, large-scale, existing software systems, and helps
understand their static and dynamic elements, relations, and structures.
Here, we first review the need for a visualization tool and the benefits of the SVG
language. Subsequently, we describe the implementation of SVG Editor and its
integration within the Eclipse development environment. SVG editor has components
that will create and manage graphic objects and their attributes in visual representation. It
not only visualizes these elements, but also allows for the interactive exploration of
entities and relationships between entities. Typical operations include filtering and
searching of nodes and arcs; collapsing and expanding of subsystem nodes; and
hierarchical as well as historical viewing of graphs and subgraphs. Each instance of SVG
Editor embodies a specific information model combined with custom-tailored
manipulation options accessible via menus or a command line. The end-user
programming capability via command line and scripts using the Rigi Command Library
(RCL) adds significant extensibility and versatility [17].
5
To evaluate our SVG Editor’s customizability, we developed an Eclipse plug-in
that generates an instance plug-in for a specific information model—the Eclipse
Modeling Framework (EMF) model [18]. This generator plug-in transforms information
from an EMF model into a graph editor for further study. This allows a user working in
Eclipse or with Eclipse applications to export work products outside the environment or
application and to render them in a web browser or Lotus Notes document for another
user to explore interactively [19].
1.3 Thesis Outline
This thesis begins by providing background information needed later in the
discussion. Chapter 2 establishes background on reverse engineering, information
visualization, reverse engineering tools, the SVG language, and the Eclipse environment.
Chapter 3 describes the structure and functionality of SVG Editor. Chapter 4 describes
the implementation of the visualization engine in SVG and ECMAScript. Chapter 5
describes two sample applications of SVG Editor. In addition, it illustrates how to add an
Eclipse plug-in. Chapter 6 assesses selected aspects of SVG Editor such as scalability,
extensibility, customizability, usability, or reusability. The last chapter offers conclusions
and points toward potential future work.
6
Chapter 2 Background
Here, we discuss information essential in the understanding of our research. First,
we introduce reverse engineering, information visualization, and explain some reverse
engineering tools such as Rigi. Second, we provide some basic information about the
SVG language and, finally, we introduce the Eclipse development environment and the
Eclipse plug-in extensibility.
2.1 Reverse Engineering
Engineering is the application of scientific principles to the design, construction,
and operation of structures and machines. Software engineering is defined as “the
application of a systematic, disciplined, quantifiable approach to the development,
operation, and maintenance of software” [20]. It is concerned with creating, operating,
7
and maintaining large software applications by applying technologies and practices from
computer science, project management, engineering, application domains, and other
fields.
Forward engineering, the traditional method of development of a technology,
moves from high-level abstractions and logical designs to the physical implementation of
a system [21]. In software engineering, forward engineering involves the design,
manufacture, construction, and maintenance of software products. The subject system is
the result of a development process in forward engineering.
By contrast, reverse engineering starts from a subject system or a finished product
and works backward to recreate the scientific concepts involved. In reverse engineering,
the investigator takes apart an existing system and analyzes its components to see how
the system works; he or she may recover lost information to make it more understandable
and maintainable. Chikofsky and Cross define reverse engineering as “the process of
analyzing a subject system to identify the system’s components and their
interrelationships and create representations of the system in another form or at a higher
level of abstraction” [21]. According to this definition, software reverse engineering
involves two phases of activities. In the first phase, the investigator analyzes a subject
system to identify the building blocks, disassembles its components, and understands
their interrelationships. Some low level artefacts such as graphs, global variables, and
data structures are retrieved at that time. The second phase involves creating
representations of the system at several levels of abstraction and representing them in
8
visual or textual frames. Reverse engineering retrieves system abstraction and design
specification such as architectures, subsystems, design patterns, or business rules. The
goal of reverse engineering is not to change the software system, but to understand it.
After we derive more accurate documentation regarding the design or specification of a
system, we can properly store, manipulate, and visualize the extracted information to
facilitate human understanding.
2.2 Information Visualization
In the software engineering context, visualization is a graphical representation of
data or concepts that makes our thoughts clearer or brings them into focus. Visualization
provides for rapid understanding when working with any kind of complex information.
Data is a collection of raw facts with little meaning. Information, on the other hand, is a
meaningful and useful collection of data after it has undergone some processing through
analyzing, formatting or printing. Yet, until properly stored, manipulated, and visualized,
information may not have much meaning.
Information visualization can be described as “the use of computer-supported,
interactive, visual representations of abstract data to amplify cognition” [22]. It is widely
applied in countless areas covering every industry such as Genealogy, Business
Management, Software Development, Hardware Design and Bioinformatics. Information
visualization deals with the display and interactive exploration of data for the analysis of
9
large datasets and better understanding of the intrinsic structure of data. It involves a
series of activities such as receiving, processing, storing, and presenting information that
supports human interaction for making visual sense. Information can provide access to
the structure of information that may be hidden or unavailable through a textual
representation.
Many ways are available to visualize a subject system. In computer science,
software artefacts are typically represented in node-linked graphs. A node-linked graph is
a symbolic representation of a network. It is an abstraction of a network with respect to
its connectivity presented as a simplified set of linked nodes. The definition of graph is
that a graph G is a set of vertices (nodes) V connected by a set of edges (links) E. Thus G
= (V, E) [23]. A node, v, is a terminal point or an internal point of a graph. An edge, e, is
a link between two nodes. A directed edge has a direction commonly represented as an
arrow. A component of a system is modeled to a node and its relationships with other
components are described as a collection of links. Hence, a graph model is a collection of
nodes and links, which provides an easy way to represent the components, interfaces, and
relationships between components within a software system. A simple example is a call
graph representing calling relationships between subroutines in a computer program.
10
2.3 Reverse Engineering Tools and Visualization Tools
The main goal of reverse engineering is to understand the subject system’s
architecture and present the result to the user. There are many reverse engineering tools
developed to help software engineers facilitate program understanding. Some reverse
engineering tools have a built-in visualization tool for the user to explore and navigate the
extracted information, such as Rigi [24], SHriMP [9], Klocwork Insight [25], and Imagix
4D [26]. In this thesis, we use Rigi as an example to illustrate the design of a reverse
engineering tool.
Rigi was developed by the Rigi group at the University of Victoria in Canada
[27]. It is a reverse engineering tool based on graph visualizations developed for program
understanding and software analysis. Rigi can reconstruct the high-level abstractions of a
subject system and represent the information to the user through its graph editor, which is
an interactive visualization tool. Rigi is made up of three important parts: Rigireverse,
Rigiserver, and Rigiedit [27].
Rigireverse is a parsing system that reconstructs structural models of large
information spaces such as software program, documentation or the World Wide Web, by
identifying the components, discovering relationships between them and generating
abstractions. It helps to retrieve high-level abstractions and store such information in
Rigiserver. Rigireverse supports multiple programming languages, such as C, C++, PL/1
11
and COBOL [27]. Rigiserver is an underlying repository that stores information extracted
from the system. The extracted information is stored in a text file in Rigi Standard Format
(RSF). Each RSF file is composed of a stream of triplets and each triplet represents a data
element. An RSF file is then loaded into Rigiedit. Rigiedit, the Rigi’s user interface,
represents the relationships in different view levels and provides editing, manipulation,
annotation, hypertext, and exploration capabilities. It has some built-in operations to
facilitate program understanding.
The Rigi graph visualization engine, Rigiedit, is implemented with Tcl/Tk [27].
Although Rigi has been used in numerous academic and research organizations, it has
several drawbacks. First, the graphical user interface look and feel is rather crude in
comparison with state of the art interfaces. Second, the resulting images cannot be
exported except by taking static screenshots [5]. Even so, the screenshots from Rigiedit
can be integrated into system documentation only as static bitmap graphs that allow no
interactive exploration.
2.4 Scalable Vector Graphics
Scalable Vector Graphics (SVG) is a new XML-based language created by the
World Wide Web Consortium for creating static and animated two-dimensional graphics
contents [8]. It consists of vector graphics shapes, rather than bitmap information, and it
offers small image files that are scalable in size and resolution.
12
A number of features of SVG make its use advantageous. First, SVG images are
scalable; that is, the user may increase or decrease uniformly the size of the images and
may “zoom” the size of any part of the graph without degradation. A user may present
SVG images in any resolution without loss of detail. Second, SVG is a vector-based
graphics format that contains geometric primitives, such as points, lines, curves, and
shapes. This gives a greater ability to create sophisticated dynamic and interactive
graphics than an image in raster graphics format. Third, SVG is a standards-based
language, which means that developers can easily adopt it. For example, SVG is pure
XML and includes a document object model. This means that developers, who have
knowledge of XML and Document Object Model (DOM), will be able to script SVG
quickly. Fourth, SVG objects can be interactive. Since SVG includes three basic graphic
objects (shapes, images, and text), these types of objects can be grouped, styled,
transformed, and composed into previously rendered objects. Most importantly, SVG
graphics are scriptable, because SVG conforms to the DOM standard. In addition, a
number of simple events are supported declaratively in SVG, such as mouseover,
mousemove, and click, and some other types of interactivity can be scripted. This ability
to script allows animation and interaction of an object or a group of objects. Fifth, text in
SVG is selectable and searchable. Search engines can index SVG graphics according to
what the diagram contains [8].
As a mature and open standard, SVG has been hailed as one of the web’s hottest
new graphics formats. It is the foundation for tool support from a number of vendors in
various products, open-source implementations, and cross-platform availability [8]. Due
13
to the advantages of SVG mentioned above, a user can easily obtain the benefits of
integrating SVG with RIGI. A graph can be imported and exported using XML, so that
SVG Editor can be used on independent platforms and the resulting images can be
viewed and edited independently. The images can either be written into an SVG file or
automatically displayed in a web browser. In addition, the representation of nodes and
arcs in graphs are stable without degradation and the information of the nodes and arcs is
searchable. Each graphics element can be an active hyperlink. Finally, animations can be
defined and triggered by user interaction [8].
There is another vector graphics format, Extensible Application Markup
Language (XAML), which was announced by Microsoft and Adobe [28]. Generic XAML
syntax defines the user interface for the Windows Presentation Foundation (WPF) by
describing the objects, properties and their relationships in XML. It is separated from the
application code or the run time logic so that it helps separate design and development.
XAML and SVG are both XML-based file formats for graphical applications. SVG is a
programming API while XAML is not. XAML supports widgets such as 3D and controls,
which SVG does not [28]. XAML is the next generation vector graphics technology and
research on conversion between XAML and SVG is underway by many graphics
engineers. For example, ViewerSvg is a tool that converts SVG to XAML [29].
14
2.5 Eclipse and the Eclipse Plug-in
Eclipse is an open source, universal tool platform or tool base written primarily in
Java. It is designed and built to serve as an Integrated Development Environment (IDE)
for Java developers. It also supports the construction of a variety of tools for applications
as diverse as websites, embedded Java programs, C++ programs, and Enterprise
JavaBeans [30]. The Eclipse platform itself has several major components: the Platform
Runtime, the Workbench, the Workspace, the Help system and the Version and
Configuration Management (VCM) system as depicted in Figure 2-1.
Figure 2-1: Eclipse Platform Architecture
The platform is the foundation for building a variety of tools and developing
15
certain kinds of applications. The Platform Runtime, the small Eclipse’s kernel, provides
mechanisms for declaring and discovering the extension points for plug-ins. It supports
activation and operations of plug-ins to work together within the context of the Eclipse
workbench.
The plug-in mechanism is the key to the seamless integration of tools with Eclipse
[31]. A plug-in is the smallest unit in the Eclipse environment, which can be developed
and delivered separately and provides a certain type of service. All of the Eclipse
functionality is located in plug-ins except for the platform runtime [32]. The plug-in
mechanism offers a flexible model of extensibility for the user. All plug-ins are coded in
Java. Each plug-in has a manifest file which defines any number of named extension
points to which other plug-ins can contribute, and extensions through which the plug-in
contributes to other plug-ins. The contributing plug-in is activated when selected [30].
Because Eclipse is free open-source software and the plug-in mechanism provides
flexibility, it is easy to extend. Eclipse provides developers with a comprehensive
Application Programmer Interface (API) for writing the plug-ins. This interface allows us
to develop an Eclipse plug-in to generate an SVG Editor within the Eclipse environment.
So that a user working in Eclipse or with Eclipse applications can export the resulting
images outside of the Eclipse environment and render them in a web browser for other
users, who do not necessarily run the Eclipse environment, to explore.
16
2.6 Summary
This chapter presented the background on reverse engineering and information
visualization research and tools. It also introduced the SVG language and its benefits.
Finally, it introduced and explained important terms and concepts underlying the Eclipse
environment and Eclipse plug-in mechanism.
17
Chapter 3 Structure and Functionality
At this point, a detailed discussion of the five main components of SVG Editor is
presented: the main visualization window, menus, history views, hierarchical view, and
the RCL command line input. This chapter also describes the core operations that SVG
Editor supports, such as filtering and searching of nodes and arcs, and collapsing and
expanding of subsystem nodes.
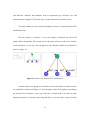
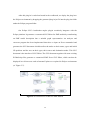
Figure 3-1 depicts an instantiation of the SVG Editor for visualizing software
systems, a sample view applied to analyse a subject system. The data are first generated
by Rigireverse—the Rigi Parser, and stored in a file in RSF format, which is the result of
reverse engineering. Then we use a Perl script file to translate this RSF file into an SVG
file (i.e., Ray_dc.svg file) using an SVG module and explore this SVG document in SVG
Editor (cf. Appendix I).
18
Figure 3-1: SVG Editor Structure
3.1 Main Visualization Window
The main visualization window in SVG Editor is a canvas located in the center of
the view. Its main responsibility is to open and display the information stored in a graph
SVG file. Nodes in the graphs will represent system components such as subsystems,
procedures, variables, calls, data accesses, and interfaces; and directed arcs will represent
dependencies among those components such as client-supplier, composition, and control
19
and data-flow relations; and attributes such as component type, interface size, and
interconnection strength [7]. Different types of nodes and arcs have distinct colors.
The main window has some typical advantages because it is implemented in SVG
and ECMAScript.
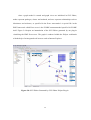
First, the graph is “zoomable”. A user can enlarge or diminish any part of the
graph without degradation. The current size of the nodes and arcs in the active window
can be expanded. As well, the view can appear in any resolution without loss of details as
shown in Figure 3-2.
Figure 3-2: Zoom Out, Original Size, and Zoom In
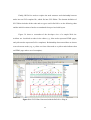
Second, nodes in the graph are selectable and text information of nodes and arcs
are searchable as depicted in Figure 3-3. Search engines index SVG graphics according to
the contents of the diagram. A user can search for a certain node by its name or other
displayed properties. Using the mouse drag and draw, a user can select a group of nodes
20
and arcs for subsequent operations.
Figure 3-3: Find in SVG
Third, objects in the main visualization window are scriptable, which means that a
user can interact with the nodes and arcs effectively. In addition, a number of event
handlers, such as mouseover and mouseclick, may be assigned to these graphical objects.
This allows animation of objects triggered by user interaction [8].
3.2 Menus
Two types of menus are utilized in SVG Editor: on-screen menus and pop-up
menus. Onscreen menus are implemented in the SVG language and can be clicked on to
trigger an event. Among both on-screen and pop-up menus, one finds six groups:
21
(1) Filter by Types;
(2) Node Selection;
(3) Collapse and Expand;
(4) Customize;
(5) Node Information; and
(6) Exchange.
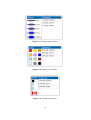
3.2.1 Filter by Type
The user can selectively filter out details that he or she wishes to hide to reduce the
visual clutter of too many nodes and arcs. For example, to filter a selected group of
nodes, the user simply clicks on the small cross square denoting the data type and it
becomes unselected as depicted in Figure 3-4. To show the previously filtered
information, the user just clicks again on the small cross square of the type and make sure
it becomes selected. Figure 3-4 shows an example of “Filter by Type” menu which
consists of three arc types: call, reference and composite, and three node types: Data,
Function and Collapse.
Figure 3-4: Filter by Type Menu
22
3.2.2 Node Selection
The node selection menu (cf. Figure 3-5) provides operations such as select all
nodes; clear the current selection; select nodes by type; select a forward or reverse tree;
select incoming or outgoing nodes of a current selected node; select complement nodes;
and select dead nodes ( i.e., nodes that have no any incoming or outgoing relationships ).
Node selection is the most basic function that helps users explore a graph.
Figure 3-5: Node Selection Menu
3.2.3 Collapse and Expand
To collapse nodes into a subsystem, the user selects a group of nodes according to
a certain rule then chooses the collapse menu item (cf. Figure 3-6). A new subsystem
node is created that has all of the selected nodes as its children, thus simplifying the
23
graph in the active window. The previously selected nodes are moved to a lower level in
the hierarchy and are deselected. The new node becomes the currently selected node. The
user can also perform the opposite operation of collapsing a subsystem, expanding a
subsystem. To expand a subsystem, the user selects a composite or collapsed node, which
contains other nodes, and chooses the expand item from the menu. The selected node
disappears to be replaced by the nodes it contains. Any time before or after the user
performs a collapse or expand function, he or she may take a snapshot to save the current
view and model for later return.
Figure 3-6: Collapse and Expand Menu
3.2.4 Customize
The user can customize a selected node view by changing its colour, shape or
opacity. For example, we show how to change opacity. First we create a submenu for
controlling node opacity, and add a list of buttons to this submenu. Each of the buttons is
assigned a value between 0 and 1, and has an event listener which listens to the button
selection event. When a button is selected, the opacity style of the currently selected
nodes will be changed to the value assigned to this button.
24
Figure 3-7: Change Opacity Menu
Figure 3-8: Change Colour Menu
Figure 3-9: Change Shape Menu
25
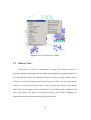
3.2.5 Node Information
The user can hover the mouse over a node and the name of the node is displayed.
The user can hide a group of selected nodes and show previously hidden nodes.
Figure 3-10: Node Information Menu
By clicking the show information of the menu (cf. Figure 3-10), a pop-up window
named “node properties” appears and shows the identification, type, incoming and
outgoing arcs, name and source file of the selected node (cf. Figure 3-11).
Figure 3-11: Node Properties Window
26
3.2.6 Database Exchange
By choosing the send graph item in the menu (cf. Figure 3-12), the user can send
the current SVG file to a connected database and save it. By clicking the get graph item
in the menu, the user can get a saved SVG file from that database. This makes SVG
Editor persistent.
Figure 3-12: Send Graph and Get Graph Menu
As well, SVG Editor features a pop-up menu, which makes it a little easier to use.
It includes a number of functions provided by Adobe SVG Viewer such as zoom in,
zoom out, view source, save SVG as, and some functions provided by SVG Editor such
as node selection and a demonstration. The demonstration will run on a small example
and show how to perform some basic operations provided. Figure 3-13 depicts the pop-up
menu.
27
Figure 3-13: SVG Editor Pop-up Menu
3.3 History View
The history view provides a mechanism for saving several different states in a
sequence of graph manipulations and a roadmap for navigating the graph information. To
show the filmstrip window that contains the history, the user just right clicks the mouse
and selects the history window menu from the pop-up window. To close the filmstrip
window, he or she can left click on the X icon in the top right corner of the filmstrip
frame. The user can return to those saved states by left clicking on the snapshot of the
state in the history view. Figure 3-14 depicts the history view window. Snapshots are
numbered based on the history and displayed with their title.
28
It is easy to add a snapshot into the history view or remove it. To add a new
snapshot into the filmstrip, the user right clicks the mouse on the screen and then selects
the snapshot menu from the pop-up window. To remove a snapshot from the filmstrip, he
or she just moves the mouse over the title of the desired snapshot. The color of the title
rectangle will change to red and the display label will change to “delete history.” Left
clicking on the rectangle will remove the snapshot from the history view.
Figure 3-14: SVG Editor History View
The snapshot capability is similar to taking a screenshot of the main visualization
window and recording all of the layout and filter information of the views of the nodes
and arcs. The history window saves the thumbnail sized images that capture interesting
views to be reloaded by the user. The user can use the saved snapshots to return to those
different states of views of points in a domain.
29
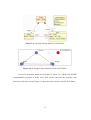
3.4 Hierarchical View
A subsystem node may contain subgraphs (i.e., other nodes and arcs as its
children). By collapsing a group of nodes, the user can create a subsystem node that has
all of a group of previously selected nodes as its children at a lower level in the hierarchy.
SVG Editor provides operations to explore a hierarchical view in the following way.
After selecting a subsystem node, the user may click on the hierarchical view on the
menu and see in the main window the subsystem the node contains. The previous view is
saved on the hierarchical view window and the corresponding level is saved and
displayed. To traverse up the hierarchy, the user may click the small view in the
hierarchy view window and higher-level nodes and arcs are displayed in the main
window. Figure 3-15 depicts the hierarchical view window: the top right node at Level 1
consists of all the nodes at Level 2.
Figure 3-15: SVG Editor Hierarchical View
30
3.5 RCL Command Line Input
SVG Editor is extendable and end-user programmable by implementing RCL
command input. RCL stands for Rigi Command Library. A RCL command is created for
each menu command and it can be used to automate tasks, customize features, and
integrate capabilities. A user can program SVG Editor by writing scripts and assembling
RCL commands into procedures. To enter a script command, a user can type the desired
command into the input or select a command from the RCL command list. For example,
the user can type “rcl_select_all” in the RCL command input, then hit enter on the
keyboard with the effect that all nodes in the main window will be selected. Another
example, the user can run “rcl_demo” (cf. Appendix G) in the RCL command with the
effect that an automatic demonstration of SVG Editor will start. Also, he or she can click
“show commands” to view all available RCL commands. Figure 3-16 depicts the RCL
command input field and the RCL command listing window.
31
Figure 3-16: SVG Editor RCL Command Input
SVG Editor provides some commands that were not previously in Rigi Command
Library. Those commands deal with collapsing and expanding the subsystem (i.e.,
rcl_collapse and rcl_expand), taking snapshot for the history view (i.e., rcl_snapshot),
and demonstrating SVG Editor’s functionalities (i.e., rcl_demo).
32
3.6 Summary
This chapter introduced the five main components of SVG Editor and the core
operations that SVG Editor supports. The main visualization window is responsible for
opening and displaying the information stored in a graph SVG file. On-screen menus and
pop-up menus provide some basic functionality include filtering, searching, collapsing,
expanding of graph elements. SVG Editor also supports historical as well as hierarchical
viewing of graphs and subgraphs. The user can program the Editor by writing scripts
using the RCL command line input.
33
Chapter 4 Design and Implementation
This chapter presents our implementation of SVG Editor in about ten thousand
lines of SVG and ECMAScript code. We first present the Model View Controller (MVC)
design pattern we used, and then present selected functionalities implemented in
ECMAScript.
4.1 MVC Design Pattern
We used a Model View Controller (MVC) design pattern [33] to implement SVG
Editor. MVC decomposes the architecture of our editor into three distinct components:
the Model, the View, and the Controller.
•
The Model contains node and arc information about the application domain;
•
The View obtains data from the model and displays it; and
34
•
The Controller receives and interprets user input and requests changes to the
model or the view.
Because of this separation of concerns, the user can easily maintain multiple
views with the same model. SVG editor can display the state of the model in a variety of
views, such as main view, history view, and hierarchical view. In addition, it makes the
entire program easier to implement and easier to customize for different domains as well.
The graph component of SVG Editor can be specialized for particular domains.
For example, to visualize program structures for reverse engineering applications,
specialized domains can be defined for different programming languages such as C or
Java and its information spaces such as XML. Each domain has a set of appropriate node
and arc types as well as node and arc attributes. In SVG Editor, these aspects are
expressed with so-called Domain objects. To customize SVG Editor for visualizing, say,
the high-level structure of C programs, the schema for the domain may be defined as
follows: different node colors depict different types of data (in red) or functions (in
green), arcs colors depict different types of dependencies: call (in yellow) and reference
(in blue). The following ECMAScript code (cf. Figure 4-1) is used to create the domain:
35
function createDomain() {
var domain = new Domain("CProgram");
var type = domain.addNodeType("Data");
type.setAttribute("color", "red”);
type = domain.addNodeType("Function");
type.setAttribute("color", "green");
type = domain.addArcType("Call");
type.setAttribute("color", "yellow");
type = domain.addArcType("Reference");
type.setAttribute("color", "blue");
return domain;
}
Figure 4-1: ECMAScript Code for Domain Creation
The following code snippet is used to create the model (cf. Figure 4-2), and to
populate it with nodes and arcs (cf. Figure 4-3). Nodes and arcs have attributes such as
type, name and source.
// create the model
var model = graph.getModel();
model.setDomain(createDomain());
var Node = model.getNodeHandler();
var Arc = model.getArcHandler();
Figure 4-2: ECMAScript Code for Model Creation
36
// create nodes
node1 = model.createNode("1", "Data");
Node.setAttribute(node1, "name", "ADT_list");
Node.setAttribute(node1, "sourcefile", "file:/list-d/src/");
// create arcs
arc1001 = model.createArc("1001", "Call", node1, node2);
Figure 4-3: ECMAScript Code for Creation of Nodes and Arcs
Finally, the initial view of the graph can be obtained with the following code (cf.
Figure 4-4):
// create the view
graph.setBounds(1, 1, 755, 768);
var view = graph.view;
view.viewattrs.setAttribute("NODE_RADIUS", 9);
view.viewattrs.setAttribute("GRAPH_STYLE", "directed");
view.viewattrs.setAttribute("LABEL_BEHAVIOUR", "tooltip");
view.realize();
view.setViewbox(154, -51, 408, 614, "xMinYMin meet");
view.importModel();
var nodeview = view.nodeview;
nodeview.setInitialLocation("1", 460, 300); // set node locations
Figure 4-4: ECMAScript Code for View Creation
37
We have implemented an EventListenerManager as the Controller to keep track
of event listeners, to notify registered listeners of changes in the model, and to modify the
corresponding view.
4.2 Functionality Implementation in ECMAScript
In this section, we present selected SVG Editor’s functionality implemented in
ECMAScript. ECMAScript is a scripting programming language, standardized by Ecma
International in the ECMA-262 specification [15]. It is often referred to as JavaScript and
widely used in web application.
4.2.1 Adding ECMAScript to an SVG Document
Most SVG viewers support ECMAScript as their main scripting language. With
its <script> element, SVG is ready for incorporation of ECMAScript code. ECMAScript
can either be embedded or be supplied in external files. The next code example (cf.
Figure 4-5) in our implementation shows both styles. The first five lines of the code show
how the external ECMAScript files are supplied by referring to the script with an
xlink:href attribute (i.e., the script code is an external file). The code between the sixth
<script> tag and </script> shows how ECMAScript languages are embedded in an SVG
document (i.e., the script code is in the SVG file).
38
<script xlink:href="./Command.es" a3:scriptImplementation="Adobe" />
<script xlink:href="./Components.es" a3:scriptImplementation="Adobe"/>
<script xlink:href="./core.es" a3:scriptImplementation="Adobe" />
<script xlink:href="./rGraph.es" a3:scriptImplementation="Adobe" />
<script xlink:href="./menuMaker.es" type="text/ecmascript"/>
<script a3:scriptImplementation="Adobe"
type="text/ecmascript"><![CDATA[ …
]]></script>
Figure 4-5: ECMAScript Embedded or in External Files
We have five external ECMAScript files: (1) rGraph.es, (2) core.es, (3)
Components.es, (4) Command.es, and (5) menuMaker.es.
(1)
rGraph.es defines an rGraph component, which controls the display of the
network of related objects using the well-known paradigm of a graph. The rGraph
component does not contain any data. It only provides a view of the data. The graph gets
data by querying its data model. The graph component can be specialized for particular
domains. Each domain has a set of appropriate node and arc types, and node and arc
attributes. These aspects are expressed in a Domain object.
(2)
core.es defines global variables and methods. It has a main method:
DoOnLoad(evt) which gets the SVG documents and initializes all components.
(3)
components.es defines container and its subclasses such as label,
compositeButton, checkbox, titledContainer, textbox, menu, window and button.
Container has a visual representation on the screen. It can interact with the user by adding
an event listener. Container can contain other components or SVG elements.
39
(4)
command.es defines a command interface. All commands, such as the
select command, implement this interface.
(5)
menuMaker.es generates context menus (i.e., the pop-up menu when a
user right-clicks the main window) and submenus.
4.2.2 Node View and Node Selection
Functionalities on viewing and selecting nodes are basic for a graphical user
interface. SVG Editor provides functions such as showing information for nodes,
changing node views and selecting nodes based on several choices.
4.2.2.1 Showing Information for Nodes
Nodes in SVG Editor can represent system components such as subsystems,
procedures, variables, calls, data accesses, and interfaces. Every node has some
information describing properties of the node. The properties such as id, name, type,
value, incoming nodes and outgoing nodes are set in the model as the code sample below.
Node.setAttribute(node1, "name", "ADT_list");
Figure 4-6: ECMAScript Code for Setting Properties
40
Node1 is an entity of node; name is the property name; ADT_list is the property
value. The properties can be displayed in a separate window by ShowInfoCommand()
which calls the _populateNodePropWindow command (cf. Figure 4-7). A newly created
window by this command will remove all its previous contents and add new information
about the currently selected nodes.
showInfoCommand.prototype.execute = function () {
if (this.graph.nodeselection.size() <= 0) {
alert('You must select at least one node');
} else
_populateNodePropWindow();
};
Figure 4-7: ECMAScript Code for Displaying Properties
4.2.2.2 Changing Node View
Every node contains some view properties such as shape, color, location and
visibility. A node can have different properties in different views. For example, the user
can hide selected nodes by setting their visibility to false. To show a selection of
previously hidden nodes, we need to do the following (cf. Figure 4-8):
for (var node in vnodes) {
graph.view.nodeview.setVisible(node, true);
};
graph.nodeSelectionHandler.clearSelection();
Figure 4-8: ECMAScript Code for Changing Node View
41
The user can customize a selected node view by changing its colour, shape, or
opacity. For example, we now show how to change the colour. First we create a submenu
for controlling node colour, and add a list of buttons to this submenu. Each of the buttons
is assigned a colour such as red, yellow or black, and has an event listener which listens
to the button selection event.
var colourRectArray = new Object();
var colourButtonArray = new Object();
function _makeColourButton(colour) {
rect = colourRectArray[colour] = rect.cloneNode(false);
btn = colourButtonArray[colour] = new CompositeButton(null);
rect.style.setProperty("fill", colour);
btn.add(rect);
btn.addEventListener('selection', new
SelectionSetSVGStyleCommand(graph, "fill", colour),false);
return btn;
}
colour_vals.add(_makeColourButton("red"));
Figure 4-9: ECMAScript Code for Adding Colour Button
4.2.2.3 Selecting nodes
In SVG Editor, given that a node N1 is selected, a node N2 is an incoming node
of N1 if there is a directed arc from N2 to N1; a node N2 is an outgoing node of N1 if
there is a directed arc from N1 to N2; a node N2 is an forward tree node of N1 if we start
from N1, there are directed arcs which can lead us to N2; a node N2 is a backward tree
42
node of N1 if we start from N2, there are directed arcs which can lead us to N1; a node
N2 is defined as a dead node if it has no any incoming nodes or outgoing nodes (e.g.,
dead code).
Node selection is a basic function that aids user interaction and further operations.
Apart from the single-cell and marquee selections, SVG Editor also allows to select by
groups. Node selection has several kinds: selecting all nodes, selecting dead nodes,
selecting nodes by type, selecting nodes by attribute, selecting incoming nodes from a
selected node, selecting outgoing nodes from a selected node, selecting forward tree
nodes, selecting backward tree nodes, clearing node selection, and adding node to the
collection which contains selected nodes, etc.
We have an interface selectCommand; all other commands for selecting nodes
with different choices need to extend this super command. For example, a command
named SelectForwardTreeCommand (cf. Figure 4-10), which selects forward tree nodes,
extends the selectCommand interface. First, call the super command to initialize the
nodes selected by the mouse. Second, create a new array to store the nodes, which are the
destinations of the selected node’s outgoing arcs. Finally, add the elements of this array
into nodeSelection.
43
SelectForwardTreeCommand.prototype.execute = function () {
SelectForwardTreeCommand.superclass.execute.call(this);
var v = nodeselection.toArray()[0].gnode;
var visited = new GESet();
var arcs = new Array();
arcs = arcs.concat(v.outgoing);
visited.add(v);
while (arcs.length != 0) {
v = arcs.pop().dst;
if (!visited.contains(v)) {
visited.add(v);
}
this.graph.nodeselectionhandler.addNodes(
this.graph.view.getViewNodes(visited.toArray()));
}
};
Figure 4-10: ECMAScript Code for Node Selection
4.2.3 Collapsing and Expanding a Subsystem
Providing the ability to collapse nodes into a subsystem and expand a subsystem
allows a user to produce a compact view from a higher level or look down into a
particular subsystem for some detailed components.
44
4.2.3.1 Collapsing Nodes into a Subsystem
A new subsystem node is created that has all of the selected nodes as its children, thus
it simplifies the graph in the active window. The previously selected nodes are moved to
a lower level in the hierarchy and are deselected. The new node becomes the currently
selected node.
The following explains the implementation of collapseCommand:
1) Check if the number of selected nodes is greater than 1;
2) Create a new node (collapsed node) using a special name space;
newNode = model.createNode("a"+v.id, "Collapse");
Figure 4-11: Sample Code for Creating a New Node
3) Set the new node's location;
var p = graph.view.nodeview.getLocation(iter.currentItem());
graph.view.nodeview.setInitialLocation("a"+v.id, p.x, p.y);
Figure 4-12: Sample Code for Setting Location
4) Create two arrays (incomingArcArray and outgoingArcArray) to record if an
incoming arc or outgoing arc has been created;
45
5) For each selected node in the nodeSelection: change its view property for example
set the visibility to false, set the attribute “collapse” to true, set the parent node to
the new created node;
6) For each incoming arc and outgoing arc, set its attribute “collapse” to false, set its
visibility to false, and remove it from its src.outgoing array. Next, if its source
node is in the nodeSelection, add this arc into “arcInArray” array; if its source
node is not in the nodeSelection, create a new arc to connect the newly created
node to its source node;
7) Empty nodeSelection and make the newly created node as selected; and
graph.nodeselectionhandler.clearSelection();
graph.nodeselectionhandler.addNodes(
graph.view.getViewNodes(selectArray));
Figure 4-13: Sample Code for Clearing NodeSelection
8) Refresh view of nodes and arcs.
4.2.3.2 Expanding a Subsystem
A user can expand one subsystem at a time with the Expand menu command. The
following explains the implementation of expandCommand:
1) Check if the number of selected nodes is exactly one;
2) Check if the selected node contains other nodes. If there are no children, return;
46
3) Get the selected node’s location;
4) Expand the nodeArray that contains its children nodes. Set the first node’s
position to that of the selected node’s and set other nodes’ position according to
their original relative position;
5) Remove incoming arcs from the selected node’s src.outgoing array and remove
outgoing arcs from the selected node’s src.incoming array;
6) For every arc in array arcInArray, set its visibility to true; and
7) For every arc in the array arcOutArray:
• Check if this arc still exists. If not, continue with the next arc;
• Check if its source node or destination node exists. If not, remove this arc from
the model and view; and
• Check if its source node or destination node is collapsed. If not, simply expand
this arc. Otherwise, determine the new node that contains the source nodes or
destination nodes.
4.2.4 Taking a Snapshot and Loading Filmstrips
The History view provides a mechanism for saving several different states in a
sequence of graph manipulations. Taking a snapshot of the current view from the main
visualization window adds a History view to the Filmstrip, which is the History window.
Loading Filmstrip retrieves a previously saved state from Filmstrip and renders the view
into the main window.
47
Figure 4-14: Taking a Snapshot
4.2.4.1 Initializing the History Window
1) When the SVGEditor is loaded, the History window is created by the function
createHistoryWindow(). The window is set to hidden by default;
2) Set a maximum number of snapshots allowed in the filmstrip; and
3) Set the next snapshot’s id, which is 0. It will increase by one each time a snapshot
is taken.
4.2.4.2 Taking a Snapshot
1) Taking a snapshot saves all node and arc’s view properties and stores them in a
data structure.
2) Create an SVG element “frame” including a field that shows the snapshot’s
identification and an SVG element “window” that renders the nodes views and
48
arcs view from the main window, scaling down their sizes to fit the small history
window.
3) copyNode(id, hID) to record each node's and arc’s id, type, visibility, collapse,
parentNode, position, and so on. All this information is necessary for later
retrieving the state.
4.2.4.3 Loading Filmstrips
1) When clicking on a snapshot, the main window changes the view to the
previously saved view by creating new nodeviews and arcviews; and
for (var i in
model.arcsHistory[hID])
{
newArc = model.backArc(model.arcsHistory[hID][i].id, hID);
graph.view.addArc(newArc);
}
graph.nodeselectionhandler.addNodes(…);
Figure 4-15: Sample Code for Loading Filmstrips
2) Deleting the corresponding history frame from the history window.
49
4.3 Summary
This chapter described how we apply the MVC design pattern in the
implementation of SVG Editor. It also summarized how we implemented the
functionalities of SVG Editor using ECMAScript. In particular, we illustrated two ways
of adding ECMAScript to an SVG document: embedding the script inline or referring to
the script in an external file. Also, we presented details of the implementation on how to
show information for nodes, how to change node views, how to select nodes, how to
collapse nodes into a subsystem, how to expand a subsystem, how to take a snapshot, and
how to load filmstrips.
50
Chapter 5 Applications
In the previous chapters, we have discussed the implementation of SVG Editor
and its functionalities. In this chapter, we describe selected applications of SVG Editor.
SVG Editor can be customized to fit various domains and applied to visualize and
manipulate different information models. To illustrate its customizability, we discuss two
sample applications of SVG Editor: SVG Editor Eclipse plug-in for EMF models and
SVG visualization engine for REGoLive. At the same time, we illustrate benefits of SVG
Editor.
5.1 SVG Editor Eclipse Plug-in for EMF Model Visualization
Eclipse is an open source and universal tool platform that is designed to serve as
the common base for near-infinite diverse IDE-based products. It is the foundation for
51
building diverse tools and providing certain kinds of services based on its innovative
plug-in architecture. An Eclipse plug-in is actually a component that provides a certain
type of service within the context of the Eclipse environment [32]. A plug-in is
represented by an instance of a plug-in class that provides methods for the activation or
deactivation of the plug-in. In addition, every plug-in is described by an XML plug-in
manifest file that contains information about the plug-in.
The Eclipse Modeling Framework (EMF) is a modeling framework and code
generator for building tools and applications according to a data model description [18].
It typically can be used to generate code that is written repeatedly. EMF provides a
simple interactive editor to define a model in XML Metadata Interchange (XMI).
Alternatively, the description of the model is expressed as Java code stubs in combination
with special Javadoc tags. An EMF model consists of a set of Java classes and
associations between them. All EMF models adhere to a common metamodel, called
Ecore, which describes the models. Once the metamodel has been defined, Java code,
XML schemas, or Eclipse plug-in artifacts can be generated to support the creation of
instances of model elements, reading and writing of models, etc.
Our goal was to create an SVG Editor plug-in that integrates with Eclipse to
visualize and manipulate EMF Ecore information models with our SVG Editor. In order
to create this visualization plug-in, we need to be able to read an EMF metamodel, and
transform the metamodel into a domain model definition of SVG Editor.
52
In doing so, we first write an analyzer program to take as input an Ecore
metamodel and then transform it into a customized SVG Editor. We used Eclipse Version
3.3.1.1, EMF Version 2.2.4 and EMI Version 2.0 as its interchange format. The declared
XMI namespace used in XMI 2.0 serialization is at http://www.omg.org/XMI. EMF uses
XML
Schema
(XSD)
in
its
XMI
files.
For
example,
it
uses
xsi:type="ecore:EClass" name="Book" to define that an element named
Book is of type Eclass (cf. Appendix G). Our analyzer is to extract all types defined in
the Ecore model as node types, all relationship types as arc types for the SVG Editor
domain model declaration. The analyzer also extracts entities (instances of node types),
and relationships between entities, calculates the layout for entities, and then represents
them as nodes and arcs in SVG Editor. The layout algorithm is simple and based on the
parent/child relationships. We have successfully transformed several EMF metamodels,
mostly written as examples by others and published on the Internet, into customized SVG
Editors.
Let us look at a sample library model (cf. Figure 5-1) created in IBM’s Rational
Software Architect (RSA), which is an advanced model-driven development tool. This
model simply has an Enumeration BookCategory and three Eclasses, Library, Book, and
Writer, with relationships between all of them. The Library contains both a collection of
writers and books, and the book has a writer and the writer has a book. The analyzer
program takes library.ecore (cf. Appendix E) as the input source and transforms this
simple library EMF ecore model into SVG Editor’s graph model. Figure 5-2 shows the
library model created in SVG Editor.
53
Figure 5-1: A Sample Library Model Created in RSA
Figure 5-2: A Sample Library Model Created in SVG Editor
Let us look at another sample Ecore model (cf. Figure 5-3), which is the ECORE
metametamodel specified in Ecore itself. This model represents the complete class
hierarchy of the Ecore model. Figure 5-4 shows the Ecore model created in SVG Editor.
54
Figure 5-3: EMF Ecore Class Hierarchy
Figure 5-4: Ecore Model Created in SVG Editor
55
After we tested that the analyzer program can transform EMF Ecore metamodel
into SVG Editor’s graph model, we need to create a plug-in for the Eclipse platform. The
easiest way to create an Eclipse plug-in is by using the templates provided by the Plug-in
Developer Environment (PDE). Eclipse will generate a number of files after completing
the wizard such as:
•
plugin.xml: The main file that describes the plug-in. It contains information to
help with the code generation, libraries, plug-in dependencies, and extension
points.
<extension point = "org.eclipse.ui.editors">
<editor name = "%Editors.SVGEditor"
icon = "icons/ogj16/editor.gif"
extensions = "svg"
id = "org.eclipse.ui.browser.editorSupport">
</editor>
</extension>
Figure 5-5: Sample Code for plugin.xml
The above code snippet defines an extension to Eclipse UI editors—an editor
named SVGEditor. The image editor.gif is used as an icon that shows up next to the
menu item in the Eclipse platform. The most difficult part of this XML file is the
declaration of identification for their editor. By using the pre-defined identification
“org.eclipse.ui.browser.editorSupport”, we can use the default browser (with SVG viewer
56
installed) to open a generated SVG Editor after the Editor plug-in transforms an Ecore
model into a customized SVG Editor successfully.
•
build.properties: The file used for describing the build process. Mainly, the
primary use of this file is to specify the source, the needed libraries, and the
output of the build, that is, svgeditor.jar.
source.. = src/
output.. = bin/
bin.includes = META_INF/,\
.,\
plugin.xml,\
plugin.properties,\
icons/,\
build.properties,\
svgeditor.jar
jars.compile.order = .,\
svgeditor.jar
source.svgeditor.jar = bin/
Figure 5-6: Sample Code for build.properties
Included in the source folder, ca/uvic/csc/svgEditor/*.java, are java classes used
for integration with the Eclipse platform and transforming the metamodels to SVG
Editors. A top-level class of the SVG Editor plug-in tool called SVGEditorPlugin extends
AbstractUIPlugin.
57
After this plug-in is coded and tested in the workbench, we deploy the plug-in to
the Eclipse environment by dropping the generated plug-in jar file into the plug-ins folder
under the Eclipse program folder.
Our Eclipse SVG visualization engine plug-in seamlessly integrates with the
Eclipse platform. It generates a customized SVG Editor for EMF models by transforming
an EMF model description into a suitable graph representation. An analyzer and
converter program has been implemented that takes as input an Ecore metamodel and
generates the SVG document which describes the nodes on their names, types and initial
2D positions and the arcs on their types, their source and destination nodes. This SVG
document is the interface of SVG Editor. The SVG document together with some existing
ECMAScript files generates a customized EMF Ecore SVG Editor, which can then be
displayed in web browsers such as Internet Explorer or explored in Eclipse environment
(cf. Figure 5-7).
Figure 5-7: Generate SVG Editor for EMF Models
58
Once a graph model is created and graph views are initialized in SVG Editor,
nodes represent packages, classes and methods, and arcs represent relationships such as
inheritance and reference, as specified in the Ecore meta-model. A special file in the
EMF framework called Ecore.ecore is the ECORE metametamodel specified in ECORE
itself. Figure 5-8 depicts an instantiation of the SVG Editor generated by our plug-in
visualizing the EMF Ecore.ecore. The graph is rendered within the Eclipse workbench
with the help of an integrated web browser such as Internet Explorer.
Figure 5-8: SVG Editor Generated by SVG Editor Eclipse Plug-in
59
5.2 Graph Visualization of Three Different Viewpoints Used
in REGoLive
A website is a collection of web pages, images, videos or other digital assets that
is hosted on one or several web servers. Many websites are fully functional and highly
complex software systems, consisting of various technologies and programming
languages [34]. Unfortunately, modifications of Web sites occur more frequently than for
traditional systems [35]. Most Web site developers pay little attention to performance,
maintainability, and scalability. As web applications have evolved, the complexity of
designing, developing, maintaining, and managing these systems has also increased
significantly. As a result, many Web sites are more and more difficult to understand and
maintain.
REGoLive is a reverse engineering tool developed by Grace Gui of our research
group [36, 37]. It supports comprehension of Web sites that have been developed with or
can be read using Adobe’s GoLive product by offering three distinct viewpoints of the
subject Web site: developer-view, server-view, and client-view. REGoLive uses the SVG
Editor to show each viewpoint, and also allows the reverse engineer to explore and
navigate mappings between them. Next we introduce how REGoLive collects, analyses,
and reformats the Web site information and finally fits into the SVG Editor’s SVG
document format.
60
First REGoLive needs to retrieve artifacts from the subject system and use the
local file system as a repository to store artefact information. ReGoLive starts at a
specified URL then extracts all links to other URLs and obtains all interesting elements
of the website on the development environment, the server, and the client.
Next, REGoLive needs to reformat and compute the useful information after
collecting the raw data. In general, entities are Web pages or components such as
templates and image files within pages. The relationships between entities are typically
navigation or containment. We identify and build the mapping between entities then use
tree layout to represent the site’s structure and use breadth-first traversal to build a tree.
Node Type
Arc Type
HTML document
Links to
Script file(JSP/ASP/PHP)
Runs JSP/PHP/ASP
Template
Uses style
Dynamic page
Forwards to
Dead node
Emails to
Image file
Text document
Email
CSS file
Table 5-1: Type Definition of Nodes and Arcs in REGoLive
61
Finally, REGoLive needs to explore the node structure and relationship between
nodes into an SVG template file, which fits into SVG Editor. The domain definition of
SVG Editor includes all the node and arc types used in ReGoLive as the following chart
and the initial locations of nodes are translated from previous built layout.
Figure 5-9 shows a screenshot of the developer view of a sample Web site.
Artifacts are visualized as nodes in the editor (e.g., blue nodes represent HTML pages,
and yellow nodes represent GoLive templates). Relationships between artifacts are shown
as arcs between nodes (e.g., a yellow arc from a blue node to a yellow node indicates that
an HTML page makes use of a template).
Figure 5-9: SVG Editor Generated with the ReGoLive Plug-in
62
5.3 Summary
This chapter presented two sample applications of SVG Editor: SVG Editor
Eclipse plug-in for EMF models and SVG visualization engine for REGoLive. Given our
experience with the integration of SVG Editor with Eclipse and GoLive, we are pleased
to attest that the tool is customizable for various domains for visual presentation and
interactive exploration.
63
Chapter 6 Evaluation
The goal of reverse engineering and visualization tools is to generate high level
abstractions and to produce architectural views of software structures. Wong distills some
requirements for software understanding tool support as follows [38]: “A successful
reverse engineering research tool needs to handle the scale, complexity, and diversity of
large software systems; provide interactive, consistent, and integrated views; integrate
static and dynamic views of software; support different users, their needs, and their
preferred comprehension strategies, development tools, and engineering process.” Based
on these requirements, we assess selected aspects of SVG Editor’s aspects such as
scalability, extensibility, customizability, usability, and reusability in this chapter.
64
6.1
Scalability
SVG Editor can handle small to medium graphs with hundreds of nodes and links
[28]. Furthermore, the performance can be maintained by managing the graph at various
abstraction levels. We tested SVG Editor with several sample systems on different
domain models. For the reverse engineering domain, we tested SVG Editor to visualize
graphs for IBM's SQL/DS system (cf. Figure 6-1). One of these graphs consists of about
nine hundred nodes and two thousand arcs [7]. The SVG Editor used in the REGoLive
web application domain, we tested with several sample Web applications provided with
GoLive. One of these consisted of about four hundred nodes [37].
Figure 6-1: SQL/DS Graph in SVG
65
When visualizing large graphs, SVG Editor’s response time is a problem. Rigi is
considerably faster than SVG Editor for large graph. The rendering speed for large graphs
in an SVG Editor is insufficient to allow adequate user interaction and can cause
problems (e.g., frozen windows) [39].
6.2
Extensibility
SVG Editor provides approaches to extensibility via ECMAScript, which makes it
possible to integrate new functionality seamlessly into the existing system. Since the
extensions are available in script files, other developers can adapt SVG Editor by
implementing new functionalities or modifying the interface to meet their needs.
ECMAScript has an extensibility mechanism by using prototype. A method can be made
available to all objects that derive from that type by attaching new functions to the
prototype. Developers can also apply inheritance to many objects of the same family type
by using the prototype property. Also, SVG Editor is implemented to be able to define
new node and arc types, and the ability to define new customizations.
6.3
Customizability
SVG Editor supports simple presentational customizations and functional
customizations. Presentational customizations consist of specifying initial views on the
66
graph and three customizable features for displaying nodes in the graph such as changing
the opacity, color or shape for each node type. Functional customizations provide the
ability to feature selection and addition, and support user specified menus and commands.
Also, the customizability of SVG Editor is exemplified with three different
instantiations in this thesis, such as the visualization engine used by reverse engineering
tools to support program comprehension (cf. Figure 3-1), SVG Editor for the structure of
Web sites developed with GoLive (cf. Figure 5-4), and an Eclipse plug-in for
visualization of EMF models (cf. Figure 5-3). Currently, we have to write specific
generators to generate SVG Editors for different information domains.
We are
developing a customization framework to produce customized SVG visualization for
different information models
6.4
Usability
A system can be easier to use if users interact with few different COTS
components which embody different styles and interfaces [40]. SVG Editor uses a single
host component for visualization. Its graph data is generated from an SVG file, produced
by some extractor or analyzer. This approach decouples the task of graph generation from
graph visualization and makes it easier to understand and customize.
67
Usability of SVG Editor is also enhanced because SVG Editor can be embedded
in many applications that are familiar to the users, including all leading browsers, word
processors, and presentation tools. For example, users that are familiar with MS
PowerPoint can use slides to organize and manipulate the SVG graph results. Also, SVG
Editor has made great strides towards improved usability by providing functionality that a
user can easily navigate with the graph information and support different view levels and
different status of user navigation. Also, it includes a simple demonstration for a new user
to adopt this tool effectively.
6.5
Reusability
Since SVG Editor is implemented in SVG and ECMAScript, it exhibits a high
level of reuse. The SVG graphs consist of sophisticated and high-level vector graphics
objects that can be primitive or pre-defined. The operation and interaction behaviour of
these graphics objects can be easily achieved via scripting with ECMAScript based on
event notification. This makes most components of SVG Editor easy to reuse. Also, the
Adobe SVG Viewer, which already provides functionality for zooming, searching,
scrolling, and loading, is a reusable component based on XML technology and allows a
user to interact with SVG images.
68
6.6 Summary
In this chapter, we addressed how SVG Editor meets a number of selected tool
requirements: scalability, extensibility, customizability, usability, and reusability. We
concluded that SVG Editor can handle the scale and complexity of real software systems;
it can provide approaches to extensibility for new functionalities or new type definitions;
it can support simple presentational and functional customizations; it can provide
interactive, consistent, and integrated views; and SVG Editor itself can be reusable.
69
Chapter 7 Conclusions
7.1 Summary
This thesis describes the implementation of SVG Editor and its integration within
the Eclipse development environment. A user can traverse and modify a graph model
represented in an SVG file. This SVG visualization engine not only visualizes the nodes
and links within a graph model, but also allows interactive exploration of entities and
relationships between entities.
We also developed an Eclipse plug-in to generate an SVG Editor for specific
information models such as an EMF model. The generator plug-in transforms an EMF
description of the domain into a graph editor that is able to import and export instances of
the EMF model. This generated SVG Editor can then be embedded in any supporting
70
application, including all leading browsers, word processors, and presentation tools. This
would allow a user working in Eclipse to export work products outside of the
environment and to render them on a web browser.
The customizability of SVG Editor is exemplified in this thesis with three
different instantiations. First, the features of SVG Editor have been explained with an
instantiation for the visualization of software structures. Reverse engineering tools use
this kind of visualization to support program comprehension. Another, similar
instantiation of the editor visualizes the structure of websites. Finally, another
instantiation supports the visualization of EMF models.
7.2 Contributions
The major contributions of the work reported here are:
•
We conducted background research on software reverse engineering, information
visualization, software understanding tools, the SVG language, Eclipse environment,
EMF, and so on;
•
We discussed the main components and core operations of SVG Editor;
•
We presented the design and implementation of SVG Editor;
•
We exemplified the customizability of SVG Editor with three different instantiations:
program understanding for reverse engineering application, Eclipse plug-in for EMF
model visualization, and web site structure visualization with REGoLive.
71
7.3 Future Work
In this thesis, the customizability of SVG Editor is exemplified with three
different instantiations instantiation of the editor to support program comprehension used
by reverse engineering tools, to visualize the structure of Web sites used by REGoLive,
and to support the visualization of EMF models used by Eclipse SVGEditor plug-in.
Currently, we have to write specific generators to generate SVG Editors for different
information domain, it is not too difficult, but not generalized. In the future, we plan to
develop a customization framework to simplify the instantiation of an SVG editor for a
particular domain. The customization framework will accommodate tailoring with respect
to the information model, the exploration menu, the end-user graph manipulation scripts,
and the core graph operations. We will also develop a generation framework using the
existing SVG engine and the customization framework and produce customized SVG
visualization and exploration plug-ins for different information models. Finally, we need
to evaluate the customization and generation frameworks and fine-tune the
implementations.
In this thesis, we have talked about the experience of integration of SVG Editor
with GoLive and Eclipse Environments, which a user can directly launch SVG Editor
from these products. With this editor, the user working on these products can explore,
filter, select, annotate, and layout graphs. In the future, we also plan to investigate
72
interoperability mechanisms for seamlessly integrating the SVG graph visualization
engine with several COTS products, including Microsoft Visio, Excel, and Lotus Notes.
73
References
[1]
Hausi A. Müller, Kenny Wong, and Scott R. Tilley. Understanding Software
Systems Using Reverse Engineering Technology. In Proceedings of the 62nd
Congress of L’Association Canadienne Française pour l’Avancement des
Sciences Proceedings (ACFAS 1994), pages 41-48, Montreal, Canada, May 1994.
[2]
Hausi A. Müller, Scott R. Tilley, M. Orgun, B. Corrie, and N. Madhavji. A
Reverse Engineering Environment Based on Spatial and Visual Software
Interconnection Models. In Proceedings of the Fifth ACM SIGSOFT Symposium
on Software Development Environments (SIGSOFT 1992), pages 88-98, Tyson's
Corner, Virginia, United States, November 1992.
[3]
Computer-aided software engineering.
http://en.wikipedia.org/wiki/Computer-aided_software_engineering, 2008.
[4]
Programming tool. http://en.wikipedia.org/wiki/Software_development_tools,
2008.
[5]
Michael Whitney, Kostas Kontogiannis, J. Howard Johnson, Morris Bernstein,
Brian Corrie, Ettore Merlo, James G. McDaniel, Renato De Mori, Hausi A.
Müller, John Mylopoulos, Martin Stanley, Scott R. Tilley, and Kenny Wong.
Using an Integrated Toolset for Program Understanding. In Proceedings of the
1995 conference of the Centre for Advanced Studies on Collaborative research,
page 59, Toronto, Ontario, Canada, 1995.
[6]
Software Visualization. http://en.wikipedia.org/wiki/Software_visualization,
2007.
[7]
Holger M. Kienle, Anke Weber, and Hausi A. Müller. Leveraging SVG in the
RIGI Reverse Engineering Tool. In Proceedings of the SVG Open Developers
Conference, Zürich, Switzerland, July 2002.
[8]
W3C, Scalable Vector Graphics (SVG) 1.1 Specification.
http://www.w3.org/TR/SVG/, 2007.
[9]
Margaret-Anne Storey, Casey Best, and Jeff Michaud. SHriMP Views: an
Interactive Environment for Exploring Java Programs. In Proceedings of the 9th
International Workshop on Program Comprehension (IWPC 2001), pages 111112, Toronto, Ontario, Canada, May 2001.
[10]
Hausi A. Müller. RIGI: A Visual Tool for Understanding Legacy Systems.
http://www.RIGI.csc.uvic.ca/, 2008.
74
[11]
Michele Lanza, Stephane Ducasse, Harald Gall, and Martin Pinzger.
CodeCrawler: an Information Visualization Tool for Program Comprehension. In
Proceedings of the 27th international Conference on Software Engineering (ICSE
2005), pages 672-673, St. Louis, MO, USA, May 2005.
[12]
CorelDraw.
http://www.corel.com/servlet/Satellite/us/en/Product/1150981051301, 2008.
[13]
Sketsa. http://www.kiyut.com/products/sketsa/, 2008.
[14]
Poseidon for UML. http://www.gentleware.com/, 2008.
[15]
Standard ECMA-262 ECMAScript Language Specification. http://www.ecmainternational.org/publications/standards/Ecma-262.htm, 1999.
[16] Tony Lin, Feng Zou, Holger M. Kienle, and Hausi A. Müller. A Customizable
SVG Graph Visualization Engine. SVG Open 2007, Tokyo, Japan. September
2007.
[17]
Kenny Wong. The Rigi User’s Manual—Version 5.4.4. June 1998.
[18]
Eclipse Modeling Framework Project (EMF).
http://www.eclipse.org/modeling/emf/, 2008.
[19]
Qin Zhu, Yu Chen, Piotr Kaminski, Anke Weber, Holger M. Kienle, and Hausi A.
Müller. Leveraging Visio for Adoption-Centric Reverse Engineering Tools. In
Proceedings of the 10th Working Conference on Reverse Engineering (WCRE
2003), pages 270-274, Victoria, BC, Canada, November 2003.
[20]
IEEE Standard Glossary of Software Engineering Terminology. IEEE std 610.121990, 1990.
[21]
Elliot J. Chikofsky and James H. Cross. Reverse Engineering and Design
Recovery: A Taxonomy. IEEE Software, Vol. 7, No. 1, pages 13-17. January
1990.
[22]
Stuart K. Card, Jock D. Mackinlay, and Ben Shneiderman. Readings in
Information Visualization: Using Vision to Think. Morgan Kaufmann Publishers,
1999.
[23]
Bruno Richard Preiss. Data Structures and Algorithms with Object-Oriented
Design Patterns in C++. John Wiley & Sons, 1999. 660 pp.
75
[24]
Margaret-Anne Storey, Kenny Wong, and Hausi A. Müller. Rigi: A Visualization
Environment for Reverse Engineering. In Proceedings International Conference
on Software Engineering (ICSE-97), pages 606-607, Boston, Massachusetts,
USA, May 1997.
[25]
Klocwork, Insight, http://www.klocwork.com/products/insight.asp, 2008.
[26]
Imagix, Imagix 4d. http://www.imagix.com/products/products.html, 2008.
[27]
Kenny Wong, Scott R. Tilley, Hausi. A. Müller, and Margaret-Anne Storey.
Structural Redocumentation: A Case Study. IEEE Software 12, 1, pages 46-54,
1995.
[28]
XAML. http://www.xaml.net/, 2008.
[29]
WPF Graphics. http://wpfgraphics.com/Overview2d.aspx/, 2008.
[30]
Rawn Shah. Working the Eclipse Platform.
http://www.ibm.com/developerworks/opensource/library/os-eclipse/, March 2003.
[31]
Eclipse (software). http://en.wikipedia.org/wiki/Eclipse_(software), 2008.
[32]
Eclipse Platform Technical Overview. http://www.eclipse.org/articles/
Whitepaper-Platform-3.1/eclipse-platform-whitepaper.html, 2001.
[33]
Steve Burbeck. Application Programming in Smalltalk-80: How to use ModelView-Controller (MVC). University of Illinois in Urbana-Champaign (UIUC)
Smalltalk Archive, 1992.
[34]
Jeff Offutt. Quality Attributes of Web Software Applications. IEEE Software,
Vol. 19, pages 25-32, March-April 2002.
[35]
Dennis Fetterly, Mark Manasse, Marc Najork, and Janet Wiener. A Large-Scale
Study of the Evolution of Web Pages. Software—Practice and Experience, Vol.
34, pages 213-237, 2004.
[36]
Grace Qing Gui. Extending a Web Authoring Tool for Web Site Reverse
Engineering. M.Sc. Thesis, Department of Computer Science, University of
Victoria, 2005.
[37]
Grace Gui, Holger M. Kienle, and Hausi A. Müller. REGoLive: Building a Web
Site Comprehension Tool by Extending GoLive. In Proceedings of 7th IEEE
International Symposium on Web Site Evaluation (WSE’05), pages 46-53,
September 2005.
76
[38]
Kenny Wong. The Reverse Engineering Notebook. Ph.D. Thesis, Department of
Computer Science, University of Victoria, 1999.
[39]
Holger M. Kienle. Building Reverse Engineering Tools with Software
Components. Ph.D. Thesis, Department of Computer Science, University of
Victoria, 2006.
[40]
Xavier Franch and Neil. A. Maiden. Modelling Component Dependencies to
Inform Their Selection. In Proceedings of the Second International Conference
on COTS-Based Software Systems (ICCBSS’03), volume 2580 of Lecture Notes in
Computer Science, pages 81-91.Springer-Verlag, 2003.
77
Appendix A: Export SVGEditor Plug-in
1.
Run Eclipse platform and open the SVGEditor plug-in project;
2.
Click “Overview” tag and click “Export Wizard”;
78
3.
On “Export” dialog, Select output location and export options:
4.
The following image shows the exported plug-in JAR file:
79
Appendix B: Verify SVGEditor Plug-in
After an SVGEditor plug-in is exported and deployed into the Eclipse
Environment, we need to do the following to verify if the plug-in is deployed
successfully.
1. Click eclipse.exe to restart Eclipse IDE;
2. Select Help Æ About Eclipse SDK to open “About Eclipse SDK” dialog; and
3. Click “Plug-in Details” button to view plug-in information.
The following image highlights the deployed SVG Editor plug-in.
80
Appendix C: Create an EMF Project
1. Find an XML Schema example file such as shipOrder.xsd from
http://www.w3schools.com/schema/schema_example.asp;
2. Run Eclipse IDE and create an new project;
3. Select “XML Schema” as a model importer;
81
4. Browse file system to load the shipOrder.xsd file, and check the “Create XML
Schema to Ecore Map” option.
5. An Ecore file shipOrder.ecore is generated in the model folder of EMF project.
82
Appendix D: Create an SVG Editor
1. From the Eclipse IDE, select New then select Other;
2. Select SVG Editor wizard within the “SVG Editor Creation Wizard”;
83
3. Click “Browse Workspace” button to select a model location for SVG Editor: the
EMF project that contains an Ecore model.
Note that SVG editor name will be default to name of the Ecore file appended
with “.svg”. Users can change the file name; however, if the file name does not end with
“.svg”, an error message will be displayed in “New SVG Editor” dialog as the follow
picture:
84
4. Click “Finish” button to generate SVG Editor:
85
5. The generated SVG Editor will be opened in the default browser:
86
Appendix E: Source Code for Creating an
SVG Editor Plug-in Wizard
package ca.uvic.csc.svgeditor;
import org.eclipse.jface.viewers.IStructuredSelection;
import org.eclipse.jface.wizard.Wizard;
import org.eclipse.ui.INewWizard;
import org.eclipse.ui.IWorkbench;
/**
* This class implements the interface required by the desktop
* for all 'New' wizards. This wizard creates SVG editors.
*/
public class SVGEditorCreationWizard extends Wizard implements INewWizard {
private IStructuredSelection selection;
private IWorkbench workbench;
private SVGEditorCreationPage mainPage;
public void addPages() {
mainPage = new SVGEditorCreationPage(workbench, selection);
addPage(mainPage);
}
public void init(IWorkbench workbench, IStructuredSelection selection) {
this.workbench = workbench;
this.selection = selection;
setWindowTitle(MessageUtil.getString("New_SVG_Editor"));
setDefaultPageImageDescriptor(SVGEditorImages.SVG_WIZARD_BANNER);
}
/**
* Method declared on IWizard
*/
public boolean performFinish() {
return mainPage.finish();
}
}
87
Appendix F: Source Code for plugin.xml
<?xml version="1.0" encoding="UTF-8"?>
<?eclipse version="3.1"?>
<plugin>
<extension
point="org.eclipse.ui.newWizards">
<category
name="%NewWizard.category"
id="ca.uvic.csc.svgeditor.new">
</category>
<wizard
name="%NewWizard.name"
icon="icons/obj16/newreadme_wiz.gif"
category="/ca.uvic.csc.svgeditor.new"
class="ca.uvic.csc.svgeditor.SVGEditorCreationWizard"
id="ca.uvic.csc.svgeditor.wizards.new.file">
<description>
%NewWizard.desc
</description>
<selection
class="org.eclipse.core.resources.IResource">
</selection>
</wizard>
</extension>
<extension
point="org.eclipse.ui.editors">
<editor
name="%Editors.ReadmeEditor"
icon="icons/obj16/editor.gif"
extensions="svg"
id="org.eclipse.ui.browser.editorSupport">
</editor>
</extension>
</plugin>
88
Appendix G: Library.ecore
<?xml version="1.0" encoding="UTF-8"?>
<ecore:EPackage xmi:version="2.0"
xmlns:xmi="http://www.omg.org/XMI"
xmlns:xsi="http://www.w3.org/2001/XMLSchema-instance"
xmlns:ecore="http://www.eclipse.org/emf/2002/Ecore" name="library"
nsURI="http:///library.ecore" nsPrefix="library">
<eClassifiers xsi:type="ecore:EClass" name="Book">
<eStructuralFeatures xsi:type="ecore:EReference" name="author" lowerBound="1"
eType="#//Writer" eOpposite="#//Writer/books"/>
<eStructuralFeatures xsi:type="ecore:EAttribute" name="title"
eType="ecore:EDataType http://www.eclipse.org/emf/2002/Ecore#//EString"/>
<eStructuralFeatures xsi:type="ecore:EAttribute" name="pages"
eType="ecore:EDataType http://www.eclipse.org/emf/2002/Ecore#//EInt"/>
<eStructuralFeatures xsi:type="ecore:EAttribute" name="category"
eType="#//BookCategory"/>
</eClassifiers>
<eClassifiers xsi:type="ecore:EClass" name="Library">
<eStructuralFeatures xsi:type="ecore:EReference" name="writers" upperBound="-1"
eType="#//Writer" containment="true"/>
<eStructuralFeatures xsi:type="ecore:EReference" name="books" upperBound="-1"
eType="#//Book" containment="true"/>
<eStructuralFeatures xsi:type="ecore:EAttribute" name="name"
eType="ecore:EDataType http://www.eclipse.org/emf/2002/Ecore#//EString"/>
</eClassifiers>
<eClassifiers xsi:type="ecore:EClass" name="Writer">
<eStructuralFeatures xsi:type="ecore:EReference" name="books" upperBound="-1"
eType="#//Book" eOpposite="#//Book/author"/>
<eStructuralFeatures xsi:type="ecore:EAttribute" name="name"
eType="ecore:EDataType http://www.eclipse.org/emf/2002/Ecore#//EString"/>
</eClassifiers>
<eClassifiers xsi:type="ecore:EEnum" name="BookCategory">
<eLiterals name="Mystery"/>
<eLiterals name="ScienceFiction" value="1"/>
<eLiterals name="Biography" value="2"/>
</eClassifiers>
</ecore:EPackage>
89
Appendix H: Source Code for Demo Script
function createDemoWindow()
{
var root = svgdoc.documentElement;
demoWindow = new Window("Demo: click the arrow to continute.");
root.appendChild(demoWindow.container);
demoWindow.contents = new Container(null);
demoWindow.add(demoWindow.contents);
demoWindow.setVisible(false);
demoWindow.background.style.setProperty('fill-opacity', 0.9);
demoWindow.contents.background.style.setProperty('fill', 'none');
demoWindow.contents.layoutManager = new CellLayout(1, null, null, 10);
demoWindow.container.setAttributeNS(null, 'transform', "translate(400,630)");
var g = svgdoc.createElement("g");
var node=svgdoc.createElement('text');
node.setAttribute('x','40');
node.setAttribute('y','13');
node.setAttribute('id','demoText');
node.setAttribute('style','text-anchor:middle;font-size:15;font-family:Arial;fill:black');
texte=svgdoc.createTextNode("Right click and choose\"Control Panel\". ");
node.appendChild(texte);
var r = svgdoc.createElement("polygon");
r.setAttribute( "points", "32,40 62,40 62,32 82,50 62,68 62,60 32,60 32,40");
r.setAttribute( "fill", 'lightgreen');
r.setAttribute('fill-opacity', 0.3);
r.setAttribute('id','demo1');
r.style.setProperty("stroke", "lightblue");
r.style.setProperty("stroke-width", "2");
r.addEventListener('click', demo, false);
g.appendChild(node);
g.appendChild(r);
demoWindow.contents.add(g);
demoWindow.doDeepPreferedLayout();
};
90
function demo(evt){
var node = evt.target;
var str = node.getAttribute('id');
id = str.substring(4,str.length+1);
switch(id){
case '1':
populateControlWindow();
g = svgdoc.getElementById("demoText");
g.firstChild.setData("Click the black circle to take a snapshot.");
break;
case '2':
new snapShotCommand(graph).execute();
g = svgdoc.getElementById("demoText");
g.firstChild.setData("Click on menu \"select dead node\".");
break;
case '3':
new SelectDeadCodeCommand(graph).execute();
g = svgdoc.getElementById("demoText");
g.firstChild.setData("Collapse all dead nodes.");
break;
case '4':
new collapseCommand(graph).execute();
g = svgdoc.getElementById("demoText");
g.firstChild.setData("Click the black circle to take a snapshot.");
break;
case '5':
new snapShotCommand(graph).execute();
g = svgdoc.getElementById("demoText");
g.firstChild.setData("Select a node.");
break;
…
}
91
Appendix I: Export SVG from Rigi
Export of the SVG graph is accomplished with Rigi's built-in scripting capabilities.
Rigi can be programmed with the Tcl scripting language, which provides an extensible
core language and was designed to be embedded into interactive windowing applications.
Via Tcl, Rigi's internal graph data structure can be conveniently accessed and
manipulated. We wrote a Tcl script with about 200 lines of code that adds an additional
pull-down menu to Rigi's GUI (see the following image), and extracts the relevant
information from the internal graph data structure and outputs it into an intermediary Rigi
View Graph (RVG) file.
The information in the RVG file is then transformed to an SVG document. This is
accomplished with a Perl script (rvg2svg) of about 650 lines of code. The rvg2svg script
uses Ronan Oger's SVG-2.0 module. The module provides an API to create SVG
elements along with their attributes, to nest them properly, and to finally output indented
XML code. The following Perl snippet shows how graph nodes are translated to SVG
<circle> elements:
92
# include Oger's SVG module
use SVG;
# instantiate new SVG document
my $root = SVG->new( -indent => ' ',
...
onload => "DoOnLoad(evt)" );
...
# create a SVG group element that contains the graph nodes
my $nodes_group =
$root->group ( id => "nodes",
onmouseover => "DoOnMouseOverNode(evt)",
onmouseout => "DoOnMouseOutNode(evt)",
"font-size" => $font_size,
style => "stroke:black;stroke-width:1;opacity:1.0;" );
# iterate over all nodes in the Rigi graph and
# generate SVG <circle> elements for each node
my $node;
foreach $node ( keys %{$rvg->{nodes}} ) {
my $x = $rvg->{nodes}{$node}{x};
my $y = $rvg->{nodes}{$node}{y};
...
# create SVG <circle> element
my $circle =
$nodes_group->circle( id => $node,
cx => $x,
cy => $y,
... );
}
...
# output XML
print $svg->xmlify( "-in-line" );
93