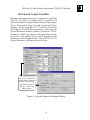
1
for the final transverse phase-space plots. DPMF (deg)
and DWMF (keV) are the axes for the final longitudinal
phase-space plots. XM (mm) and XPM (mrad) are the
axes for the projection phase-space plots.
The following equations are used to initially estimate
values for the TRACE 3-D graphics scales:
XMI = GraphScale1*SQRT((Betah)*(Emith)),
XPMI = GraphScale1*SQRT((Gammah)*(Emith)),
where Gammah = (1.0 + Alphah**2)/Betah.
Refer to subheading 9.5 from Section
9 “Input Variables” of the TRACE
3-D Documentation.
Emith, Alphah and Betah are the current values for these
input parameters shown in the Initial Beam Piece window.
This is repeated for the vertical plane, and the larger of
the two values of XMI and XPMI are used. Similarly for
the longitudinal plane
DPMI = GraphScale3 *SQRT((Betaz)*(Emitz)),
and
DWMI = GraphScale3*SQRT((Gammaz)*(Emitz)),
where Gammaz = (1.0 + Alphaz**2)/Betaz),The same scaling
is done for the final graphics scales (XMF, XPMF, DPMF
and DWMF, which set values for the boundaries of the
final phase-space plots).
The profile and projection graphics scales are set as
and
YM = GraphScale2*larger(XMI,XMF),
DPP = GraphScale4*larger(DPMI,DPMF),
XM = GraphScale2*larger(XMI,XMF),
XPM = GraphScale4*larger(XPMI,XPMF).
The values used for the GraphScale factors are:
GraphScale1 = 2.0
GraphScale2 = 1.2
GraphScale3 = 2.0
GraphScale4 = 1.2
Element Options
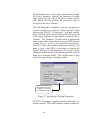
The Element tab panel in the TRACE 3-D Options
Window allows the user to specify the PMQ step size and
fringe field extension factor and select an option for the
use of Thin Lens chromatic aberrations.
56