1
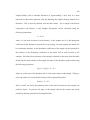
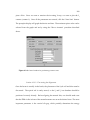
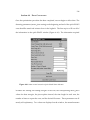
191 APPENDICES Appendix A: DND-CAT BEAMLINE PROCEDURES The following appendix is to be used a guide for collecting Continuous Scan-XAS data at DND-CAT using the standard spectroscopic grade ionization chambers and the Lytle detector. The sections below will cover procedures used to make standards for transmission experiments, to setup the experiments at the beamline, to optimize the beamline (what to do before collecting data), to collect data, and to process data. Further information on data processing using the SAMXAS software can also be found in Appendix B. Section A.1 PREPARATION OF TRANSMISSION STANDARDS Reference compounds or standard compounds used in EXAFS analysis should generally be prepared for transmission. The reason for using transmission is because the quality of the data is generally better, and since one is not generally sample limited, the samples are easy to prepare. It also likely that any reference compound prepared is likely to be relatively concentrated, and thus is prone to problems with what is termed selfabsorption problems. Self-absorption effects can include a significant decrease in the amplitude of EXAFS oscillations and broadening of edge features. Even samples prepared as powders spread “thinly” on Kapton tape are likely to have absorption problems. The only times this method is suggested is when the standard compound is 192 either relatively dilute in the matrix or is available in only a few milligrams. This section will describe the theory and practice of constructing transmission samples. The following procedure dilutes a small amount of the sample into a background matrix and assumes that the X-ray absorption coefficient (µmetal) of the metal standard is much larger than the absorption coefficient of the matrix (µmatrix). If µmetal of the sample is comparable with µmatrix, the matrix will contribute substantially to background noise. This background noise is the nonspecific absorption of the matrix. For this reason, a suitable inert matrix, such as boron nitride (BN) should be used for transition metal standards. This is a good choice for the matrix, as it is nearly transparent to X-ray energies used for transition metal XAS experiments. A good sample for transmission must be uniform, with the compound of interest ground to a size smaller than its characteristic absorption length. Typically, this will be less than 4 µm. The McMaster tables are a useful tool for calculating the absorption coefficients and lengths of various metals and can be found online at the Center for Synchrotron Radiation Research and Instrumentation web site at http://www.csrri.iit.edu/periodic-table.html. 2 -1 The absorption by a sample with absorption coefficient mS (cm g ) and thickness L is related to the ratio of the incident (I0) and transmitted (IT) intensities by (-mSρL) = ln(IT/I0), where ρ is the density of absorber in the sample. Practical considerations have shown that the optimal transmission sample absorbs between 90% to 96% of the incident beam, i.e., the product mSρL is between 2.3 and 2.6. Samples are often prepared in 193 sample holders with a standard thickness of approximately 1 mm, thus it is most practical to achieve this optimum value by adjusting the sample's density instead of its thickness. This is done by dilution into the inert matrix. For a sample with known composition and density, µS (the samples absorption) can be calculated using the following summation: µS = Σi fiµi where fi is the mole fraction of each element i in the sample and µi is the absorption coefficient of that element at a particular X-ray energy. In most samples, the metal will be a dominant absorber, so the absorption coefficient of the sample can be expressed as the product of the absorption coefficient of the metal and its mole fraction in the samples. Since the effective density of the sample is defined as the mass of the absorber divided by the total volume of the sample, the mass of the absorber can be found using the following expression: (µSρL) = (µSmaL) / Vt = 2.3 where ma is the mass of the absorber and Vt is the total volume of the sample. Taking µS to be equivalent to fµ of the metal of interest, this expression becomes: (fµmaL) / Vt = 2.3 Since Vt and L are fixed, the optimum mass of the metal of interest in the sample can easily be found. In practice, the mass of the sample and the inert matrix are mixed uniformly and then placed into the sample holder. 194 Section A.2 BEAMLINE EXPERIMENTAL SETUP Section A.2.1 Initial Setup The general experimental layout of an EXAFS experiment is shown in Figure A.2.1. It consists of ionization detectors to measure the incident and transmitted intensities and a fluorescence detector (such as a Lytle cell) placed perpendicular to the beam. The sample is oriented at a 45 degree angle to the incident beam to simultaneously maximize the illuminated area and the fluorescing regions of the sample. IF Monochromator Slits I0 Sample IT Synchrotron Figure A.2.1: XAS experimental setup, showing relative positions of equipment. Not to scale. The ion chambers should be positioned and aligned in their appropriate places on the beamline optical component rail. The I0 detector is 10 cm long, whereas the IT detector is 20 cm long. Future upgrading of the CS-XAS hardware will allow the placement of a second transmission ion chamber. This will enable the simultaneous measurement of a 195 standard calibration foil during the data collection. The Lytle cell is placed on a series of optical lab jacks in order to position it at the level of the beam. Fine-tuning of this placement must be performed later with burn paper to ensure that the detector is set properly, without any clipping of the incident beam. The manual slits are placed directly in between the beam entrance to the hutch and the I0 ion chamber. However, these slits should not be installed in the beamline until the optimization procedure has been completed. Section A.2.2 Electronics Configuration Once the detectors are placed on the beamline, they must be connected to the power supplies and amplifiers. The DND-CAT ion chambers have two connectors, a BNC plug for the signal and a SHV plug for high voltage (HV). The BNC output from the ion chamber connects as input to the SRS-570 current amplifier. The output of the SRS-570 is branched in parallel to provide signal to both the CS-XAS data acquisition system and to the conventional counters. One branch of the BNC T-plug goes the patch board that connects to the analog to digital converter (ADC) on fava. The other output branch goes to the 4-channel voltage-frequency converter on the electronics stack. The output of the V-F converter connects to the appropriate patch (I0 or IT) to exit the hutch. The SHV cord from the ion chamber connects to the ORTEC 478 HV power supply. The power supply should always be powered down whenever connections are being made. Once connected, set the supply to approximately 1100 V by moving the switch to 1 kV 196 and the potentiometer to 100 V, and then turn the power on. The Lytle cell has its own internal battery, and does not require an external power source. The output of the Lytle cell (the middle BNC connector) connects to the appropriate SRS-570 amplifier. It is important to insure that the “INVERT” button is lit on this amplifier to measure the proper signal amplitude. The INVERT switch must be checked whenever the amplifier is turned on or the Protoscan program is restarted. Section A.2.3 Ion Chamber Fill Gasses A critical requirement for acquiring good quality results is to have the proper fill gasses in all of the ion chamber detectors. The ionization chamber detectors consist of a gasfilled, cylindrical container in which an electric field is maintained by applying a voltage between two plates. When an X-ray photon enters the chamber, it converts some of the gas molecules to positive ions and electrons. Under the influence of the electric field, these particles migrate to the plates and cause an observable current to flow through the circuit joining these elements. In order to work properly, the right combination of gasses must be used to absorb the energy of X-rays entering the detector. Ideally, a good rule of thumb to follow for the bending magnet beamline (5BM) is that I0 should absorb about 10-15% of the incident beam, whereas IT and IF (Lytle detector) should absorb 9095% of the X-rays. On the undulator (5ID), the flux is so high that both I0 and IT should be filled with 760 torr of He. Once again, the ratio of the transmitted beam can be expressed by IT/I0 = exp(-µρL) where µ is the X-ray absorption coefficient, ρ is the gas density and L is the path length of the detector. For mixtures, one needs to consider the 197 sum of each of the fractional absorption components in the chamber. Another useful Internet site exists for these calculations on the PNC-CAT web server at http://www.pnc.aps.anl.gov/cgi-bin/gasmix_cgi.pl. Using this utility, given a photon energy and path length, the absorption of a single gas or the mixture of two gasses to provide the desired absorption will be calculated. This page is extremely useful to have open when initially setting up the beamline. Table A.2.1 below gives compositions of I0 and IT used for various elements that are relevant to environmental studies. Element, edge energy (eV) Manganese, K 6540 Iron, K 7112 Zinc, K 9669 Arsenic, K 11868 Lead, L III 13055 Cadmium, K 26711 I0 25 torr Ar 30 torr Ar 60 torr Ar 125 torr Ar 90 torr Kr 125 torr Xe 735 torr He 730 torr He 700 torr He 635 torr He 670 torr He 635 torr He IT 245 torr Ar 515 torr He 320 torr Ar 440 torr He 780 torr Ar 193 torr Xe 566 torr He 245 torr Xe 515 torr He 1200 torr Xe IF Ar Ar Kr Kr Xe Xe Table A.2.1: Ion chamber fill gas ratios for various environmentally relative elements. Desired gas combinations can be easily filled using the DND-CAT gas manifold. Ion chambers should not be filled above a total pressure of 1400 torr to avoid blowing out the Kapton windows. The Lytle cell is markedly different from the incident and transmission ion chambers. The Mylar windows on the detector are especially fragile and can be stressed and stretched at pressures over ¼ psi. When the Mylar is stretched, it can be subject to 198 acoustic vibrational flutters that add undesirable noise to the signal. The process to fix the detector is particularly long and arduous, thus the operator should be very careful when using this detector. The filling gas in the Lytle cell is nearly always used as a single noble gas rather than mixtures for this reason, as mixtures would require pressurizing the Mylar window. At lower X-ray energies, argon can be used in a flowthrough mode. This is best for the K edges of manganese, iron, and cobalt. Argon may be used for the K edge of zinc as well if other gasses are not available. It is advisable to always use the pressure relief valve assembly constructed by the DuPont EXAFS people. This setup consists of a needle valve after the regulator and set of two relief valves that connect to the detector gas inlet of the Lytle cell. A second needle valve assembly connects to the gas outlet of the Lytle cell. The flow from the regulator should be at the absolute minimum to allow gas to flow out of the tank, with the flow of gas controlled by the two needle valves. The flow should be at a point where it can just barely be detected against the moistened lips or heard in one’s ear at close range. If gas can be heard escaping the relief valves, then the flow is set much too high. At the middle to high end of X-ray energies, heavier gasses such as krypton or xenon must be used to absorb a significant fraction of the fluorescent X-rays. Krypton is ideal for the zinc K edge, whereas xenon should be used for the K edge of cadmium and L edges of lead. Since these gasses are extremely expensive, they must be used in a stopfill mode. Thus, the Lytle cell must be refilled at regular intervals. The setup is the same as previously, but the needle valves closed at the same time to keep the filling gas in the 199 chamber. It is also advisable to turn off the gas at the cylinder to prevent any leakage of the gas during data collection. Section A.2.4 Computer Setup Once the beamline is setup and the ion chambers filled with the appropriate gas mixtures, one can proceed to initialize the beamline control software. Two computers are used in the acquisition of CS-XAS data, daikon (5BMD beamline) and fava (inside the hutch). Other computers (such as lime or lemon) may be used in place of daikon if data are collected on the 5ID beamline. Two programs are absolutely critical in order to collect quick-EXAFS data. These are the beamline control program (protoscan) and the quick-EXAFS interface. In a terminal window on daikon, first start the beamline control program by typing protoscan at the UNIX prompt. This will launch a series of windows: protoscan control window, SRS570 settings, protoplot controls, and the shutter controls. In a new terminal window on daikon: cd QEXAFS cd control ./QXAFS This will bring up the CS-XAS interface. In yet another terminal window on daikon, ftp to fava1.dnd.aps.anl.gov. The username is dtfifo, but the password changes on a regular basis. From the ftp prompt, put .Xauthority which transfers the file needed for X-windows display on fava. After exiting from ftp, now telnet to fava1. This 200 telnet interface is useful for file management and processing. It is generally preferred by the author to have three of these telnet sessions open at a time: one for file transfer, a second for data processing, and a third for data plotting. Once these windows are open, the beamline is ready for optimization. Section A.3 BEAMLINE OPTIMIZATION Optimization of the beamline consists of making sure that light is entering the hutch, aligning the slits and Lytle cell properly, as well as setting up the proper amount of detuning for a quick-EXAFS scan. The principles are very similar between the bending magnet (BM) and undulator beamlines (ID), although some of the terminology is different. For this reason, the optimization routines are broken into specific sections for each beamline. Section A.3.1 DND-CAT 5BM Section A.3.1.1 Finding the Beam The first step is to ensure that the beam is entering the hutch. Although this may seem trivial, it can often be time consuming, depending on what the last user was doing. The first step is to set the monochromator to the starting energy of the scan using the protoscan program (See Figure A.3.1 for a screenshot). EXAFS scans usually cover 200 eV before the edge of the metal of interest and extend for 800 to 1000 eV beyond the edge. Clicking on the “Monochromator Control” button in the protoscan window creates a window that controls the monochromator (Figure A.3.2). Energies can be 201 Figure A.3.1: Main program window of protoscan. entered directly or by using the buttons to raise or lower the energy by increments of 50, 100, or 200 eV. The “Edge Energy” button selects the energy that is entered in the textbox in the main protoscan screen. Once the new monochromator energy is entered in the box, clicking “Move Mono” will set the crystals in motion. Again, it is unlikely that just by placing the monochromator at your desired energy that X-rays will actually be entering the hutch. The next step is to adjust the monochromator piezo to allow beam to pass through the crystals. An explanation of what exactly the piezo is and why we use it is given in Section A.3.1.3 There are three basic ways to set the piezo for this purpose. The first is to simply look in the logbook for the last piezo used for the desired energy! This method, although the easiest, is not very reliable as 202 considerable drift can occur in these settings from hour to hour, never mind month to month. The other two methods both involve scanning the piezo until intensity can be detected in the hutch. This can be done either with the ionization chamber detectors or with a fluorescent screen. If a screen is used, it must be taped at the beginning of the I0 detector and monitored with a properly placed TV camera. When the hutch is searched and closed, the inside lights should be turned off. The light switch is on the outside of the hutch to the right of the lead doors. This aids viewing the fluorescence from the screen. The mono piezo can be changed by clicking the “Move Actuator” button from the main protoscan screen (Figure A.3.1), creating the “5BM_Control” window (Figure A.3.3). A list of all the actuators and their current values are given. The value of the actuator can be changed by clicking on the “Move” button next to the desired actuator. A dialog box is then created which prompts for the new value. For the purposes of finding the beam, a pseudo trial and error process is used. After entering a value for the piezo, watch the screen for the beam. Since the piezo moves rather slowly, the value of the piezo for the brightest condition can be noted from the “BM_Control” window. The rest of the alignments should be carried out a piezo value where there is high intensity (i.e., reset the piezo at the end to where the screen fluoresced the most). 203 Figure A.3.2: Interface window for changing the monochromator energy. Figure A.3.3: Control window for the bending magnet actuators. If a camera is not readily available, the mono piezo can be scanned using the ion chambers. Scanning of the piezo is begun by clicking on the “Scan Actuator” button in the main protoscan screen (Figure A.3.1), which creates the “mscan” window (Figure A.3.4). In this window, the radio button corresponding to the mono_piezo actuator is selected, and the ranges and increments to scan from entered in the boxes below. It is recommended to only scan for one second per point and move at increments of 100 204 piezo clicks. Since we want to monitor the incoming X-rays, we want to plot the I0 counter (counter 1). Once all the parameters are entered, click the “Start Scan” button. The protoplot display will graph the data in real time. The maximum piezo value can be selected from the graph and set by using the “Move Actuator” procedure described above. Figure A.3.4: Control window for performing actuator scans. Section A.3.1.2 Fine-tuning the Alignments Once the beam is actually in the hutch, the placement of the Lytle cell and slits must be fine-tuned. The optical rail is rarely moved, so the I0 and IT ion chambers should be positioned correctly already. Before aligning the manual slits, one should make sure that the 5BM-A slits in front of the monochromator are set at the desired sizes. The most important parameter is the vertical slit gap, which partially determines the energy 205 resolution. Decreasing the slit spacing allows a smaller range of angles (and thus energies) from the bending magnet source to be accepted by the monochromator crystals. The resolution determined by these slits is important, especially if the experiment is designed to examine small resonances in the XANES region. If the slits are too wide, these features will become broadened due to the wider range of incident energies, and may be completely wiped out. However, narrowing the gap too much decreases the flux detrimentally. A balance must be struck between the desired resolution and flux on the sample. Typically, these white beam slits are set to 1 mm vertical gap. The horizontal gap can be set at whatever value is appropriate for your samples, typically around 5 mm. These settings are changed in the “Move Actuators” screen of protoscan. From the main program screen of protoscan, click the “Move Actuators” button. Again, this brings up the list of the actuators that can be moved (Figure A.3.3). The white beam slits are labeled as “wbslit_vergap” and “wbslit_horgap” for the vertical and horizontal gaps respectively. Clicking the “Move” button next to the actuator will spawn a dialog box where the new value can be entered. There are also actuators for the position of the gaps, “wbslit_verpos” and “wbslit_horpos”. Once the desired gap sizes are set, the slits must also be centered on the center of the beam. From the main program screen of protoscan, choose “Scan Actuator”. This opens a dialog box, shown in Figure A.3.4. To optimize the positioning of the slits, choose one of the white beam position actuators and scan over several millimeters. For example, if wbslit_verpos is set at 0.2 mm, and has a gap of 1 mm, then a positioning scan should start at –1 mm and extend to 1.5 mm 206 with a step size of 0.05 mm. For this purpose, the I0 counter should be monitored, which is counter 1. Before starting the scan, make sure that the hutch is searched and closed and that the shutters are open. Once the scan begins (it may take awhile to begin, as the actuators must move to the initial position) a plot of the actuator position on the x-axis and I0 counts on the y-axis will be produced in the protoplot window. The maximum intensity should be chosen as the desired setting for the actuator position. This can then be set as described above using the “Move Actuators” command. Tape burn-paper at the front end of the manual slits and position the slits on the optical rail. Search and close the hutch, opening the 5BM-D shutters for about 30 to 45 seconds. Once the burn is complete, close the shutters (5BM-D) and remove the slits from the rail. When illuminated by room lights, a spot should develop on the burn-paper showing where the beam is located on the slits. One can now narrow the vertical and horizontal manual slits to achieve the desired beam spot size. It is typically recommended to have a vertical size of approximately 1 to 2 mm and a horizontal size of 5 to 10 mm. Now with the slits in place on the optical rail in front of I0, tape burn-paper to the front opening of the Lytle cell. Again, search and close the hutch, and expose the burn-paper. Once the burn is complete, make sure that the beam position is in the center of the Lytle cell opening. Manually adjust the vertical and horizontal positioning as necessary. It may be useful to mark the position of the Lytle cell alignment on the lab-jack so it either will not move or can be easily re-aligned if bumped. Next, tape burn-paper to the sample holder plate in the Lytle cell. Take another burn. You will want to mark the position of the beam on the sample holder so that the desired sample area can be 207 illuminated. Place tape on each of the edges of the sample holder and make marks with a Sharpie to delineate the beam position in the plane of the sample. At this point, the alignment should be set for the desired energy. When switching energies over a large energy range (e.g., changing from Mn EXAFS to Cd EXAFS) the vertical position of the beam may change slightly, and the beam alignment on the Lytle cell sample holder should be checked. Section A.3.1.3 Harmonic Rejection by Monochromator Detuning The first question one might ask is why do we want to detune the monochromator from its maximum flux? This is done to achieve harmonic rejection. The double crystal monochromators used with hard X-ray synchrotron sources may simultaneously satisfy multiple orders of diffraction. Bragg’s Law is given by: nλ = 2d sinθ where λ is the wavelength, d is the lattice plane spacing of the crystal, and θ is the Bragg angle. Thus, multiple n lead to multiple wavelengths allowed by the crystal. The fundamental mode is such that n=1, and the harmonics are n such that n>1. X-rays corresponding to the harmonics have energies that may interfere with data collection, thus these should be removed prior to gathering data. In order to reject higher order harmonics, the monochromator on the bending magnet beamline is detuned. The angular widths of the diffraction conditions (i.e., rocking curves) for higher n are smaller than for the fundamental (n=1). This means that the fundamental will be allowed over a greater range of angular deviations from the Bragg condition than the harmonics, with 208 each higher order harmonic being narrower than the last. Reducing the parallelism of the crystals of the monochromator significantly diminishes the intensity of higher orders of diffraction, while having minimal impact upon the intensity of the first order. Thus, “detuning” causes the first monochromator crystal to be rotated off of the Bragg condition enough to greatly reduce the intensity of higher n, while maintaining much of the intensity of n=1. Detuning is accomplished in practice at DND-CAT on the bending magnet beamline by adjusting a piezoelectric transducer that pushes one of the crystals off the ideal Bragg condition. It is important to check that the mono piezo is optimized on a regular basis. It is particularly important whenever there is a fill of the storage ring at the APS. The piezo value is nearly always guaranteed to change as well as being unstable for at least half an hour after the fill. A typical detuning procedure will be performed at both the first and last energies of the EXAFS scan. It is important that the manual slits in the hutch are not installed for this scan. 209 Before the scan is performed, the amplifier gains must be set correctly. If set too high, the scan will show a saturation of counters. Saturation occurs at about 650,000 counts per second (cps). For the purposes of detuning, fine tuning of the gains is not required, Figure A.3.5: SRS-570 Amplifier control window. but saturation must be avoided. The gains can be changed within the “SRS-570 Display” window that protoscan initiates upon startup (Figure A.3.5). Each counter has its independent amplifier controls. Gains can be set from 1 pA/V up to 1 mA/V. Typical bending magnet settings will have counter 1 with amplifier gains of around 20 nA/V with the manual slits in place and up to 500 nA/V with the slits removed. The gain can be changed by clicking on the counters “Gain” button, which brings up a selectable list of gains to choose from (Figure A.3.6). After changing the gain, the count rate can be monitored in the main protoscan window (Figure A.3.1). 210 Since some noise will always be present in the system, the current offsets must also be set correctly. If the offsets are set too low, the counters will read “0” when signal is present. If set too high, the counters will saturate too early. With the shutters closed, the count rate of each of the detectors should be in the range of 100 to 500 cps. If the Figure A.3.6: SRS-570 amplifier control window showing the selectable list of gains. counter is outside of this range, click the “Current Offset Range” button and choose a different range from the list. Fine-tuning of the offsets can be accomplished by clicking on the “Current Offset” button. A slider box is created which allows a new offset current to be downloaded to the amplifiers. This process is not always immediate, so sufficient time should be allowed for the display to change before downloading a new offset again. When the monochromator is set at the appropriate energy, select “Scan Actuator” from the protoscan main program window. This brings up a dialog box that allows the 211 “mono_piezo” to be selected for a scan (Figure A.3.4). The I0 counter (counter 1) should be selected for plotting, and a range of about 5000 “clicks” selected. Often several scans of the actuator are performed in order to find the correct range. Once the scan is initiated (make sure the hutch is searched and the shutters open) the monochromator rocking curve will be plotted in the protoplot window. The harmonics will be eliminated at approximately 60% of the maximum value of the curve. The proper way of determining the amount of detuning is to place a sample of the element of choice in the beam while sitting at an energy below its absorption edge. The fluorescence at this point is due solely to higher order harmonics exciting the sample. Monitoring the fluorescence of the sample at different degrees of detuning will show a decrease of fluorescent photons, as the harmonics at higher energy are reduced. Once the fluorescent signal plateaus, the harmonics are eliminated. One can set the detuning on either side of the rocking curve. It is advisable to attempt to check both values, as monochromator glitches may be better/worse on one side or the other. The approximate value for I0 should be determined from the rocking curve graph. For example, if the maximum of the rocking curve was approximately 420,000 cps, then the monochromator should be detuned to about 250,000 cps. Make sure that the rocking curve has no plateaus at the maximum. This signals that the amplifier gains are set incorrectly, and that the detectors have been saturated. The maximum count rate for the DND-CAT counters is approximately 650,000 counts per second. Setting the mono piezo is accomplished by the “Move Actuators” button from within the protoscan main program. Changes to the mono piezo value can made from the dialog box while 212 watching the real-time display of the counters in the protoscan window. Once the detuning procedure is complete, the manual slits should be reinstalled on the optical bench. Also, note that this will decrease the intensity of the beam, so the amplifier gains will need to be reset again. Section A.3.2 DND-CAT 5ID Section A.3.2.1 Finding the Beam The first step is to ensure that the beam is entering the hutch. Although this may seem trivial, it can often be time consuming, depending on what the last user was doing. The first step is to set the monochromator to the starting energy of the scan using the protoscan program (See Figure A.3.1 for a screenshot). EXAFS scans usually cover 200 eV before the edge of the metal of interest and extend for 800 to 1000 eV beyond the edge. Section A.3.2.2 Fine-tuning the Alignments Once the beam is actually in the hutch, the placement of the Lytle cell and slits must be fine-tuned. The optical rail is rarely moved, so the I0 and IT ion chambers should be positioned correctly already. Before aligning the manual slits, one should make sure that the 5ID-A slits in front of the monochromator are set at the desired sizes. The most important parameter is the vertical slit gap, which partially determines the energy resolution. Decreasing the slit spacing allows a smaller range of angles (and thus 213 energies) from the undulator source to be accepted by the monochromator crystals. However, narrowing the gap too much decreases the flux detrimentally. Typically, these white beam slits are set to 1 mm vertical gap. The horizontal gap can be set at whatever value is appropriate for your samples, typically around 1-3 mm. These settings are changed in the “Move Actuators” screen of protoscan, as described in Section A.3.1.2 Tape burn-paper at the front end of the manual slits and position the slits on the optical rail. Search and close the hutch, opening the hutch shutters for about 2 to 5 seconds. The flux of the beam on the undulator is much higher than the bending magnet, so shorter exposure times are necessary. Once the burn is complete, close the shutters and remove the slits from the rail. When illuminated by room lights, a spot should develop on the burn-paper showing where the beam is located on the slits. One can now narrow the vertical and horizontal manual slits to achieve the desired beam spot size. It is typically recommended to have a vertical size of approximately 1 to 2 mm and a horizontal size of 5 to 10 mm. Now with the slits in place on the optical rail in front of I0, tape burn-paper to the front opening of the Lytle cell. Again, search and close the hutch, and expose the burn-paper. Once the burn is complete, make sure that the beam position is in the center of the Lytle cell opening. Manually adjust the vertical and horizontal positioning as necessary. It may be useful to mark the position of the Lytle cell alignment on the lab-jack so it either will not move or can be easily re-aligned if bumped. Next, tape burn-paper to the sample holder plate in the Lytle cell. Take another burn. You will want to mark the position of the beam on the sample holder so 214 that the desired sample area can be illuminated. Place tape on each of the edges of the sample holder and make marks with a Sharpie to delineate the beam position in the plane of the sample. At this point, the alignment should be set for the desired energy. When switching energies over a large energy range (e.g., changing from Mn EXAFS to Cd EXAFS) the vertical position of the beam may change slightly, and the beam alignment on the Lytle cell sample holder should be checked. Section A.3.2.3 Harmonic Rejection on the Undulator As described in the bending magnet section, higher-order harmonics are important to eliminate from the beam. This can be done in two ways on the 5ID beamline: by detuning the monochromator or harmonic rejection by mirrors. Since the critical angle of reflection decreases with X-ray energy, one can set up a curved mirror to reflect a range of energies down the beam line, but stop any radiation above a certain energy cutoff. Thus, mirrors can be employed to obtain complete harmonic rejection with minimal loss of the fundamental compared to standard monochromator detuning. However, the process to align the mirrors properly is more difficult and not automated as of yet. In addition to setting the mirrors for harmonic rejection, the taper of the undulator must also be set. The source characteristics of the undulator are such that it produces a very intense, narrow bandwidth of X-ray energies. This is because the X-rays emitted from the series of magnets constructively and destructively interfere. Thus, there are narrow, 215 harmonic bands of intense radiation separated by empty gaps. This is in contrast to the bending magnet source characteristics, which produces a broad, white-beam spectrum of X-ray energies. However, the fundamental harmonic from the undulator is too narrow to complete an entire EXAFS scan. That is, the scan energy range is larger than the peak width of the undulator source. Thus, without any modification to the normal source characteristics, the I0 intensity would vary too much to be useful in obtaining good EXAFS data. The undulator gap (which controls the energy emitted) could also be moved during the scan, but the mechanical noise involved in this is also undesirable. The solution to the problem is to apply a taper to the undulator gap. By increasing the gap size by a few millimeters at one end of the undulator, the spectrum of a harmonic can be broadened. Additionally, the broadening increases with higher order harmonics, so that at high taper values (e.g. 4 mm), the harmonics may merge together and form a continuous spectrum. Application of a taper lowers the brilliance and increases the angular distribution of the beam, but these effects are relatively minor for EXAFS experiments. 216 Section A.4 DATA COLLECTION Once the optimization procedure has been completed, one can begin to collect data. The detuning parameters (mono_piezo setting) at the beginning and end of the quick-EXAFS scan should be noted and written down in the logbook. The first step is to fill out all of the information in the quick-EXAFS window (Figure A.4.1). The information required Figure A.4.1: Main control screen for Quick-EXAFS data collection. includes: the starting and ending energies of the scan, the corresponding mono_piezo values for these energies, the piezo update interval, the time length for each scan, the number of times to repeat the scan, and the desired file name. These parameters are all mostly self-explanatory. Two values are displayed on the window, the monochromator 217 speed and the piezo interval increment. Care must be taken when choosing the piezo update interval to insure that the piezo increment is non-zero. The update interval tells the computer how often to tell the piezo to move during the scan. If this value is too big, large steps will appear in the I0 data. However, if the update interval is too small, since the increment is an integer value rounded from the difference in starting and ending piezo divided by the update interval, the piezo will not move at all. A typical scan has an update on the order of a few seconds with an increment of 3 to 10. All data files are saved under the /home/dtfifo directory on fava with increasing file names. For example, if the file name provided is zns, the files saved will be zns_00001.dat, zns_00002.dat, and so on. When data is collected with the Lytle cell, it is important to realize that the detector is not energy discriminant. Although the filling gas is optimized for the fluorescent X-ray range of choice, X-rays from other elements in the sample and from Compton and elastic scattering will also add to the total ion current. The contribution of these effects can be reduced by filtering to preferentially absorb scattered X-rays, which can be a principal source of noise in EXAFS experiments. The main component of a fluorescence filter is an element that has an absorption edge that lies between the strongest fluorescent X-rays of the sample and the absorption edge of the element being studied. The filter ideally absorbs strongly any scattered radiation, and only slightly attenuates the signal. This is normally accomplished by using filter composed of atomic number one less than that of the sample, i.e. a “Z-1” filter. For example, when examining a zinc (Z=30) sample, one would use a copper (Z=29) filter. Copper has an absorption edge at 8979 eV so it will 218 absorb X-rays greater than its edge while allowing the zinc Kα fluorescence at 8630 eV to pass. At DND-CAT, a set of Lytle filters are provided for use that contains filters from vanadium through selenium, appropriate for most transition metal elements. The filters come in two “sizes”, Z3 and Z6. These provide different degrees of attenuation with 3 and 6 absorption lengths of the filter element respectively. Before the scans are started, the manual slits that were removed for detuning must be reinstalled on the optical bench. Once the filters are in place the sample can be placed in the Lytle cell. The Kapton encased sample is normally taped to sample holder in such a manner to align the desired section of the sample with the beam. Care should be taken to avoid moving the Lytle cell while changing samples, which will skew the alignment. The amplifier gains should be checked before submitting any scan, as an incorrect setting can lead to useless data. The values should always be recorded in the logbook for each sample. During EXAFS scans, the gains should be set so that I0 is between 200,000 to 250,000 cps. IT should be set to show 300,000 cps in the pre-edge and above 40,000 cps after the edge. IF should be at a minimum before the edge (check at 50 to 100 eV before the edge), and not over 300,000 cps after the edge (again, about 50 to 100 eV over the edge). A “good” EXAFS scan will have at least 100,000 cps difference between the pre-edge and post-edge regions. Gains of 2 pA/V and 5 pA/V are also undesirable, as they tend to be excessively noisy (but may be necessary for dilute samples). These gains and offsets may be set in the same manner as described in Section A.3.1.3 219 After the amplifier gains have been checked for the sample and recorded, the scan can be submitted. Always check to make sure that the filename in the quick-EXAFS window is unique and that the piezo settings are correct. The CS-XAS scans are started by pressing the “Start Scans” button. If a problem occurs during the run (i.e. if the beam dumps or if one wished to stop the scans) the process can be terminated by pressing the “Abort After Current Scan” button, which will stop data collection as soon as the current scan finishes. There is always a time lag between scans for the data to be dumped from the data acquisition card on fava and for the monochromator and piezo to reset. When all the scans are completed, data processing can begin. Section A.4.1 Troubleshooting Q-EXAFS Crashes Experience has shown that occasionally the scanning software will crash at the end of a Quick-EXAFS scan. At the end of the scan, the computer executes several commands. The first rests the mono piezo and the sends the monochromator back to its starting energy. Then a command is issued to dump the contents of the DTFIFO analog to digital converter to a file on fava. Occasionally, the data dump will crash the software and the computer will not be able to issue a stop command to the monochromator. The first time this occurred, it was very bad! The monochromator continued to rotate until it unplugged several wires internally. This effectively disabled the mono and took many DND staff hours to repair. Hard stops have been installed in the mono to prevent the wires from tearing out, should the computer loose control of the monochromator again. 220 However, one still needs to “retrieve” the mono and return it to a normal operating state. If this situation arises, the following procedure should be used to recover normal operation. First, kill the Q-EXAFS control window (Figure A.4.1). It probably will not close on its own, so use the “kill” function in the application toolbar. Next, try to stop the mono before it goes too far. This can be done through the “Move Actuator” button in the main protoscan window. When the “mscan” window arises (Figure A.3.3), click the “Halt” button under the “mono_ev” actuator. After this is done, the monochromator actuators will probably read some absurdly large energy (in the MeV range!) and some incredibly small angle. Attempts to send the monochromator to the original energy now will take an extremely long time. Go back to a daikon terminal window and restart the Q-EXAFS scanning program. Submit a scan at high energy (around 100 to 150 keV). The monochromator should slowly begin to move to the starting energy. Its progress can be checked through the “mscan” window (Figure A.3.3). Once the scan is completed, the mono should be able to be moved easily and you should find the beamline status is returned to “normal”. This entire process can take from 30 minute to two hours, depending on how “lost” the monochromator was. Before returning to collect data, another rocking curve should be taken and new piezo settings determined (See Section A.3.1.3 ). 221 Section A.5 DATA PROCESSING Data processing is accomplished on many different levels of analysis. The first step of the analysis is often done at the beamline, which consists of the reducing the large binary data files into smaller, more manageable ASCII files. At the beamline, the data can be quickly assessed for quality and general features. The second step of analysis is assisted by the SAMXAS software, developed at Northwestern University. This accounts for data normalization, EXAFS extraction, Fourier transformations, and data fitting. If more sophisticated analysis is necessary, ab initio calculations using FEFF and data fitting with FEFFIT can be performed. Section A.5.1 Online Data Processing Several scripts have been developed to take the large, raw binary data files and decode them into more manageable ASCII data files. These scripts can be run at the same time that data is being collected so that the last scan can be evaluated while a new sample is in the beam. The scripts are run in a shell on fava, which can be opened through a telnet session from daikon. Usually three of these shells are open (my preference), one for file transfer, one for data processing, and one for graphing. The script files should be in many places on fava, and normally are setup in the data processing directories already. There is a unique data directory for each element examined, as some of the programs are element specific, i.e. /data/zn is the directory for zinc data files. The required files to have in the base directory are: ave3e, copymyasset.awk, dofinet, doprocet, loopert, and 222 process3et. These files process the data for both transmission and fluorescence experiments. After the process files are in the correct directory, the first part of the processing is to edit the doprocet to tailor it for the particular scans performed. In one of the terminal windows, type xedit doprocet, which spawns the X-windows editor. If there is an error, the .Xauthority file has most likely not been copied over to fava yet (see Section A.2.4). Most of the values in the script are self-explanatory (such as the edge energy). The starting channel is always zero and its energy value is the starting energy of the scan. Since the A-D converter collects data a 12.5 kHz, the “Value of Channel 2” is 12,500 multiplied by the number of seconds in the scan. Likewise, the energy of this channel is the ending energy of the scan. For most analyses, the constant energy spacing -1 -1 should be at 0.5 eV, k-space resolution at 0.05 Å , with a starting k at 3.0 Å . The reason for these choices is that these values mesh well with the analysis programs, such as SAMXAS, AUTOBK, and FEFFIT. After saving the file, quit out of the editor. The doprocet file must be edited for each element and for every time the length of the scan is changed. If the values are set incorrectly, the data produced by the scripts will have significant errors. Once data are collected, they must be transferred from the /home/dtfifo directory to a data processing directory. Currently on fava there is an extra hard drive installed that should be able to hold most of the data from an entire beamtime allotment. example, For 223 mkdir /data/zn/zns mv zns*.dat /data/zn/zns will move all of the raw data files from a ZnS sample to the /data/zn/zns directory. The data processing is begun by executing the ../loopert <sample name> command within the data directory. Following the example above, once in the /data/zn/zns directory, ../loopert zns will begin processing the first 9 data files. Adjustments can be made to the loopert script if more than 9 data files need to be processed. This script is at core of the processing routine performing the binning procedure, calculating the experimental errors, and producing the intermediate output files. After the script is finished, the directory should contain <fn>.out and <fn>.mu files for each of the <fn>.dat files. averaging. The next script combines these files and performs the This is done by executing ../dofinet <sample name> <# of scans>. Again, following the example of the ZnS sample, the command ../dofinet zns 9 would be executed. The result of this script is a final fluorescence data file, <sample name>.mu, and a transmission data file, <sample name>_t.mu. Processing can be done on both files to compare the differences between the fluorescence and transmission spectra. Usually, transmission is used for standards and very concentrated samples, whereas fluorescence is used in dilute, environmental samples. After the averaging is completed, the data can be plotted using the graphics program of choice. A simple command line based program on the DND-CAT computers is gnuplot. 224 The program is started by typing gnuplot in the terminal window dedicated to plotting. To plot a data file: plot [<Xstart>:<Xend>] with lines ‘<file name>’ using <A>:<B> The <Xstart> and <Xend> are not required, but useful for zooming in on the XANES region when desired. The name of the data file must be in quotes. The using phrase in the command plots column number <A> vs. <B> in the plot. For the <fn>.mu files, the first column is energy, the second is the signal, and the third is the error. Following the examples previously, plot ‘zns_t.mu’ using 1:2 with lines plots the ZnS transmission data file. Several files can be displayed on the same graph using: plot ‘<fn>’ using <A>:<B> with lines, ‘<fn2>’ using <A>:<B> with lines, ‘<fn3>’ using <A>:<B> with lines and so on. The other plots normally used in EXAFS analysis can be produced using the SAMXAS program. Section A.5.2 SAMXAS Analysis The SAMXAS program developed at Northwestern University can be used to perform background subtraction, Fourier analysis, and data fitting of samples to a standard basis set. The details of how to use this program in EXAFS analysis are given in Appendix B. 225 Section A.5.3 FEFF and FEFFIT Analysis The FEFFIT program, developed by Matthew Newville, is extremely useful in trying to fit parameters such as coordination number and bond distance to EXAFS data. A requirement of FEFFIT is to have the phase and amplitude parameters for the compounds or elements being fit. These parameters are be calculated using the FEFF program from the University of Washington. FEFF8 can calculate the EXAFS, XANES, and local density of states using an ab initio self-consistent, relativistic multiple scattering approach. FEFF8 is very powerful, and can be used for much more complicated calculations as well. In practice, the first step is to design the system to be modeled. FEFF requires the system that it calculates to be well defined. If system is a defined crystal compound, the lattice parameter can be found (Crystal Structures, volumes 1-5 by R.W.G. Wyckoff is a useful reference for this) and used as input. However, this is often very difficult for amorphous environmental type compounds. Since EXAFS is not very sensitive to the geometry of the system, but rather to the coordination numbers and number of neighboring atoms, often a simplified model can be constructed. Using a simple system, such as a central zinc atom and one neighboring sulfur atom at 2.3 Å, assumes that the real system is not affected by multiple scattering. That is, the EXAFS signal being modeled is only influenced by a single scattering event. This is often a good assumption for first shell analyses, but poor for more complicated second and third shell analysis. Once the system has been designed, the required parameters can be placed into the input file for FEFF. For details on this procedure, the manuals for both FEFF and Atoms 226 (an input utility) should be consulted. An example feff.inp file is shown below for a single zinc-sulfur interaction. * This feff8 input file was generated by the Molecule notecard 1.6 * Atoms written by and copyright (c) Bruce Ravel, 1998, 1999 TITLE Zn-S * Zn K edge energy = 9659.0 eV EDGE K S02 1.0 * CONTROL PRINT pot 0 1 xsph 0 0 * EXCHANGE ixc 0 * SCF r_scf 4.0 fms 0 0 paths genfmt ff2chi 0 0 1 0 0 3 *** ixc=0 means to use Hedin-Lundqvist [ Vr [ l_scf 1 *** for EXAFS: RPATH EXAFS Vi ] RPATH n_scf ca ] 2.5520 and uncomment *** the EXAFS card 2.5520 POTENTIALS * ipot Z 0 30 1 16 ATOMS * x 0.00000 0.00000 END element Zn S y 0.00000 0.00000 l_scmt 2 2 l_fms 2 2 stoichiometry 0.001 1 * this list contains 2 atoms z ipot tag distance 0.00000 0 Zn_0 0.00000 2.32000 1 S_1 2.32000 0 1 For further analysis using FEFFIT it is important to make sure that FEFF outputs all of the individual paths. This is not the default setting for FEFF8. The “print” card of the feff.inp file must read: PRINT 1 0 0 0 0 3 for proper use in data fitting. 227 Once the calculations are complete, the FEFFIT program can be used to make refinements and fit the data. The FEFFIT program uses a similar input system as FEFF, with all the data placed into a feffit.inp file. Again, the user’s manual should be consulted for the fine details of using FEFFIT as there are many features to the program. The fitting program is very flexible and is meant to be able to fit many of the different parameters involved in the EXAFS equation. For reference, the standard EXAFS equation is given below, χ (k ) = ∑ N i exp(2k σ i ) 2 2 i S 02i Fi (k ) kRi 2 exp( − 2 Ri ) sin( 2kRi + φ i (k )) λ which gives the entire EXAFS signal, χ(k), as a sum over all of the individual scattering paths as a function of the photoelectron wavevector, k. For each path, i, Fi(k) is χ (k ) = Amp(k ) × N × SO2 exp − 2 p ′′Reff − 2 p 2 sigma2 2 k ( Reff + delR ) ( ) sigma2 exp i 2kReff + Phase(k ) + 2 p (delR − 2 R eff the backscattering amplitude from each of the Ni neighboring atoms with a DebyeWaller factor of σi (to account for thermal vibration and static disorder) at a distance of Ri from the central absorber. S0i(k) is an amplitude reduction factor due to many-body effects at the central atom, and is usually constant over most of the k-range. φi(k) is the phase shift of the photoelectron, and the term exp(-2Ri/λ) is due to inelastic losses in the scattering process, where λ is the electron mean free path. The FEFFIT model uses the EXAFS equation for each path in the following way, 228 where SO2, delR, and sigma2 are all possible FEFFIT fitting parameters and p’ and p” are the real and imaginary components of the photoelectron momentum. Amp and Phase are the amplitude and phase functions as calculated by FEFF. Typically, fitting data is divided into two sections. The first is calibration of the FEFF data to standard compounds. For example, before trying to fit an unknown sulfur 2 containing zinc compound, the S0 and e0 parameters from a known zinc sulfide should be fit first. This will greatly reduce the number of variables when fitting the unknown, 2 and helps remove the co-dependence of the coordination number and S0 . Once these parameters are determined from the known standard, these values are held constant and the remaining parameters determined for the unknown samples. In addition to several data files that show the fitting result in k-space and R-space, a feffit.out file summarizes the numerical results. A sample script for the standardization of parameters for zinc sulfide is found below. % data out % rmin kmin dk % = /usr/users/swebb/chis/aps1121/zns_t-k.chi = result.dat = 1.1 = 2 = 2 rmax = 2.6 kmax = 14 kweight = 3 qspfit = true set n1 = 4 guess guess guess guess % Path e0 = -9 S02 = 1 sigma2 = 0.001 delr = 0 1 /usr/users/swebb/feff/zn-s/feff0001.dat 229 e0 S02 sigma2 delr 1 1 1 1 e0 abs(S02) * n1 abs(sigma21) delr In this example, cubic zinc sulfide is being fit by the single zinc-sulfur calculation by FEFF as shown previously. The first two lines tell the program where to find the data file and where to put the results. The next lines are the R-ranges and k-ranges over which to examine the data, as well as how much k-weighting to apply. Th dk variable is a parameter used in the windowing function of the Fourier transforms. The qspfit card tells the fitting program that the fit should be performed on the filtered, k-weighted data as opposed to R-space. Since we know the sample is ZnS, we know the number of neighbors in the first shell is four. This is set by assigning the variable n1. Parameters such as the fermi level shift, the amplitude reduction factor, the Debeye-Waller factor, and the shift in the radial distance from the FEFF calculation are all unknowns. Thus we must tell FEFFIT to make guesses and fit these. The last lines give the information about the fit for each path. In this case, there is only one path to consider. The first line tell FEFFIT where to find the FEFF data. The next three lines are mathematical expressions for each of the major fitting parameters. Note that the choice of variable names in some cases is identical to the fitting parameter of FEFFIT. A second example script for the determination of an unknown sample follows. % data out % rmin kmin = /usr/users/swebb/chis/aps0315/bz-k.chi = result.dat = 1.1 = 2.0 rmax = 2.6 kmax = 14 230 dk = 2 % qspfit = % set ntot guess n1 set n2 = kweight = 3 true = 4 = 4 ntot-n1 set e01 = -1.5 set e02 = -9.8 set S021 = .95 set S022 = .75 guess guess guess guess % Path e0 S02 sigma2 delr % Path e0 S02 sigma2 delr sigma21 sigma22 delr1 = delr2 = = 0.001 = 0.001 0 0 1 1 1 1 1 /usr/users/swebb/feff/zn-s/feff0001.dat e01 S021 * n1 abs(sigma21) delr1 2 2 2 2 2 /usr/users/swebb/feff/zn-o/feff0001.dat e02 S022 * n2 abs(sigma22) delr2 This is an example of a slightly more sophisticated script. This is attempting to perform a two component, first shell fit to a bacterial sample. As in the previous example, the first several lines set up the data files and ranges of data to be examined. Since it is expected that the mixed complex is likely to be tetrahedral, ntot is a constant is defined as the total coordination number of the sample. A guess is made at n1, the first path’s coordination number, and n2 is defined as the difference between ntot and n1. This method of fitting allows only one fitted parameter for the coordination numbers in the shell. It is particularly useful when the data being fitted are over a small range and have few degrees of freedom. Parameters from the standard fit (the fermi shift and the 231 amplitude reduction factor) for both shells are set as constants in the next lines. Guesses are set for the Debye-Waller factors and radial distance shifts. These variables are then set as parameters for each of the two shells to fit. These examples are just a few of the ways to implement FEFFIT. Further reading of the examples in the manuals is recommended for the beginning user.