1
Quanser NI-ELVIS Trainer (QNET) Series:
QNET Experiment #07:
HVAC ON-OFF
Temperature Control
Heating, Ventilation, and Air
Conditioning Trainer (HVACT)
Student Manual
ON-OFF Temperature Control Laboratory Manual
Table of Contents
1. Laboratory Objectives.........................................................................................................1
2. References............................................................................................................................1
3. Pre-Lab Assignments...........................................................................................................2
3.1. ON-OFF Control Principle..........................................................................................2
3.2. ON-OFF Controller Design.........................................................................................2
3.2.1. Control Switching Strategy..................................................................................3
3.2.2. Heater Control Loop.............................................................................................6
3.2.3. Blower Control Loop...........................................................................................8
3.2.4. Controller Specifications......................................................................................9
4. In-Lab Session...................................................................................................................10
4.1. System Hardware Configuration................................................................................10
4.2. Experimental Procedure.............................................................................................10
Document Number: 580 Revision: 01 Page: i
ON-OFF Temperature Control Laboratory Manual
1. Laboratory Objectives
The objective of this experiment is to design an on-off temperature controller for the
Heating, Ventilation, and Air Conditioning Trainer (HVACT) plant. The closed-loop
system should regulate the desired chamber temperature.
Regarding Gray Boxes:
Gray boxes present in the instructor manual are not intended for the students as they
provide solutions to the pre-lab assignments and contain typical experimental results
from the laboratory procedure.
2. References
[1] NI-ELVIS User Manual.
[2] QNET-HVACT User Manual.
Document Number: 580 Revision: 01 Page: 1
ON-OFF Temperature Control Laboratory Manual
3. Pre-Lab Assignments
This section must be performed, read, and understood before you go to the laboratory
session.
3.1. ON-OFF Control Principle
Because of their simplicity of operation, on-off controllers are widely used in industry and
found in many household applications, such as for example in thermostats and refrigerators.
They do not require a specific knowledge or model of the system dynamics.
An on-off temperature controller is a single-loop controller which only has two states: ON
and OFF. When in the on mode, its control action is at maximum power, and it can be seen
as a high-gain controller.
3.2. ON-OFF Controller Design
The purpose of the laboratory is to design a controller that allows us to command and
maintain the chamber temperature, Tc, "as closely as possible" to a desired level.
Table 1, below, provides a listing of the symbols and notations used in the on-off controller
design, as presented in this laboratory.
Symbol
Description
Unit
Tc
Chamber Air Temperature
ºC
Vh
Heater Input Voltage
V
Vb
Blower Input Voltage
V
Vh_max
Maximum Heater Input Voltage
V
Vb_max
Maximum Blower Input Voltage
V
Table 1 On-Off Control Loop Nomenclature
The Heating, Ventilation, and Air Conditioning Trainer (HVACT) plant has one output to
be controlled, the chamber temperature Tc. However although it actually has two inputs,
that is to say the heater and blower voltages, not more than one should be active at a time,
depending on whether the chamber needs to heated up or cooled down. This results in a
"de-coupling" between the two inputs. Therefore, the HVAC plant is considered in this
laboratory as a Single-Input-Single-Output (SISO) system.
Document Number: 580 Revision: 01 Page: 2
ON-OFF Temperature Control Laboratory Manual
Typically, the HVAC on-off control law used to heat up the chamber temperature, when
required, is described below:
V h ( t ) = V h_max
Vb ( t ) = 0
and
[1]
where t is the continuous time.
Similarly, the on-off control law used to cool down the chamber, through blowing of
ambient air, is expressed as follows:
Vh ( t ) = 0
V b ( t ) = V b_max
and
[2]
Also sometimes if the chamber air is "close enough" to the desired temperature setpoint,
both actuators may be off, as formulated below:
Vh ( t ) = 0
Vb ( t ) = 0
and
[3]
For both actuators, the maximum input voltages allowed, before reaching saturation, are
given as follows:
Vh_max = 4 [ V ]
Vb_max = 20 [ V ]
and
[4]
3.2.1. Control Switching Strategy
For a given temperature setpoint, Tc_r, the switching logic between the plant's two possible
inputs, Vh and Vb, is determined by four trip temperatures, namely Th_on, Th_off, Tb_on, and
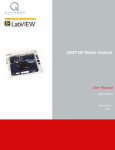
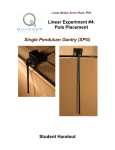
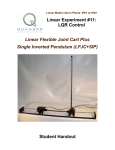
Tb_off. This is illustrated in Figure 1, below. As it can be observed in Figure 1, a switching
hysteresis has introduced for both actuators. In other words, both heater and blower can
have different switch on and switch off temperatures.
Document Number: 580 Revision: 01 Page: 3
ON-OFF Temperature Control Laboratory Manual
Figure 1 Blower And Heater On-Off Mode Regions
Table 2, below, provides a nomenclature of the parameters used for the on-off switching
strategy, as presented in this laboratory, of the closed-loop Heating, Ventilation, and Air
Conditioning (HVAC) plant.
Symbol
Description
Unit
Tc_r
Reference Chamber Temperature (i.e. Setpoint)
ºC
Th_on
Heater Start Trip Temperature
ºC
Th_off
Heater Stop Trip Temperature
ºC
Tb_on
Blower Start Trip Temperature
ºC
Tb_off
Blower Stop Trip Temperature
ºC
∆Th_on
Heater Start Trip Temperature Difference
ºC
∆Th_off
Heater Stop Trip Temperature Difference
ºC
∆Tb_on
Blower Start Trip Temperature Difference
ºC
∆Tb_off
Blower Stop Trip Temperature Difference
ºC
Document Number: 580 Revision: 01 Page: 4
ON-OFF Temperature Control Laboratory Manual
Symbol
t
Description
Continuous Time
Unit
s
Table 2 On-Off Switching Logic Parameter Nomenclature
To allow for a time-varying setpoint, Tc_r(t), the four trip temperatures are determined as
function of temperature differences with regard to the given temperature reference.
The resulting on-off control parameters for both actuators are namely: ∆Th_on, ∆Th_off, ∆Tb_on,
and ∆Tb_off. They are graphically represented in Figure 1, above, and mathematically
defined by the four equations underneath.
The blower start trip temperature difference, ∆Tb_on, is the difference between the trip
temperature Tb_on and the reference temperature Tc_r. This can be formulated as follows:
T b_on ( t ) = T c_r ( t ) + ∆ T b_on
[5]
where t is the continuous time.
Likewise the blower stop trip temperature, Tb_off, can be expressed such as:
T b_off ( t ) = T c_r ( t ) + ∆ T b_off
[6]
The heater start trip temperature Th_on is defined as a function of the reference temperature
Tc_r as follows:
T h_on ( t ) = T c_r ( t ) + ∆ T h_on
[7]
Likewise, the heater stop trip temperature difference, ∆Th_off, is the difference between the
trip temperature Th_off and the reference temperature Tc_r. This is shown below:
T h_off ( t ) = T c_r ( t ) + ∆ T h_off
[8]
What conditions bearing on the four on-off control parameters must be respected so that the
requirement of not having the two HVAC actuators on simultaneously is respected?
Document Number: 580 Revision: 01 Page: 5
ON-OFF Temperature Control Laboratory Manual
Solution:
As previously stated, the controlled input is either the heater voltage or the blower
voltage (or none of them, but not both simultaneously).
First in order to avoid that both blower and heater start at the same time, the blower start
temperature should be strictly greater than the heater start trip value, as formulated
below:
[s1]
Second, the heater should be turned off before the blower can be turned on. This is
expressed below by:
[s2]
Third and last, the blower should be turned off before the heater can be switched on. This
leads to the following condition:
[s3]
The three conditions above can also be expressed as functions of the controller
parameters as previously defined. Using Equations [5], [6], [7], and [8], the three
conditions [s1], [s2], and [s3] necessary to respect the design requirement can be
expressed with the control parameters as follows:
[s4]
and:
and
[s5]
The above conditions are actually respected by the parameter graphical representation
given in Figure 1.
3.2.2. Heater Control Loop
During the heating process, the blower input voltage remains constant and equal to zero, as
expressed below:
Vb ( t ) = 0
[9]
where t is the continuous time.
Document Number: 580 Revision: 01 Page: 6
ON-OFF Temperature Control Laboratory Manual
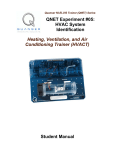
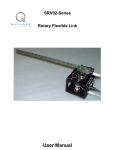
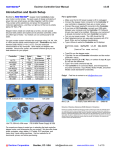
The on-off control law with a switching hysteresis, as implemented for the chamber heating
device (i.e. halogen lamp), is depicted in Figure 2, below.
Figure 2 Heater Voltage Hysteresis
It can be observed in Figure 2, above, that when the heater voltage state, Vh_state, is ON, the
heating actuator outputs maximum power with full control effort. The on-off control law
commanding the heater input voltage, Vh, can be formulated as follows:
Vh( t ) = {
V h_max
V h_state ( t ) = ON
0
V h_state ( t ) = OFF
[10]
As previously mentioned, start of heating is triggered if and only if the chamber
temperature is lesser than the heater switch on temperature, that is to say: Tc < Th_on. The
complete heater switching hysteresis can be characterized by the Boolean variable Vh_state as
defined below:
T c( t ) < T h_on ( t )
ON
⎧
⎪
⎪
T h_on ( t ) < T c( t ) and T c( t ) < T h_off ( t )
V h_state ( t ) = ⎪⎪⎨ PREVIOUS
[11]
⎪
⎪
OFF
T h_off ( t ) < T c( t )
⎩
where PREVIOUS is the previous value (either ON or OFF) of Vh_state; by default
Document Number: 580 Revision: 01 Page: 7
ON-OFF Temperature Control Laboratory Manual
PREVIOUS is OFF.
By definition of a hysteresis, the following relationship must be satisfied by the heater
control parameters:
T h_on ≤ T h_off
[12]
This relationship is graphically represented in Figures 1 and 2, above.
3.2.3. Blower Control Loop
During the blowing process, the heater input voltage remains constant and equal to zero, as
expressed below:
Vh ( t ) = 0
[13]
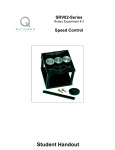
The on-off control law with switching hysteresis, as implemented for the chamber blowing
device (i.e. fan), is depicted in Figure 3, below.
Figure 3 Blower Voltage Hysteresis
It can be observed in Figure 3, above, that when the blower voltage state, Vb_state, is ON, the
blowing actuator outputs maximum power with full control effort. The on-off control law
Document Number: 580 Revision: 01 Page: 8
ON-OFF Temperature Control Laboratory Manual
commanding the blower input voltage, Vb, can be formulated as follows:
Vb( t ) = {
V b_max
V b_state ( t ) = ON
0
V b_state ( t ) = OFF
[14]
As previously mentioned, start of blowing is triggered if and only if the chamber
temperature is greater than the blower switch on temperature, that is to say: Tc ≥ Tb_on. The
complete blower switching hysteresis can be characterized by the Boolean variable Vb_state as
defined below:
T b_on ( t ) < T c( t )
ON
⎧
⎪
⎪
T b_off ( t ) < T c( t ) and T c( t ) < T b_on ( t )
V b_state ( t ) = ⎨⎪⎪ PREVIOUS
[15]
⎪
⎪
OFF
T c( t ) < T b_off ( t )
⎩
where PREVIOUS is the previous value (either ON or OFF) of Vb_state; by default
PREVIOUS is OFF.
By definition of the blower hysteresis, the switch on point value must be greater than or
equal to the switch off point. This is formulated with the blower control parameters by the
following relationship:
T b_off ≤ T b_on
[16]
This relationship is graphically represented in Figures 1 and 3, above.
3.2.4. Controller Specifications
The designed control loop should operate around the following operating chamber
temperature, Tc_op:
T c_op = 26.0 [ degC ]
[17]
The following controller design requirements are to be satisfied by the chamber temperature
in response to a square wave temperature setpoint, Tc_r, with an amplitude, ∆Tc_r, of 2 °C
centered around Tc_op.
1. The output temperature peak-to-peak oscillation, ∆Tc_p2p, around the desired setpoint
level should be such as:
∆ T c_p2p ≤ 0.5 [ degC ]
[18]
2. The output temperature oscillation period, TTc, around the desired setpoint level should
Document Number: 580 Revision: 01 Page: 9
ON-OFF Temperature Control Laboratory Manual
satisfy the relationship below:
4 [ s ] < T Tc
[19]
4. In-Lab Session
4.1. System Hardware Configuration
This in-lab session is performed using the NI-ELVIS system equipped with a QNETHVACT board and the Quanser Virtual Instrument (VI) controller file
QNET_HVAC_Lab_07_ON_OFF_Control.vi. Please refer to Reference [2] for the setup
and wiring information required to carry out the present control laboratory. Reference [2]
also provides the specifications and a description of the main components composing your
system.
Before beginning the lab session, ensure the system is configured as follows:
QNET HVACT module is connected to the ELVIS.
ELVIS Communication Switch is set to BYPASS.
DC power supply is connected to the QNET HVAC Trainer module.
The 4 LEDs +B, +15V, -15V, +5V on the QNET module should be ON.
4.2. Experimental Procedure
Please follow the steps described below:
Step 1. Read through Section 4.1 and go through the setup guide in Reference [2].
Step 2. Open the VI controller file QNET_HVAC_Lab_07_ON_OFF_Control.vi. You
should obtain a front panel similar to the one shown in Figure 4, below. The default
sampling rate for the implemented digital controller is 250 Hz. However, you can
adjust it to your system's computing power. Please refer to Reference [1] for a
complete system's description. The chamber temperature, directly sensed by the
thermistor, is plotted on a chart (in blue) as well as displayed in a Numeric Indicator
located in the Chamber Temperature front panel box. The values are in degrees
Celsius (°C).
Document Number: 580 Revision: 01 Page: 10
ON-OFF Temperature Control Laboratory Manual
Figure 4 Front Panel Used for the QNET-HVACT ON-OFF Temperature Control Laboratory
Step 3. When you first open the QNET_HVAC_Lab_07_ON_OFF_Control.vi controller
file, the controller gains are not yet tuned. Your default on-off controller parameters
should be similar to the ones provided in Table 3, below.
∆Th_on [°C]
∆Th_off [°C]
∆Tb_on [°C]
∆Tb_off [°C]
0.00
0.00
10.00
0.00
Table 3 "Un-Tuned" On-Off Controller Parameters
This section experimentally investigates the regulation of a constant temperature
inside the chamber. The vertical toggle switch in the Setpoint Type box allows you to
choose between a Square Wave or a Constant type of reference temperature, Tc_r. In a
first time, ensure that it is set to the Constant position. The temperature setpoint is
also plotted on the front panel chart (in red). The desired regulation level should be
set to the operating chamber temperature, Tc_op, as defined by Equation [17]. Use the
Numeric Controls of the Setpoint Properties box to set the chamber operating
temperature, Tc_op, to 26 °C (as expressed in Equation [17]), and the constant
Document Number: 580 Revision: 01 Page: 11
ON-OFF Temperature Control Laboratory Manual
Amplitude to 0 °C. Specifically the default setpoint properties parameters are
expressed in Table 4, below.
Signal Type
Tc_op [°C]
Amplitude: ∆Tc_r [°C]
Period [s]
Constant
26.0
0.0
100.0
Table 4 Default Temperature Setpoint Parameters
Step 4. The purpose of this experiment is to use the heater alone to regulate the chamber
temperature, Tc, at the desired Tc_op. Setting ∆Tb_on to 10 °C disables the fan by
ensuring that it will not be switched on by the controller, since the resulting Tb_on is 36
°C. Chamber cooling is achieves when the heater is off by natural heat dissipation due
to conduction and convection. In this experiment while regulating Tc, you will change
the heater hysteresis parameters on-line and observe their effect on the actual
temperature response. Table 5, below, displays the four sets, each corresponding to a
different Iteration #, of hysteresis parameters to try and compare. You will first start,
in Iteration # 1, with no hysteresis (i.e. Th_on = Th_off). In the ON-OFF Heater box,
ensure that use the two Numeric Controls labeled ∆Th_on and ∆Th_off corresponding
to both hysteresis parameters ∆Th_on and ∆Th_off are properly set (here to zero).
Iteration #
∆Th_on [°C]
∆Th_off [°C]
Time [s]
1
0.0
0.0
0-30
2
-0.2
0.0
30-60
3
-0.4
0.0
60-120
4
-0.4
0.25
120-240
Table 5 Heater Hysteresis Iteration Parameters
Step 5. Run the LabVIEW VI (Ctrl+R) to start the controller. The initially green START
push button should now show as a red STOP button that you can trigger to pause the
controller execution. With the control action active, the chamber temperature should
now go up and down to roughly regulate the desired constant setpoint. For each set of
hysteresis parameters given in Table 5, observe and characterize the resulting actual
temperature response, as plotted on the front panel chart. You should also observe
when the Heater is turned on or off, as materialized by the Heater LED on the front
panel. Get a feel of the corresponding switching frequency of the heater control
voltage. Once you have acquired enough data to characterize the control output
dynamics you can move on to the next Iteration #. Once Iteration # 4 is complete,
make a screen capture of the obtained response plot to measure the acquired data and
join a printout to your report. DO NOT press EXIT and do not stop the VI! Fill up in
Document Number: 580 Revision: 01 Page: 12
ON-OFF Temperature Control Laboratory Manual
Table 5 the time range of your actual response plot corresponding to each Iteration #.
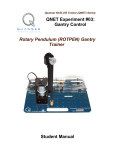
Solution:
Figure 5, below, illustrates typical experimental results obtained by changing online the heater hysteresis limits as set in Table 5. Figure 5 shows the actual chamber
temperature response regulating "more or less closely" at the desired level.
Figure 5 Effect Of Different Heater Hysteresis Limits On The Actual Temperature Signal During Regulation
Step 6. Compare and explain the actual temperature response obtained for each one of
the four previous sets of hysteresis parameters. Your discussion should take into
account the amplitude and frequency of any output oscillation as well as the switching
frequency of the heater control signal (indicated by the blinking of the Heater LED).
Document Number: 580 Revision: 01 Page: 13
ON-OFF Temperature Control Laboratory Manual
Solution:
As depicted in Figure 5, above, the temperature response, Tc, is stable and settles
around the desired value Tc_op. However some oscillation results in the closed-loop
system variables, specifically in Tc and Vh. The output temperature cycles up and
down continually. This oscillation is called limit cycle.
To regulate the desired temperature, the controller keeps on switching the heater on
and off more or less rapidly depending on the hysteresis width, which can be
defined as | |∆Th_on| - |∆Th_off| |.
It can be observed in Figure 5 that increasing the hysteresis width decreases the
control signal switching frequency (i.e. blinking frequency of the Heater LED) as
well as the temperature limit cycle frequency. However, it also increases the size of
the output temperature oscillations.
Step 7. Do you see any practical reason why the heater hysteresis width should have a
specified minimum level?
Hint:
The hysteresis width can be defined as follows:
∆ T h_on − ∆ T h_off
where | | is the absolute value function.
Solution:
In practice, a fast switching control voltage wears out the actuator (e.g. heater,
blower) quickly. A minimum hysteresis width ensures a maximum switching
frequency of the control signal between zero and its maximum output power.
Therefore, specifying a minimum hysteresis width should guarantee a minimum life
expectancy for the corresponding actuator.
Step 8. Do you see a controller design trade-off in tuning/choosing the actuator
hysteresis limits?
Hint:
Consider the response performance with regard to the control effort spent.
Document Number: 580 Revision: 01 Page: 14
ON-OFF Temperature Control Laboratory Manual
Solution:
It results from the previous observations a controller design trade-off: the tightness
of the temperature oscillation around the desired level of regulation has to be
balanced with an "acceptable" switching frequency of the control signal.
In other words, the "price to pay" for a flatter (and better) temperature response is a
the faster (and worse) switching in the control voltage (e.g. Vh), resulting from a
"narrower" hysteresis width.
As a remark, an on-off controller can be seen as a simple high gain (aggressive)
feedback controller.
Step 9. You can stop the VI by pressing the red EXIT button on the front panel.
Step 10. Your previous observations and conclusions regarding the working principles
and tuning of the heater hysteresis, apply similarly to the blower switching hysteresis.
Step 11. The goal of this experiment is to tune the on-off controller for both actuators so
that the output temperature tracks a desired square wave setpoint with the level of
performance previously specified in the design requirements. For the VI to generate
the proper setpoint, ensure that the vertical toggle switch in the Setpoint Type box is
set to the Square Wave position. Use the Numeric Controls of the Setpoint Properties
box to set the chamber operating temperature, Tc_op, to 26 °C (as expressed in
Equation [17]), the square wave Amplitude to -2 °C, and Period to 100 seconds.
Specifically the setpoint properties parameters are expressed in Table 6, below.
Signal Type
Tc_op [°C]
Amplitude [°C]
Period [s]
Square Wave
26.0
-2.0
100.0
Table 6 Temperature Setpoint Parameters
Step 12. Start the controller by running the LabVIEW VI (Ctrl+R) and tune
experimentally, on-the-fly, the hysteresis limits on both actuators so that the chamber
temperature tracks the temperature setpoint while respecting the design specifications.
The software applies square wave temperature setpoints to the closed-loop control
system and plots both setpoint and actual chamber temperature over a 240-second
time range. Observe the way the system switches between the two actuators (i.e. lamp
and fan) in order for the chamber temperature to track the desired square wave
setpoint around the operating level Tc_op.
Step 13. Summarize your final tuned controller parameters by filling up Table 7 as
shown below.
∆Th_off [°C]
∆Tb_off [°C]
∆Th_on [°C]
∆Tb_on [°C]
-0.05
0.05
0.30
-0.05
Table 7 Tuned Controller Parameters
Document Number: 580 Revision: 01 Page: 15
ON-OFF Temperature Control Laboratory Manual
Step 14. Let the system run until you have plotted on the chart the temperature response
to at least three periods of the setpoint. DO NOT press EXIT and do not stop the VI!
Step 15. Make a screen capture of the obtained step response plot and join a printout to
your report. This capture can be used to make measurements.
Solution:
Figure 6, below, illustrates typical experimental results from the designed closedloop system by showing the actual temperature response tracking a desired square
wave setpoint.
Figure 6 Desired And Actual Temperature Signals
Step 16. Does the closed-loop system track the desired square wave setpoint accurately?
Comment on the symmetry (or lack) of the temperature response between heating and
blowing steps. Explain.
Step 17. You should now measure and determine your system performance from the
capture of the response plot taken.
Step 18. Do the limit cycle peak-to-peak amplitude and frequency measured for both
levels of regulation meet the required specifications? Explain your observations.
Document Number: 580 Revision: 01 Page: 16
ON-OFF Temperature Control Laboratory Manual
Solutions:
The system response shown in Figure 6 tracks the desired temperature square wave
with a chamber temperature oscillation (or limit cycle) that respects the design
requirements given by Equations [18] and [19].
Specifically, the actual output temperature peak-to-peak oscillation, ∆Tc_p2p, is equal
to 0.40 °C during regulation at 24 °C and to 0.30 °C during regulation at 28 °C.
Regarding the actual output temperature oscillation period, TTc, it is equal to around
15.0 s during regulation at 24 °C and to about 7.1 s during regulation at 28 °C. The
output performance difference between the two levels of the square wave setpoint is
explained by the simple fact that cooling due to regular heat loss through
conduction and convection happens faster at larger setpoint values, Tc_r. Logically,
more time is also required for heating the chamber to higher Tc_r values.
As expected, the system has an asymmetrical response: heating behaves differently
than cooling (i.e. blowing), since a different process/plant is at play in each case.
Step 19. If the design requirements defined by Equations [18] and [19] are still not
satisfied, you should re-iterate your manual trial-and-error procedure to fine tune the
controller parameters of Table 7 until the response performance improves to the
desired requirements. Include in your laboratory report your final tuning parameters,
experimental plots and results, as well as the measured system performance criteria
satisfying the specifications.
Step 20. Once all your experimental results are obtained, shut off the PROTOTYPING
POWER BOARD switch and the SYSTEM POWER switch at the back of the ELVIS
unit. Unplug the module AC cord. Then, stop the VI by pressing the red EXIT button.
Ensure that you have all the data required for your laboratory report before leaving
the laboratory session.
Document Number: 580 Revision: 01 Page: 17