1
Word Stat
Content Analysis Module for SIMSTAT & QDA Miner
User’s Guide
Provalis Research
Copyright © 1998-2005 Provalis Research. All right reserved.
DISCLAIMER
This software and the disk on which it is contained are licensed to you, for your own use. This is copyrighted software
owned by Provalis Research. By purchasing this software, you are not obtaining title to the software or any copyright rights.
You may not sublicense, rent, lease, convey, modify, translate, convert to another programming language, decompile, or
disassemble the software for any purpose. You may make as many copies of this software as you need for backup purposes.
You may use this software on more than one computer, provided there is no chance it will be used simultaneously on more
than one computer. If you need to use the software on more than one computer simultaneously, please contact us for
information about site licenses.
WARRANTY
The WORDSTAT product is licensed "as is" without any warranty of merchantability or fitness for a particular purpose,
performance, or otherwise. All warranties are expressly disclaimed. By using the WORDSTAT product, you agree that
neither Provalis Research nor anyone else who has been involved in the creation, production, or delivery of this software
shall be liable to you or any third party for any use of (or inability to use) or performance of this product or for any indirect,
consequential, or incidental damages whatsoever, whether based on contract, tort, or otherwise even if we are notified of
such possibility in advance. (Some states do not allow the exclusion or limitation of incidental or consequential damages,
so the foregoing limitation may not apply to you). In no event shall Provalis Research's liability for any damages ever exceed
the price paid for the license to use the software, regardless of the form of claim. This agreement shall be governed by the
laws of the province of Quebec (Canada) and shall inure to the benefit of Provalis Research and any successors,
administrators, heirs, and assigns. Any action or proceeding brought by either party against the other arising out of or related
to this agreement shall be brought only in a PROVINCIAL or FEDERAL COURT of competent jurisdiction located in
Montréal, Québec. The parties hereby consent to in personam jurisdiction of said courts.
COPYRIGHT
Copyright © 1998-2005 Provalis Research. All rights reserved. No part of this publication may be reproduced or distributed
without the prior written permission of Provalis Research, 2414 Bennett Avenue, Montreal, QC, CANADA, H1V 3S4.
TRADEMARK
Microsoft Windows is a registered trademark of Microsoft Corporation.
Excel and MS Access are products of Microsoft Corporation
SPSS/PC+ and SPSS for Windows are a registered trademark of SPSS Inc.
Other product names mentioned in this manual may be trademarks or registered trademarks of their respective companies
and are hereby acknowledged.
TABLE OF CONTENT
Introduction to Wordstat . . . . . . . . . . . . . . . . . . . . . . . . . . . . . . . . . . . . . . . . . . . . . . . . . . . . . . . . . . . . . . . 5
Program’s Capabilities . . . . . . . . . . . . . . . . . . . . . . . . . . . . . . . . . . . . . . . . . . . . . . . . . . . . . . . . . . . . . . . . 7
The Content Analysis & Categorization Process . . . . . . . . . . . . . . . . . . . . . . . . . . . . . . . . . . . . . . . . . . . . 10
A Quick Tour: Performing Your First Content Analysis . . . . . . . . . . . . . . . . . . . . . . . . . . . . . . . . . . . . . . 12
Preparing and Importing Data . . . . . . . . . . . . . . . . . . . . . . . . . . . . . . . . . . . . . . . . . . . . . . . . . . . . . . . . . . 16
Preliminary Text Preparation . . . . . . . . . . . . . . . . . . . . . . . . . . . . . . . . . . . . . . . . . . . . . . . . . . . . . . . 16
Importing Spreadsheet Files . . . . . . . . . . . . . . . . . . . . . . . . . . . . . . . . . . . . . . . . . . . . . . . . . . . . . . . . 17
Importing Database Files . . . . . . . . . . . . . . . . . . . . . . . . . . . . . . . . . . . . . . . . . . . . . . . . . . . . . . . . . . 18
Importing Text and Word Processor Files . . . . . . . . . . . . . . . . . . . . . . . . . . . . . . . . . . . . . . . . . . . . . 19
The Working Environment
First Screen - Dictionaries . . . . . . . . . . . . . . . . . . . . . . . . . . . . . . . . . . . . . . . . . . . . . . . . . . . . . . . . . 21
Second Screen - Options . . . . . . . . . . . . . . . . . . . . . . . . . . . . . . . . . . . . . . . . . . . . . . . . . . . . . . . . . . . 28
Third Screen - Frequency . . . . . . . . . . . . . . . . . . . . . . . . . . . . . . . . . . . . . . . . . . . . . . . . . . . . . . . . . . 32
Third Screen - Crosstab . . . . . . . . . . . . . . . . . . . . . . . . . . . . . . . . . . . . . . . . . . . . . . . . . . . . . . . . . . . 36
Fourth Screen - Keyword-in-Context . . . . . . . . . . . . . . . . . . . . . . . . . . . . . . . . . . . . . . . . . . . . . . . . . 44
Fifth Screen - Features Extraction Page . . . . . . . . . . . . . . . . . . . . . . . . . . . . . . . . . . . . . . . . . . . . . . . 48
Common Tasks
Creating and Maintaining Dictionaries . . . . . . . . . . . . . . . . . . . . . . . . . . . . . . . . . . . . . . . . . . . . . . . . 56
Working with Rules . . . . . . . . . . . . . . . . . . . . . . . . . . . . . . . . . . . . . . . . . . . . . . . . . . . . . . . . . . . . . . 64
Using the Drag & Drop Dictionary Editor . . . . . . . . . . . . . . . . . . . . . . . . . . . . . . . . . . . . . . . . . . . . . . 67
Using Lexical Tools for Dictionary-Building . . . . . . . . . . . . . . . . . . . . . . . . . . . . . . . . . . . . . . . . . . . . 69
Monitoring and Customizing Lemmatizaion . . . . . . . . . . . . . . . . . . . . . . . . . . . . . . . . . . . . . . . . . . . . 76
Configuring External Preprocessing Routines . . . . . . . . . . . . . . . . . . . . . . . . . . . . . . . . . . . . . . . . . . . 80
Viewing and Editing Text . . . . . . . . . . . . . . . . . . . . . . . . . . . . . . . . . . . . . . . . . . . . . . . . . . . . . . . . . . . 83
Displaying keyword distribution using barcharts or pie charts . . . . . . . . . . . . . . . . . . . . . . . . . . . . . . . 86
Creating and Using Norm Files . . . . . . . . . . . . . . . . . . . . . . . . . . . . . . . . . . . . . . . . . . . . . . . . . . . . . . 89
Performing Text Retrieval Using Keywords . . . . . . . . . . . . . . . . . . . . . . . . . . . . . . . . . . . . . . . . . . . . . 91
Hierarchical Clustering and Multidimensional Scaling . . . . . . . . . . . . . . . . . . . . . . . . . . . . . . . . . . . . . 97
Dendrograms . . . . . . . . . . . . . . . . . . . . . . . . . . . . . . . . . . . . . . . . . . . . . . . . . . . . . . . . . . . . . . . . . 99
2d & 3d Concept Maps . . . . . . . . . . . . . . . . . . . . . . . . . . . . . . . . . . . . . . . . . . . . . . . . . . . . . . . . 100
Proximity Plots . . . . . . . . . . . . . . . . . . . . . . . . . . . . . . . . . . . . . . . . . . . . . . . . . . . . . . . . . . . . . . . 103
Using Heatmap Plots . . . . . . . . . . . . . . . . . . . . . . . . . . . . . . . . . . . . . . . . . . . . . . . . . . . . . . . . . . . . . . 105
Performing Correspondence Analysis . . . . . . . . . . . . . . . . . . . . . . . . . . . . . . . . . . . . . . . . . . . . . . . . . 110
Automated Text Classification . . . . . . . . . . . . . . . . . . . . . . . . . . . . . . . . . . . . . . . . . . . . . . . . . . . . . . 114
Select Features Page . . . . . . . . . . . . . . . . . . . . . . . . . . . . . . . . . . . . . . . . . . . . . . . . . . . . . . . . . . 115
Learn & Test Page . . . . . . . . . . . . . . . . . . . . . . . . . . . . . . . . . . . . . . . . . . . . . . . . . . . . . . . . . . . . 118
History & Experiment Page . . . . . . . . . . . . . . . . . . . . . . . . . . . . . . . . . . . . . . . . . . . . . . . . . . . . . 122
Classification Experiment Dialog Box . . . . . . . . . . . . . . . . . . . . . . . . . . . . . . . . . . . . . . . . . . . . . 125
Apply Page . . . . . . . . . . . . . . . . . . . . . . . . . . . . . . . . . . . . . . . . . . . . . . . . . . . . . . . . . . . . . . . . . . 131
Exporting a Classification Model to Disk . . . . . . . . . . . . . . . . . . . . . . . . . . . . . . . . . . . . . . . . . . . . . . . . .
Filtering Cases . . . . . . . . . . . . . . . . . . . . . . . . . . . . . . . . . . . . . . . . . . . . . . . . . . . . . . . . . . . . . . . . . . . 132
Expression Operators and Rules . . . . . . . . . . . . . . . . . . . . . . . . . . . . . . . . . . . . . . . . . . . . . . . . . 133
Supported Xbase Functions . . . . . . . . . . . . . . . . . . . . . . . . . . . . . . . . . . . . . . . . . . . . . . . . . . . . . 135
Performing Analysis on Manually Entered Codes . . . . . . . . . . . . . . . . . . . . . . . . . . . . . . . . . . . . . . . . 141
Computing Inter-rater Agreement Statistics . . . . . . . . . . . . . . . . . . . . . . . . . . . . . . . . . . . . . . . . . . . . 143
Exporting Frequency Data . . . . . . . . . . . . . . . . . . . . . . . . . . . . . . . . . . . . . . . . . . . . . . . . . . . . . . . . 146
Exporting Categorization Models . . . . . . . . . . . . . . . . . . . . . . . . . . . . . . . . . . . . . . . . . . . . . . . . . . . . 148
Using the Wordstat Document Classifier . . . . . . . . . . . . . . . . . . . . . . . . . . . . . . . . . . . . . . . . . . . . . . 149
Wordstat Software Developer’s Kit (Sdk) . . . . . . . . . . . . . . . . . . . . . . . . . . . . . . . . . . . . . . . . . . . . . 153
Performing Multivariate Analysis on Words or Categories. . . . . . . . . . . . . . . . . . . . . . . . . . . . . . . . . 154
References . . . . . . . . . . . . . . . . . . . . . . . . . . . . . . . . . . . . . . . . . . . . . . . . . . . . . . . . . . . . . . . . . . . . . . . . . 156
Technical Support . . . . . . . . . . . . . . . . . . . . . . . . . . . . . . . . . . . . . . . . . . . . . . . . . . . . . . . . . . . . . . . . . . 157
Introduction to WordStat
WordStat is a text analysis module specifically designed to study textual information such as responses to
open-ended questions, interviews, titles, journal articles, public speeches, electronic communications, etc.
WordStat may be used for automatic categorization of text using a dictionary approach or various text mining
methods as well as for manual coding. WordStat can apply existing categorization dictionaries to a new text
corpus. It also may be used in the development and validation of new categorization dictionaries. When used
in conjunction with manual coding, this module can provide assistance for a more systematic application of
coding rules, help uncover differences in word usage between subgroups of individuals, assist in the revision
of existing coding using KWIC (Keyword-In-Context) tables, and assess the reliability of coding by the
computation of inter-rater agreement statistics.
WordStat includes numerous exploratory data analysis and graphical tools that may be used to explore the
relationship between the content of documents and information stored in categorical or numeric variables such
as the gender or the age of the respondent, year of publication, etc. Relationships among words or categories
as well as document similarity may be identified using hierarchical clustering and multidimensional scaling
analysis. Correspondence analysis and heatmap plots may be used to explore relationship between keywords
and different groups of individuals.
WordStat is a module that must be run from either of the following base products:
Simstat -This statistical software provides a wide range of statistical procedures for the analysis of
quantitative data. It offers advanced data file management tools such as the ability to merge data files,
aggregate cases, perform complex computation of new variables and transformation of existing ones.
When used with Simstat, WordStat can analyze textual information stored in any alphanumeric, plain text
and rich text memo variable (or field). It includes various tools to explore the relationship between any
numeric variable of a data file and the content of alphanumeric ones. Its close integration with SIMSTAT,
facilitates further quantitative analysis on numerical results obtained from the content analysis (ex.: factor
analysis or correspondence analysis on keyword frequencies, multiple regression, etc.).
QDA Miner - The text management and qualitative analysis program allows one to create and edit data
files, import documents, and perform manual coding of those documents. Several analysis tools are also
available to look at the frequency of manually assigned codes and the relationship between those codes
and other categorical or numeric variables. When used with QDA Miner, WordStat can perform content
analysis on whole documents or selected segments of those documents tagged with specific user defined
codes.
WordStat module may be accessed in both of these programs from the CONTENT ANALYSIS command in
the ANALYSIS menu.
A few additional utility programs are also included with WordStat that may be run as standalone applications
or be accessed directly through WordStat:
Document Conversion Wizard - This utility program provides an easy way to import numerous
documents and create a project file. It can also be used to split large files into smaller units and to extract
various numeric and alphanumeric data from structured documents.
Dictionary Builder - This tools allows the development of comprehensive categorization dictionary for
automatic content analysis. The program may be run as standalone application but also from dictionary
WordStat User’s Manual
5
page of WordStat by pressing the SUGGEST button. To obtain more information on this software see
page 69.
Document Classifier - This utility program is a stand-alone application that may be used to perform
content analysis and automatic text classification on a text pasted from the clipboard or stored in a file.
For more information on this utility program, see WordStat Document Classifier on page 149.
Chart Editor - The chart editor is a standalone application that may be used to further customize charts
created using WordStat.
6
WordStat User’s Manual
Program's Capabilities
TEXT PROCESSING CAPABILITIES
• Performs analyses on alphanumeric fields containing short textual information such as responses to open
•
•
•
•
•
•
•
•
•
•
•
•
•
•
•
•
ended questions, titles, descriptions, etc. as well as on longer documents stored as plain ASCII or as RTF
document.
Automatic lemmatization (English, French, Spanish, and Italian, contact us if you need support of other
languages)
Optional exclusion of pronouns, conjunctions, expressions, etc, by the use of user-defined exclusion lists.
Categorization of words or expression using existing or user-defined dictionaries.
Word categorization based on Boolean (AND, OR, NOT) and proximity rules (NEAR, AFTER, BEFORE)
Word or expression substitution and scoring using wildcards and integer weighting.
Frequency analysis of words, derived categories or concepts, or user-defined codes entered manually
within a text.
Phrase finder allows identification of the most recurring phrases.
Easy identification of technical terms, proper nouns and common misspellings.
Interactive development and validation of multi-level dictionaries or categorization schema.
Ability to restrict an analysis to specific portions of a text or to exclude comments and annotations.
Option to perform a content analysis on a random sample of cases.
Integrated spell-checking with support for different languages such as English, French, Spanish, etc.
Integrated thesaurus (English only) to assist the creation of categorization schema.
Powerful case filtering on any numeric or alphanumeric field and on code occurrence (with AND, OR, and
NOT boolean operators)
Prints presentation quality tables (frequency, crosstab or KWIC lists)
Saves any table to HTML, ASCII, Tab separated or comma separated value files.
UNIVARIATE KEYWORD FREQUENCY ANALYSIS
• Univariate keyword frequency analysis (keyword count and case occurrence).
• Keyword co-occurrence matrix (within a case)
• Integrated clustering and dendrogram display of keyword similarities
• 2D and 3D multidimensional scaling on either joint frequency or co-occurrence of words or categories.
KEYWORD RETRIEVAL FUNCTION
• A powerful keyword retrieval function allows identification of text units (documents, paragraph or
sentences) containing one keyword or a combination of keywords with optional filtering of cases.
• Ability to attach QDA Miner codes to retrieved segments.
• Retrieved segments may be exported to disk in tabular format (Excel or delimited text files) or as text
reports (Rich Text Format).
MULTIPLE RESPONSES AND COMPARISONS
WordStat User’s Manual
7
• Can perform a single frequency analysis on information stored in several alphanumeric fields (memo or
string variables).
• Comparison of keyword occurrence between different variables.
• Compute inter-rater agreement measures on codes manually entered in different fields (pct. of agreement,
Cohen's Kappa, Scott's Pi, Krippendorf's R and r-bar, free marginal, and intraclass correlation).
KEYWORD CO-OCCURRENCE AND ANALYSIS
• Integrated clustering and dendrogram display of keyword co-occurrence.
• Proximity plot to easily identify all keywords that co-occurs with a target keyword.
• 2D and 3D multidimensional scaling on either joint frequency or co-occurrence of words or categories.
• Flexible keyword co-occurrence criteria (within a case, a sentence, a paragraph, a window of n words,
a user-defined segment) as well as clustering methods (first- and second-order proximity, choice of
similarity measures).
• Easy text retrieval directly from dendrogram or proximity plots.
ANALYSIS OF CASE OR DOCUMENT SIMILARITY
• Hierarchical clustering, multidimensional scaling and proximity plot may be used to explore the similarity
between documents or cases.
NORM CREATION AND COMPARISON
• Ability to create norm files based on frequency analysis of words or content categories.
• Comparison of obtained frequencies to previously saved norm files.
BIVARIATE COMPARISONS BETWEEN SUBGROUPS
• Bivariate comparison between any text field and any nominal or ordinal variable (such as sex of the
respondent, specific subgroups, years of publication, etc.).
• Choice between 12 different association measures to assess the relationship between keyword occurrence
and nominal or ordinal variables (Chi-square, Likelihood ratio, Student's F, Tau-a, Tau-b, Tau-c,
symmetric Somers' D, asymmetric Somers' Dxy and Dyx, Gamma, Pearson's R, and Spearman's Rho)
• Correspondence analysis allows examination of relationships between words or categories and other
nominal or ordinal variables.
• Ability to sort keyword matrix in alphabetical order, by keyword frequency or case occurrence, on the
obtained statistics or on its probability.
KEYWORD-IN-CONTEXT
• Ability to display a Keyword-In-Context (KWIC) table of any included, leftover or user defined keyword
or keyword pattern.
• KWIC tables may be sorted in ascending order of case number, words with context, or on values of
independent variables.
8
WordStat User’s Manual
• Ability to jump from a specific occurrence in the KWIC table to the original text field in order to view
or edit the selected word.
• KWIC tables may be saved in data files for further processing.
• Customizable KWIC and report function to display all hits as lists of paragraphs, sentences or user
defined segments.
AUTOMATED TEXT CLASSIFICATION
• Machine learning algorithms (Naive Bayes and K-Nearest Neighbors) for document classification.
• Flexible feature selection for automatic selection of best subsets of attributes.
• Numerous validation methods (leave-but-one, n-fold crossvalidation, split sample).
• Experimentation module allows easy comparison of predictive models and fine-tuning of classification
models.
• Classification models may be saved to disk and applied later using either a standalone document
classification utility program, a command line program or a programming library. Note: The command
line and the programming library are part of WordStat Software Developer's kit (SDK) which is sold
separately.
FULL INTEGRATION WITH A SIMTAT & QDA MINER
• Document and alphanumeric variables are stored in the same file as all other numeric variables.
• The same data file format is used by Simstat, QDA Miner and WordStat.
• Variable selection and analysis are performed withinSimstat using a simple 3-step operation:
• Open the existing data file.
• Select one or several alphanumeric fields as dependent variables and, optionally, other nominal
or ordinal variables to be treated as independent.
• Execute the CONTENT ANALYSIS command from the STATISTICS drop-down menu.
• New variables representing frequency or occurrence of words, keywords or concepts can be added to the
existing data file or exported to a new data file in order to be submitted to more advanced analysis (such
as cluster analysis, correspondence analysis, multiple regression, etc.).
• Data can be imported from and exported to different file format including dBase, Paradox, Excel, Quattro
Pro, Lotus 1-2-3, SPSS for DOS, SPSS for Windows, comma or tab separated text files, etc.
• Ability to perform numeric and alphanumeric transformation or to apply filters on cases of the data file
to restrict the analysis to specific subgroups.
WordStat User’s Manual
9
The Content Analysis & Categorization Process
The most basic form of content analysis that WordStat can perform is a simple frequency analysis of all words
contained in one or several text fields of a data file. However, WordStat offers several features that permit the
user to accomplish more advanced forms of content analysis that may involve automatic categorization, different
weighting of words, inclusion or exclusion of words based on frequency criteria, etc. To fully understand the
possibilities offered by the program, one first needs to understand the various underlying processes involved
in a typical WordStat frequency analysis and how these processes may be combined to achieve various kinds
of content analysis tasks.
WordStat's categorization involves up to five successive processes:
1-STEMMING OR LEMMATIZATION PROCESS
The stemming process is used to reduce the various word forms to a more limited set of words or word
roots. Such a process is typically used for lemmatization, a procedure by which all plurals are
transformed into singular forms and past-tense verbs are replaced with present-tense versions. It may
also be used for derivational stemming in which different nouns, verbs, adjectives and adverbs derived
from the same root word are transformed into this single word.
1- EXCLUSION PROCESS
An exclusion process may be applied to remove words that you do not want to be included in the
content analysis. This process requires the specification of an exclusion list. Such a process is used
mainly to remove words with little semantic value such as pronouns, conjunctions, etc., but may also
be used to remove some words used too frequently or with little discriminative value.
2- INCLUSION / CATEGORIZATION PROCESS
The inclusion / categorization process allows one to change specific words, word patterns or phrases
to other words, keywords or categories and/or to extract a list or specific words or codes. This process
requires the specification of an inclusion dictionary. This dictionary may be used to remove variant
forms of a word in order to treat all of them as a single word. It may also be used as a thesaurus to
perform automatic coding of words into categories or concepts. For example, words such as "good",
"excellent" or "satisfied" may all be coded as instances of a single category named "positive
evaluation", while words like "bad", "unsatisfied" or expressions like "not satisfied" may be
categorized as "negative evaluation".
3- ADDITION OF FREQUENT WORDS
The third process is the application of a frequency criterion that is used to add to the included words
or categories words that are used more than a specific number time or that are found in more than a
specific number of cases. When an inclusion dictionary is used, this option will append to this list of
included words or categories, all words that meet the minimum frequency criterion. If no inclusion or
categorization dictionary is used, all words that meet this minimum requirement and that have not been
excluded (see process #2) will be added to the final word/category list. Note that this process can only
10
WordStat User’s Manual
be used to add new words to the actual list of words and categories found in this inclusion dictionary.
It cannot be used to remove any of those items (see process #5).
4- REMOVAL OF WORDS OR CATEGORIES
When this process is active, all words or categories that do not meet a minimum frequency or case
occurrence criterion will be removed from the final word/category list. This process may be combined
with the inclusion/categorization process to remove infrequent categories. It may also be used in
conjunction with the addition criterion (see process #4) to provide a composite criterion of inclusion
that involves both a minimum keyword frequency and a minimum case occurrence.
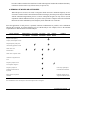
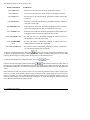
Since the application of each process is optional, numerous combinations are possible, each combination
allowing the researcher to perform different types of content analysis. For example, here are the minimal
requirements for different forms of content analysis:
TYPE OF ANALYSIS
LEMMATIZATION
OR STEMMING
EXCLUSION
DICTIONARY
INCLUSION
DICTIONARY
REMOVE
WORDS
COMMENT
/*
Simple word frequency
analysis (most frequent words)
/
Simple frequency analysis of
semantically significant words
Word count with
lemmatization
ADD
WORDS
/
/
/*
/
/*
/
Word count of specific words
/
Automatic categorization of
texts
/
Frequency analysis on the
most frequent categories.
/
Frequency analysis of
manually entered codes or
keywords
/
Codes may optionally be
inserted between brackets.
Rating of texts on specific
attributes
/
Different weights may be
assigned to different words
/
*recommended to restrict the analysis to the most frequent words or categories.
WordStat User’s Manual
11
A Quick Tour
A CONTENT ANALYSIS ON PERSONAL ADS
For this example, we will produce a content analysis on personal ads published in a Montreal cultural newspaper
on January 22 and January 29, 1998, and we will examine whether there is a relationship between words used
and the gender and age of the person who wrote the ad. The required data has been stored in a Simstat data file
named SEEKING.DBF. This tour assumes that Simstat is the base module used to run WordStat. Please refer
to the QDA Miner manual for information on how to run WordStat from within QDA Miner.
Step #1 - Open the data file
• From within SIMSTAT, select the FILE | DATA | OPEN command sequence and select the
SEEKING.DBF file
Step #2 - Select the variables
• Execute the STATISTICS | CHOOSE X-Y command
• Set the Variable List box to ALL to view all field types.
• Move the GENDER and AGEGROUP variables to the INDEPENDENT list box
• Move the AD_TEXT variable to the DEPENDENT list box
• Press the OK button
Step #3 - Run the content analysis module
• Execute the STATISTICS | CONTENT ANALYSIS command.
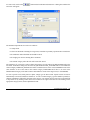
Step #4 - Choose the proper dictionaries
WordStat consists of a single dialog with five pages. The first page allows one to select, view, and edit
the dictionaries used in this specific content analysis. Set the dictionaries to the following values:
Exclusion: DICT\DEFAULT.EXC
Inclusion: DICT\SEEKING.CAT
and make sure all are active. (see check boxes on the left side of the dictionaries edit boxes)
Step #5 - Setting the proper options
The second page allows you to specify various options such as whether numeric values should be
included, whether frequent words should be added, etc. Disable all options by removing any check
mark in the various check boxes.
12
WordStat User’s Manual
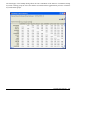
Step #6 - Perform an univariate frequency analysis on categories
• Click on the third tab (Frequencies). The program will perform a categorization of words found in the
ads and compute a frequency analysis on those categories.
• To sort the frequency matrix in alphabetical order, set the SORT BY option to Words. You can also
display those words in descending order of Keyword Frequency or Case Occurrence.
• By default, the words displayed in the matrix are those specified in the Inclusion list. To display words
that have been left out, set the DISPLAY option to Leftover.
• To move a word to the inclusion or the exclusion list, or to remove a word from the inclusion list, click
on the "+/- List" button or press on the right button of the mouse.
Step #7 - Examining the relationship between included categories and the gender of the
author.
• Press on the fourth tab (Crosstab).
• Click on the WITH drop-down list box and select GENDER. to display a contingency table of
categories frequency by gender.
The TABULATE option allows one to choose whether the table should be based on the total
frequency of included words or on the total number of cases containing those words.
The SORT BY option allows one to sort the table on the word or category name (alphabetical order)
or by descending order of keyword frequency. You may also click on any column header to sort the
grid in ascending or descending order of the values found in this column.
The DISPLAY option allows one to specify the information displayed:
•
•
•
•
Count
Row percent
Column percent
Total percent
Step #8 - Estimating the strength of the relationship
• Use the STATISTIC drop-down list box to select an association measure, such as a Chi-square or a
Pearson's R statistic.
To sort the table on the chosen statistic or on its probability, use the SORT BY drop-down list box.
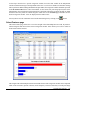
Step #9 - Visualizing the relationship between categories and the age of the author.
• Use the mouse to highlight cells of the categories you would like to compare.
• Click on the
button or press on the right button of the mouse and select the Chart Selected
Rows menu item. Click on Barchart to view compare the groups using bar chart
WordStat User’s Manual
13
Step #10 - Performing correspondence analysis on age groups
• Click on the WITH drop-down list box and select AGEGROUP to display keyword counts by age
group.
• Click on the
button to access the correspondence analysis dialog.
• Press on the 2D Map or 3D Map tabs to examine a 2 axis or a 3 axis solution, or on the STATISTICS
tab to browse through the correspondence analysis statistics.
• Press on the
button to close this dialog and return to WordStat main dialog.
Step #11 - Displaying a keyword by keyword matrix or a keyword by case matrix
• Click on the WITH drop-down list box and select <other words> to display a keyword by keyword
matrix or on <case no> to view a keyword by case matrix.
Step #12 - Viewing a Keyword-In-Context (KWIC) list of specific words or categories
• Press on the Keyword-In-Context tab to access the KWIC table.
• Set the LIST option to Included and select the word or category for which you would like to obtain a
KWIC table.
• Click on the GO button to display the KWIC table for this word or category.
To sort the table on the case number, on the keyword along with the prior or subsequent words, or on
the sex of the respondent, use the SORT BY drop-down list box.
• To display KWIC tables of any user-defined word or word pattern, set the LIST option to
"User-defined", enter your word pattern (with or without wildcards) in the WORD edit box and click
on the GO button.
Step #13 - Editing a text from the KWIC list
• To modify the word or keyword or the text surrounding it, select it from the KWIC list and click on
the EDIT button. (You may also double click on the specific line you wish to edit).
• To save the modified text, click on the OK button. Clicking on the CANCEL button restores the
original text.
Step #14 - Creating a concordance report
• Make sure the Keyword-In-Context page is active and that the KWIC table displays the proper
information.
14
WordStat User’s Manual
• Set the amount of context that should be displayed around each word by setting the CONTEXT
DELIMITER option.
• Press on the REPORT button. Note: If this button is inactive, click on the GO button to refresh the
content of the KWIC table and then click on the REPORT button.
Step #15 - Examining relationship between words or categories
• Click on the third tab to activate the Frequencies page.
• Press on the Tree/Map button to display the Dendrogram & Concept Maps dialog.
• Press on the Dendrogram tab to perform a hierarchical cluster analysis on included categories. You
may change the number of partitions displayed using the Nb Clusters option.
• Press on the 2D Map or 3D Map tabs to perform a multidimensional scaling and display a plot in 2 or
3 dimensions.
• Press on the
button to close this dialog and return to WordStat main dialog.
For more information see Hierarchical Clustering and Multidimensional Scaling (page 96).
Step #15 - Saving the keyword frequencies on disk
• Press on the SAVE button and choose the data from the Save Information box to export to the existing
data file or a new one.
Step #16 - Quitting the module and returning to SIMSTAT (or QDA Miner)
• Press on the OK button.
• Select the various outputs you would like to append to the statistical program notebook and click on
the OK button.
WordStat User’s Manual
15
Preparing and Importing Data
SIMSTAT as well as QDA Miner store numeric and alphanumeric data into a DBF file format. Memo fields
and rich text documents are stored in a separate file with a FPT extension. The file format used by SIMSTAT
is a proprietary format. This section provides general information on how to prepare textual data or specific
instruction on how to import data into SIMSTAT.
Preliminary Text Preparation
In order to perform content analysis, WordStat required that all information be transformed into raw text (or
plain ASCII text). While interview transcripts, responses to open-ended questions, or any other kind of textual
information may be typed directly within SIMSTAT, there are many situations where electronic versions already
exists either in the form of text files or as data files accessible only through specific applications such as
spreadsheet or database programs. All this information must be transferred into a SIMSTAT data file for further
processing. However, prior to this transfer, some modification or adjustments may need to be made.
Uppercase and lowercase letters
WordStat is case-insensitive and therefore accepts files in either upper- or lowercase.
Check spelling of documents
The automatic content analysis feature of WordStat involved numerous operations of word recognition and
generally requires each word to be spelled correctly. Any misspelled word may be left uncoded and leads to
imprecise or invalid conclusions. For this reason, it is strongly suggested to run your text file through a spelling
checker to make sure all words are spelled correctly. WordStat provides spell checking for English, French,
Spanish, Dutch, German, Italian and several other languages (see www.provalisresearch.com web site).
Remove hyphenation
While WordStat can be configured to accept compound words with dashes, it cannot differentiate dashes and
hyphens. As a consequence, an hyphenated word will often be treated as two separate words. It is thus
recommended to revise the text to insure no hyphenation is present.
Add or remove square brackets ( [ ] ) and braces ( { } )
Square brackets and braces have special meanings for WordStat. For example, braces are used to remove a
section of the text that you don't want to process while square brackets may be used to restrict the analysis to
specific portions of text. If these symbols are used in a text for other purposes, they should be replaced with
other symbols.
If there are specific parts of your text that you do not what to process, such as some explanation notes,
interviewer questions and probes, comments, etc.), enclose them in braces (ex. {comment} ). Also, if you want
to perform a content analysis on only a small portion of the entire text, such as on manually entered codes,
enclose this portion of text in square brackets.
16
WordStat User’s Manual
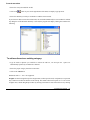
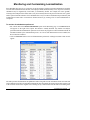
Importing Spreadsheet Files
Most spreadsheet programs allow for entry of both numeric and alphanumeric data into cells of a data grid.
SIMSTAT as well as QDA Miner can import spreadsheet files produced by LOTUS 1-2-3 (v1.1 to v5.0),
SYMPHONY (v1.0 and v1.1), EXCEL, and QUATTRO PRO (v1.0 to v6.0). To import data from any of these
applications:
• From Simstat, choose the DATA | IMPORT command from the FILE menu.
• From QDA Miner, choose the NEW command from the PROJECT menu and then select IMPORT FROM
AN EXISTING DATA FILE.
• Select the file format using the List File of Type drop down list.
• Select the file you want to import and click on the OK button.
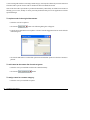
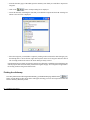
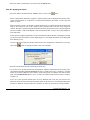
The program displays a dialog box where one can specify the spreadsheet page and the range of cells where the
data are located. You must specify a valid range name or provide upper left and lower right cells, separated by
two periods (such as A1..H20). If you set the Range Name list box to ALL, the program attempts to read the
whole page.
Formatting spreadsheet data
The selected range must be formatted such that the columns of the spreadsheet represent variables (or fields)
while the rows represent cases. Also, the first row should preferably contain the variable names while the
remaining rows hold the data, one case per row. SIMSTAT and QDA Miner will automatically determine the
most appropriate format based on the data it finds in the worksheet columns. Cells in the first row of the selected
range are treated as field names. If no variable name is encountered, SIMSTAT and QDA Miner will
automatically provide one for each column in the defined range.
When reading the data for analysis, all blank cells and all cells that do not correspond to the variable type (e.g.,
alphanumeric entries under a numeric variable, or a numeric value under a string variable) are treated as missing
values.
WordStat User’s Manual
17
Importing Database Files
MS Access, dBase and Paradox files
SIMSTAT as well as QDA Miner can directly import MS Access, dBase and Paradox data files.
To import data from one of these applications:
• From Simstat, choose the DATA | IMPORT command from the FILE menu.
• From QDA Miner, choose the NEW command from the PROJECT menu and then select IMPORT FROM
AN EXISTING DATA FILE.
• Select the file format using the List File of Type drop down list.
• Select the file you want to import and click on the OK button.
Other database files
Most database applications provide exporting capabilities that allow the user to save a copy of the data file in
several file formats. The recommended file formats are, in descending order of preference, FoxPro 2.x data file
and Tab separated text files. However, if your data file contains no memo fields and no alphanumeric fields
larger than 256 character you may also export your file to a dBase, a Paradox, or any supported spreadsheet data
file.
Importing memo fields
Memo fields that have not been successfully imported, may be transferred to the data file either by using cut and
paste operations or by retrieving text files from disk. For more information on this topic, see Importing Plain
Text and Word Processor Files (page 19)
18
WordStat User’s Manual
Importing Plain Text or Word Processor Files into SimStat
Probably one of the easier ways to transfer data from a word processor document into SIMSTAT is to open
simultaneously both applications and use cut and paste operations to transfer data through the clipboard.
However, this may not be the most efficient way, especially when one needs to import a large amount of
information. The following section presents four additional methods to transfer text information into memo
fields:
• Using the Document Conversion Wizard program
• Retrieving a text file into a memo field
• Importing comma or tab delimited text file
• Importing page delimited memo files
While the first method can read textual data stored in word processor documents, the last three methods require
the data to be stored on disk in plain ASCII files without any formatting or typesetting code. Most word
processors offer an option to save a document as a plain text file. If you don't know how to create such a text
file, please refer to your word processor manual.
Using the Document Conversion Wizard program
WordStat includes a conversion utility program that can assist you in the importation of text files stored in either
word processor documents such as MS Word, MS Write, WordPerfect, RTF, or Acrobat PDF files, but also of
text stored in ASCII (plain text), HTML or even Excel spreadsheet files. To run this program:
• Point to the Programs folder in the Windows' Start menu, then select Provalis Research and then click on
Document Conversion Wizard.
This utility program will guide you through the process of importing one or numerous text files.
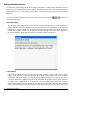
Retrieving a text file into a memo field
This method should be used to retrieve a single unit of text into a memo field for a specific case. If textual data
for several cases need to be retrieved, they should be stored in different text files. To retrieve the text file from
SIMSTAT:
• Open the data file where the information should be stored.
• Position the cursor on cell in which you would like to store the text. A memo editor should appear at the
bottom of the data sheet.
• Click inside the memo editor or press F2.
• Click on the Import Text Into Memo button
, select the text file you wish to retrieved and click OK.
WordStat User’s Manual
19
Importing comma or tab delimited text files
If you wish to retrieve a text file containing several numeric and alphanumeric variables, you may have to
transform this file into a comma or tab delimited text file. There are, however, several limitations to this transfer
method. If commas are used as delimiters, then all existing commas within text fields should ideally be removed.
If a tab delimited format is chosen, all tab characters already present in a text field should be removed. Another
important limitation is that all the information of a single case must be stored in a single line. For this reason,
hard returns in long texts should be removed so that the entire text is stored on a single line. (There is no
limitation on the total number of columns per line, so it is possible to store very long texts on a single line).
SIMSTAT can read up to 500 numeric and alphanumeric variables from a plain ASCII file (text file). The file
must have the following format:
• Every line must end with a carriage-return.
• The first line must include the variable names, separated by tabs or commas.
• Variable names may have a length of not more than 10 characters. Longer strings are truncated to 10
characters.
• The remaining lines must include the numeric or alphanumeric values, separated by tabs or commas.
• Each line must contain data for one case and variables must be in the same order for all cases. All invalid
data and all blanks encountered between commas or tabs are treated as missing values. A single dot can
also be use to represent a missing numeric value.
• Comments can be inserted anywhere in the file by putting a * at the beginning of the line.
• Blank lines can also be inserted anywhere in the file.
• Comma delimited text files requires a .CSV extension while tab delimited files requires a .TAB extension.
Importing page delimited memo files
SIMSTAT provides a simple method to import numerous texts by the use of page delimited memo files This
file format consists of a plain text file which contain the textual data of numerous individuals for a single memo
field. The text for each case must be separated by page break characters (ASCII 12). The file name extension
of this text file should be .MMO. To import such a file:
• Choose the DATA | IMPORT command from the FILE menu.
• Set the file format to Page Delimited Memo using the List File of Type drop down list.
• Select the file you want to import and click on the OK button.
The resulting file consists of a SIMSTAT data file with two fields: RECNO, a numeric field containing a
sequential number going from 1 up to the total number of cases encountered in the input file, and TEXT, a
memo field containing the textual data for this case.
Note: Importation of numerous text fields may be achieved by performing successive importations of page
delimited memo files and then using the APPEND VARIABLES command to merge the resulting files into a
single one. In order to achieve this, great care should be taken to give unique names to the various TEXT fields
and to assure that the case sequence of the various text files is identical.
20
WordStat User’s Manual
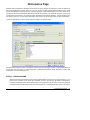
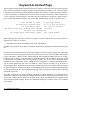
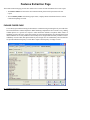
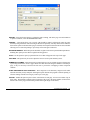
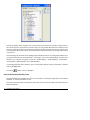
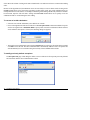
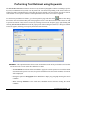
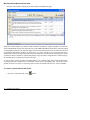
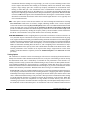
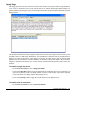
Dictionaries Page
Without further information, WordStat can perform a frequency analysis on each of the words encountered in
the chosen alphanumeric fields. However, it is also possible to apply various transformations on the words
before performing the frequency analysis. The first two pages of the main dialog box (see below) allow one to
specify how the textual information should be processed. For example, you can tell the program to preprocess
words using two dictionaries: an exclusion and an inclusion/categorization dictionary. The Dictionaries page
also allows you to use or create those dictionaries, add, remove or edit existing entries in those dictionaries.
(For more information of other analysis options available see Options Page)
The following section provides a description of the four processing steps involved in the transformation of
textual data into keywords or content categories. Additional information about dictionary creation and
maintenance can be found on page 56.
STEP #1 - PREPROCESSING
The preprocessing option allows for the custom transformation of the text to be analyzed prior to, or in
place of the execution of the other three standard processes provided by WordStat: lemmatization,
exclusion and categorization. This transformation is accomplished by the execution of specially designed
external routines accessible in the form of an external EXE file or a function in a DLL library. This feature
WordStat User’s Manual
21
is provided to offer greater flexibility by allowing any user with programming skills or resources to
customize the processing of textual information. For more information on this feature see Configuring
External Preprocessing Routines on page 80.
STEP #2 - LEMMATIZATION
Lemmatization is a process by which various forms of words are reduced to a more limited number of
canonical forms. A typical example of lemmatization would be the conversion of plurals to singulars and past
tense verbs to present tense verbs. The lemmatization algorithm implemented in WordStat is a
dictionary-moderated method, partly inspired by Krovetz's KSTEM suffix substitution algorithm. Since the
lemmatization algorithm does not rely on a prior part-of-speech tagging of words, it is much faster than
traditional lemmatization routines. It may, however, result in a few invalid word substitutions, but usually,
those errors will have no major consequences on the result of an analysis. WordStat offers a way to monitor
all substitutions performed by this lemmatization routine and to override any by creating a list of custom
substitutions. For more information on such a feature, see Monitoring and Customizing Lemmatization on
page 77.
STEP #3 - EXCLUSION OF WORDS
The exclusion dictionary (also known as a stop list) is used to remove all words that are not to be included
in the content analysis. It is used mainly to remove words with little semantic value such as pronouns,
conjunctions, etc. Wildcards such as * and ? are supported.
For example, the following expression:
REPORT*
will exclude all words beginning with REPORT (such as, REPORT, REPORTS, REPORTER).
The next example:
EXP?RT
will remove both EXPORT and EXPERT.
An expression that includes several words may also be excluded by joining the various words with underline
characters. For example:
NOT_*
Will exclude all words preceded by the word "not".
The currently opened exclusion dictionary may be deactivated by removing the check mark in the check box
at the left of the exclusion dictionary name.
STEP #4 - CATEGORIZATION OF WORDS AND PHRASES
The inclusion dictionary allows one to change specific words, word patterns (such as REPORT* or
EXP?RT), or expressions, to another word, category or concept. This feature may be used to remove variant
forms of a word in order to treat them as a single instance or to group related words under meaningful
categories. Inclusion dictionaries may also be used to perform a frequency analysis on manually entered
codes. By manually entering specific keywords (such as "EVAL_POS" , or "EVAL_NEG") in a text field and
22
WordStat User’s Manual
by entering those same keywords in the inclusion list, it becomes possible to extract those codes and perform
frequency and contingency analysis on them.
A categorization dictionary may also contain rules delineating the conditions under which specific words
or phrases should be categorized. Those rules may consist of complex expressions involving Boolean (AND,
OR, NOT) and proximity operators (NEAR, BEFORE, AFTER). Those kinds of rules allow one to eliminate
basic ambiguity in words by taking into account the presence of other words that may alter the meaning. A
good example would be the presence of a negative word form (such as "rarely" or "never") close to an
adjective. Another example would be the differentiation of the various meanings of the word BANK by
identifying other words like "river", "money" and "deposit" surrounding "bank". For more information on
rules, see section Working with Rules, page 64.
The inclusion dictionary is structured as a hierarchical tree where words, word patterns, phrases, and rules
are grouped in a folder that represents a category name. Categories and individual words may also be
included in a higher order category, allowing one to create multi-level dictionaries like the following one:
COUNTRY
NORTH-AMERICA
• CANADA (1)
• UNITED-STATES (1)
• USA(1)
• MEXICO (1)
SOUTH-AMERICA
• BRAZIL (1)
• CHILI (1)
In the above example, words like CANADA,USA, or MEXICO may be coded as either NORTHAMERICA or COUNTRY, depending on whether the categorization is performed up to the first or
second level of the dictionary (see Level of Analysis, page 25).
Wildcards such as ∗ and ? are supported. For example, the following item under the support
category:
SUPPORT
• SUPPORT*
will change SUPPORT, SUPPORTS, SUPPORTING, SUPPORTIVE, SUPPORTER, etc. into a single
word SUPPORT, while the following word pattern:
SUPPORT
• *SUPPORT*
will also substitute all words with the substring "SUPPORT" in it, such as UNSUPPORTEDLY,
UNSUPPORTED, etc.
An expression that includes several words may also be substituted by joining the various words with
WordStat User’s Manual
23
underline characters. For example, you may change the expression "going out" with the category
"NIGHTLIFE" by specifying the following item:
NIGHTLIFE
• GOING_OUT
You may also use wildcard in expressions such as:
NIGHTLIFE
• GO*_OUT
to substitute several forms of an expression at once.
Integer weights can also be assigned to specific items so that a specific word or word pattern may count
for more than one instance of the category. For example, in order to compute an aggressiveness score
on specific texts, you may choose to assign a weight of 5 points to word patterns such as KILL* or
MURDER* but only a single point to word patterns like INSULT*.
CATEGORIZATION SETTINGS
LEVEL OF ANALYSIS - This option allows one to specify up to which level the coding should be
performed. For example, in the following dictionary:
COUNTRY
NORTH-AMERICA
• CANADA (1)
• UNITED-STATES (1)
• USA (1)
• MEXICO (1)
SOUTH-AMERICA
• BRAZIL (1)
• CHILI (1)
if a level of 1 is specified, all words that are stored at a higher level than the root level will be
coded as the parent category at this first level. For example, words like CANADA and MEXICO will
be coded as COUNTRY along with other country names like BRAZIL. Setting the level of analysis
to a numeric value of 2 will results in the coding of those two words as NORTH-AMERICA, while
BRAZIL will be coded as SOUTH-AMERICA. Items stored at the same or at a lower level than
this option will remain unchanged.
Setting the LEVEL option to AS SHOWN instructs WordStat to match the level of categorization
performed to the level of details currently displayed in the tree view of the categorization
dictionary. This option allows one to set different levels of categorization by expanding broad
categories that should be broken down and by collapsing categories for which finer details are not
24
WordStat User’s Manual
needed. For example, if we modify the above tree by collapsing the NORTH-AMERICA category,
WordStat will display it the following way:
COUNTRY
NORTH-AMERICA
SOUTH-AMERICA
• BRAZIL (1)
• CHILI (1)
The program will report frequencies of individual countries like BRAZIL or CHILI but will
categorize every instance of CANADA, UNITED-STATES, USA and MEXICO as NORTHAMERICA.
Please note that it is possible to prevent a category from being broken down into subcategories
or items, even if the level of analysis is set to a higher setting or if it is set to AS SHOWN and the
items contained in this category are visible. Such a feature is useful when the content of a category
consists of different ways of referring to the exact same thing (for example UNITED_STATES,
UNITED_STATES_OF_AMERICA, US and USA) or consists of various misspellings.
To make a category unbreakable, select the category in the dictionary tree, click on the
button, and put a check mark in the Unbreakable box. The folder icon normally used to represent
categories will be transformed into a folder icon
with a key inside. You may also select the
category, right click, and then select UNBREAKABLE | YES from the pop-up menu. To unlock
the folder, follow the previously described steps for editing the category and remove the check
mark in the Unbreakable box or select UNBREAKABLE | NO from the pop-up menu.
CATEGORIES ONLY - When the LEVEL OF ANALYSIS option is set to a value higher than one, this
option instructs WordStat to limit the level increase to the coding of the last category at or below
the specified level. This option is especially useful when working with unbalanced hierarchical
categorization systems where individual words are stored at different levels. For example, in the
following dictionary:
SENSATION
ODOR
• AROMA (1)
• BREATH (1)
• FRAGRANCE (1)
• NOSE (1)
ANXIETY
• AFRAID (1)
• TREMOR (1)
setting the level of analysis to 2 without enabling this option would code words like AROMA or
BREATH as ODOR, but would include in the final results individual words like TREMOR or
WordStat User’s Manual
25
AFRAID. Enabling the CATEGORIES ONLY option insures that individual words won't be
included but will be coded as their parent category.
USE FULL PATH AS CATEGORY NAME - When the LEVEL OF ANALYSIS option is set to a value
higher than one, this option instructs WordStat to substitute the full path of an item as the category
name. The slash ( / ) characters is used to separate the various levels. For example, in the above
example, setting this option to true and the level analysis to 2 will code the word AROMA as
SENSATION/ODOR. Increasing the level of analysis up to 3 will return
SENSATION/ODOR/AROMA.
ALLOW OVERLAP - By default, categories are mutually exclusive such that a word can only be
entered in a single category. Enabling this option allows one to create overlapping categories
where words can be classified simultaneously into two or more categories. However, please take
note that current multivariate techniques available in WordStat such as clustering, correspondence
analysis and multidimensional scaling as well as other multivariate statistical procedures make the
assumption that categories are statistically independent. Using overlapping categories creates data
that clearly violate this assumption and may yield dubious results.
SHOW WARNINGS - Some items in an exclusion list or categorization dictionary may remain
undetected in documents because of their incompatibility with some analysis options. This occurs,
for example, when an item is found both in the categorization dictionary and the exclusion list, or
when this item includes non-alphabetic characters that have not been specified as valid. The
following table displays the various types of problems that may be identified by WordStat:
26
TYPE
DESCRIPTION
Item includes invalid characters
WordStat identifies individual words using
alphabetic characters and other special characters
specified by the user in the Valid Characters option.
So, to make sure any item containing non-alphabetic
characters is properly recognized, this special
character must be added to the list of valid
characters.
Item includes numeric characters
An item in the categorization dictionary or the
exclusion list that includes numeric characters cannot
be recognized since the Accept Numeric Characters
option is currently disabled.
Item also in the exclusion list
An item found in a categorization dictionary cannot
be recognized if it matches an item found in the
exclusion list.
Phrase starts with an excluded word
In order to be recognized, a phrase cannot start with
a word found in the exclusion list. Therefore, this
excluded word should preferably be removed from
the exclusion list in order for the phrase to be
recognized.
WordStat User’s Manual
Enabling the Show Warnings option instructs WordStat to identify potential compatibility
problems affecting items in a dictionary, and it displays a list of those problems in a special dialog
box. This dialog is displayed prior to the application of dictionaries for a content analysis.
For more information on how to open, activate or deactivate a dictionary or how to add, edit or remove an entry
in a dictionary, see Creating and Maintaining Dictionaries, page 56)
WordStat User’s Manual
27
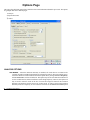
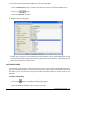
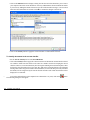
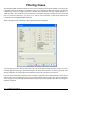
Options Page
This page offers different options that control how the textual information should be processed. The options
are grouped under three different pages:
1) Analysis
2) Speller/Thesaurus
3) Others
ANALYSIS OPTIONS
ADD WORDS - When the inclusion dictionary is disabled, all words that are not found in the
exclusion list will be included in the final keyword frequency analysis. This option allows one to
restrict the number of words included to the most frequent ones by setting a minimum Frequency
or Case Occurrence criterion for inclusion. This option may also be used while the inclusion list
is active to add to this list, other words that are used at a high frequency. However, this option can
only be used to add new words to the list of words and categories found in this inclusion
dictionary and cannot be used to remove any of those items. To remove items in this inclusion
dictionary based on a frequency or case occurrence criterion see the REMOVE WORDS option
28
WordStat User’s Manual
below.
REMOVE WORDS - This option allows one to restrict the number of included words or categories to
the most frequent ones by setting a minimum Frequency or Case Occurrence criterion for
inclusion. This criterion is applied both to items in the inclusion dictionary and words that meet
the criterion specified with the ADD WORDS option.
Examples:
•
If no inclusion dictionary is used and you want to include any word that appears at least 10
times, but in no less than 5 different cases, you need to activate the ADD WORDS option
and set its criterion to a minimum FREQUENCY of 10. You then have to set the REMOVE
WORDS criterion to a minimum Case Occurrence of 5. Only words that meet both criteria
will be included.
• When an inclusion list is used to lemmatize words, but you only want to obtain frequency
information on those words that appear a specific number of times, you have to activate the
inclusion dictionary and set the minimum frequency criterion of both the ADD WORDS
and REMOVE WORDS options to the required frequency.
• When an inclusion list is used to categorize words, but you only want to analyse the most
frequent categories, you have to activate the inclusion dictionary and set the REMOVE
WORDS option to the required frequency. In this situation, the ADD WORDS option
should be deactivated.
LEAVE CATEGORIES EQUAL TO ZERO - By default, WordStat removes from the frequency table
any keyword or category in the categorization dictionary that had not been encountered in the
analyzed text. Enabling this option instructs the program to leave those items with a zero
frequency in the table. Such an option is especially useful when comparing obtained frequencies
to normative data or to other samples. This option should also be enabled when creating norm
files (see Creating and Using Norm Files on page 89).
REMOVE ITEMS OCCURRING IN MORE THAN ? PERCENT OF CASES - This option allows one
to remove keywords or categories appearing in more than a specified percentage of cases. This
criterion is applied both to items in the categorization dictionary and to words that meet the
criterion specified in the ADD WORDS option. Such an option is especially useful to remove
words that are too common to have any informative or discriminative value.
DON'T PROCESS TEXT WITHIN BRACES - This option can be used to instruct the program to skip
all text found between braces (i.e. { and } ). This option is especially useful when you want to
insert comments or annotations in the text field without affecting the content analysis. It can also
be used to ignore in an interview transcript all questions, prompts, and other verbal interventions
made by the interviewer.
DON’T PROCESS TEXT WITHIN BRACKETS - This option can be used to instruct the program to
skip all text found between brackets (i.e. [ and ] ). Since WordStat can also be configured to
WordStat User’s Manual
29
analyze only text found between such brackets (see option below), these two options may be used
to toggle between an analysis of keywords entered manually between those brackets and of the
surrounding text.
PROCESS ONLY TEXT WITHIN BRACKETS - This option can be used to instruct the program to
process only the text found between brackets (i.e. [ and ] ). This option may be used to perform
an analysis on keywords entered manually in the text by one or several coders.
RANDOM SAMPLE - When this option is activated, the program will randomly select a fraction of
all cases and performs the content analysis on this subsample. The proportion of cases can be
specified using the spin button located at the right of the checkbox. This option reduces the
processing time for large files and is especially useful during the initial phase of an analysis where
dictionaries are constructed and categorization schema are developed and revised. It also allows
one to preview the kind of results that would be obtained on very large data files.
ACCEPT NUMERIC CHARACTERS - By default, every word consisting of numeric values or of a
mix of letters and numbers is excluded from the analysis. This option can be used to include those
words.
VALID CHARACTERS - This option allows one to specify which characters, beside letters of the
alphabet, should be considered as an integral part of a word. For example, the word "ex-wife" can
be treated as a single word or as two separate words (i.e. "ex" and "wife") if the hyphen is
included in the list of valid characters.
CASE SENSITIVE - By default, WordStat internally convert all text to uppercase letters so that
processing of words is cases insensitive. This may be inappropriate if one wants to identify proper
nouns or analyze text written in some European languages like German where difference in letter
cases may denote different meaning. Enabling this option prevent the internal conversion to
uppercase letters and will treat two instances of the same word different in their case (lower or
upper case) as two distinct words.
DISABLE CROSSTAB AND CLUSTER - If you are only interested in obtaining a frequency analysis
of words or categories or in exploring the usage of specific words using KWIC lists, then you may
use this option to disable the collection of information used for crosstabulation and clustering.
When this option is set, the memory requirement for an analysis is drastically reduced and the
performance is increased.
WORKING SPACE - By default, WordStat uses available computer memory to stores all temporary
lists and data. This option speeds up computation, but you might run out of memory on very large
projects. Selecting the DISK option frees up memory and allows you to analyze larger projects,
at the cost of slower computation.
INCLUDE RECORDS WITH MISSING VALUES - When examining the relationship between textual
data and categorical or numerical variables, WordStat will skip any cases with a missing value
on any one of these variables. Enabling this option instructs WordStat to include all cases whether
or not values are missing. All missing values are assigned to an additional class labeled as
"MISSING." Any analysis involving comparisons between classes of categorical variables
(cross-tabulation, correspondence analysis, etc.) will include this additional class.
30
WordStat User’s Manual
WEIGHTING VARIABLE - This option allows the selection of a variable that will be used to apply
weight to the cases. When the program reads a case, the value of the weighting variable for this
case is truncated to an integer. This integer value specifies how many times the case will be
duplicated. If the value is less than one, the case is excluded from the analysis. This option is
especially useful when the textual data to be analyzed have already been reduced to a frequency
list, such as when analyzing a list of the most frequent queries on a search engine.
SPELLER / THESAURUS PAGE
ACTIVE DICTIONARIES - WordStat make use of language dictionaries in order to spell-check existing
textual data and to suggest inflected forms of words found in the user dictionary. This group of options
let you specify the dictionary to use with the current data file.
SPELLER OPTIONS
CONFIRM ADDITION TO USER DICTIONARY - When this option is activated, you will be prompted
after clicking on the Add button of the spell-checking dialog to confirm word additions to the
custom dictionary.
IGNORE WORDS CONTAINING NUMBERS - Enabling this option instructs WordStat to ignore any
word that contains one or more numeric characters,.
IGNORE WORDS IN UPPER CASES - Enabling this option instructs WordStat to ignore all words
fully in uppercase.
THESAURUS
DISABLE ENGLISH THESAURUS - WordStat's Suggest feature uses an English thesaurus to suggest
synonyms of existing words in the user directory. This option allows one to disable this feature.
This may be especially useful when developing a dictionary in another language than English or
when one only want the program to suggest inflected forms. (for more information on this feature,
see Using Lexical Tools for Dictionary Building, page 69)
OTHERS PAGE
PERCENT DECIMAL PLACES - Using this option to modify the number of decimal places used to
display percentages in frequency tables and in crosstabulation tables.
SHOW HARD RETURNS AS ¶ - In KWIC lists and reports, hard returns normally used to mark the
beginning of a new paragraph are represented by a ¶ symbol. This option allows to toggle on and
off the display of this symbol.
WordStat User’s Manual
31
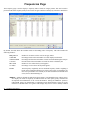
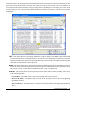
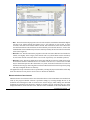
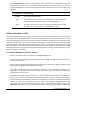
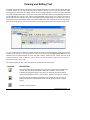
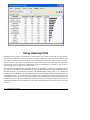
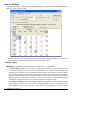
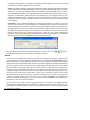
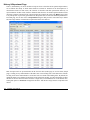
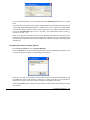
Frequencies Page
The Frequency page is used to display a frequency table of words or category names. This can be used to
perform an univariate frequency analysis on words or categories and also to modify any of the three dictionaries.
By default, the table shows the included words in descending order of frequency. The table includes the
following statistics:
FREQUENCY
% SHOWN
% PROCESSED
% TOTAL
NB CASES
% CASES
Number of occurrences of the word or category names.
Percentage based on the total number of words displayed in the table
Percentage based on the total number of words encountered during the analysis.
Percent based on the total number of words less those excluded by list.
Number of cases where this keyword appears.
Percentage of cases where this keyword appears.
TF*IDF
Term frequency weighted by inverse document frequency. Such a weighting is
based on the assumption that the more often a term occurs in a document, the
more it is representative of its content yet, the more documents in which the term
occurs, the less discriminating it is.
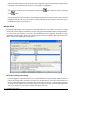
DISPLAY - While by default, the table shows the frequency of all included words, it allows one to
also display all words not explicitly excluded but left out. This option greatly facilitates the
development and maintenance of the various dictionaries. Setting the DISPLAY option to
LEFTOVER allows for identification of important words that should have been put in the
inclusion or substituted but were ignored. This display may also be used to identify common
32
WordStat User’s Manual
words that might be added to the exclusion list.
SORT BY - This option allows a display of words in the frequency table in alphabetical order, on
keyword endings, or by descending order of keyword frequency (NB WORDS column) or case
occurrence (NB CASES column). Sorting the table by keyword endings facilitates the
identification of plural form of words that should be substituted by their singular form or the
substitution of verbs by their infinitive form.
The
button can be used to move one or several words to the exclusion or substitution list
or to add or remove a word from the inclusion list. The permitted moves depend on the words
currently displayed. If you want to remove a word from the inclusion list, the DISPLAY option
should be set to INCLUDED or ALL. To add a word to the inclusion list, the DISPLAY should
be set to LEFTOVER or ALL. This button is also used to display a Keyword-In-Context table of
the selected keyword.
It is also possible to quickly access the pop-up menu invoked by this button by pressing the right
button of the mouse anywhere on the grid (see below).
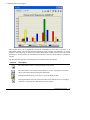
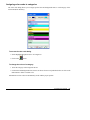
The
button allows one to produce barcharts or pie charts to visually display the distribution of
specific keywords or categories. To produce such charts:
• Set the Sort By option to the order in which you wish the values be shown graphically.
• Select the rows you would like to plot (multiple but separate rows can be selected by clicking
while holding down the CTRL key)
WordStat User’s Manual
33
• Click on the
button.
For further information see Displaying Distribution Using Barcharts or Pie Charts on page 86.
The
button allows one to perform cluster analysis and multidimensional scaling on all included
words or categories and display a dendrogram or concept map of those items based on their proximity.
For further information see Hierarchical Clustering and Multidimensional Scaling page 97).
The
button allows one to create normative frequency data from the current file, to store them on
disk and to compare currently displayed frequencies with previously saved norms. See Creating and
Using Norm Files on page 89 for more information on this topic.
The
button may be used to append frequency information to the current data file, save to disk
a matrix of word or keyword frequency by cases or export the current categorization model. For more
information on one of these topics see Exporting Frequency Data (page 145) or Exporting
Categorization Models (page 147).
The
button allows one to access a keyword retrieval feature to retrieve all documents, paragraphs
or sentences containing a specific keyword or a combination of keywords. See Keyword Retrieval
(page 90) for more information on this topic.
The
button is used to draw color guidelines on alternate rows in order to facilitate the reading
of large tables. When clicking on this button color guidelines are shown. Clicking this button again
removes the color guidelines.
To export the frequency table to disk:
• Click on the
button. A Save File dialog box will appear.
• In the Save as Type list box select the file format in which to save the table. The following formats are
supported: ASCII file (*.TXT), Tab delimited file (*.TAB), Comma delimited file (*.CSV), HTML file
(*.HTM;*.HTML), and Excel spreadsheet file (*.XLS).
• Type a valid file name with the proper file extension.
• Click on the Save button.
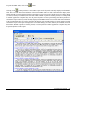
To copy the entire table to the clipboard:
• Right-click anywhere in the frequency table.
• Select the COPY TO CLIPBOARD | TABLE command from the pop-up menu.
34
WordStat User’s Manual
To copy selected rows to the clipboard:
• Select the rows you would like to copy (multiple but separate rows can be selected by clicking while
holding down the CTRL key).
• Right-click anywhere in the frequency table.
• Select the COPY TO CLIPBOARD | SELECTED ROWS command from the pop-up menu.
To search for a specific item:
• Right-click anywhere in the frequency table.
• Select the FIND command from the pop-up menu. A search dialog will appear.
• Type the search string in the Find What edit box. To restrict the search to items starting with the search
string, enable the Match Beginning of Item option. To restrict the search to whole words matching the
search string, enable the Match Whole Word Only.
• Click on the Find button to search the first item matching the typed string. Clicking on this button again
finds the next occurrence of the search string, starting at the currently selected item.
WordStat User’s Manual
35
Crosstab Page
The Crosstab page is used to display a contingency table of words or categories. This contingency table is
computed only on items that have been included. If an inclusion dictionary has been specified, this grid will
display only the words or keywords in this list. If no inclusion list has been specified, the grid will display all
words that have not been explicitly excluded. Along with absolute and relative frequency of keyword occurrence
or keyword frequency, several statistics may be displayed to assess the relationship between independent
variables and word usage or to assess the reliability of coding made by several human coders or a single coder
at different times.
Options
TABULATE - The TABULATE option allows choosing whether the values in the table should be based
on the total frequency of keywords or the number of cases containing those keywords.
WITH - The WITH drop down list allows choices on how the keyword count should be broken down. The
following options are available:
• <other keywords> - display a square table showing the number of co-occurrence of words in the
same case.
• <case number> - display the keyword occurrence or frequency for each individual cases.
36
WordStat User’s Manual
• ANY INDEPENDENT VARIABLE - If numeric independent variables were selected as independent
variables, their names will appear at the bottom of this list box. Selecting any of those variable
names will display a contingency table allowing for the assessment of the relationship between this
independent variable and the words or categories.
• <variables> - When the content analysis is performed on several alphanumeric variables, this option
will allow for comparison of the occurrence of words according to variable name.
SORT BY - The SORT BY option presents the opportunity to sort the table by keyword or category names
(alphabetical order) or by descending order of frequency or case occurrence. When a statistic is displayed
(see option STATISTICS), the table can also be sorted based on the value of this statistic or on its
statistical probability. It is also possible to sort on the values of any specific column by clicking on this
column heading. Clicking several times of the same column heading toggles between ascending and
descending sort orders.
DISPLAY - The DISPLAY list box allows one to specify the information displayed in the table. The
following options are available:
•
•
•
•
Count
Row percent
Column percent
Total percent
When the TABULATE option is set to Case Occurrence, two additional statistics are also available:
• Percent of cases (percentage of all cases or individuals)
• Category percent (percentage of cases or individuals in this subgroup)
STATISTIC - When keyword frequency or occurrence is broken down by an independent variable (see
WITH option), a drop down list box will appear. This list box allows one to choose among 12 association
measures to assess the relationship between this independent variable and the utilization of each word
or category.
Nominal level statistics
• Chi-square
• Likelihood ratio
• Student's F
Ordinal or internal level statistics
•
•
•
•
•
•
•
•
•
Tau-a
Tau-b
Tau-c
Somers' D (symmetric)
Somers' Dxy (asymmetric)
Somers' Dyx (asymmetric)
Gamma
Spearman's Rho
Pearson's R
WordStat User’s Manual
37
PROBABILITY - The probability option allows one to select whether the probability value should be
computed using a 1-tailed or 2-tailed test. Probabilities of Chi-square, Likelihood ratio, and Student's F
are always computed using a 2-tailed test.
AGREEMENT - When comparing word or category usage between different alphanumeric variables, a drop
down list box will appear. This list box allows one to choose among 8 different inter-rater agreement
measures to assess the reliability of coding.
Nominal level agreement statistics
• Percentage of agreement
• Cohen's Kappa
• Scott's pi
• Free marginal (nominal)
Ordinal or internal level agreement statistics
• Krippendorf's R
• Krippendorf's r-bar
• Free marginal (nominal)
• Intraclass correlation
For more information on how to assess reliability with those statistics see Computing Inter-Rater Agreement
Statistics (page 142).
Creating barcharts or line charts
The Crosstab page also allows one to produce barcharts or line charts to visually compare the distribution
of specific words or categories among values of an independent variable such as subgroup of individuals
(male vs female) or time periods. To produce such charts:
• Set the TABULATE and DISPLAY options so that the information you want to visualize is
displayed in the table.
• Using the mouse, select the rows you would like to display. Multiple disjunct rows can be selected
through clicking while holding down the CTRL key.
• Click on the
command.
38
WordStat User’s Manual
button or press the right button of the mouse and select the Chart Selected Rows
A dialog like this one will appear:
This window allows one to graphically examine the relationship between codes and values of an
independent variable. The bar chart should preferably be used to display the distribution of various
categories within subgroups as defined by a nominal independent variable, while the line chart should
preferably be used to examine the relationship between those categories and an ordinal or quantitative
variable.
The following table provides a short description of available buttons and controls:
Controls
Description
Press this button to retrieve a chart previously saved on disk.
Press this button to save a chart on disk. Charts are saved in a proprietary format and
may be edited and customized using the Chart Editor.
Pressing this button allows you to print a copy of the displayed chart.
Pressing this button causes the values represented on the bottom axis to be exchanged
with those of represented by different lines or bars (legend).
WordStat User’s Manual
39
Click on this button to turn on/off the 3D perspective for the current chart.
This button allows you to edit various features of the chart such as the left and bottom
axis , the chart and axis titles, the location of the legend, etc.
This button is used to create a copy of the chart to the clipboard. When this button is
clicked, a pop-up menu appears allowing you to select whether the chart should be
copied as a bitmap or as a metafile.
Pressing this button closes the chart dialog and returns to WordStat's main screen.
Customing barcharts and line charts
Clicking on the
button on the chart dialog gives access to a dialog to customize the appearance of
barcharts and line charts. The options available in this dialog represent only a small portion of all settings
available.
To further customize the chart, modify data points, value labels, or series order, click on the
located on the right side of the dialog.
button
LEFT AXIS
Minimum / Maximum - WordStat automatically adjusts the vertical axis scale to fit the range of values
plotted against it. To manually set these values, type the desired minimum and maximum.
Increment - Increasing or decreasing this value affects the distance between numbers as well as tick marks.
Horizontal grid lines are also affected by modification of this value.
Horizontal Grid - This option turns horizontal grid lines on and off. Grid lines extend from each tick mark
on an axis to the opposite side of the graph. To increase or decrease the number of grid lines or the
distance between those lines, change the Increment value of the axis. A list box also allows a choice
among five different line styles to draw those grid lines.
LEGEND
Location - This option positions the legend. Legends may be placed at Top, Left, Right and Bottom side
of the chart.
From top - When the legend is displayed on the left or the right side of the chart, this option specifies the legend's
top position in percent of total chart height.
From left - When the legend is displayed on the top or the bottom chart, this option specifies the legend's
top position in percent of total chart width.
40
WordStat User’s Manual
TITLES
Proper titles and axis labels are of utmost importance when describing the information displayed in a chart.
By default, WordStat uses variable names and labels as well as other predefined settings to provide such
descriptions.
The title page allows one to modify the top title, as well as the labels on the left, bottom and right axis. To
edit the title, select the proper radio button. Enter several lines of text for each title by pressing the <Enter>
key at the end of a line before entering the next line.
The Font button on the right side of the edit box allows to change the font size or style of the related title.
3D VIEW
Orthogonal - Turning this option off disables the free elevation and rotation of the 3D chart.
Zoom - This option zooms the whole chart. Expressed as a percentage, increasing the value positively will
bring the chart towards the viewer, increasing the overall chart size as the Zoom value increases.
3D Percent - The 3D Percent property indicates the size ratio between chart dimensions and chart depth
by specifying a percent number from 1 to 100.
Perspective - Use this property with Orthogonal unchecked to modify the 3D perspective of the Chart.
Larger values add more depth perspective.
Bar shadow - Enabling this option dark shades to the sides of 3D bars. Turning it off will color the sides
of the bar the same as the front.
Bar width - This option determines the percent of total bar width used. Setting this value to 100 makes
joined bars.
Bar depth - Use this property to limit the depth that each bar series uses. By default, bars will take up the
part proportional to the number of bar series in the chart so that the back of a bar will join the front of
the bar immediately behind it. To insert a gap between series of bars, decrease this value.
Creating heat maps with clustering of rows and columns
An heatmap plot is a graphic representation of crosstab tables where cell frequencies are represented by
different color brightnesses or tones. When combined with clustering of rows and/or columns, this
exploratory tool allows one to identify functional relationships between specific keywords and subgroups
defined by values of the independent variable. To create a heatmap:
• Set the WITH option to an independent variable.
• Set the TABULATE option to either CASE OCCURRENCE or KEYWORD FREQUENCY.
WordStat User’s Manual
41
• Click on the
button to access the heatmap dialog box.
For more information on heatmaps, see Using Heatmap Plot (page 104).
Performing correspondence analysis
Correspondence analysis is an exploratory technique that provides a graphic overview of relationships in
large crosstabulation tables of frequency. To perform a correspondence analysis:
• Set the WITH option to an independent variable.
• Click on the
button to access the correspondence analysis dialog.
For more information on correspondence analysis, see Performing Correspondence Analysis (page 109).
Automated text classification
The automated text classification module allows one to apply a machine-learning approach to the existing
textual database in order to develop a classification model that can later be used to accurately classify
uncategorized documents into predefined classes. To access this feature:
• Set the WITH option to the desired categorical variable.
• Click on the
button to access the automated text classification dialog box.
For more information on this feature, see Automated Text Classification (page 113).
To export the table to disk:
• Click on the
button. A Save File dialog box will appear.
• In the Save as Type list box, select the file format in which to save the table. The following formats are
supported: ASCII file (*.TXT), Tab delimited file (*.TAB), Comma delimited file (*.CSV), HTML file
(*.HTM;*.HTML), and Excel spreadsheet file (*.XLS).
• Type a valid file name with the proper file extension.
• Click on the Save button.
To copy the entire table to the clipboard:
• Right-click anywhere in the frequency table.
• Select the COPY TO CLIPBOARD | TABLE command from the pop-up menu.
42
WordStat User’s Manual
To copy selected rows to the clipboard:
• Select the rows you would like to copy (multiple but separate rows can be selected by clicking while
holding down the CTRL key).
• Right-click anywhere in the frequency table.
• Select the COPY TO CLIPBOARD | SELECTED ROWS command from the pop-up menu.
To search for a specific item:
• Right-click anywhere in the table.
• Select the FIND command from the pop-up menu. A search dialog box will appear.
• Type the desired search string in the Find What edit box. To restrict the search to items starting with
the search string, enable the Match Beginning of Item option and to restrict it to whole words matching
the search string, enable the Match Whole Word Only option.
• Click on the Find button to search the first item matching the typed string. Clicking on this button again
finds the next occurrence of the search string, starting at the currently selected item.
WordStat User’s Manual
43
Keyword-In-Context Page
The Keyword-In-Context (KWIC) technique allows one to display in a table the occurrences of either a specific
word, or of all words related to a category, with the textual environment in which they occur. The text is aligned
so that all keywords appear aligned in the middle of the table. This technique is useful to assess the consistency
(or lack of consistency) of meanings associated with a word, word pattern or category. In the example below,
we can see that the word pattern KILL*, which may have been assigned to a category like "aggressiveness",
refers to words with different meanings, some of them quite distant from the concept of "aggressiveness":
I have decided to
He said that he would
Too much garlic
The Black Death was a disease that
My shoes are
The French skier Jean Claude
KILL
KILL
KILL
KILLED
KILLING
KILLY
a few hours before...
me if I call the police.
the taste of the meat.
millions.
me
won 3 gold medals.
When displaying rules, only the keywords or key phrases associated with the first item of those rules are
displayed. For example, in a rule like:
#SATISFACTION before #TEACHER and not near #NEGATION
the KWIC list will contain only items in the SATISFACTION category meeting the conditions specified by this
rule.
Once an inconsistency has been detected, it becomes possible to reduce it by making changes to the textual data
or to the dictionaries. For example, the researcher may change all occurrences of the word KILL in the original
text for either KILL1 or KILL2 in order to differentiate the different meanings and then add only one of these
modified words (say KILL1) to the substitution or inclusion dictionary. The word KILLY may also be added
to the dictionary of excluded words. The categorisation of phases may also be used to distinguish various
meanings of a word. For example, the use of KIND to refer to the adjective ("considerate and helpful nature")
may be reliably differentiate from the use of KIND as a noun ("category of things") or as an adverb by
categorizing the phrase "KIND OF" as instances of this word used as a noun or as an adverb and by categorizing
the remaining instances of KIND as the adjective. Disambiguation may also be performed by identifying words
in close proximity that are associated with specific meanings and by creating categorization rules (see Working
with Rules on page 64).
The KWIC technique is also useful to highlight syntactical or semantic differences in word usage between
individuals or subgroup of individuals. For example, candidates from two different political parties may use the
word "rights" in their discourses at the same relative frequency, but we may find that these two groups use this
word with quite different meanings. We may also find that the meaning of a word like "moral" evolves with the
age of a child.
44
WordStat User’s Manual
The Keyword-In-Context page has been designed to facilitate the various tasks involved in content analysis. The
page looks like the dialog on the next page. The upper part of the screen provides a list of all instances of
keywords associated with a dictionary category along with its surrounding text. The lower part of the screen
provide a full text view of the currently selected document in which every instance of the chosen keyword is
highlighted.
LIST - This option allows for specifying whether the words for display in the KWIC table either should
be selected from the list of included words or from the list of all remaining words that have not been
explicitly excluded. The option User Specified allows one to enter a word or word pattern at the keyboard
and search for all instances of this expression.
WORD - This option allows one to choose among all keywords belonging to the list of Included or Leftover
words (see above). When the LIST option is set to User Specified, this option becomes an edit box where
one can type a word or word pattern. (Wildcards such as * and ? are supported).
SORT BY - This option allows for sorting the keyword-in-context table in either ascending order on any
of the following options:
Case number - The KWIC table is sorted in ascending order of case position.
Keyword & Before - The KWIC table is sorted on the keyword as well as the words appearing
immediately before it.
Keyword & After - The KWIC table is sorted on the keyword and the words appearing immediately
after it.
WordStat User’s Manual
45
Keyword & Variable - When several text fields have been selected, the KWIC table includes a
column indicating in which field (or variable) the keyword was found. When this option is selected,
the KWIC table is sorted so that all words associated with a category or matching a word pattern are
displayed in alphabetical order. Lines with identical words are sorted on the field name from which
they come. This display is useful to examine whether specific words are used with the same meaning
in different fields.
Variable & Keyword - When several text fields have been selected, the KWIC table includes a
column indicating in which field (or variable) the keyword was found. This option displays a KWIC
table where all lines are sorted on the field name from which they originate. Lines extracted from
a single field are sorted by keywords. This display is useful to establish whether different fields
contain different information. For a more detailed analysis of difference in usage of specific words,
use the Keyword & Variable sort order.
Keyword & VARNAME - This option displays a KWIC table where lines are sorted by words.
Lines with identical words are sorted on the value of the selected independent variable. This display
is useful to highlight differences between subgroups in the meanings associated with a specific word.
VARNAME & Keyword - This option displays a KWIC table where lines are sorted by the values
of the selected independent variable. Lines with identical values on this variable are sorted by
keywords. This display is useful to establish whether subgroups differ on the use of words associated
with a category. For a more detailed comparison of usage of specific word, use the Keyword &
VARNAME sort order.
CONTEXT DELIMITER - This option allows one to select the amount of context displayed in the KWIC
table as well as in the concordance report. In the KWIC table, context strings, either before or after the
keyword, are limited to 255 characters.
None - This option instructs WordStat to display as much context as possible, up to a limit of 255
characters.
Paragraph - When this option is selected, the program will limit the context displayed to the
paragraph in which a specific keyword appears.
Sentence - When this option is selected, the program will limit the context displayed to the sentence
in which a specific keyword appears. A sentence must end with a period followed by a space or a
hard return, or by an exclamation or a question mark.
User defined - When this option is selected, the program will retrieve text found before and after
the keyword until a slash character is encountered.
Once the settings have been set, click on the
button to start searching all instances of the selected keyword.
Any KWIC table may be saved to disk in Excel, plain ASCII, text delimited, or HTML format by clicking on
the
button. To export the content of the table to a new SimStat/QDA Miner data file, press the Export
button located at the top of the Frequencies page.
46
WordStat User’s Manual
To print the KWIC table, click on the
button.
Clicking on the
button produces a concordance report on the keywords currently displayed in the KWIC
table. The sort order and context delimiter of the current KWIC table are used to determine the display order
and the amount of context displayed in this concordance report. This report is displayed in a text editor dialog
(see below) and may be modified, stored on disk in RTF, HTML or plain text format, printed, or cut and pasted
to another application. Graphics may also be pasted anywhere in this report.licking this button produces a
concordance report on the keywords currently displayed in the KWIC table. The sort order and context delimiter
of the current KWIC table are used to determine the display order and the amount of context displayed in this
concordance report. This report is displayed in a text editor dialog (see below) and may be modified, stored on
disk in RTF, HTML or plain text format, printed, or cut and pasted to another application. Graphics may also
be pasted anywhere in this report.
WordStat User’s Manual
47
Features Extraction Page
The Features Extraction page provides two useful tools to extract relevant information from a text corpus:
• The Phrases Finder will extract the most common idioms, phrases and expressions in the text
corpus.
• The Vocabulary Finder will identify proper nouns, company names and technical terms as well as
common misspellings of words.
PHRASE FINDER PAGE
To accurately represent the meaning of a document, it is sometimes not good enough to rely on words alone
but one should look at idioms and phrases. While obtaining comprehensive list of words is easy, finding
common phrases in a specific text corpus is often much more difficult. The phrase finder feature of
WordStat provides such a tool. It will scan an entire text corpus and identify the most frequent phrases and
idioms and allow one to easily add them to the currently active categorization dictionary. In order to reduce
redundancy in such a table, short phrases that are part of larger ones are automatically removed from the
list, provided that their frequency is lower than or equal to the frequency of a longer version.
48
WordStat User’s Manual
Before scanning for phrases, one has to set various options that will be used to determine the extend of the
scanning process. The first two options that need to be set are the minimum and maximum number of words
a phrase can have (Min words and Max words). These two values determine both the processing time, the
memory requirement as well as the number of resulting phrases. The larger the range between those
minimum and maximum values, the longer it will take to collect all possible sequences of words. The Min.
Frequency or Min. Cases options allow one to eliminate from the list phrases that appear only a few times
by setting a minimum frequency criteria. When set to Min. Frequency, the criteria specifies the minimum
number of times a phrase must appear regardless of whether it comes from a single document or from
multiple documents. Setting it to Min. Cases allows one to require those occurrences to appear in a
minimum specified number of cases.
When these options have been set properly, click on the
button to perform the search.
By default, found phrases are presented in descending order of frequency. The Sort By list box can be used
to reorder the obtained list in descending order of frequency, in alphabetical order or in descending order
of phrase length (number of words in the phrase). One can also sort on any column of the table by clicking
on its header once to sort the rows in ascending order and a second time to sort these rows on the same
column but in descending order.
To add a phrase or idiom to the currently selected categorization dictionary or to the exclusion dictionary,
click on its row, press on the
button, and then select the desired location. For easier assignments of
numerous phrases to different categories, select the Drag-and-drop editor option.
Please note that because of the processing sequence used by WordStat, a phrase added to a categorization
dictionary may still not be recognized if it starts with a word currently in the exclusion list. When WordStat
encounters a word to be excluded, it automatically ignores further processing and moves to the next word.
For this reason, a phrase should never begin with a word in the exclusion list. However, WordStat will
recognize any other phrases containing but not starting with a word in this list.
To prevent the identification of phrases that would be normally ignored by WordStat, the phrase finder
deliberately ignores any phrase that starts with one of the words found in the active exclusion list. To
override this and identify all possible phrases, go back to the Dictionary page and disable temporarily this
exclusion list. If important phrases or idioms are found to start with words in the exclusion list, it may then
be justified to remove those starting words from the exclusion list or simply disable this list when
performing content analysis.
Finding overlaps
While WordStat tries to reduce redundancy in the list of phrases by automatically removing short phrases
that are part a of larger ones, the resulting list may still contain items that are not independent of each other
such as phrases that sometimes overlap. In order to allow users to take into account potential overlaps when
selecting phrases, WordStat provides a display option that allows one to see when a selected phrase
includes a shorter one, is part of a larger one, or sometimes overlaps other phrases.
WordStat User’s Manual
49
To enable the display of information regarding overlaps, simply click on the
button. A window appears
on the right of the table. Selecting a phrase in the table automatically shows all other items that overlap this
selected item. Each phrase is accompanied by a ratio indicating the total number of times this other phrase
occurs and how many times it overlaps with the selected item. For example, if one selects the phrase I'M
LOOKING FOR in the table showing it occurs 26 times in a document collection, one may notice that it
overlaps with another phrase, LOOKING FOR SOMEONE, with a ratio of 11 out of 12. This suggests that
LOOKING FOR SOMEONE occurs 12 times, but on 11 occasions, both phrases overlap (I'M LOOKING
FOR SOMEONE). This ratio also indicates that on one other occasion, this second phrase occurs without
overlapping the first one. It is also useful to compare the total number of overlaps with the total frequency
of the target phrase. In the above example, we can conclude that the phrase I'M LOOKING FOR - occurring
26 times - is followed by SOMEONE on 11 occasions. Thus, on 15 other occasions, it is followed by
something else.
To hide information about overlaps, click on the button again.
Comparing frequencies or case occurrences of phrases
The distribution of a phrase among classes of a categorical variable may be quite useful when choosing
whether or not to include it in a categorization dictionary. For example, one may want to identify phrases
that are typical of some topics in order to better describe them or to differentiate them from other topics.
While the Crosstab page in WordStat is normally used for such a purpose, it can only be used for items
already included in a categorization dictionary or selected by the content analysis process. In other words,
one way to compare the frequency of phrases identified by the phrase finder among classes of a categorical
variable is to move all those phrases to a categorization dictionary, and then use this dictionary to obtain
the cross frequency of those phrases. However, the phrase finder page offers a convenient way to obtain
such information without the need to move those phrases to the categorization dictionary.
To compare frequencies or case occurrences of phrases:
• Once phrases have been extracted, click on the
will appear:
50
WordStat User’s Manual
button. A dialog box similar to the following one
The Compare list box shows all categorical variables that are available for comparison. Select the
variable on which the comparison will be performed.
• Use the Tabulate list box to specify whether the comparison will be based on the frequency or case
occurrence of those phrases and to specify whether data will be presented using absolute or relative
frequencies. Four options are currently available:
FREQUENCY
Total number of times this phrase occurs
CASE OCCURRENCE
Total number of cases in which this phrase occurs
FREQ PER 100 cases
Number of times this phrases occurs per 100 cases
% OF CASES
Percentage of cases in which this phrase occurs
• Choose the Statistic that should be used to assess the relationship between the frequency or case
occurrence of the phrases and classes of the categorical variable. The Chi-square is the overall
chi-square value computed on all classes of the categorical variable, while the Max Chi² option is the
chi-square value computed on the class with the highest case occurrence or frequency against all the
other classes. Select None if you don't want to display any comparison statistic.
• Check the Show highest class option to display a column indicating the label of the class with the
highest relative frequency or case occurrence. In the event that two or more classes obtain the same
high percentage, the cell will list all the labels associated with each of those classes.
• Click on the OK button to perform the computation.
Once the computation is completed, several additional columns are added to the right side of the table.
To sort rows based on values in any of the newly created columns, click on the appropriate column
heading. Clicking several times on the same column heading toggles between ascending and descending
order.
Filtering the table
Extracting phrases from a large collection of documents can result in a very large table containing thousands
of phrases. Clicking on the
button brings a dialogbox offering filtering options that allow one to view only
phrases containing either a key word or phrases that are characteristic of a specific class. Filtering conditions
are specified in a dialog box similar to this one:
WordStat User’s Manual
51
Enabling the Phrase containing option and entering a string in the edit box allows one to display only phrases
containing the specified string. If a comparison has been performed between classes of a categorical variable,
one may also view phrases that are characteristic of a class by enabling the Scoring high for option and
selecting the value associated with this class. In the above example, both filtering options were used, restricting
the phrases displayed in the table to those containing the string HUMOUR and found to be characteristic of the
30-39 age group.
To apply the filtering condition, click on the APPLY button. To remove those filtering conditions and display
all extracted phrases, click on the IGNORE button.
Other table operations
To copy the entire table to the clipboard:
• Right-click anywhere in the frequency table.
• Select the COPY TO CLIPBOARD | TABLE command from the pop-up menu.
To copy selected rows to the clipboard:
• Select the rows you would like to copy (multiple but separate rows can be selected by clicking while
holding down the CTRL key).
• Right-click anywhere in the frequency table.
• Select the COPY TO CLIPBOARD | SELECTED ROWS command from the pop-up menu.
To search for a specific item:
• Right-click anywhere in the table.
• Select the FIND command from the pop-up menu. A search dialog box will appear.
• Type the desired search string in the Find What edit box. To restrict the search to items starting with
the search string, enable the Match Beginning of Item option and to restrict it to whole words
matching the search string, enable the Match Whole Word Only option.
• Click on the Find button to search the first item matching the typed string. Clicking on this button
again finds the next occurrence of the search string, starting at the currently selected item.
52
WordStat User’s Manual
VOCABULARY FINDER PAGE
The Vocabulary Finder feature of WordStat provides a tool to extract single words representing technical
terms, company and product names, as well as abbreviations that are specific to the analyzed collection of
documents. The feature will also identify common misspellings by comparing the list of word forms
encountered in the entire text collection against a list of common words, retrieving words or words with
irregular capitalization that are not found in this list. By default, the extraction is performed in reference
to common English words. For documents written in another language or to exclude technical terms from
a specific domain, set the Active Dictionaries option on the Speller/Thesaurus Option Page to the desired
language.
The Include Irregular Capitalization option instructs the program to retrieve all words with irregular
capitalization, such as proper names of persons, companies or products. The Min Frequency option allows
one to eliminate from the list all words appearing only a few times by setting a minimum frequency
criterion.
Once the above two options have been set, click on the
button to start searching for vocabulary words.
The list of words retrieved are then listed in a frequency table on the left of the screen and presented in
descending order of frequency. To sort this list in alphabetical order, click on the top of the first column.
Three types of operations are allowed on these words: 1) You can replace all instances of a selected word
in the original document by another word or phrase; 2) You can add this word to a custom list of valid
words causing the program to ignore those words the next time there is a search for vocabulary words; or
WordStat User’s Manual
53
3) You can assign the words to an existing content category. You may also obtain a keyword-in-context list
associated with a specific word in order to decide how that word should be treated.
None of the above three operations are performed immediately. Instead they are added to an actions list
allowing you to review, modify or cancel previously defined actions prior to the application of all the
specified changes.
To replace words in the original documents:
• Select the word to be replaced.
• Click on the
button. The following dialog box will appear.
• Type the new replacement word or phrase or choose from the Suggestions list box on the left side
of the dialog box.
• Click on the OK button to confirm this replacement and add this operation to the list of actions to
perform.
To add a word to the custom list of words to ignore:
• Select the word you would like to add to the custom dictionary.
• Click on the
button.
To assign a word to a content category:
• Select the word you would like to replace.
54
WordStat User’s Manual
• Click on the
button. A dialog box showing a tree representation of the dictionary
appears, allowing one to assign the item to a category. Once selected, click OK.
To remove operations previously defined:
• Select the operations that you would like to remove.
• Click on the
button. All words associated with the removed actions are moved
back to the list of unknown words and positioned at the bottom of the list.
To produce a KWIC list for a specific word:
• Select the word for which you would like to display it surrounding context.
• Click on the
to call the KWIC window.
To perform all the defined operations:
• Click on the
button.
WordStat User’s Manual
55
Creating and Maintaining Dictionaries
Please note that in the instructions below the exclusion list and the categorization dictionary are both referred
to as "dictionary".
To open an existing dictionary
• Click on the
button to display a dialog box that will let you browse through folders and select a file
name with the proper extension.
To create a new dictionary
• Click on the
button located on the right of the exclusion list or of the categorization dictionary. A
dialog box enables specifying the name and location of the new dictionary file. If a dictionary file is
already active, it will ask whether existing entries should be copied to the new dictionary file. If you
answer Yes, all entries in the previously opened dictionary will be retrieved and stored in the new one.
Answering No will result in an empty dictionary.
To add new words to an existing dictionary
From the Dictionaries page
• In the Dictionary Viewer group box, select the dictionary to which you would like to add new words.
• Press on the
button and select Word.
From the Frequencies page
• Select the rows containing the words you would like to add.
• Press on the
button or click on the right button of the mouse.
• Select the dictionary to with you would like to add the selected words.
From the Crosstab page
• Select the rows containing the words you would like to add.
• Press on the right button of the mouse to display a pop-up menu.
• Select the dictionary to with you would like to add the selected words.
56
WordStat User’s Manual
From the text editor
• Select the word you would like to add.
• Click on the
button or press on the right button of the mouse to display a pop-up menu.
• Select the dictionary to with you would like to add the selected words.
If you choose to add a word to the exclusion list, the word will automatically be stored in this file without
any dialog box. If the Inclusion dictionary is selected, the program will display a dialog box similar to the
following:
To add new items to an existing category:
• Type de words or phrases you wold like to add in the edit box, one item per line. Spaces are
automatically replaced by an underscore character.
• Select the proper category from the Location box.
• Click on the Add button.
Wildcards such as * and ? are supported.
Weights can also be assigned to specific categorization, so that a specific word, word pattern, or expression
may count for more than one instance of the concept. The default value for this option is 1. To use a lower
or higher value, edit the Weight option either by entering a new numeric value in the edit box or by clicking
WordStat User’s Manual
57
on the spin buttons to increase or decrease this value. Valid weight can be any floating point value higher
than zero.
If you want to add a word to a non existing category, you first need to create such a category (see below)
and then follow the above steps to add the word to this new category.
To add categories to the inclusion dictionary:
From the Dictionaries page
• In the Dictionary Viewer group box, select the Inclusion radio button.
• Press on the
button and select Category. The Add Categories dialog box will appear.
• Select the Main Category or the Sub-Category radio button depending on whether you want this new
category to appear at the main level or whether you want it to be created under an existing category. If
you choose to create a sub-category, you then need to select from the Location outline the category under
which you would like to store it.
• Type the category names you would like to add in the edit box, one item per line, and click on the Add
button.
To remove an entry or a category from a dictionary:
• Select the Dictionaries page by clicking on the first tab at the top of the dialog.
• In the Dictionary Viewer group box, select the dictionary from which you would like to remove words
or categories.
• Select the words or categories you would like to delete and click on the
button. If a
non-empty category is selected, you will be asked to confirm its deletion. If you answer Yes, all words
and subcategories belonging to this category will also be erased.
To edit an entry in a dictionary:
• Select the Dictionaries page by clicking on the first tab at the top of the dialog.
• In the Dictionary Viewer group box, select the dictionary containing the words or categories you would
like to edit.
• Select the item you want to modify and click on the
58
WordStat User’s Manual
button.
To search for an entry in a dictionary:
• Right-click anywhere in the categorization dictionary.
• Select the FIND command from the pop-up menu. A search dialog box will appear.
• Type the desired search string in the Find What edit box. To restrict the search to items starting with the
search string, enable the Match Beginning of Item option and to restrict it to whole words matching the
search string, enable the Match Whole Word Only.
• Click on the Find button to search the first item matching the entry. Clicking on this button again finds
the next occurrence of the search string, starting at the currently selected item.
Moving words or categories using drag and drop
The easiest way to change the structure of an inclusion dictionary is by using drag and drop operations.
Using the mouse, you can move a word to a different category, move an existing category or sub-category
to another location on the main level or under an existing category. To perform such operations, you first
need to enable the drag & drop editing feature:
• Select the Dictionaries page by clicking on the first tab at the top of the dialog.
• In the Dictionary Viewer group box, select the Inclusion dictionary.
• Check the Drag & Drop Editing checkbox.
Once activated, you just have to click on the item you want to move, and hold the mouse button down.
Then, simply drag the item over its new location and release the mouse button. By default, the dragged item
is stored under the category at the cursor position. To move a word or a category to the main level or to the
same level as the category under the cursor, simply hold the ALT key while dropping the dragged item.
Moving a word to a distant category
• Select the item you would like to move.
• Click on the right button of the mouse to display the contextual menu.
• Select the Move To command.
• Choose the category where the selected item should be moved and click OK.
Merging dictionaries
The WordStat Merge feature allows one to append categories and items contained in one categorization
dictionary into another dictionary. To merge dictionaries:
WordStat User’s Manual
59
• From the dictionary page of WordStat, open the dictionary into which you would like to import new
categories.
• Click on the
button. An Open dialog box is displayed.
• Locate the dictionary containing the items that you would like to import and click OK. A dialog box
similar to the one below is displayed:
• Select the categories you would like to import by clicking in the box beside the desired category(ies)
and clicking OK. To select all items, right click anywhere on the list of categories and select Check
All. Choosing Uncheck All removes all check marks previously entered.
If an imported category already exists in the currently active dictionary, WordStat ignores duplicate items
and only imports new items not already found in the original category. New categories are appended to
the existing structure along with all their items.
Printing the dictionary
To create a printed version of the categorization dictionary, go to the Dictionaries page and click on the
button. A print dialog box like the one below will appear, allowing you to set various options of what and
how the dictionary should be printed.
60
WordStat User’s Manual
PRINTER - Select the desired printer. To adjust the printer settings, such as the page size and orientation
or printer resolution, select the PROPERTIES button.
CONTENT - This option allows you to specify what should be printed. Selecting All prints the entire
dictionary along with all its items. Selecting As Shown will print only currently visible items. When the
Select Items option on the dictionaries page is enabled, a third option Selected Items becomes available
allowing one to restrict the printing to previously selected categories and items.
SUPPRESS WEIGHTS - When this option is disabled, weights of each item are printed within parentheses.
Enabling this option prevents those weights from being printed.
TITLE - Use this option to specify a particular line of text that will appear at the top of each page.
FONT SIZE - This option may be used to adjust the font size used to print dictionary items.
NUMBER OF COLUMNS - Dictionaries may be printed with up to seven columns per page, allowing one
to print large dictionaries on fewer pages. Please note that when increasing the number of columns per
page, it may be necessary to decrease the font size to prevent the overlapping of items in adjacent
columns.
START NEW PAGE ON ROOT CATEGORY - Root categories are the dictionary categories still visible
when the dictionary is fully collapsed. Selecting this option instructs the program to start the printing of
all items starting from this root category at the top of a new page.
FOOTER - Enable this option to print a footer at the bottom of each page. A footer can consists of up to
three items: The Filename (printed on the left margin of the footer), the Page Number (located at the
bottom center of the page), and the Date (printed on the right margin of the footer).
WordStat User’s Manual
61
Setting dictionary options
The dictionary options dialog allows one to assign a description to a categorization dictionary and some
options to be set automatically set upon its opening. This dialog may also be used to prevent modification
to the dictionaries or to some analysis options that are needed for the categorization to be performed
accurately.
To access the dictionary options of the currently active dictionary, click on the
on the Dictionary page.
button located
Description page
The first page of this dialog allows one to enter text to describe the dictionary. Use this description to
inform other users about the intended use of a created dictionary, its assumptions, its strengths and
limitations, etc. Such an option may also be used to document for personal use how the dictionary was
created, what remain to be done, etc. A check box located on the upper left corner of this page can be
used to automatically display this description in a dialog box when a user opens it.
Lock Options
Once a categorization dictionary has been developed and validated, one may want to restrict further
changes to the dictionary or prevent other users from setting content analysis options that would be
incompatible with this dictionary. For example, a categorization dictionary may require the presence of
a specific exclusion list to handle exceptions or may assume that the program accepts specific characters
or requires prior lemmatization of the documents. The Lock Options page allows one to restrict
operations and changes in analysis options for the currently active dictionary. However, please note that
those restrictions are neither permanent nor password protected. They may be overridden at any time by
62
WordStat User’s Manual
accessing the Dictionary Options dialog again and by removing any of the restrictions that has been set
previously.
The first set of options (Changes) contains two check boxes that allow one to prevent the addition of new
entries or the deletion and editing of existing ones. When those options are enabled, all buttons or
command on the dictionary page or elsewhere that give access to editing operations are disabled.
To regain access to those editing operations, click on the
corresponds to the dictionary to edit.
button and disable the items that
All the remaining options on this dialog are used to prevent further changes to various options found on
the Dictionary or the Options page. Before locking any item, you have to make sure the corresponding
option is properly set. For example, if the categorization dictionary is not compatible with prior stemming
and requires some special characters to be treated as valid, you first need to disable the Stemming option
on the dictionary page, move to the Options page and enter all those special characters in the Valid
Characters edit box prior to locking those options in the Lock Options page.
Please note that the dictionary description as well as any restriction applied to a dictionary are
automatically saved in a file with the same name as the categorization dictionary file but with a .NFO file
extension. To make sure the description and the various options follow the dictionary, always make sure
to include this .NFO file along with the .CAT categorization dictionary file.
WordStat User’s Manual
63
Working with Rules
The WordStat Rules editor may be used to define complex coding rules allowing one to specify under which
conditions a particular item or category of items should be coded. Such a feature may be useful to differentiate
between numerous meanings of a single word (disambiguation). For example, one may limit the coding of the
word "bank" to situations where the word refers to the financial institution. This can be done by restricting the
coding of "bank" to documents containing vocabulary related to monetary or financial transactions ("cash,"
"money," "mortgage," "investment," etc.) or by excluding alternate meanings such as when "bank" appears in
close proximity to words like "river" or "canoe." Rules may also be used to measure various forms of a phrase.
For example, the idiom "TURN OFF", may be expressed in many different ways ("turn it off," "turned off,"
"turned this off," "turned his radio off"). While figuring out all the possible forms of such an idiom may be very
difficult, if not impossible, a single coding rule to look for the word pattern "TURN*" followed by "OFF" within
the same sentence could very well cover most of those situations. Rules can also take into account the presence
of words that may alter the power of an adjective, such as negations or qualifiers like "rarely," "numerous,"
"few," etc. Rules may even be used to identify sequences of events or complex actions.
In WordStat, a rule can refer to individual words, word patterns, or phrases or it may also refer to several items
belonging to a content category of the current dictionary. A reference to a category is always preceded by the
number or pound ('#') character. For example, in the rule:
SATISFIED NEAR #TEACHER
the first item, SATISFIED, refers to a single word while #TEACHER will match any item found in the
TEACHER content category.
Just like other types of items, rules may be stored anywhere in a categorization dictionary. A rule consists of
a target item and up to two statements, each statement consisting of another item linked to the first item using
a Boolean (AND, OR, NOT) or a proximity operator (NEAR, BEFORE and AFTER, or their negative forms,
NOT NEAR, NOT BEFORE, NOT AFTER). The context in which those rules will be tested also needs to be
specified, allowing one to either consider the content of the entire document or restrict the test to a single
paragraph or a single sentence. When a proximity operation is used, one also has to specify the maximum
distance in number of words that must separate the two items in order for this proximity rule to be tested as true
or false.
64
WordStat User’s Manual
To create a rule, click on the
one below will appear:
button and select the RULES menu item. A dialog box similar to the
The minimum requirements for a rule to be valid are:
• A unique name
• At least one statement consisting of a target item, a Boolean or proximity operation and a second item.
• The conditions under which this rule should be tested
• The weight given to items meeting those conditions
• The content category where the rule will be stored be stored.
The asperand ("@") is used as a prefix to denote the presence of a rule and will be added automatically to the
rule name. In the above dialog box, the rule item @STATISFACTION_TEACHER will be stored under the
content category POSITIVE_FEELING and will be considered as true if the word SATISFIED occurs in the
same sentence as one of the items in the content category #TEACHER and if there is no item in the
#NEGATIONS category in the same sentence and within five words of the target word (i.e. SATISFIED).
To enter a specific word, word pattern or phase, simply type the desired item. Spaces between words are
automatically converted to underscore characters. To enter a content category, type the number or pound ('#')
character immediately followed by the name of the category. An existing category may also be selected from
a drop-down list by clicking on the down arrow located to the right of the edit box and clicking on the
appropriate category name, listed in alphabetical order.
WordStat User’s Manual
65
The following operators may be used in a rule:
RULE CONDITION
IS TRUE IF...
item1 AND item2
...both items occur in the same document, paragraph or sentence.
item1 OR item2
...at least one of the items occur in the document, paragraph or sentence.
item1 NOT item2
...the first item occurs in the document, paragraph or sentence but not the
second one.
item1 NEAR item2
...both items occur in the same document, paragraph or sentence, and are no
more than n words apart.
item1 BEFORE item2
...both items occur in the same document, paragraph or sentence, and the
second item appears after the first one within the next n words.
item1 AFTER item2
...both items occur in the same document, paragraph or sentence and the first
item appears after the second one within the next n words.
item1 NOT NEAR item2
...the first item occurs in a document, paragraph or sentence, and is not
found within n words of the second item.
item1 NOT BEFORE
item2
...the first item occurs in a document, paragraph or sentence, and is not
followed within n words by the second item.
item1 NOT AFTER item2
...the first item occurs in a document, paragraph or sentence, and does not
occur within n words after the second item.
To specify a second rule statement, click on the
button. You can select to join the two statements using
an AND or an OR Boolean operator. Choosing AND will result in a coding if both criterion are true while
selecting OR will result in a coding if either the first or the second statement is true.
To limit the rule definition to a single statement, click on the
button.
Once the rule has been properly defined, click on the
button located in the lower right corner of
the dialog box to append the rule definition to the selected content category and to clear the form. Once you
have finished entering rules, click on the close button to quit this dialog box and return to the WordStat main
screen.
Please note that, in order to prevent any recursive or cross-reference problems in rules, content categories can
only refer to words, word patterns or phrases stored in categories and will thus ignore the presence of other
rules. For example, if a category named #SATISFACTION contains 10 word patterns and three rules, any
reference to this category in a rule will take into account those 10 words and will ignore instances where any
one of the three rules have been found to be true.
66
WordStat User’s Manual
Using the Drag & Drop Dictionary Editor
The drag-and-drop editor provides an easy way to assign words, phrases or entries from another dictionary file
to categories of the current categorization dictionary.
To access this dialog, click on the
Drag & Drop Editor.
button located on the Frequencies or the Phrase Finder pages and select
This dialog consists of two panels and a tool bar. The panel to the left lists the various categories of the current
dictionary to which you can assign words or phrases. The top item of this list represents the exclusion list, while
the second item (i.e. "<ROOT>") is used to add entries directly to the dictionary main level.
The right panel is a grid containing every word or phrase that may be assigned to the exclusion list or to the
categorization dictionary. The leftmost column of this panel contains the item that will be added, while the
remaining columns contain various information that may be used in the decision to assign specific words or
phrases to categories (frequency, case occurrence, etc.). Rows may be reordered based on values found in any
column by clicking on this column header. For example, in the table below, to sort the words in ascending order
of frequency, one only has to click on the FREQUENCY header once, and a second time to sort those same
words in descending order. To display the words alphabetically, click on the top of the first column.
WordStat User’s Manual
67
The drop down list box located on the toolbar allows one to specify what should be displayed in the right panel.
When set to Leftover words, all words that has not been explicitly excluded and were not included in the result
of a content analysis will be showed. Setting this option to Included words will display any word that is not
part of the current categorization dictionary but that has been included in the content analysis for some other
reasons (e.g. they meet a minimum frequency criterion). To display items from both sources, set this option to
All words. To retrieve phrases that has been identified by the Phrase Finder features of WordStat, set this option
to Phrase List.
The drag-and-drop editor may also be used to merge two categorization dictionaries. When one set the list box
to Dictionary file, the program displays a dialog that allows one to select a second dictionary file. If a valid
categorization dictionary is chosen, all entries of this dictionary will be listed on the right panel along with the
category name to which they belong.
To move items to a category:
• Click on the word or phrase to assign to a category. To select a group of adjacent entries, move the
mouse cursor over the first item in the list, press and hold the mouse button, drag the mouse to the last
entry to highlight the block of rows you want to assign, and then release the mouse button. To select
disjunct items, hold down the CTRL key while clicking on items.
• Once the words or phrases has been highlighted, select the category on the left panel to which you want
to assign those items.
• Click on the
button to perform the assignment.
For even quicker assignments, drag any items or block of items and drop them in the category of your
choice.
To undo any assignment you made since the moment of entry to this dialog, click on the
button. Note: If
you leave the mouse cursor over this button a small hint window will appear showing you which assignment will
be canceled by clicking this button.
To add a new category to the categorization dictionary:
• Click on the
button to display the Add Word/Category dialog.
• Click on the OK button to confirm the changes made. To cancel all assignments made after entering this
drag-and-drop dialog, click on CANCEL.
68
WordStat User’s Manual
Using Lexical Tools for Dictionary-Building
Creating a comprehensive categorization dictionary is quite often a difficult, time-consuming and subjective
task. WordStat can assist you in finding words that may be related to existing words in your categories by
the use of three lexical tools:
• A spelling dictionary is used to propose inflected forms of existing words already in your dictionary.
Several dictionaries are currently available for different human languages such as English, French,
Italian, Dutch, etc.
• An English thesaurus is also used to propose synonyms of words already in your dictionary. The
thesaurus data file contains over 8,700 context topics (indexed words) and offers a database of over
75,000 synonyms.
• A WordNet based lexical database is used to find synonyms, antonyms as well as hypernyms,
hyponyms, coordinate terms, holonyms, meronyms, etc. This database contains over 120,000 root
words (including many proper nouns) and offers over 100,000 synonym sets. The availability of word
sense definitions allows for manual as well as automatic filtering of proper word senses.
These three tools are available through two different dictionary-building commands.
• The Basic command uses the selected spelling dictionaries and the basic English thesaurus to identify
related synonyms and inflected forms.
• The Advanced command gives you access to a more powerful dictionary-building tool that uses a
WordNet based lexical database to find related words and the selected spell-checking dictionaries to
find inflected forms of those words.
You will find below a description of these two dictionary-building tools:
Basic Dictionary-building Tools
To access the basic dictionary-building tool:
• Select the Dictionaries page by clicking on the first tab at the top of the main WordStat screen.
• Press on the
button.
• Select the Basic command.
WordStat will immediately start looking for synonyms and inflected forms of all words in your inclusion
dictionary and will report them in a dialog like this one:
WordStat User’s Manual
69
This dialog displays on the first page a list of synonyms that were found to be related to existing words in
the various categories. Synonyms for a specific category are sorted so that those that were related to several
existing words in this category are located at the top of the list while synonyms related to only a single word
are located at the bottom. The numeric value in parenthesis indicates the number of existing words to which
it was related.
The second page lists all words whose spelling begins with the same letters as existing words and that were
not already included in the actual dictionary. For example, if the word "understanding" is found in the
dictionary, the program will suggest words like "understandings", "understandingly", "understands",
"understanded", "understandable", and "understandably".
To add suggested words to the dictionary, place a check mark beside the words you would like to add and
click on the Add button.
Click on the
button to return to WordStat.
Advanced Dictionary-Building Tools
The advanced dictionary-building tool can be accessed either as a stand-alone application of from within
WordStat. To run the stand-alone version:
Point to the Programs folder in the Windows' Start menu, then select Provalis Research and then click on
Dictionary Builder.
70
WordStat User’s Manual
To access the advanced dictionary-building tool from within WordStat:
• Select the Dictionaries page by clicking on the first tab at the top of the main WordStat screen.
• Press on the
button.
• Select the Advanced command.
A dialog like this one will appear:
The first page is used to set various dictionary and search options. The second and third pages are used
to find words and idioms semantically related to existing entries in the dictionary, while the last page is
used to find derived form of those entries.
DICTIONARY PAGE
The first page of the dictionary builder program allows you to select or change the WordStat dictionary,
specify the words and categories you want to work with, along with the type of relationship to look for. It
also allows you to specify how the program will search for inflected forms of existing words in your
dictionary.
To select a dictionary
• Click on the
button. A standard Open dialog will appear.
• Select the WordStat dictionary file you want to work with.
WordStat User’s Manual
71
Selecting words and/or categories
By default, the dictionary-building program will search for related words and idioms for all existing
words and categories in your WordStat dictionary. To restrict the search to specific categories or words
within a category, simply deselect the words and categories you want to exclude by removing the check
marks beside them. Clicking on a category check box to change its state also changes the check box state
of all words and subcategories within this category.
Specifying the type of relationship to look for
The Search for group box allows you to specify what type of relationship the program will look for. For
example, you may choose to search only for synonyms and similar terms or decide to also search for
hypernyms, hyponyms, coordinate terms, etc.
Setting how Inflected forms will be retrieved
The Match Partial Word option affects how inflected forms are found. When this option is deactivated,
the program only retrieves words that start with the whole word. For example, if the dictionary includes
the word INTELLIGENT, the program will suggest words like INTELLIGENTLY and
INTELLIGENTSIA. If the Match Partial Word option is activated, the program will also suggest words
like INTELLIGENCE, INTELLIGENCES, INTELLIGIBLE, and INTELLIGIBLY.
DEFINITIONS PAGE
Using a comprehensive lexical database such as WordNet to find related words and phrases has one major
drawback. Searching for numerous types of relationship for even small WordStat dictionaries can yield a
huge number of suggested words. For example, when searching for suggested words for a dictionary
containing 129 words grouped under 13 categories, more than 12,000 new words and phrases were
obtained, many of them unrelated to the existing categories. Browsing through such a huge number of
suggestions to find the most relevant ones can be an overwhelming task. The Definitions page was created
to somewhat reduce this burden by providing an intermediary step where the user can select, for each of
the words, the word senses that are the most relevant to the containing category. The program offers both
manual and automatic selections of word senses and also allows one to combine both methods.
Automatic selection of word senses
WordStat dictionary builder uses a basic disambiguation algorithm to try to identify, among all word
senses, those that are the most likely to be related to the containing category. This algorithm involves the
computation for each word sense of a relevance score. The higher is this score, the more likely the word
sense will be related to the category, while a score equal to zero suggests that this word sense is unrelated
to the category. Once those relevance scores have been computed, the program can use one of three
different rules to select proper word senses.
72
WordStat User’s Manual
• Best - This rule instructs the program to select for each word, the sense that has obtained the highest
relevance score. When selecting the highest score, a 20% tolerance is used so that, on some
occasions, more than one word sense will be selected. This selection rule is the most conservative
one and insures that relevant word senses are the most likely to be selected. However, we have also
found that this selection method may lack some sensitivity and may fail to select other relevant word
senses (false negatives).
• Relevance > 0 - This rule instructs the program to select all word senses that have been found to be
related, even slightly, to the category. This selection rule is very liberal in that it is the most likely
to select most relevant word senses at the cost of a lack of specificity (too much false positives).
• Relevance > 0.1 - This rule is slightly more conservative that the previous one, in that it also rejects
all word senses that have obtained a score of 0.1. Beside a score of zero, 0.1 is the lowest score that
may be obtained. Experiences have shown that, very often, word senses with such a low score are
unrelated to the category. Removing those word senses thus results in an increase in specificity along
with only a marginal decrease in sensitivity.
The application of any of these three rules is performed by selecting the proper rule from the Select drop
down list. This list box may also be used to select or unselect all definitions.
Manual selection of word senses
Manual selection of word senses can be carried out either alone or after an automatic selection has been
made by the program. Manual selection is performed simply by browsing through the list of all
definitions and selecting those that are related to the current category while making sure unrelated
definitions are unselected. The decision to include or exclude a specific word sense may rely on the
displayed definition, on the relevance score, and also on the examination of all words that have been
WordStat User’s Manual
73
found to be related to this specific word sense. Those suggested words are automatically displayed in the
right panel of the Definition page when the word definition is highlighted.
Selected word senses may be saved on disk by clicking on the
on the
button, and later retrieve by clicking
button.
Once the word senses have been chosen, activating the Words page will start the search, extract all words
and phrases related to the selected word senses, and will display them by categories and by the type of
relationship (synonyms, antonyms, etc.)
WORDS PAGE
The Words page displays a list of suggested words and idioms that were found to be related to existing
words in the various categories and allows you to select suggestions and add them to the existing dictionary.
The "All words" page includes a list of all words and idioms that were suggested, irrespective of their
relationship with the existing entries. The remaining pages allow one to examine those same words by the
nature of their relationship with existing entries.
Relevance ranking and sorting
For each suggestion, a Word relevance score is computed that takes into account the number of times an
item has been suggested as well as the relevance score obtained by the word senses from which it was
derived. Those suggestions are presented in descending order of relevance so that the suggestions that
are the most likely related to the containing category are located at the top of the list while suggestions
that are less likely to be relevant are found at the bottom of this list.
74
WordStat User’s Manual
Specificity index
Very often, a word is suggested in more than one category. This is especially true when the dictionary
includes categories that are semantically close each other. One good example of such a categorization
system is the Lasswell dictionary that tries to differentiate ten different forms of power relations (power
gain, power loss, cooperation, authoritative, conflict, doctrine, etc.). When making a decision on whether
a word should be added to a given category, it is important to consider whether this word is specific to
this category or whether it has also been suggested in other categories. The Compute Specificity button
allows one to obtain a specificity index as well as a list of all the other categories in which this item also
appears. This specificity index is computed by making the sum of all relevance scores obtained by this
word in the various categories and computing the proportion of this total score that is related to the
current category. A specificity of 1.0 indicates that this item has only been suggested for this category.
When the item has been found to be related to more than one category, a list of all other categories in
which it also appears is displayed in the Other Categories column along with the relevance score obtained
in each of those categories. You can use this information to decide to which category this word should
be added.
To add words or idioms to categories
• Place check marks beside the item you would like to add.
• Click on the Add button.
INFLECTED FORMS PAGE
The Inflected Form page lists all words whose spelling begins with the same letters as existing words and
that were not already included in the actual dictionary. For example, if the word "understanding" is found
in the dictionary, the program will suggest words like "understandings", "understandingly". If the Match
Partial Word option is enabled (see Dictionary page), this same word will also yield words like
"understands", "understandable", and "understandably". The From column displays the original word from
which the inflected form has been derived.
WordStat User’s Manual
75
To add suggested words to the dictionary, place a check mark beside the words you would like to add and
click on the Add button.
The Auto Select button allows one to automatically select from all the suggested forms those with specific
suffixes such as all suggested forms ending with 's' or 'ed'. When searching inflected forms of English
words, it is also possible to use WordNet to automatically select words that share the same meaning as the
original word from which it was derived. As an example, the program will automatically select words like
BEHAVIORS and BEHAVIOURS as valid forms derived from BEHAVIOR since all three forms will yield
the same WordNet definitions. One can also set this feature to accept any new word form for which there
is at least one WordNet definition containing the original word. For example, when enabling this option
the word COMPETING would be automatically selected as a valid inflected or derived form of
COMPETITION since one of WordNet definitions associated with COMPETING (i.e. "Being in
competition") contains the original word from which it was derived.
Click on the
76
button to return to quit the dictionary builder program and return to WordStat.
WordStat User’s Manual
Monitoring and Customizing Lemmatization
Since WordStat does not rely on a prior part-of-speech tagging of words to perform lemmatization, but rather
on some suffix substitution rules and lists, some improper word substitutions may occur. In specific situations,
substitution may be linguistically conceivable yet semantically invalid. For example, the noun "ground,"
referring to the solid part of the earth's surface, may be erroneously taken as the passive form of the verb "grind"
and be replaced with this infinitive form. WordStat offers a way to monitor all substitutions performed by this
lemmatization routine and to override those deemed necessary by creating a list of custom substitutions or
exceptions.
To monitor all substitutions performed:
• Put a check mark in the Monitor Substitutions option on the Dictionary page. A new Review button
will appear on the right of this option. This button is initially disabled. Any further text analysis
performed with the lemmatization option active will cause the program to collect information about all
substitutions made by the lemmatization process. As soon as such information becomes available, the
Review button is enabled.
• Click on the Review button to review all lemmatization performed. A dialog box similar to this one will
appear:
The table presents all substitutions in alphabetical order along with various information about each item such
as the substituted word, how frequent those substitutions have been made, the length of the original word as well
as the inverted version of the original word. Clicking on any column header sorts the table in ascending order
WordStat User’s Manual
77
of the data in the column. Clicking on the same column header a second time will sort its content in descending
order.
Because of the algorithm used, lemmatization errors are more likely to occur on shorter words. Sorting on the
Length column allows one to focus more specifically on those short words. Also, suffix substitution may be
more problematic for some suffixes. For example, lemmatizing words ending with ING may introduce confusion
between noun, adjective and verb forms. Sorting on the Inverted column allows one to quickly review all
substitutions made to words sharing the same ending.
To correct an invalid substitution:
• Select the row with the substitution you would like to override.
• Press on the right button of the mouse and select either Keep Invariant to instruct WordStat to keep the
word in its original form or Substitute With to specify what word will be substituted with the selected
word. When this last option is selected, the following dialog box appears:
• The initial word is automatically entered in the Original edit box. Then type the replacement word and
click OK to create the rule. This new substitution rule is automatically added to a list of exceptions and
will automatically be accessed when using the currently selected lemmatization routine.
To modify previously defined exceptions:
The Exception List page of this dialog box allows a review of the list of all exceptions previously defined
and associated with the current lemmatization routine.
78
WordStat User’s Manual
• To remove an exception rule, select this rule and click on the
• To add a new rule to the list, click on the
button.
button, enter the substitution rule and click OK.
• To save modifications made to this list, click on the
button.
• To leave this dialog box, click on the
button. modifications have been made to the list but have
not been saved, you will be prompted whether those modifications need to be saved. Choosing NO will
result in the loss of all changes made to the list since you entered this dialog box or since the last time
those modifications had been saved.
WordStat User’s Manual
79
Configuring External Preprocessing Routines
The preprocessing option allows users to access external text preprocessing routines that are not part of the
WordStat program. This option is useful to perform custom transformations on the text to be analyzed. For
example, a routine may be created to remove all foreign accents, to segment a document in a particular way, to
perform part-of-speech tagging, word disambiguation, stemming or transforming words into n-grams (sequences
of letters). Those transformations are not applied to the original documents stored in the database but are instead
performed live immediately after the textual information has been read into memory and prior to any text
processing available in WordStat (lemmatization, exclusion of words, categorization, etc.).
Such external routines may be written in any programming language that can create or be called from a
stand-alone EXE file or a DLL. The programmer is responsible for matching the formal parameters and result
type of the conventions used by WordStat for data interchanges. Technical information on those programming
conventions is available on request from Provalis Research. The following section describes how to configure
WordStat to call an already existing text a preprocessing routine.
Calling an Executable program
The first method by which an external routine may be integrated within WordStat is through the calling of an
executable program (typically a console application with an EXE file extension). With such a method,
information is transferred between the two programs by way of temporary files generated on the fly and stored
in a default temporary folder. WordStat first creates a text file (WORDSTAT.IN) in the temporary folder
containing the text to be processed. It then calls the external routine, with optional parameters (which may or
may not include the input and output file name and their locations). Once the external program ends, WordStat
retrieves another text file (WORDSTAT.OUT) created by the external program and containing the text to be
processed in place of the original one. The two temporary files are then deleted.
To configure WordStat to call an EXE file:
• Click on the
button located on the right of the Preprocessing list box.
• Type the name you would like to give to this preprocessing routine and click OK. This name will be
added to the list box of available routines.
• Enter the name of the program file including the full path or click on the
button to display a dialog
box that will allows browsing through folders and then select the appropriate program file.
• In the Working Dir edit box, specify the working directory for the program if necessary. Specifying
$TEMP as the working directory instructs the program to set the working directory to the temporary
folder.
80
WordStat User’s Manual
• Enter the parameters to transfer to the program at start-up. Typically, you will transfer the input and
output file names, as well as any command line options needed for the external routine, to perform the
required transformation. You can specify multiple parameters and can use any one of these three string
constants:
CONSTANT
$TEMP
STANDS FOR
The system temporary folder.
$IN
The temporary text file created by WordStat and to be processed by the
external routine (the actual file name used is WORDSTAT.IN)
$OUT
The name of the text file created by the external routine and retrieved by
WordStat. (the actual file name used is WORDSTAT.OUT).
Calling a function in a DLL
The second method used to call a preprocessing routine is to execute an external function stored in a dynamic
library (DLL). This will manipulate the text stored in the computer memory at a specific memory address. Since
no file input and output operations are necessary to transfer information, this method is often much faster than
running an EXE file. However, because this external routine has access to the same memory space as WordStat,
great care should be taken when running or creating such a routine. To minimize the risks involved in calling
external functions, a programming convention has been imposed where the name of the function to be called
must begin with the two uppercase letters 'WS', thus reducing the risk of calling a function that has not been
written specifically for WordStat.
To configure WordStat to call a DLL function:
• Click on the button located on the right of the Preprocessing list box.
• Type the desired name for this preprocessing routine and click OK. This name will be added to the list
box of available routines.
• Enter the name of the DLL file including the full path or click on the button to display a dialog box that
allows browsing through folders and then select a DLL.
• Once a DLL file has been entered, the dialog box will provide a list of functions that are likely to be
compatible with WordStat (with names starting with "WS"). Select the function containing the
transformation routine needed.
• WordStat must set apart in advance a "buffer size" that will contain the transformed text. By default, the
memory space is equal to the length of the original document. For many text transformation routines,
such as stemming or lemmatization, which often result in shorter text, this space should be large enough.
However, for other types of text preprocessing (eg., part-of-speech tagging or transformation of words
into n-grams), the size of the transformed text may be twice or three times larger than the original. The
Buffer Size option allows you to specify how much larger the memory space should be in order to hold
WordStat User’s Manual
81
the transformed text. A numerical value between 1 and 10 can be used to represent the value by which
the original text should be multiplied. For example, if this option is set to 3 and the size of the original
text into memory is 10 kilobytes, then 30 kilobytes of memory will be reserved for holding the
transformed text. The calling routine should run a test to see whether the reserved space is sufficient and
should return an error message if not, allowing WordStat to respond with an error message to the user.
• Once all the options has been set, click on the OK button.
Other tasks
To edit the settings of an external routine:
• Select the preprocessing routine you would like to edit from the dropdown list.
• Click on the
icon to edit the external routine settings.
To remove an external routine:
• Select the preprocessing routine you would like to remove from the dropdown list.
• Click on the
82
WordStat User’s Manual
button.
Viewing and Editing Text
WordStat's integrated text editor allows browsing and editing alphanumeric variables and documents submitted
to content analysis, as well as spell checking of text found in a specific case or in the entire data file. When
viewing plain text documents, the editing window consists of a single editing view where text can be edited and
keywords are highlighted. When viewing rich text documents, the editing and keyword highlighting features are
accessed through two separate views. The keyword highlighting feature allows one to identify all words or
phrases that have been coded as well as those belonging to specific coding categories. The text editor can also
be used for dictionary maintenance tasks by allowing the addition of words or expressions to active dictionaries.
One can also jump directly from a selected word to a keyword-in-context table of all instances of this word.
It is also possible from this dialog to examine and edit all numeric and alpha numeric values stored in other
variables of the data file. To view and edit those values for the current case, the Show all variables check box
should be selected. When enabled, the screen will split vertically. On the left side, a panel with a list of all
variables with their values for this case will be shown. To edit any of those values, press the F2 key or
double-click on the value to edit.
The following table provides a short description of available buttons and controls:
CONTROL
DESCRIPTION
This button allows the importation of text from various file formats including plain
text file, RTF, MS Word, WordPerfect, MS Write or HTML. If the variable
containing the document supports only plain text documents then all formatting
options and unsupported features, such as bullets, graphics or headers are removed.
Export the current document to disk. Plain text document may only be saved as
plain ANSI document while RTF documents may be saved in plain text or RTF
format.
Print the current document.
WordStat User’s Manual
83
Cut the selected text to the clipboard.
Copy the selected text to the clipboard.
Paste text from the clipboard at the current cursor position.
Reverse the last action made to the text.
Search for a specified word or phrase.
Search for and replace a specified word or phrase.
Spell-check all cases.
Spell check only the current text.
Pressing this button allows you to add the selected word to an active dictionary. It
may also be used to produce a KWIC table of the currently selected word or
expression.
Variable:
When more than one text variable is analyzed, this drop-down list box allows to
select the variable to display in the edit box.
Highlight:
WordStat’s text editor displays all words that have been coded using bold characters
while words belonging to the active category are showed in blue. To change the
active category and highlight all words that belong to a selected category, simply
choose the proper category from this list box. To highlight all categories using
different colors, set this option to <all categories>.
This button allows you to access the color coding dialog that lets you to assign to
each specific category in the dictionary specific font and background colors (see
below).
Move to the first case of the data file.
Move to the last case of the data file.
Move to the previous case.
Move to the next case.
84
WordStat User’s Manual
Assigning color codes to categories
The color code dialog allows you to assign specific font and background colors to each category of the
current inclusion dictionary.
To access the color code dialog
• Set the Highlight drop down list to <all categories>.
• Click on the
button.
To change the colors of a category
• Select the category in the categories list box
• Use the Font and Background color selectors to choose from a list of predefined colors or click on the
Other button to define a custom color.
Information on color codes are automatically saved with the project options
WordStat User’s Manual
85
Displaying distribution using Barcharts or Pie Charts
WordStat allows one to produce barcharts or pie charts to visually display the distribution of specific
keywords or categories. To produce such charts:
• Move to the Frequencies page.
• Set the Sort By option to the desired graphic order of the values.
• Select the rows you would like to plot (multiple but separate rows can be selected by clicking while
holding down the CTRL key)
• Click on the
button.
Three types of charts may be used to depict the distribution of keywords or content categories:
The vertical bar chart is the default chart used to display absolute or relative frequencies of
keywords or content categories.
The horizontal bar chart displays the same information as the vertical one but is especially
useful when the number of keywords is high and their labels cannot be displayed entirely
on the bottom axis.
The pie chart is useful to display the relative frequency of each keyword and compare
individual values to other values and to the whole. Numerical values displayed in pie
charts are always expressed in percentages of either the total frequency or case
occurrences.
The Plot option allows one to select the values that will be used as the scale for the length of bars in
barcharts or as the percentage base for pie charts. For barcharts the options are:
FREQUENCY
Number of occurrences of the keyword
% SHOWN
Percentage based on the total number of keywords displayed in the table
% PROCESSED Percentage based on the total number of words encountered during the analysis
% TOTAL
Percentage based on the total number of words that have not been excluded
NB OF CASES Number of cases where this keyword appears
% CASES
Percentage of cases where this keyword appears
For pie charts, two options are available to specify how percentages will be computed:
FREQUENCY
Percentage based on the total frequency of keywords
NB OF CASES Percentage based on the total number of case occurrences
The View Others option displays an additional bar or slice representing all items in the frequency table that
have not been selected.
The following table provides a short description of available buttons and controls:
86
WordStat User’s Manual
Controls
Description
Press this button to retrieve a chart previously saved on disk.
Press this button to save a chart on disk. Charts are saved in a proprietary format and
may be edited and customized using the Chart Editor.
Pressing this button allows you to print a copy of the displayed chart.
Click on this button to turn on/off the 3D perspective for the current chart.
This button allows you to edit various features of the chart such as the left and bottom
axis , the chart and axis titles, the location of the legend, etc.
This button is used to create a copy of the chart to the clipboard. When this button is
clicked, a pop-up menu appears allowing you to select whether the chart should be
copied as a bitmap or as a metafile.
Pressing this button closes the chart dialog and returns to WordStat's main screen.
Customing barcharts and pie charts
Clicking on the
button on the chart dialog gives access to a dialog to customize the appearance
of barcharts and line charts. The options available in this dialog represent only a small portion of all
settings available.
To further customize the chart, modify data points, value labels, or series order, click on the
button located on the right side of the dialog.
LEFT OR BOTTOM AXIS
Minimum / Maximum - WordStat automatically adjusts the vertical axis scale to fit the range of values
plotted against it. To manually set these values, type the desired minimum and maximum.
Increment - Increasing or decreasing this value affects the distance between numbers as well as tick
marks. Horizontal grid lines are also affected by modification of this value.
Horizontal Grid - This option turns horizontal grid lines on and off. Grid lines extend from each tick
mark on an axis to the opposite side of the graph. To increase or decrease the number of grid lines
or the distance between those lines, change the Increment value of the axis. A list box also allows
a choice among five different line styles to draw those grid lines.
LEGEND
Location - This option positions the legend. Legends may be placed at Top, Left, Right and Bottom side
of the chart.
WordStat User’s Manual
87
From top - When the legend is displayed on the left or the right side of the chart, this option specifies the legend's
top position in percent of total chart height.
From left - When the legend is displayed on the top or the bottom chart, this option specifies the legend's
top position in percent of total chart width.
TITLES
Proper titles and axis labels are of utmost importance when describing the information displayed in a
chart. By default, WordStat uses variable names and labels as well as other predefined settings to
provide such descriptions.
The title page allows one to modify the top title, as well as the labels on the left, bottom and right axis.
To edit the title, select the proper radio button. Enter several lines of text for each title by pressing the
<Enter> key at the end of a line before entering the next line.
The Font button on the right side of the edit box allows to change the font size or style of the related
title.
3D VIEW
Orthogonal - Turning this option off disables the free elevation and rotation of the 3D chart.
Zoom - This option zooms the whole chart. Expressed as a percentage, increasing the value positively
will bring the chart towards the viewer, increasing the overall chart size as the Zoom value increases.
3D Percent - The 3D Percent property indicates the size ratio between chart dimensions and chart depth
by specifying a percent number from 1 to 100.
Perspective - Use this property with Orthogonal unchecked to modify the 3D perspective of the Chart.
Larger values add more depth perspective.
Bar shadow - Enabling this option dark shades to the sides of 3D bars. Turning it off will color the
sides of the bar the same as the front.
Bar width - This option determines the percent of total bar width used. Setting this value to 100 makes
joined bars.
Bar depth - Use this property to limit the depth that each bar series uses. By default, bars will take up
the part proportional to the number of bar series in the chart so that the back of a bar will join the
front of the bar immediately behind it. To insert a gap between series of bars, decrease this value.
Pie depth - Use this property to change the thickness of the pie chart.
88
WordStat User’s Manual
Creating and Using Norm Files
A useful element in interpreting the results of a content analysis is the possibility of comparing the obtained
results to some normative data and identifying how similar or dissimilar the observed frequencies are compared
to those norms. For example, one may wish to compare the vocabulary of an adult victim of a brain injury to
vocabularies of normal adults or the mission statement of a business to a collection of mission statements of
Fortune 500 companies. One may also establish the reading level of a school manual by comparing its
vocabulary to collections of books read by children of various ages. Normative data are typically computed on
a large sample of documents and represent either general norms with data from a wide variety of sources or are
computed on a more specific text corpus related to the channel, the domain area or the specific situation being
studied. For example, one could compare the speeches of candidates of a presidential election to a large
collection of English text from different sources (newspapers, novels, technical documents, etc.) or to a more
specific corpus of spoken English or to a collection of political speeches. Comparison of word frequencies to
norms established on a general corpus may be especially useful to identify the specific terminology of a set of
documents. On the other hand, using a more specific collection may allow one to identify subtler differences
or nuances.
WordStat allows one to create normative data on a collection of documents based on either the content of a
categorization dictionary or on the frequency of individual words. Those norms may be stored on disk and later
be compared to the results of a content analysis performed on other documents. When comparing results to
norms established using a categorization dictionary, it is highly recommended to use the same dictionaries and
the same analysis options as the ones used to create those norms. Using different settings may result in invalid
comparisons. To prevent such a situation, WordStat will detect any difference in settings and issue a warning
message, pinpointing all differences in those settings. On the other hand, comparing the results to a norm file
based on a comprehensive list of word frequencies may provide a more flexible solution than using a norm
established using a categorization dictionary since a single word frequency norm file may be used to compare
results obtained using various categorization systems. In such a situation, WordStat automatically computes
from the words in the norm file the expected frequencies for each content category. However, it is important
to remember that if the categorization dictionary contains phrases or rules, the expected frequency will likely
be underestimated and may thus be invalid.
When a comparison to a norm file is performed, WordStat appends four columns to the right of the frequency
table and computes each item's expected frequency, the deviation from the observed frequency, the Z value
(standardized deviation) and its two-tailed probability.
To create a norm file based on content categories:
• From Simstat or QDA Miner, open the corpus on which the norms will be established.
• Call WordStat.
• Select the categorization dictionary on which the norms should be computed and set the various analysis
options (exclusion list, lemmatization, etc.).
• Move to the FREQUENCIES page to force the computation of frequencies on the content categories.
• Click on the
button and select the SAVE AS A NORM FILE command. A file-saving dialog box
will be displayed.
WordStat User’s Manual
89
• Enter the name of the file under which you would like to store the norms (by default, the .wnorm file
extension is added to the file name), then click on SAVE to create the file.
To create a norm file based on word frequencies:
• From Simstat or QDA Miner, open the text collection on which the norms will be established.
• Call WordStat.
• If a categorization dictionary is active, disable it and set the various analysis options (exclusion list,
lemmatization, etc.). It is recommended to set the minimum frequency or record occurrence to "1" and
to disable the option to remove words under a specific frequency or occurrence in order to obtain a
detailed frequency list of all words in the normative sample.
• Move to the FREQUENCIES page to force the computation of word frequencies.
• Click on the
button and select the SAVE AS A WORD FREQUENCIES command. A file-saving
dialog box will be displayed.
• Enter the name of the file under which you would like to store the norms (by default, the .wfreq file
extension is added to the file name), then click on SAVE to create the file.
To compare the obtained frequencies with existing norms:
• Set the required dictionary and options and move to the FREQUENCIES page to instruct WordStat to
compute the frequencies of words or of content categories.
• Click on the
button and select COMPARE TO NORM FILE or COMPARE TO WORD
FREQUENCIES, depending on whether you would like to compare the obtained frequencies to norms
established on content categories or on words.
• Select the norm file to which you would like the comparison to be made and click OK.
To Remove comparison statistics:
• Click on the
90
button and select the REMOVE NORM STATISTICS command.
WordStat User’s Manual
Performing Text Retrieval using Keywords
The KEYWORD RETRIEVAL feature can retrieve any document, paragraph or sentence containing a specific
keyword, a combination of keywords or no keyword at all. Text units corresponding to the search criteria are
returned in a table on the Results page. This table may then be printed or saved to disk. It may also be used to
create tabular or text reports as well as to attach QDA Miner codes to the retrieved text segments.
To start the Keyword Retrieval feature, go to the Frequencies page and click on the
button. This dialog
box can also be accessed from other parts of the program to retrieve text units associated with a cluster or with
a specific association. It may also be accessed by selecting an item in the frequency page, right-clicking and
selecting KEYWORD RETRIEVAL from the pop-up menu. When calling this function, a dialog box similar
to this one appears, allowing you to specify the desired search criteria:
RETRIEVE - This option determines the text unit on which the search will be performed as well as what
will be retrieved. You can select three different text units:
• The Documents search unit allows WordStat to apply the search expression on each document
associated with a specific case and, if a specific document meets the search condition, its location
will be displayed.
• Setting this option to Paragraphs allows WordStat to display any paragraph meeting the search
condition.
• When selecting Sentences as the search unit, WordStat returns sentences meeting the search
condition.
WordStat User’s Manual
91
KEYWORD FILTERING - This group of options allows one to select the keywords on which the retrieval
will be based. Setting the first list box to No Keyword will retrieve all text units for which no keyword
has been found. This option is especially useful to identify topics or themes that have not been covered
by the current categorization dictionary or new keywords that should be added to enhance the coverage
of existing categories in the dictionary. Setting the filtering to Include at least allows one to retrieve text
units containing a minimum number of keywords from a selected list. To select the keywords, click on
the arrow button to show all available keywords and then click on the desired items. The minimum
number of keywords a specific unit must contain in order to be retrieved is specified using a small edit
box with spin buttons on the right. Setting this numerical value to the total number of keywords selected
will force the program to retrieve only those units containing all those keywords. Setting this number to
a lower value will retrieve all text units containing at least this number of keywords from the selected list.
In the example shown above, any unit containing keywords from two or more of the four categories
HUMOR, NIGHTLIFE, OUTDOOR or SPORT will be retrieved.
To enter a second filtering condition, click on the
button. You can choose to link the two
filtering conditions using either one of the three Boolean expressions: AND, OR or NOT. Choosing AND
will retrieve all text units fulfilling both criteria; selecting OR will result in a retrieval of text units
meeting either the first or the second condition, or both, while choosing the NOT Boolean operator will
retrieve text units meeting the first condition but not the second one.
To limit the filtering conditions to a single statement, click on the
button.
VARIABLE FILTERING - The second group of options allows one to use other variables restrict the
retrieved text units to specific cases selected according to some logical condition. This filtering condition
may consist of a simple expression, or may include up to two expressions joined by a logical operator
(i.e., AND, OR). In the above screen shot, only text units from cases where the variable GENDER is
equal to MEN will be retrieved.
92
WordStat User’s Manual
The following table shows the various operators available for each data type
DATA TYPE
NOMINAL / ORDINAL
NUMERIC and DATE
BOOLEAN
STRING
AVAILABLE OPERATORS
Equals
Does not equal
Is empty
Is not empty
Equals
Does not equal
Is greater than
Is lesser than
Is greater than or equal to
Is lesser than or equal to
Is empty
Is not empty
Is true
Is false
Contains
Does not contain
Is empty
Is not empty
ADD VARIABLES - This dropdown checklist box may optionally be used to add the values stored in one
or more variables to the table of retrieved segments for the specific case from which a text segment
originate.
Once all the search options have been set properly, simply click on the
selected text units.
button to retrieve the
WordStat User’s Manual
93
Working with the Retrieved Text Units
The retrieved text units are displayed in a table found on the RESULTS page.
This table contains both the case number and the variable from which the segment originates, as well as the
value of all additional variables selected by the user (see the ADD VARIABLES option above). When searching
for paragraphs or sentences, the table also displays the text associated with the retrieved unit and its location
(its paragraph and sentence number). By using arrow keys or by clicking on a row the associated text is
displayed in a separate window at the bottom of the screen with all keywords in bold. Selecting specific words
or phrases in this text window by right-clicking displays a pop-up menu to assign them to a content category,
the exclusion list or to obtain a keyword-in-context list.
To sort the table of retrieved units in ascending order by any column, simply click on the column header.
Clicking on the same column header a second time sorts the rows in descending order. Tables may also be
printed, stored as a text report, or exported to disk in various file formats such as Excel, ASCII, or HTML.
To remove a search hit from the hit list:
• Select its row and then click on the
94
WordStat User’s Manual
button.
To assign a QDA Miner code to a specific search hit:
• In the table of search hits, select the row corresponding to the text segment you want to code.
• Use the CODE drop-down list located above this table to select the code to assign.
• Click on the
button to assign the selected code to the highlighted text segment.
To assign a QDA Miner code to all search hits:
• Use the CODE drop-down list located above this table to select the code to assign.
• Click on the
button to assign the selected code to all text segments matching the search expression.
To create a report of retrieved segments:
• Click on the
button. The sort order of the current table is used to determine the display order in the
report. This report is displayed in a text-editing dialog box and may be modified, stored on disk (in RTF,
HTML or plain text format), printed, or cut-and-pasted into another application. Graphics and tables may
also be inserted anywhere in this report.
To export the table to disk:
• Click on the
button. A Save File dialog box will appear.
• In the Save As Type list box, select the file format under which to save the table. The following formats
are supported: ASCII file (*.TXT), Tab delimited file (*.TAB), Comma delimited file (*.CSV), HTML
file (*.HTM; *.HTML) and Excel spreadsheet file (*.XLS).
• Type a valid file name with the proper file extension.
• Click on the SAVE button.
WordStat User’s Manual
95
To print the table:
• Click on the
button.
To close the Keyword Retrieval dialog box:
• Click on the
96
button.
WordStat User’s Manual
Hierarchical Clustering and Multidimensional Scaling
WordStat allows one to further develop categorization by providing various graphic tools to assist the
identification of related words or categories. Those tools are obtained by the application of hierarchical cluster
analysis and multidimensional scaling on all included words or categories and are displayed in the form of
dendrograms and concept maps. The first page of the dialog is used to set various analysis and display options
for both types of analysis.
Clustering Cases/Documents
When the clustering is set to be performed on cases or documents, the distance matrix used for clustering
and multidimensional scaling consists of cosine coefficients computed on the relative frequency of the
various keywords. The more similar two documents will be in term of the distribution of keywords, the
higher will be this coefficient.
The Case Label option is used to select a variable that will be used to identify the various cases. If more
than one case or document share the same label, the record number will be appended to all subsequent cases
with the same label. For example, if you choose to use the gender of the subject as the case identifier, then
the resulting labels may look like this (Male #2, Male #10, Female #3, Female #4, etc.).
Clustering keywords
When clustering keywords or content categories, several options are available to define co-occurrence and
choose which similarity index will be computed from the observed co-occurrences.
CO-OCCURRENCE - This option allows you to specify how a co-occurrence will be defined. By default,
a co-occurrence is said to happen every time two words or two categories appear in the same case (by
case option). You may also restrict the definition of co-occurrence to entries that appears in the same
paragraph or the same sentence, or to words or categories that are located in the same user defined
section (delimited by a / character). Finally, you may restrict even further the definition of co-occurrences
by limiting the co-occurrence to a small window of words of specified length. Such an small window is
especially useful when doing an analysis directly on words (rather than categories) since it allows to
identify idioms or phrases that may need to be added to the categorization dictionary. Co-occurrence on
larger text segments such as cases or paragraphs may be more appropriate to identify the co-occurrence
of themes in individual subjects.
INDEX - The Index option lets you select the similarity measure used in clustering and in multidimensional
scaling. Four measures are available. The first three measures are based on the mere occurrences of
specific words or categories in a case and do not take into account their frequency. In all those indexes,
joint absences are excluded from consideration.
• Jaccard's coefficient - This coefficient is computed from a fourfold table as a/(a+b+c) where
a represents cases where both items occur, and b and c represent cases where one item is found but
not the other. In this coefficient equal weight is given to matches and non matches.
• Sorensen's coefficient - This coefficient (also know as the Dice coefficient) is similar to
Jaccard's but matches are weighted double. Its computing formula is 2a/(2a+b+c) where a represents
cases where both items occur, and b and c represent cases where one item is present but the other one
is absent.
WordStat User’s Manual
97
• Ochiai's coefficient - This index is the binary form of the cosine measure. Its computing formula
is SQRT(a^2/((a+b)(a+c))) where a represents cases where both items occur, and b and c represent
cases where one item is present but not the other one.
The last coefficient takes into account not only the presence of a word or category in a case, but also how
often it appears in this case.
• Cosine theta - This coefficient measures the cosine of the angle between two vectors of values.
It ranges from -1 to +1.
Probabilistic - Traditional co-occurrence measures do not take into account the possibility that two
words will sometimes co-occur by chance. As a consequence, clustering solutions obtained using those
metrics are biased toward the formation of clusters of high-frequency items. While the problem may
remain undetected or negligible when clustering low-frequency words or when analyzing co-occurrence
within a limited context (such as within a sentence, within a window or within a few words), the problem
becomes much more apparent when clustering broad content categories or frequently used words.
Enabling this option applies a correction to either the Jaccard or the Sorensen coefficient.
CLUSTERING TYPE - Two broad types of keyword clustering are available. The first method is based on
keyword co-occurrences (First Order Clustering) and will group together words appearing near each other
or in the same document (depending on the selected co-occurrence window). The second clustering
method is based on co-occurrence profiles (Second Order Clustering) and will consider that two
keywords are close to each other, not necessarily because they co-occur but because they both occur in
similar environments. One of the benefits of this clustering method is its ability to group words that are
synonyms or alternate forms of the same word. For example, while TUMOR and TUMOUR will seldom
or never occur together in the same document, second order clustering may find them to be pretty close
because they both co-occur with words like BRAIN or CANCER. Second order clustering will also group
words that are related semantically such as MILK, JUICE, and WINE because of their propensity to be
associated with similar verbs like DRINKor POUR or nouns like GLASS (for more information, see
Grefenstette, 1994).
REMOVE SINGLE WORD CLUSTERS - One way to extract potentially interesting knowledge from
dendrograms is to focus on the aggregation of items at an early stage of the clustering process. However,
when clustering hundreds or thousands of items, the identification of those items requires the user to
scroll through a very long dendrogram which includes many clusters of isolated items. Enabling this
option simplifies the use of the dendrogram by hiding all single items clusters and allowing one to
concentrate only on the strongest associations. Setting this option also removes isolated items from
multi-dimensional scaling plots, greatly enhancing their value when analyzing a large number of items.
Please note, however, that when this option is enabled, changing the number of clusters while viewing
a 2D or 3D MDS plot will cause the program to recompute the distance and location of remaining items.
REAL TIME ANIMATION - When this option is enabled, the multidimensional plots are updated after
every iteration allowing the user to monitor the progress made during the analysis at the cost of higher
computing time.
TOLERANCE - This option specifies the tolerance factor that is used to determine when the algorithm has
converged to a solution. Reducing the tolerance value may produce a slightly more accurate result but
will increase the number of iterations and the running time.
98
WordStat User’s Manual
MAXIMUM ITERATIONS - This option allows one to specify the maximum number of iterations that are
to be performed during the fitting procedure. If the solution does not converge to the limit specified by
the TOLERANCE option before the maximum number of iterations is reached, the process is stopped
and the results are displayed.
INITIAL CONFIGURATION - This option allows one to specify whether the multidimensional scaling
will be applied on a random configuration of points or on the result of a classical scaling.
Selecting the Classical Scaling option instructs WordStat to perform a classical scaling first on the
similarity matrix, and then use the derived configuration as initial values for the ordinal
multidimensional scaling analysis.
Selecting the Randomized Location option instructs WordStat to perform the multidimensional
scaling analysis on a random configuration of points. By default, WordStat initializes the random
routine before each analysis with a new random value. The seed value used for the creation of this
initial configuration is stored along with the final stress value in the history list box, located at the
bottom of the dialog. The Seed option may be used to specify a starting number that will be used to
initialize the randomization process and produce a fixed random sequence. To recall a specific seed
value used previously, double-click on the proper line in the history list box.
Dendrogram
WordStat use an average-linkage hierarchical clustering method to create clusters from a similarity matrix.
The result is presented in the form of a dendrogram (see below), also know as a tree graph. In such a graph,
the vertical axis is made up of the items and the horizontal axis represents the clusters formed at each step
of the clustering procedure. Words or categories that tend to appear together are combined at an early stage
while those that are independent from one another or those that don't appear together tend to be combined
at the end of the agglomeration process.
WordStat User’s Manual
99
NB CLUSTERS - This option allows you to set how many clusters the clustering solution should have.
Different colors are used both in the dendrogram and in the 2D and 3D maps to indicate membership of
specific items to different clusters. However, if the option to remove single item clusters is enabled, an
increase in the number of clusters may in fact result in a decrease in the number of clusters displayed and
in the overall height of the dendrogram since all single item clusters will be hidden.
DISPLAY - This option lets one choose whether the vertical lines of the dendrogram represents the
agglomeration schedule or the similarity indices.
Use this button to increase the dendrogram font size and focus on a smaller portion of the
tree.
Use this button to reduce the dendrogram font size and view a larger portion of the tree.
This button stores the cluster solution currently displayed into a new categorization dictionary
where folders at the first level correspond to different clusters, and where each of those folder
contains the associated words or expressions.
This button allows to store the displayed dendrogram into a graphic file. WordStat supports three
different file formats: .BMP (Windows bitmap files), .PNG (Portable Network Graphic compress
files) and .JPG (JPeg compressed files).
To retrieve text segments or documents associated with a specific cluster, click anywhere on a
cluster to select it (the selected cluster is displayed using thicker black lines), and then click on
this button to retrieve the associated documents. When performing first order clustering on
keywords, this operation retrieves all text segments containing at least two keywords of the
selected cluster .When performing second order clustering of keywords, all text segments
containing a single one of those keywords will be retrieved.
The slide ruler provides another way of quickly changing the number of clusters included in the
clustering solution. Moving the slider to the left increases the minimum distance required to form
a cluster and thus produces a dendrogram with more clusters. Moving the slider to the right
aggregates smaller clusters into bigger ones. However, if the option to remove single-item
clusters is enabled, an increase in the number of clusters may, in fact, result in a decrease in the
number of clusters displayed and in the overall height of the dendrogram.
Note: Clustering using other similarity or distance measures or agglomeration methods may be achieved using
the MVSP cluster analysis procedure (see Performing Multivariate Analysis, page 154).
2D and 3D concept maps
The concept maps are graphic representations of the proximity values computed on all included keywords
using multidimensional scaling (MDS). In those maps, a point represents an item (word or category) and
the distances between pairs of items indicate how likely those items are to appear together. In other words,
items that appear close together on the plot usually tend to occur together, while words or categories that
are independent from one other or that don't appear together are located on the chart far from each other.
Colors are used to represent membership of specific items to different partitions created using hierarchical
clustering. The resulting maps are useful to detect meaningful underlying dimensions that may explain
observed similarities between items.
100
WordStat User’s Manual
Please note that since multidimensional scaling attempts to represent the various points into a two- or
three-dimensional space, some distortion may result, especially when this analysis is performed on a large
number of items. As a consequence, some items that tend to appear together or that are parts of the same
cluster may still be plotted far from each other. Also, performing a multidimensional scaling on a large
number of items usually produces a cluttered map that is hard to interpret. For these reasons, interpretation
of concept maps may be feasible only when applied to a relatively limited number of items.
2D and 3D Map buttons and controls
NB CLUSTERS - This option allows the setting of the number of clusters that the clustering solution
should have. Different colors are used both in the dendrogram and in the 2D and 3D maps to indicate
membership of specific items to different clusters. The slide ruler located on the top toolbar of the dialog
box may also be used to quickly change the number of clusters. Please note that when the Remove single
word clusters option is enabled, changing the number of clusters either way often causes the program
to recompute MDS maps to take into account the different number of items displayed.
The actual orientation of axes in the final solution is arbitrary. The map may be rotated in any
way we want, the distances between items remain the same. The rotating knob can be used to
adjust the final orientation of axes in the plane or space in order to obtain an orientation than
can be most easily interpreted.
Clicking this button enables to zoom in a plot. To zoom a area of the plot, hold the left mouse
button and drag the mouse down/right. You'll see a rectangle around the selected area.
Release the left mouse button to zoom
Clicking this button restores the original viewing area of the plot.
Clicking this button performs another multidimensional scaling on a new random
configuration of points. This button is visible only when the initial configuration is set to
Random Location.
This button is used to create a copy of the chart to the clipboard. When this button is clicked,
a pop-up menu appears, allowing you to select whether the chart should be copied as a bitmap
or as a metafile.
This button allows editing of various features of multidimensional scaling plots such as the
appearance of value labels and data points, the chart and axis titles, the location of the legend,
etc. (see Multidimensional Scaling Plot Options)
This button allows storing the displayed multidimensional scaling plot into a graphic file.
WordStat supports four different file formats: .BMP (Windows bitmap files), .PNG (Portable
Network Graphic compress files) and .JPG (JPeg compressed files) as well as .WSX a
proprietary file format (WordStat Chart file). Charts stored in the latter format may be
opened, further edited and customized using the Chart Editor external utility program.
Clicking this button allows you to print a copy of the displayed chart.
WordStat User’s Manual
101
Clicking this button closes the Dendrogram & Concept Map dialog and returns to WordStat’s
main dialog.
3D Map buttons
This button can be used to show or hide left, bottom and back walls.
Clicking this button exchanges the data of the X, Y and Z axis.
Clicking this button draws anchor lines from the floor to the data point to better locate data
points in all 3 dimensions.
Clicking this button allows you to change the viewing angle of the chart. To rotate the chart,
make sure this button is selected, click on any area of the chart, hold the mouse button and
drag the mouse to apply the desired rotation.
Locating a data point on the depth dimension of a 3D plot can be very difficult especially
when the plot remains static. One often has to rotate this plot constantly on the various axis to
get an accurate idea of where the data point is located on this third axis. Clicking this button
forces WordStat to rotate the plot automatically. To disable the automatic rotation, click a
second time.
Proximity plot
Cluster analysis and multidimensional scaling are both data reduction techniques and may not accurately
represent the true proximity of keywords or cases to each other. In a dendrogram, while keywords that co-occurs
or cases that are similar tends to appear near each other, one cannot really look at the sequence of keywords as
a linear representation of those distances. One has to remember that a dendrogram only specifies the temporal
order of the branching sequence. Consequently, any cluster can be rotated around each internal branch on the
tree without in any way affecting the meaning of the dendrogram. The best analogy here is to think of a Calder
mobile. Different photos of such a mobile will yield different distances between hanging objects. While
multidimensional scaling is a more accurate representation of the distance between objects, the fact that it
attempts to represent the various points into a two- or three-dimensional space may result in distortion. As a
consequence, some items that tend to appear together or be very similar may still be plotted far from each other.
The proximity plot is the most accurate way to graphically represent the distance between objects by displaying
the measured distance from a selected object to all other objects on a single axis. It is not a data reduction
technique but a visualization tool to help one extract information from the huge amount of data stored in the
distance matrix at the origin of the dendrogram and the multidimensional scaling plots. In this plot, all measured
distances are represented by the distance from the left edge of the plot. The closer an object is to the selected
one, the closer it will be to the left.
102
WordStat User’s Manual
To select a keyword or a case that will be used as the point of reference, one can choose it from the KEYWORD
or CASE drop down list located at the top of the page. One can also freely browse through different keyword
or cases by double-clicking on its line in the Proximity Plot.
When looking at keyword co-occurrences, selecting an item enables the
button. Clicking on this button
retrieves every document or text segment containing both keywords, allowing one to further explore the factors
that may explain this co-occurrence. When examining the similarity of documents rather than keywords, this
button is replaced by a View Documents checkbox. When enabled, the two selected documents are displayed
side by side in the lower portion of the proximity plot.
The table view allows one to examine in more detail the numerical values behind the computation of those plots.
When the distance measure is based on co-occurrences, the table provides detailed information such as the
number of time a given keyword co-occurs with the selected one (CO-OCCURS) and the number of times it
appears in the absence of this selected keyword (DO NOT). Such a table also includes the number of time the
selected keyword appears in the absence of the give keyword (IS ABSENT). In the example below we can see
on the first line of the table that the category INSTRUMENTAL BEHAVIOR co-occurs 3727 times with
SOCIAL BEHAVIOR, but on 3376 occasions, this category is encountered without the presence of SOCIAL
BEHAVIOR, while this last category is found to occurs 1182 times in the absence of INSTRUMENTAL
BEHAVIOR.
WordStat User’s Manual
103
Using Heatmap Plots
Heatmap plots are graphic representations of crosstab tables where relative frequencies are represented by
different color brightness or tones and on which a clustering is applied to reorder rows and/or columns. This
type of plot is commonly used in biomedical research to identify gene expressions. When used for text mining,
such an exploratory data analysis tool facilitates the identification of functional relationships between related
keywords and group of values of an independent variable by allowing the perception of cells clumps of
relatively high or low frequencies or of outlier values.
The heatmap plot implemented in WordStat allows one to graphically examine the relationship between
keywords (rows) and values of an independent variable (columns). While the clustering available through the
WordStat Frequency (see Hierarchical clustering and multidimensional scaling, page 97) is performed on
individual cases and documents, the clustering analyses used in the heatmap plot are performed directly on the
crosstabulation tables. As a consequence, the similarity index computed for two keywords and used for
clustering do not represent their co-occurrences within cases but measures the similarity of their distribution
among the various groups of the independent variable. Likewise, two subgroups defined by values on the
independent variable will be considered near to each other if the distributions of keywords in those two groups
are similar.
104
WordStat User’s Manual
The heatmap plot can be performed either on keyword frequency or occurrences within cases (present or
absent). For both types of analysis, the observed frequency is transformed into a percentage by dividing the
frequency by either the total number of words in a specific subgroup (keyword frequency) or by the total number
of cases in this subgroup (case occurrences).
To create a heatmap:
In the WordStat main dialog, move to the crosstab page.
• Set the TABULATE option to either Keyword Frequency or Case Occurrence.
• Set the WITH option to the desired independent variable.
• Click on the
button.
HEATMAP PAGE
The main section on the right of this page, has shown in the screen shot below, displays the heatmap grid
representing the relative frequencies of each cell (row and column intersection) using different brightness or
color tones. Optional dendrograms are displayed at the top and to the left margin of this grid. The size of these
WordStat User’s Manual
105
dendrograms may be adjusted by moving the mouse cursor over the bottom edge (upper dendrogram) or the
right edge (dendrogram on the left) of the dendrogram and dragging its limit to the desired size.
The font size used to display the row and column values may also be adjusted by clicking on the
or
buttons located on the top toolbar. The size of cells and the distance between dendrogram leaves are
automatically adjusted to the new font size.
To identify which specific cases or text documents are associated with a cell or group of cells, simply select with
the mouse the rectangular area for which you would like to obtain such a list and click on the
button.
WordStat locates the cases and documents associated with those cells and displays them in a separate dialog (see
List of hits below) where each hit is presented in a row. You can sort hits on any column, display an additional
column with values from another variable, print or save this table on disk. The bottom half of this dialog
provides a preview of the text of the selected hit with the associated keywords highlighted.
ROWS OPTIONS GROUP
Clustering of rows - Enabling this option reorders the rows according to the result of a cluster analysis
and display a dendrogram at the left of the heatmap plot. Keywords that are distributed across the various
subgroups in a similar way will tend to be grouped under the same cluster.
Sort by - When the clustering of keywords is disabled, rows may be sorted in alphabetical order, in
descending order of frequency or case occurrence or displayed in their original categorization dictionary
order.
Nb Clusters - This option allows setting how many clusters the clustering solution should have. When two
clusters or more are selected, horizontal red lines are drawn in the heatmap to delineate those clusters.
COLUMNS OPTIONS GROUP
Clustering of columns - Enabling this option reorders the columns according to the result of a cluster
analysis and display a dendrogram at the top of the heatmap. Columns with similar distribution of
keywords will tend to be grouped under the same cluster. When the clustering option is disabled, the
columns are presented in their ascending order of values. Disabling the clustering of columns is
especially useful to preserve the ordinal nature of the values. For example, when looking for a
relationship between some words or keywords and publication years, then disabling the clustering of
columns will automatically sort those columns in chronological orders allowing the identification of
temporal trends.
Nb Clusters - This option allows setting how many clusters the clustering solution should contain. When
two clusters or more are selected, vertical red lines are drawn in the heatmap to delineate those clusters
of keywords.
HEATMAP OPTIONS GROUP
106
WordStat User’s Manual
Colors - The colors list box allows the selection of various color schemes to represent differences in
percentages. Monochrome schemes will express differences using levels of brightness of a single color
where black always represents the lower limit of the selected range. Multicolor spectrums may be used
to represent greater nuances in the selected range of percentages.
Minimum / Maximum - The minimum and maximum slide bars allows the setting of the range of values
that will be used to display variations of color tones or brightness. By default, the minimum value is set
to zero while the maximum value is set to the highest observed percentage. To increase the contrast at
a specific location of this range, minimum and maximum limits may be adjusted. All cells with values
lower than the minimum will be represented with the color located on the left end of the selected color
spectrum while cells with percentages higher than the maximum limit will be displayed with the color
locate on the right end of this spectrum. Reducing the range of values increases the contrast in a specific
region of percentage values.
WordStat User’s Manual
107
KEYWORD AND GROUP DENDROGRAM PAGES
The second and third pages of the heatmap dialog allow a more detailed examination of the clustering of
words or categories (Keyword Dendrogram) and of all values on the independent variable (Group
Dendrogram). WordStat use an average-linkage hierarchical clustering method to create clusters from a
similarity matrix. The result is presented in the form of a dendrogram (see below), also know as a tree
graph. In such a graph, the vertical axis is made up of the items and the horizontal axis represents the
clusters formed at each step of the clustering procedure. Items that tend to be distributed similarly within
the other variable appear together are combined at an early stage while those that have dissimilar
distributions tend to be combined at the end of the agglomeration process.
Nb Clusters - This option sets how many clusters the clustering solution should have. Different colors are
used in the dendrogram to indicate membership of specific items in different clusters.
Display - This option sets whether the vertical lines of the dendrogram represents the agglomeration
schedule or the similarity indices.
At times, it is desirable to see some areas of a dendrogram. The
zoom in or out of the dendrogram.
CLUSTERING STATISTICS PAGE
108
WordStat User’s Manual
and
buttons may be used to
The fourth page of the heatmap dialog allows the close examination of the matrices of similarities among
keywords or among groups as well as the statistics associated with the agglomeration processes of both the
keywords and the groups.
WordStat User’s Manual
109
Performing Correspondence Analysis
Correspondence analysis is a descriptive and exploratory technique designed to analyze relationships among
entries in large frequency crosstabulation tables. Its objective is to represent the relationship among all entries
in the table using a low-dimensional Euclidean space such that the locations of the row and column points are
consistent with their associations in the table. The correspondence analysis procedure implemented in WordStat
allows one to graphically examine the relationship between words or content categories and subgroups of an
independent variable. The results are presented using a 2 or 3-dimensional map. Correspondence analysis
statistics are also provided to assess the quality of the solution. WordStat currently restricts the extraction to the
first three axes. This insures that the results remain easily interpretable. This limitation may however be removed
in future versions upon users request.
The first two pages of the dialog, provides graphical displays of correspondence maps. When the number of
words or categories or the number of subgroups is less than four, only the 2D Map page can be accessed. When
the comparison is restricted to two groups of individuals, only one axis can be extracted. In this situation, the
axis is plotted diagonally in the two-dimensional space. We have done this mainly for readability reason:
plotting all the keywords on a single horizontal axis would have produced a cluttered list of keywords that would
have made the graph useless.
You will find immediately below a description of the various controls in the dialog, followed by some guidelines
for interpreting correspondence plots.
2D Map control
PLOT
When more than two axes have been extracted, this control allows you to select all the
possible axes combinations that can be graphed on the two axes of the plot.
2D and 3D Map Controls
Words
This checkbox allows you to display or hide the row points (i.e., words or category names)
Groups
This checkbox allows you to display or hide the column points (i.e., subgroup labels).
Clicking this button enables to zoom in a plot. To zoom a area of the plot, hold the left mouse
button and drag the mouse down/right. You'll see a rectangle around the selected area.
Release the left mouse button to zoom
Clicking this button restores the original viewing area of the plot.
Items distributed in a very similar way among subgroups of the categorical variables may be
plotted on top of each other, making them hard to differentiate. Clicking down this button
adds some random noises to the location of individual words or keywords, allowing one to
clearly identify those that overlap. To remove the random noises, click on the button again.
Clicking on this button brings up a dialog to customize the appearance of the correspondence
110
WordStat User’s Manual
plots (click here to obtain more information on the various settings that may be changed).
This button is used to create a copy of the chart to the clipboard. When this button is clicked,
a pop-up menu appears, allowing you to select whether the chart should be copied as a bitmap
or as a metafile.
Clicking this button allows you to print a copy of the displayed chart.
Clicking this button closes the Dendrogram & Concept Map dialog and returns to WordStat’s
main dialog.
3D Plot controls
This button can be used to show or hide left, bottom and back walls.
Clicking this button draws anchor lines from the floor to the data point to better locate data
points in all 3 dimensions.
Clicking this button allows you to change the viewing angle of the chart. To rotate the chart,
make sure this button is selected, click on any area of the chart, hold the mouse button and
drag the mouse to apply the desired rotation.
Locating a data point on the depth dimension of a 3D plot can be very difficult especially
when the plot remain static. One often has to rotate this plot constantly on the various axis to
get an accurate idea of where the data point is located on this third axis. Clicking this button
forces WordStat to rotate the plot automatically. To disable the automatic rotation, click a
second time.
WordStat User’s Manual
111
Interpreting correspondence analysis results
Interpretation of correspondence analysis maps can be somewhat tricky and should be made with great care,
especially when examining the relationship between row points and column points. Here are some basic
rules that should help you interpret such maps:
Relationship among words or categories (row points):
• The more similar is the distribution of a word or a content category among subgroups to the total
distribution of all keywords within subgroups, the closer it will be to the origin. Words or categories
that are plotted far from this point of origin have singular distributions.
• If two words or computed categories have similar distributions (or profiles) among subgroups of the
independent variable (columns), their points in the correspondence analysis plot will be close together.
For example, if the words consist of artist names and the studied subgroups represent different age
groups, then if the form of the distribution of two different artists among those age groups is similar,
then they will tend to appear near each other. Words with different profiles will be plotted far from
each other. Please note however that two points may appear close to each other on a two or three axes
solution, but may in fact be far apart when taking into account an additional dimension.
Relationship among subgroups (column points)
• The more singular a profile of words/categories for a subgroup is, compared to the distribution of those
words/categories for the entire sample, the farther this subgroup will be from the point of origin.
• If two subgroups of individuals have similar profiles of word usage or content categories, they will be
plotted near each other.
• Subgroups with different profiles will be plotted far from each other.
Relationship between words/categories and subgroups (row and column points):
• Great caution should be taken when interpreting the distances between two sets of points (row and
column points). The fact that the name of a subgroup is near a specific word or content category should
not necessarily be interpreted as an indication that they are closely related.
• While the distance between words or content categories and subgroups has no interpretable meaning,
the angle between such a word point and a subgroup point from the origin is meaningful:
• An acute angle indicates that the two characteristics are correlated.
112
WordStat User’s Manual
• An obtuse angle, near 180 degrees, indicates that the two characteristics are negatively correlated.
In the example below, REM, U2 and RadioHead could be viewed as related to 18 years old listeners.
However, while both REM and U2 points are closer to the 18 years old subgroup, Radiohead should
be identified as more characteristic of those listeners since it is farther from the origin.
• Words or categories closely associated with two subgroups will be plotted in an angle from the origin
that will lie between those two groups. In the above example, the rock groups Korn and Metallica seem
to be characteristics of both 15 and 16 years old listeners.
For a more comprehensive description of this method, its computation and applications, see Greenacre
(1984). For an application of correspondence analysis to the analysis of textual data see Lebart, Salem, and
Berry (1998).
WordStat User’s Manual
113
Automated Text Classification
Automated text categorization is a supervised machine-learning task by which new documents are classified into
one or several predefined category labels based on an inductive learning process performed on a set of
previously classified documents. This machine-learning approach of classification has been known to achieve
comparable if not superior accuracy than classification performed by human coders, yet at a very low cost in
manpower. It has been used to automatically classify documents into proper categories or to find relevant
keywords describing the content and nature of a document. It has also been used to automatically file or re-route
documents or messages to their appropriate destinations, to classify newspaper articles into proper sections or
conference papers into relevant sessions, to filter emails or documents (like spam filtering), or to route a specific
request in an organization to the appropriate department. Automated text categorization may also be used to
identify the author of a document of unknown or disputed authorship. For a good overview of automated text
classification, see Sebastiani (1999).
The automated text categorization module in WordStat allows one to apply either Naive Bayes or K-Nearest
Neighbors learning algorithms on an existing textual database in order to develop a categorization model (or
classifier). The program also provides features to test the accuracy of the classification and to optimize the
various parameters. Once optimized, the obtained classification model may be used immediately to classify
uncategorized documents or may be saved on disk to be applied later outside WordStat using the WordStat
Document Classifier utility program. The classifier may also be incorporated into a desktop or web application
or within a document management system using the WordStat Software Developer's Kit.
The development and application of a text classifier often involves the following steps:
1. Removal of function words, words that appear in only a few documents and words that appear too often.
2. Dimension reduction, through lemmatization, stemming, categorization, word clustering or other
dimension-reduction techniques.
3. Feature selection, which consists of a selection of terms based on their capability to discriminate
between categories of documents.
4. Training the classifier on the train set.
5. Testing the accuracy of the classification on a test set.
6. Applying the classifier to new documents.
While the basic content analysis features of WordStat may be used to deal with the first two steps, the
Automated Text Categorization dialog box allows one to accomplish tasks related to the last four steps. This
dialog box consists of four pages:
• The Select Features page allows one to apply various feature selection methods to select a subset of
terms to be used by the classifier.
• The Learn & Test page is the location where machine-learning algorithms are set and tested. This page
also allows the storing of classification model to disk.
• The History & Experiment page keeps track of every learning test performed during a session allowing
one to choose the best setting and algorithm for a specific classification task. It also gives access to a
batch experiment dialog box that may be used to define numerous tests and perform them all at once.
• The Apply page is used to apply a classifier to an external document, a list of documents or to the current
data file.
Accessing the Automated Text Classification dialog box
114
WordStat User’s Manual
To develop a classifier for a specific categorical variable, first select this variable as the independent
variable in Simstat and assign to the dependent list box one or several text variables on which the training
will be performed. When running WordStat from QDA Miner, the categorical variable should be specified
in the In relation with list box. Once in WordStat, set the various text processing options (such as the
lemmatization, the exclusion and categorization lists, and all the other analysis options needed) to obtain
the desired list of keywords or content categories. Then move to the Crosstab page and make sure the
desired categorical variable is the one displayed in the With list box.
You may then access the Automated Text Classification dialog box by clicking on the
button.
Select Features page
The Select Features page allows one to view the strength of the relationship between words, keywords or
content categories and classes of the selected categorical variable. It also allows you to select a subset of
items based on those statistics.
The strength of the relationship between an item and the classes of the categorical variable can be computed
either on the occurrence (present or absent), on the frequency of items in each class, or on the percentage
WordStat User’s Manual
115
of words. To change the base statistic used for assessing differences among classes, set the Compute
statistics on list to the proper option.
The discriminative strength of each item is assessed using three statistics and is presented in a table
containing the following information:
Name
Global Chi²
P
Max Chi²
P
The word, keyword or content category.
The overall chi-square value computed on all classes of the categorical variable.
The probability of the above chi-square value.
The chi-square value computed on the class with the highest case occurrence or
frequency against all the other classes.
The probability of the Max Chi² value.
Biserial
The biserial correlation computed between the class of the categorical variables
with the highest case occurrences and the remaining classes. This coefficient
assumes that the presence or absence of a class is determined by a trait normally
distributed. Contrary to the standard correlation coefficient, this measure of
association may yield a value lower than -1.0 or higher than +1.0.
Predict
Indicates the class in which the item most frequently occurs. When the highest
case occurrence appears for more than one class, the column includes the labels
of all those classes.
Clicking on any column header sorts the table in ascending order of the data in that column. Clicking on
the same column header a second time sorts its content in descending order. The check boxes in the first
column show, by default, that all items are to be included in the classification model. To manually remove
an item, simply click in the box to remove the check mark.
The FILTER TABLE option allows one to display only the terms characteristic of a specific class. It may
also be set to <selected> to display only items that have been selected for inclusion in the categorization
model. To display all items set this option to <all classes>.
The lower portion of the page displays a bar chart with the percentage of cases in each class of the
categorical variable containing the selected item. Classes are presented in descending order of case
occurrence. This graph is synchronized with the above table so that changing the selected item in this table
results in the display of the corresponding distribution chart.
To display the chart on the right side of the table, click on the
the bottom of the table, click on the
button. To bring the bar chart back to
button.
Performing Automatic Feature Selection
It has been shown that reducing the number of terms in classification models can reduce not only the cost
of recognition by reducing the number of features that need to be collected, but also sometimes can improve
the classification accuracy and can reduce the risk of overfitting. Several methods have been proposed to
select a subset that yields the best performance for a specific classification system. WordStat allows one
116
WordStat User’s Manual
to apply a filter on available items in order to select a specified number of those based on the computed
association with the classes to predict.
To access the feature selection dialog box, click on the
appear:
button. The following dialog box will
To include all items, set the selection criterion to All and click OK. To remove all the check marks beside
the items, set the selection criterion to None and click OK. When the Select criterion is chosen, specify
how many items should be selected and which statistic will be used to select them. Three statistics are
available for performing such a selection: The global chi-square value, the max chi-square and the bi-serial
correlation (see above for a description of these statistics). By default, the selection is performed by
extracting items with the highest values on the selected statistic. Enabling the Optimization option instructs
the program to apply a special algorithm that will take into account this statistic as well as current contrasts
between classes. This option has been found in most situations to improve the performance of the classifier
for an equal number of selected features.
To close this dialog box and apply the selection criteria, click OK. You may also leave this dialog box
without affecting the current selection by clicking on the Cancel button.
Once features have been selected, move to the Learn & Test page to select a learning algorithm and test it.
WordStat User’s Manual
117
Learn & Test Page
The Learn & Test page is where machine-learning algorithms are chosen and tested and from which the
classifier may be exported to disk.
The panel at the top of the page allows one to select the machine-learning algorithm to use, set various
analysis options and choose how the classification model will be tested.
Learning options
METHODS - Two machine-learning algorithms are available for text classification:
The Naive Bayes algorithm classifies text by estimating the probability of a class, given the presence
or absence of specific words or keywords in the document to be classified. It first computes the
probability of each term to occur in documents of specific classes in the training set. It then combines
the probabilities associated with words found in the document to classify to estimate the probability
that this document belongs to different classes. Finally, it assigns the document to the class with the
highest probability. A multinomial Naive Bayes model has been chosen to handle both binomial and
multinomial classification tasks as well as binary and numerical weights of items.
The k-Nearest neighbor classification method compares a document to be classified to all documents
in the training set, retrieves the k most similar documents, and then assigns the new document to the
most common classes in this retrieved set. This method is usually known to provide accurate
118
WordStat User’s Manual
classification when the training set is large enough, yet can be very time-consuming because of the
need to compare and rank the entire training set for similarity with the test document. It also usually
requires a larger storage space since it must keep frequency information for all documents in the
training set rather than just a few classification rules or mathematical formulas like many other
machine-learning methods. However, WordStat uses a very efficient K-NN algorithm that drastically
improves the computing speed and reduces the disk space and memory requirement. When this method
is chosen, an NB edit box appears below the Method list box, allowing one to set the number of similar
documents on which this classification will be based. Values higher than 20 or 30 are typically used
in text classification tasks.
USE - This option is used to select the item statistic to be used in training and classification. Choosing
Case Occurrence results in the use of binary weights, indicating whether or not a word or keyword
occurs in the document. Selecting Keyword Frequency allows one to use additional information related
to how often this item occurs in each document. Percentage of Words and Percentage of Keywords
provide two methods to normalize the obtained frequency to take into account the document length. Such
normalization is performed by dividing the frequency either by the total number of words found in the
document or the total number of keywords that have been extracted by WordStat.
FEATURE WEIGHTING - Feature weighting has been presented as an alternative to feature selection or as
a way to further improve classification accuracy from selected item sets. This method consists of giving
more weight to items that are rather good at differentiating documents from distinct classes and negligible
weight to those that are distributed evenly among classes. The most frequently used weight in information
retrieval is the TF*IDF measure where the frequency of an item is adjusted to take into account the
number of documents containing this item. However, such a weighting can be considered to be only a
crude approximation of the capacity of the item to differentiate documents from distinct classes. More
accurate performance of the classifier can be expected from using a weight based on a more direct
indicator of this discriminative capability such as the Global Chi-Square or the Max Chi² described
previously.
Testing Option
The evaluation of a classifier consists of measuring its effectiveness at classifying documents that have
already been classified. Those documents should, however, not be part of the training set used to develop
the classification model, since it would likely overestimate the real performance of the classifier. Yet,
training a classifier on only a portion of the available training set may result in a less than optimal classifier.
Cross-validation methods have been proposed as a compromise solution that allows one to develop a
classification model on all the available documents in the training set yet provide a somewhat more realistic
estimate of the classifier performance. WordStat offers three broad types of validation methods:
Leave-one-out - This cross-validation method consists of 1) removing a document from the training set,
2) developing a classification model on the remaining documents, 3) applying this model to predict the
membership of this single document and 4) comparing the decision made by the classifier to the actual
class to which this document belongs. This procedure is then repeated for each document in the training
set and the different decisions are combined to estimate the performance of the classifier. While this
method logically involves the computation of a large number of models and may seem to be time
consuming, in practice the classification model is computed only once but adjusted analytically to remove
the contribution of the test document prior to its classification. This cross-validation method will often
WordStat User’s Manual
119
overestimate the performance of a classifier if the training set includes duplicate documents or if included
documents are not totally independent from one another.
n-folds - This method consists of splitting the training set into smaller partitions and testing each partition
on the classification performance obtained by a model developed on the remaining ones. For example,
when using a five-fold cross-validation method, the training set is divided randomly into five subsets,
each containing approximately 20% of the documents. For each subset the program tests the accuracy
obtained by a classification model developed on the remaining 80% of the original training set. The
performances obtained on all five classifiers are then used to estimate the performance of the classifier
computed on the full training set. WordStat provides a choice between five-fold, 10-fold and 20-fold
cross-validation.
External file - A more conventional method for assessing the performance of a classifier is to test the
accuracy of the classifier on an entirely different set of documents that have also been classified but are
totally independent of the training set on which the categorization model is based. To perform such a test,
WordStat requires the test set to be stored in a different data file. When this option is selected, an Open
File dialog box is displayed allowing one to identify the file containing the external set. WordStat then
displays a dialog box like the one below allowing one to choose the text variable containing the
documents to be used for classification and the numerical variable containing the class to which this
document belongs. Once set, click OK to return to the classification page.
Once the analysis options and the validation method have been set, click on the
perform the training and test the performance of the obtained classifier.
button to
Results
A common way of assessing the accuracy of a classifier is by comparing the accuracy of predicted class
membership against actual membership. Such information is provided by the Confusion Matrix where
each predicted class is plotted against the actual class. Accurate predictions are plotted in the diagonal
going from the top left to the bottom right of the table. Values in this diagonal are printed in bold characters
for easy identification. Values in cells below or above this diagonal represent classification errors. Beside
the actual number of documents in each cell, the table shows the row, column and total percentages. Row
percentages represent the number of documents in a class that have been classified in a specific way, while
column percentages express the percentage of a specific prediction actually belonging to a known class.
This table may be used to identify which classes are the easiest or hardest to predict, as well as which
classification errors are the most common. To facilitate comparisons across the classes of the categorical
variable, two related statistics are printed on the right of the table: Precision is the probability that
documents identified as belonging to a class are correctly classified and Recall is the probability of
documents in a class to be correctly identified.
Several statistics are provided to assess the global performance of the classifier. The Accuracy measure
is the proportion of documents correctly classified. It is considered a micro-average statistic since it gives
equal weight to documents regardless of how they are distributed among classes of the categorical variable.
120
WordStat User’s Manual
The Average Precision and Average Recall measures are macro-average statistics obtained by computing
the mean precision and recall obtained for every class.
The Confusion List page presents information already found in the confusion matrix but in the form of a
single list that allows one to identify more easily the most common errors. The table may be sorted on the
actual class of the documents, the predicted classification, the number of times such a classification error
occurred, or the proportion of documents that have been misclassified this specific way. By default, the
table is sorted in descending order of frequency. To sort the table on values in another column, simply click
on this column header. Clicking on the same column header a second time sorts its content in descending
order.
The Review Errors window displays a list of all documents that have been misclassified, allowing one to
examine for each document the classification error made by the classifier as well as the computed values
associated with every class of the categorical variable. A text window in the bottom of the list also allows
one to review the text on which the classification has been made and potentially identify some of the
reasons why the document had been misclassified.
WordStat User’s Manual
121
History & Experiment Page
There is, unfortunately, no rule or rationale to help one chose a classifier and its options and parameters,
nor to indicate how many or which items should be selected for inclusion in the development of a
classification model. For this reason, the selection of classifiers and their optimization must rely on
experimentation. In other words, in order to obtain the best classifier, one needs to perform numerous tests
involving systematic variations of the various settings and compare the results. The History page offers
a way to keep track of previously performed trials, the options used, as well as the obtained performances.
From this page, one can also access an Experiment dialog box that provides a convenient way to define
and run a large number of classification experiments on the same data set.
Data from prior trials are presented either in the form of a table (Table page) or as a line chart (Graph
page). Clicking on any column header of the table sorts it in ascending order of the data in this column.
Clicking on the same column header a second time sorts its content in descending order. By default, the
displayed statistics are computed for all classes of the categorical variable. To restrict the display of either
the table or the line chart to statistics related to a single class, set the Class list box to the desired class.
Setting this option to <all classes> brings back the micro- and macro-average statistics computed on all
classes.
122
WordStat User’s Manual
Data from specific trials may be deleted from the table by selecting their rows and clicking on the
button.
The Graph page allows one to compare the performance of various settings and the relationship between
those settings using a line chart like the one shown below.
By default, the chart displays the relationship between accuracy and the number of features in the
classification model. One may, however, examine the relationship between other parameters (such as
precision versus recall) by changing the information plotted either on the horizontal or the vertical axis of
the chart.
WordStat User’s Manual
123
The following table provides a short description of buttons available:
Control
Description
Press this button to save either the table or the chart on disk. The table may be saved
to disk in Excel, plain ASCII, text delimited, or HTML Charts may be saved in BMP,
JPG or PNG graphic file format or may be stored on disk in a proprietary format
(.WSX file extension) that may later be edited and customized using the Chart Editor.
Pressing this button prints a copy of the displayed table or chart.
This button allows the editing of various features of the chart such as the left and
bottom axis, the chart and axis titles, the location of the legend, etc.
This button is used to create a copy of the chart to the clipboard. When this button is
clicked, a pop-up menu appears allowing one to select whether the chart should be
copied as a bitmap or as a metafile.
Pressing this button closes the chart dialog box and returns to WordStat's main screen.
The History page also gives access to the Experiment feature where one can quickly perform a series
classification experiment. To access this feature click on the
124
WordStat User’s Manual
button.
Classification Experiment Dialog Box
The Classification Experiment feature allows one to quickly perform a series of classification experiments
in order to choose among classification methods, analysis settings and selected sets of items (or features).
To access this dialog box click on the
appear:
button. A dialog box similar to the one below will
The basic principle of this dialog box is to create a list of classification experiments involving different
settings and then to instruct WordStat to perform all those experiments one after the other. Experiments first
need to be defined in the upper part of the dialog box and then to be moved to the table of experiments
located at the bottom of the dialog box. After several experiments have been defined and added to the list,
one can execute all of them at once.
The first steps involve setting the experiment options. The Feature Selection option located at the top of
the dialog box provides automatic feature selection options similar to those available from the first page
of the document classification dialog box with only one exception: while the original dialog box allows one
to select only one feature set size at a time, the current dialog box allows one to set numerous feature set
sizes at once. For example, by entering the following string in the Select edit box:
50 100 150 200 300
five classification experiments will be performed using the same analysis settings but on features set sizes
of 50, 100, 150, 200 and 300, picked out using the chosen selection method. For more information on the
Statistics, Based on and Optimization option, see Performing Automatic Feature Selection (page114).
The Learning and Testing groups of options also provide similar settings as those available on the Learn
& Test page. Please refer to this section for information on the available algorithms and options.
To add a classification experiment to the list:
• Set the various classification experiment settings.
WordStat User’s Manual
125
• Click on the
button to move the defined experiment to the list.
To remove an experiment from the list:
• In the list of previously added experiments, select the one to delete.
• Click on the
button.
To run experiments in the list:
• Click on the
button. The program performs all the experiments in the list that had not be executed
before. Once an experiment is completed, the Executed column for this item is set to Yes preventing
the program from executing the same experiments twice. Results of every experiment are automatically
appended to the History page.
• Click on the
dialog box.
126
WordStat User’s Manual
button to close the dialog box and return to the History page of the classification
Apply Page
The Apply page allows one to use the most recently tested classifier to categorize either a single document,
a list of files or documents stored in the current data file or another Simstat/QDA Miner datafile. To
perform similar tasks using previously saved classification models, use the WordStat Document Classifier
utility program.
The document classification feature supports numerous file formats such as plain ASCII text files as well
as HTML, Rich Text, MS Word, WordPerfect, Acrobat PDF files. Detailed results of classifications are
displayed in a table at the bottom of the dialog box and may be either saved to disk or printed. When
applied to the current database or another database, the automatic classification feature may be useful to
categorize unclassified documents or to review existing classifications based on the results of the new
classifier.
To classify a single document:
• Set the Text To Classify list box to Single Document.
• Click on the Open File button to locate and import the file containing the text to be classified. You
may also type directly in the text-editing window or paste a text previously copied to the clipboard
(by moving to the text-editing window and pressing Ctrl-V).
• Click on the Classify button to apply the current classifier to the displayed text.
To classify a list of documents:
• Set the Text To Classify list box to List of Documents.
WordStat User’s Manual
127
• Click on the Edit List button to display a dialog box like the one below that allows you to browse
your computer and select certain documents. You may add documents located in different folders
by successively adding documents located in a specific folder and then moving to a new location
where the other documents are located. Click OK to confirm the changes to the file list.
• Click on the Classify button to apply the current classifier to all documents in the list.
To classify documents in the current data file:
• Set the Text To Classify list box to Current Data File.
• Click on the Classify button to apply the current classifier to all documents contained in the selected
text variables. Please note that those are the same text variables used for developing the current
classifier. However, some documents may have been ignored during the classification phase, either
because they had been filtered out or because they had not been classified before and contained
missing values in the categorical variable. Those documents, as well as all other previously classified
documents, will be categorized by the current classifier and the result of this classification will be
displayed in a result table.
•
128
To store the predicted class or the computed score obtained for every class, click on the
The following dialog box will appear:
WordStat User’s Manual
button.
• To save the predicted class, put a check mark beside Save Predicted Class and enter a variable
name.
• To save the scores associated with each class and upon which the classification has been made, put
a check mark beside Save Scores and enter a variable prefix (up to 7 characters). Variable names
are created by adding successive numeric values to this prefix. For example, if the edit box at the
right of the Variable Prefix option is set to "CLASS_", the variable names will be CLASS_1,
CLASS_2, CLASS_3, etc.
• If any one of the specified variables does not exist, WordStat will create new ones and store the
numerical values associated with either the predicted class or the class scores. A confirmation dialog
box will ask for confirmation of the creation of those new variables as well as the overwriting of any
existing ones.
To classify documents in another data file:
• Set the Text To Classify list box to External Data File.
• Click on Open File to locate the Simstat/QDA Miner data file containing the documents to be
classified. A dialog box similar to the following one will appear:
• Select one or several text or document variables that will be used for classification purposes and
click OK. The content of the data file is displayed in a table, while the text to be classified is
displayed on its right. You can resize this text window by dragging its left border.
• Click on the Classify button to apply the current classifier to all documents contained in the selected
text variables.
WordStat User’s Manual
129
• To store the predicted class or the computed score obtained for every class, click on the
A dialog box similar to the following will appear:
button.
• To save the predicted class, put a check mark beside Save Predicted Class and enter a variable
name.
• To save the scores associated with each class and upon which the classification has been made, put
a check mark beside Save scores and enter a variable prefix (up to 7 characters). Variable names are
created by adding successive numeric values to this prefix. For example, if the edit box at the right
of the Variable Prefix option is set to "CLASS", the variable names will be CLASS1, CLASS2,
CLASS3, etc.
• If any one of the specified variables does not exist, WordStat will create new ones and store the
numerical values associated with either the predicted class or the class scores. A confirmation dialog
box will ask to confirm the creation of those new variables, as well as to overwrite any existing
variables.
To export the table to disk:
• Click on the
button. A Save File dialog box will appear.
• In the Save as type list box select the file format in which to save the table. The following formats
are supported: ASCII file (*.TXT), Tab delimited file (*.TAB), Comma delimited file (*.CSV),
HTML file (*.HTM;*.HTML), and Excel spreadsheet file (*.XLS).
• Type a valid file name with the proper file extension.
• Click on the Save button.
130
WordStat User’s Manual
Exporting a classifier to disk
Once developed and optimized, a document classification model may be saved to disk and later be used
outside the WordStat main program to categorize new documents. The saved categorization model includes
all word exclusion, extraction and categorisation settings needed to accurately retrieve items used in the
classification model as well as either the classification rules (Naive Bayes) or the keyword indexing of
documents in the training set (K-nearest neighbors) needed to perform document classification.
To save the classifier on disk:
• Click on the
button locate on the top of the Learn & Test page. A standard Save File dialog
box will appear.
• Enter the file name under which you would like to save the classifier and then click on the Save
button. WordStat will automatically provide a .wclas file extension.
Document classifiers may be retrieved and applied to new documents using the WordStat Document
Classifier utility program (see page 149). A special Software Developer's Kit (SDK) is also available
(planned release date: Fall 2006) upon request from Provalis Research allowing any programmer to
integrate WordStat categorization and classification technologies into one's own database or document
management system (see page 153).
WordStat User’s Manual
131
Filtering Cases
The FILTER CASES command temporarily selects cases according to some logical condition. You can use this
command to restrict your analysis to a subsample of cases or to temporarily exclude some subjects. The filtering
condition may consist of a simple expression, or include many expressions related by logical operators (i.e.
AND, OR, NOT). The condition expression should be a valid xBase expression evaluated as true or false and
may not exceed 240 characters. (see pages 135 to 140 for more instructions on expression operators and
evaluation rules and supported xBase functions)
When selecting the Filter command, a filter builder dialog box is displayed.
You can directly type the filtering expression in the Case Filter edit box using the proper syntax, or use any
elements displayed on the upper part of the dialog box to build a valid expression. To restore previously used
filtering conditions, click on the down arrow button located to the right of the Filter edit box.
Cases can also be filtered based on the presence or absence of specific codes resulting from the current content
analysis. The Codes section allows you to select cases that contains a single category or a specific combination
of two categories. The AND, OR and NOT boolean operators are used to determine how those two categories
should be combined.
132
WordStat User’s Manual
For example:
APPEARANCE AND ART
Selects only cases that contain words in both categories.
APPEARANCE OR ART
Selects cases that contain words in either one of these two categories.
APPEARANCE NOT ART
Selects all cases that contains a word in category APPEARANCE but that
do not contain any word found in the ART category.
Once a filtering condition has been entered you can apply the filter and leave this dialog box by clicking on the
APPLY button. If the filter expression is invalid, a message is displayed and the exit is not performed.
To temporarily deactivate the current filter expression, click on the IGNORE button. The filter string will be
kept in memory and may be reactivated by choosing the FILTER command again.
To exit from the dialog box and restore the previous active filtering condition, click on the CLOSE button.
The upper part of the Filter dialog box contains various elements to help you build a valid xBase filtering
expression:
VARIABLE NAME LIST BOX - Double-clicking a variable name from the list box located to the left of
the dialog box inserts that name in the edit box at the current caret position.
FUNCTION LIST BOX - A list of valid xBase expressions is displayed to the right of the dialog box.
Double-clicking on a xBase function in the list box, inserts that function at the current caret position.
When a function requires one or several arguments, the argument section remains highlighted. To replace
the highlighted text with a value, an expression or a variable name, simply type the proper text on the
keyboard or select a variable name or function.
NUMERIC, BOOLEAN AND RELATIONAL OPERATORS BUTTONS - Clicking on any relational
or boolean operation or on any numeric button inserts the corresponding symbol in the edit box at the
current caret position.
The following section provides a description of xBase syntax rules used in the FILTER command and a detailed
description of each xBase function.
Expression Operators and Rules
Operators used in xBase expressions are standard in every xBase dialect.
String Operators
+
-
Joins two strings. Trailing spaces in the strings are placed at the end of each string.
Joins two strings and removes trailing spaces from the string preceding the operator and
places them at the end of the string following the minus sign operator.
Numeric Operators
WordStat User’s Manual
133
+
*
/
^
Addition
Subtraction
Multiplication
Division
Exponentiation (or **)
Relational Operators
=
==
<>
#
!=
<
>
<=
>=
$
Equal to
Exactly equal to
Not equal to
Not equal to
Not equal to
Less than
Greater than
Less than or equal to
Greater than or equal to
Is contained in
Logical Operators (Notice the periods surrounding the operator)
AND
OR
NOT
both expressions are true
either expression is true
either expression is false
Evaluation Order
When more than one type of operator appears in an xBase expression, the order of evaluation is as follows:
Expressions containing more than one operator are evaluated from left to right. Parentheses are used to
change the evaluation order. If parentheses are nested, the innermost set is evaluated first.
Numeric operators are evaluated according to generally accepted arithmetic principles:
operators contained in parentheses
exponentiation
multiplication and division
addition and subtraction
Order of evaluation may be altered with parentheses:
3+4*5+6 = 29
(3+4)*5+6 = 41
(3+4)*(5+6) = 77
134
WordStat User’s Manual
Logical operators are evaluated as .NOT. first, .AND. second, and .OR. last. Logical evaluation order may
also be altered with parentheses. In multiple conditional expressions that contain the .NOT. operator,
always use parentheses to enclose the .NOT. operator with the expression to which it applies.
Supported Xbase functions
The following xBase functions are supported in the SORT CASES and FILTER CASES command
NOTE: Memo field names are not allowed in xBase expressions.
ALIAS()
Returns the Alias name of the current work area as a string.
ALLTRIM (String)
Trims both leading and trailing spaces from a string. The string may be derived from any valid xBase
expression.
ALLTRIM("
Provalis
") returns 'Provalis'.
AT (SearchString, TargetString)
Determine whether a search string is contained within a target. If found, the function returns the position
of the search string within the target string (relative to 1). If not found, the function returns 0 (zero).
AT("gh", "defghij") returns 4.
CHR (Val)
Converts a decimal value to its ASCII equivalent.
CHR(83) returns 'S'
CTOD (String)
Converts a character string into an xBase date. The string must be formatted according to the Windows date
format settings.
CTOD("12/31/94")
DATE ()
Returns the system date (today). Use DTOC(DATE()) to retrieve today's date formatted according to the
Windows settings.
WordStat User’s Manual
135
DAY (DateField)
Returns the day portion of an xBase date as an integer.
DELETED ()
Returns True if the case is deleted and False if not deleted.
DESCEND (String)
An xBase function that inverts a key value using 2's complement arithmetic. The result of the operation is
the arithmetic inverse of the key value. When inverted keys are sorted in ascending sequence, the result is
in descending order. A filter expression could be
DESCEND(DTOS(billdate)) + CUSTNO
DTOC (DateField)
Converts an xBase date into a character string formatted according to the Windows settings. For example,
if the date format was American and the date field contained March 21, 1995, DTOC(datefield) would
return '03/21/1995'.
DTOS (DateField)
Converts an xBase date into a string formatted according to standard xBase storage conventions
(CCYYMMDD). For example, December 21, 1993 would be returned as '19931221'. Indexes that contain
date elements should use the DTOS() function, which naturally collates into oldest date first.
EMPTY (Field)
Reports the empty status of any xBase field. Character and date fields are empty if they consist entirely of
spaces. Numeric fields are empty if they evaluate to zero. Logical fields are empty if they evaluate to False.
Memo fields that contain no reference to a memo block in the associated memo file are empty.
IF (Logical, True Result, False Result)
This is the immediate if function. If the Logical expression is true, return the True result, otherwise return
the False result. The types of the True Result and the False Result must be the same (i.e., both numeric, or
both strings, etc.) The logical expression must of course evaluate as True or False.
IF(DATE() - CTOD("12/31/93") > 0,"This Year", "Last Year")
IIF (Logical, True Result, False Result)
Supported exactly like IF() as noted above.
INDEXKEY ()
Returns the current index key as a string. (Same as ORDKEY()).
LEFT (String, Length)
Returns the leftmost characters of the expression for the defined length.
136
WordStat User’s Manual
LEFT("xyzabc", 3) returns 'xyz'.
LEN (Expression)
Returns the length of the expression result as an integer.
LOWER (String)
Converts the string expression into lower case.
MONTH (DateField)
Returns the month portion of an xBase date as an integer.
ORDER ()
Returns the current index order as an integer.
ORDKEY ()
Returns the current index key as a string. (Same as INDEXKEY())
PADC (String, Length, Character)
Centers the passed string between a number of the passed character to make the string the specified length.
'[' + PADC("Smith", 9 ,"-") + ']' returns '[--Smith--]'.
PADL (String, Length, Character)
Pads the passed string to the specified length with the specified characters. If the string is longer than the
value specified by Length, the string is truncated to this length.
'[' + PADL("Smith", 8, "*" ) + ']' returns '[***Smith]'.
'[' + PADL("John Smith", 8, " " ) + ']' returns '[John Sc]'.
PADR (String, Length, Character)
Pads the passed string to the specified length using the specified character. If the string is longer than the
value specified by Length, the string is truncated to this length.
'[' + PADR("Smith", 8, " " ) + ']' returns '[Smith
]'.
'[' + PADR("John Smith", 8, " " ) + ']' returns '[John Sc]'.
RAT (SearchString, TargetString)
Determine whether a search string is contained within a target, starting from the right side of the target
string. If found, the function returns the position of the search string within the target string (relative to 1).
If not found, the function returns 0 (zero).
WordStat User’s Manual
137
RAT( "ab", "abzaba" ) returns 4.
RECCOUNT ()
Returns the number of cases in the table as a long integer.
RECNO ()
Returns the current physical record number as a long integer.
RIGHT (String, Length)
Returns the rightmost characters of the expression for the defined length.
RIGHT("xyzabc", 3) returns 'abc'.
SELECT ()
Returns the workarea number for the current work area as a long integer.
SPACE (Length)
Returns a string consisting entirely of spaces for the defined length.
STOD (String)
The inverse of DTOS(). STOD() converts a string formatted according to standard xBase storage
conventions (CCYYMMDD) to an xBase Date formatted according to the Windows settings.
STR (Number, Length, Decimals)
Converts a number into a right-justified string with decimal digits following the decimal point. The total
length of the string is defined by the length parameter. STR(RECNO(), 5, 0) is a common indexing
element that ensures creation of unique keys if appended to another field element.
An index key using this expression could be built with NAME + STR(RECNO(),5,0)
If the decimals parameter is omitted, the function defaults to zero decimal places. If the length parameter
is omitted as well, the length of the result is the length of the field.
STRZERO (Number, Length, Decimals)
Converts a number into a, zero-padded right justified string with decimals digits following the decimal
point. The total length of the string is defined by the length parameter.
STRZERO( 1234, 10, 2 ) returns '0001234.00'
138
WordStat User’s Manual
If the decimals parameter is omitted, the function defaults to zero decimals. If the length parameter is
omitted as well, the length of the result is the length of the field.
SUBSTR (String, Start, Length)
Returns a portion of the string expression starting at the defined start location for the defined length.
SUBSTR('xyzabcd', 3, 4) returns 'zabc'.
TIME ()
Returns the system time as a string in the form HH:MM:SS.
TRANSFORM (Expression, Picture)
Transform converts strings and numeric values into formatted character strings. The function transforms
the result of the first expression in accordance with the second picture string.
The picture string is made up of two parts. The first part is the Function string and it is optional for both
strings and numeric values (as long as the second Template string is present).
A character string transformation picture may consist of only a Function string or only a Template or both.
A numeric picture must contain a Template string; the Function string is optional.
A logical value must contain only a Template string with Template characters L or Y.
The Function string consists of a leading @ character followed by one or more formatting characters. If the
Function string is present, the @ character must be the first character in the picture string with its formatting
characters immediately following and it may not contain spaces.
If a Template string exists as well, it follows the Function string. A single space separates the Function
string and the Template string.
Function string characters allowed for numeric values are:
B left justify;
C display CR after positive numbers;
X display DR after negative numbers;
Z blank a zero value;
( enclose negative numbers in parentheses.
Function string characters allowed for strings are:
R inserts unassigned template characters;
! converts all alpha characters to upper case.
The @R Function requires a Template; the ! Function does not.
The Template string describes the format on a character by character basis. The Template string is made
up of special characters which have specific results and optional unassigned characters which either replace
characters or are inserted in the formatted string depending upon the absence or presence of the @R
Function string.
Template assigned characters are as follows:
A,N,X,(,# are place holders and are interchangeable;
WordStat User’s Manual
139
L displays logical values as T or F;
Y displays logical values as Y or N;
! converts the corresponding character to upper case;
, (comma) or a space (in Europe) in a numeric template separate the elements of a number;
. (period) or , (comma - in Europe) in a numeric template specify the decimal position;
* fills leading spaces with asterisks in a numeric template;
$ as the leading character in a numeric template results in a floating dollar sign being placed in
front of the formatted number.
Example: Where "phone" is a character field holding a phone number with no formatting characters.
'transform(phone, "@R (###) ###-####")' returns '(909) 699-6776'.
If the formatting characters were actually present in the field, the "@R" function would be omitted
For numeric fields,
'transform(123456.78, "$9,999,999.99")' returns ' $123,456.78'.
TRIM (String)
Removes trailing spaces from the string expression.
UPPER (String)
Converts the string expression into upper case. Character fields used in index expressions should
always be converted to upper case to insure correct collating sequence.
VAL (String)
Converts a string of numeric characters into its equivalent numeric value. The conversion stops at the
first non-numeric character encountered (or the end of the string).
VAL("123ABC") returns a value of 123.
YEAR (DateField)
Returns the year portion of an xBase date as an integer.
140
WordStat User’s Manual
Performing Analysis on Manually Entered Codes
QDA Miner qualitative data analysis software has been specifically designed to manually assign codes to text
segments while WordStat is generally used to perform automatic content analysis of textual data. However,
WordStat may also be used for manual coding of documents. When used in such a way, the program can assist
human coders in their efforts to develop coding rules and manually assign codes to text.
The most basic use of the module for manual coding is probably its possibility to extract manually entered codes
and perform frequency analysis on those codes as well as the possibility to examine relationships between those
codes and other associated characteristics, such as the sex of respondent or date of publication. For example,
one can compare codes assigned to different subgroups of subjects (male vs female, immigrant vs nonimmigrant, job position, etc.) or establish the existence of a trend relating the presence of those codes and a
numeric variable (age, education or income level, level of expertise, publication date, etc.). At least two methods
of coding may be used to achieve this:
Unique Keywords
Unique keywords or code name may be inserted anywhere in the text. Those keywords should preferably not
be an existing dictionary word. For example, it may consists of an abbreviation of one or several words, includes
special symbols (such as #, & ^, _ etc.) or numeric digits. The retrieval of those codes can then be achieved by
adding all those keywords to the inclusion list. If special symbols have been used, they should also appear in
the VALID CHARACTERS edit box.
Codes in square brackets
WordStat provides an option to process only the text found between square brackets (i.e. [ and ] ). Codes
corresponding to categories may be typed directly in the text and placed within square brackets. By disabling
all dictionaries and setting this option, the program simply ignores all text outside those brackets and performs
a frequency count of all words found inside square brackets. This method has several advantages over the other
method. First, there is no need to enter all existing codes in the inclusion dictionary since they will be processed
automatically. Misspelled keywords will always be extracted and may thus be easily identified and changed.
Also, the processing time and memory requirement can be much lower than the other approach since WordStat
won't keep a list of uncoded words and won't process any text found outside those brackets.
Beside the possibility to extract manually entered codes and perform frequency and comparison on those codes,
there are several other ways in which the program may be used to assist the work of human coders. Here are just
a few examples of possible uses:
•
During the exploratory phase of the analysis, word frequency and crosstabulation may be used to
identify differences between subgroups in word usages, differences that may have remained
unidentified.
•
The KWIC list may be used to locate and visualize text associated with specific codes either to validate
the coding or identify associated themes. The KWIC list may also be used to perform a systematic
search of words frequently found along with a specific code. The examination of all cases containing
those words may then help identify instances where the code should have been used.
WordStat User’s Manual
141
142
•
A dendrogram of keyword similarities or a crosstabulation of manually entered codes against all words
in a text may allow identification of specific words associated with codes and permit the development
of dictionaries. Such dictionaries may then be used either to insure a more systematic application and
verification of manually entered codes (by locating individuals who have used those words but didn't
received the associated code) or to develop and validate a dictionary that will later be used for
automatic content analysis.
•
Reliability of coding made by a single coder at different times or by several coders may also be
assessed using inter-rater agreement statistics. See Computing Inter-Rater Agreement Statistics (page
142) for more information on how to compute those statistics.
WordStat User’s Manual
Computing Inter-Rater Agreement Statistics
The reliability problem in manual coding
When coding of a text is performed automatically using dictionaries, the reliability of the coding is irrelevant
since the rules used for coding are explicit and are applied systematically on the entire corpus of texts. However,
when the coding is performed manually by human coders, individual differences in interpretation of codes
between human coders often occur no matter how explicit, unambiguous and precise the coding rules are. Even
a single coder is often unable to apply the same coding rules systematically across time. One way to insure the
reliability of the application of coding rules is to ask different raters to code the same content or to ask a single
coder to code the same content at different times. The comparison of codes is then used to identify differences
in interpretation, clarify ambiguous rules, identify ambiguity in the text, and ultimately quantify the final level
of agreement obtained by those raters.
Inter-rater agreement measures
WordStat provides eight different inter-rater agreement measures to assess the reliability in coding. The
assessment made by WordStat is based on the presence or absence of a specific code and is performed on each
code individually. WordStat cannot assess the reliability of multinomial coding. However, this type of
assessment can be achieved within SIMSTAT by storing those codes into numeric variables and using the
TABLES | INTER-RATER command.
The simplest measure of agreement for nominal level variables is the proportion of concordant coding out of
the total number of codings made. Unfortunately, this measure often yields spuriously high values because it
does not take into account chance agreements that occur from guessing. Several adjustment techniques have
been proposed in the literature to correct for the chance factor, three of which are available in the WordStat. The
following are the assumptions made by each of these correction techniques:
Free marginal adjustment assumes that all categories on a given scale have equal probability of being
observed. It assumes that coders decisions were not influenced by information about the distribution of the
codes. This coefficient is equivalent to the Bennett, Alpert and Goldstein's (1954) S coefficient, Jason and
Vegelius's (1979) C Coefficient, and Brennan and Prediger's (1981) kn Index (Zwick, 1988).
Scott's pi adjustment does not assume that all categories have equal probability of being observed, but does
assume that the distributions of the categories observed by the coders are equal.
Cohen's kappa adjustment also does not assume that all categories have equal probability of being
observed. Contrary to the pi measure, it does not assume that the distribution of the various categories is
equal for all coders. In the computation of the chance factor, Kappa takes into account the differential
tendencies or preferences of coders.
WordStat also offers three additional adjustments for ordinal level variables. These are similar to the previous
measures except that they also take into account the ordinal nature of the scales by weighting the various levels
of agreement. They apply the same tree model of chance agreement used in the previous measures for nominal
data.
WordStat User’s Manual
143
Free marginal adjustment for ordinal level variables also assumes that all categories on a given scale have
equal probability of being observed.
Krippendorf's R-bar adjustment is the ordinal extension of Scott's pi and assumes that the distributions
of the categories are equal for the two sets of ratings.
Krippendorf's r adjustment is the ordinal extension of Cohen's Kappa in that it adjusts for the differential
tendencies of the judges in the computation of the chance factor. The following table illustrates the
difference between those six inter-rater measures:
LEVEL OF MEASUREMENT
DISTRIBUTION ASSUMPTION
Nominal Level
Ordinal Level
Theoretical uniform distribution
Free marginal
Free marginal
Observed distribution of each rater
Cohen's Kappa
Krippendorf's r
Observed distribution of all raters
Scott's pi
Krippendorf's R-bar
WARNING: When the computation is based on keyword frequencies (rather than case occurrences) and when
codes can be used more than one time per case, it is usually recommended to use ordinal or interval level
agreement measures. Otherwise a difference in frequency for a specific code will be treated as a single
disagreement. For example, if for a single case a coder assigns a code twice and another coder uses this same
code three times, nominal level agreement measures will treat this difference as a single disagreement and will
ignore the fact that the both raters may be in agreement in two instances. As a result, the overall agreement level
will be underestimated. However, nominal level measures may still be used in those situations if the researcher
wishes to treat any difference in frequency as a disagreement.
How to compute inter-rater agreement statistics
In order to compute inter-rater agreement measures within WordStat, codes assigned by each coder should
be stored in different alphanumeric fields (character or memo fields). For example, in four different raters
are assessed, four text fields should be created, each one containing the codes of a single coder. Two
different methods can be used to achieve this. The text field where the content to be analysed is stored, may
be replicated as many times as there are raters. Coders are then asked to insert their codes directly in the text
field. The second method requires the creation of empty alphanumeric fields which will contain the codes
assigned by coders. Coders then read the content to be analyzed and write down all their codes in this empty
field.
144
WordStat User’s Manual
To compare the codes of different raters
In the SIMSTAT program, use the CHOOSE X1-Y command from the STATISTICS menu to assign all
fields containing codes of different coders to the list of dependent variables.
• Select the CONTENT ANALYSIS command from the STATISTICS menu.
• Set the various options in the DICTIONARIES page so that all codes are extracted from the text fields.
• Click on the CROSSTAB page.
• Set the WITH list box to <variables>. The AGREEMENT list box should appear.
• Set the TABULATE list box to either Keyword Frequency or Case Occurrence.
• Select the appropriate measure of agreement. (Tables based on keyword frequency should preferably
be assessed using ordinal or interval level inter-rater agreement measures while tables based on case
occurrence can be analyzed using either nominal or ordinal level measures).
To identify the source of disagreement
When codes are inserted directly in the original text, it becomes possible to verify the source of
disagreement by extracting the content in which those codes appear. To perform such a task:
• Click on the KEYWORD-IN-CONTEXT page.
• Set the LIST option to Included Keywords and set the keyword to the category you would like to
examine.
• Set the SORT BY option to Case Number.
You can then use the KWIC table to identify specific contents that were associated with a code by a specific
coder but not by other coders.
WordStat User’s Manual
145
Exporting Frequency Data
Case occurrence or keyword frequency for each included word or category may be appended to the existing data
file or written in a new data file for further processing.
The
button located at the top of the Frequencies page is used to access the following dialog:
SAVE KEYWORD COUNT - This option allows you to specify whether data obtained from a content
analysis should be saved into a data file. When selected, WordStat will create as many numeric fields as
included keywords and will store for each case in the original data file, the number of times a keyword
was found (keyword frequency) or a binary value indicating whether it appeared in this specific case (see
DATA TO SAVE option).
DESTINATION - This option allows you to choose whether the new variables should be appended to the
current data file or written into a new file. If this last option is selected, a dialog box will appear allowing
you to specify the name and location of the new file. When data are saved to a new data file, additional
fields are created to store the case number and the numerical values of each independent variable.
DATA TO SAVE - This option allows one to choose among four different kinds of data that may be saved:
• Keyword frequencies
• Case Occurrences (i.e., a dummy variable with 0 when absent or 1 when present)
• Percentage of words (i.e., the frequency of the keyword divided by the total number of words in the
case)
• TF*IDF (i.e., the keyword frequency weighted by inverse document frequency).
VARIABLE NAMES - This option lets you determine what method should be used by WordStat to create
new variable names. When set to KEYWORD, the program will attempt to use each keyword as the name
of a new variable. Illegal characters are automatically removed and long names are truncated to the first
10 characters. Duplicated variable names are distinguished by the substitution of numerical digits at the
146
WordStat User’s Manual
end of the name. When this option is set to PREFIX, variable names are created by adding successive
numeric values to a user-defined prefix. For example, if the edit box at the right of the prefix option is
set to "WORD_", the variable names will be WORD_1, WORD_2, WORD_3, etc. The order of creation
of the variables correspond to the sort order used in the FREQUENCIES page.
SAVE TOTAL NUMBER OF WORDS - This option appends a numeric variable named TOTWORDS that
contains the total number of words processed in each case.
WordStat User’s Manual
147
Exporting Categorization Models
A typical text categorization process may involve any one of the following steps:
•
•
•
•
User-defined text preprocessing
Automatic lemmatization
Exclusion of words and phrases
Categorization of words, word patterns, phrases and coding rules into content categories using a
categorization dictionary
Specific settings, such as the inclusion of special characters or numerical digits, may also need to be set in order
to collect relevant information.
In order to apply such a process to external documents, one should normally import the documents into a Simstat
data file or QDA Miner project file, run WordStat and replicate the exact same settings as those originally used.
An alternate solution is to export the categorization model to disk, which would include all the relevant
information and settings, and then use either the WordStat Document Classifier utility program or functions of
the Software Developer's Kit (release date Summer 2005) to retrieve the saved model and apply it to the new
documents.
To save a categorization model to disk:
• Set the various analysis options on the Dictionaries and Options pages necessary to reproduce the
required categorization process.
• Go to the Frequency page and click on the
button located at the top of the page.
• Select the Export Categorization Model command. A dialog box should appear asking you for a file
name.
• Enter the file name of the model you want to create and click Save.
By default, categorization model files are saved with a .wcat file extension in the \Models subfolder under the
program folder. NOTE: While the information in the exclusion list and categorization dictionary is all stored
in the categorization file, running a categorization model from outside WordStat may still require the availability
of some resource files such as language dictionaries or preprocessing libraries (EXE or DLL). This should not
cause an inconvenience when applying those models on the same computer as the one used to create the model,
since information about the original locations of those resource files is always stored within the model file.
However, when attempting to apply those categorization models on another computer, the calling application
may have some difficulty locating the needed resource files. Those files should to be stored either under paths
identical to those on the original computer, in the application folder or under specific subfolders. When an
attempt is made to apply a saved categorization or classification model for which some resource files are
missing, an error message will be displayed providing the list of all missing files, their original location and
alternate locations where they might be.
For information on how to apply the saved categorization model, please refer to the WordStat Document
Classifier section or to the WordStat Software Developer's kit.
148
WordStat User’s Manual
WordStat Document Classifier
The WordStat Document Classifier utility program is a stand-alone application that may be used to perform
content analysis and automatic text classification on a text pasted from the clipboard or stored in a file. It may
also be used to analyze a collection of documents stored in a Simstat or QDA Miner data file.
Performing a content analysis or a text classification on an existing document is quite simple and involves three
easy steps: 1) loading the document in the main editing window, 2) opening the classification or categorization
model previously saved on disk and 3) applying the model. Detailed results of the content analysis or
classification are displayed in tables at the bottom of the dialog box.
Analysing a single document
The document classifier supports several document file formats such as ASCII text files, HTML, Rich Text, MS
Word, WordPerfect and Acrobat PDF files.
Step #1 - Opening the document
• To load the document to be analyzed, select the OPEN command from the DOCUMENT menu or click
on the
button. An Open File dialog box will be displayed. In the File of Type list box, select the
format of the file you would like to read, locate the file, select it and click on the Open button.
• You may also type directly in the text-editing window or paste a text previously copied to the clipboard
by moving to the text editor and then selecting the PASTE command from the DOCUMENT windows
or by clicking on the
button.
Step #2 - Opening the model
• To open the categorization or the text classification model:, select the OPEN command from the MODEL
menu or click on the
button. Content analysis models are stored in files with a .wcat file extension,
while document classification models are stored in files with a .wclas file extension.
• Select the model you would like to use and click on the Open button.
Step #3 - Applying the model
• Select the APPLY command from the MODEL menu or click on the
button.
When a categorization dictionary is applied, a single frequency table is displayed at the bottom of the
page with the following statistics:
WordStat User’s Manual
149
FREQUENCY
Number of occurrences of the keyword.
% SHOWN
Percentage based on the total number of keywords displayed in the table.
% TOTAL
Percent based on the total number of words that have not been explicitly
excluded.
TF*IDF
Term frequency weighted by inverse document frequency. Such a weighting is
based on the assumption that the more often a term occurs in a document, the more
it is representative of its content, yet, the more documents the term occurs in, the
less discriminating it is. The inverse document frequency term used for weighing
items in the document classifier program is based on the observed frequency and
the number of documents in the original data file used when the model was
created.
When a classifier is used, a second table is shown allowing you to examine the classification decision
made by the classifier as well as the computed values associated with each class of the categorical
variable. When the k-Nearest Neighbors algorithm is used for classification and the database containing
the training set can be located, a third table is shown, displaying the "k" most similar documents, their
ranking and their similarity scores.
Analyzing a collection of documents
The Document Classifier can perform content analysis and automatic text classification on a collection of
documents stored in a Simstat or QDA Miner data file. Categorization and classification results, as well as
scores per class, may then be stored back into the data file or exported to another file.
Step #1 - Opening the collection of documents
• Select the OPEN DATA FILE command from the DOCUMENT menu, or click on the
button. An
Open File dialog box will be displayed. Locate the data file containing the documents to analyze, select
it and click on the Open button.
The content of the data file is displayed in a table while the text to be categorized or classified is
displayed on its right.
Step #2 - Opening the model
• To open the categorization or the text classification model, select the OPEN command from the MODEL
menu, or click on the
button. Content analysis models are stored in files with a .wcat file extension,
while document classification models are stored in files with a .wclas file extension.
150
WordStat User’s Manual
• Select the model you would like to use and click on the Open button.
Step #3 - Applying the model
• Select the APPLY command from the MODEL menu, or click on the
button.
When a categorization dictionary is applied, a single frequency table is displayed at the bottom of the
screen with the number of occurrences of each keyword included in the model, as well as the total
number of words .
When a classifier is used, a second table is shown, allowing one to examine the classification decision
made by the classifier as well as the computed values associated with each class of the categorical
variable. This table is synchronized with the database shown at the top of the screen, so that moving from
one row to another - either in the database or this classification table - moves to the corresponding row
in the other table.
If the k-Nearest Neighbors algorithm is used for classification and the database containing the training
set can be located, a third table is shown, displaying the "k" most similar documents, their ranking and
their similarity scores.
To store in the opened data file both the predicted class or the computed score obtained for every class,
click on the
button. A dialog box similar to this one will appear:
• Enter the variable name that will contain the predicted class.
• To save the scores associated with each class and upon which the classification has been made, put a
check mark beside Save scores for all classes and enter a variable prefix (up to 7 characters). Variable
names are created by adding successive numeric values to this prefix. For example, if the edit box at the
right of the Variable Prefix option is set to "CLASS", the variable names will be CLASS1, CLASS2,
CLASS3, etc.
If any one of the specified variables does not exist, WordStat will create new ones and store the
numerical values associated with either the predicted class or the class scores. A confirmation dialog box
will ask to confirm the creation of those new variables, as well as to overwrite any existing variables.
WordStat User’s Manual
151
To export any table to disk:
• Click on the
button. A Save File dialog box will appear.
• In the Save as type list box, select the file format under which you would like to save the table. The
following formats are supported: ASCII file (*.TXT), Tab delimited file (*.TAB), Comma delimited file
(*.CSV), HTML file (*.HTM; *.HTML), Excel spreadsheet file (*.XLS).
• Type a valid file name with the proper file extension.
• Click on the Save button.
To print a table:
• Click on the
152
button.
WordStat User’s Manual
WordStat Software Developer’s Kit
The WordStat Software Developer's Kit (SDK) consists of a library of functions that may be called from
numerous programming languages, including some database programming environments, in order to use
WordStat categorization and classification technologies for tasks like:
• Automatic assignments of tags or index terms to documents.
• Classification of documents for automatic classification or routing.
• Identification of documents meeting specific content criterion.
A first version of this SDK, scheduled to be released during 2006, will be available as a command line program
or as a DLL for Windows applications. Other versions designed specifically for other platforms (Linux, .NET,
etc.) will be made available at a later date, depending on the number of requests. For more information on this
Software Developer's Kit, please contact [email protected]
WordStat User’s Manual
153
Performing Multivariate Analysis
One benefit of the integration of a content analysis module within an existing statistical program is the ability
to easily perform on numerical results of content analysis, various statistical analyses such as frequency,
crosstabulation, multiple regressions, reliability analysis, etc. Among the various multivariate analysis
techniques used in content analysis, cluster analysis, factor analysis, and, to a lesser degree, correspondence
analysis are often used to establish the relationship existing between different words or categories of words. The
table below illustrates some types analysis that may be performed with SIMSTAT and, if needed, the required
module to perform those analysis.
TYPE OF ANALYSIS
REQUIRED MODULE
Multiple regression analysis
n-way ANOVA/ANCOVA
Reliability analysis
Inter-rater agreement
Factor Analysis (with or without varimax rotation)
Principal Component Analysis (without rotation)
Correspondence analysis
Advanced cluster analysis
None
None
None
None
None
MVSP
MVSP
MVSP
First step - Saving numerical results into a data file
In order to perform a statistical analysis on categories or words, you first need to create new numeric variables
that will contain, for each case in the data file, the occurrence or frequency of specific words or categories. To
create those variables:
• Set the various options of the DICTIONARIES page.
• Perform the content analysis by clicking on the FREQUENCIES page.
• Click on the
button to access the Save Data dialog box.
• Activate the SAVE KEYWORD COUNT checkbox.
• Set the DESTINATION option to Append To Current File.
• Set the DATA TO SAVE list box to Keyword Frequency.
• Set the VARIABLE NAMES option to Keyword to instruct WordStat to use the names of the categories
(or included words) as the names for the new variables.
• Click on the OK button to proceed to the saving of those data and return to WordStat.
• Click on the OK button of the WordStat dialog to return to SIMSTAT.
154
WordStat User’s Manual
For more information on how to store numeric or textual results into the current data file or into a new data file
see Exporting Frequency Data (page 145).
Performing a Cluster Analysis of words or categories
• Select the CHOOSE X-Y command from the STATISTICS menu and assign all the newly created
variables to the list of independent or dependent variables. (The distinction between dependent and
independent variables is not relevant for this kind of analysis. However, all variables assigned to a single
category will be processed together.)
• Choose the OTHER | CLUSTER ANALYSIS command from the statistics menu to display the option
dialog.
• Set the various analysis options to one's preferences. (Please take note that in order to perform a cluster
analysis on keywords rather than on cases, the Transpose Data option should be left deactivated).
• Click on the OK button to perform the statistical analysis.
Performing a Factor Analysis of words or categories
• Select the CHOOSE X-Y command from the STATISTICS menu and assign all the newly created
variables to the list of independent or dependent variables. (The distinction between dependent and
independent variables is not relevant for this kind of analysis. However, all variables assigned to a single
category will be processed together.)
• Choose the OTHER | FACTOR ANALYSIS command from the statistics menu.
• Set the various options to one's preferences.
• Click on the OK button to perform the statistical analysis.
WordStat User’s Manual
155
References
Introduction to Content Analysis
ALEXA, M. (1997). Computer-assisted text analysis methodology in the social sciences. ZUMA:
Mannheim, Germany.
EVANS, W. (1996). Computer-supported content analysis: Trends, tools, and techniques. Social Science
Computer Review, 14 (3), 269-279.
KRIPPENDORFF, K. (1980). Content analysis: An Introduction to its methodology. Sage Publications:
Beverly Hills, California.
LEBART, L., SALEM, A. & BERRY, L. (1998). Exploring Textual Data. Kluwer Academic Publishers:
Dordrecht, Netherlands.
WEBER, R. P. (1990). Basic Content Analysis. Second Edition. Quantitative Applications in the Social
Sciences, vol 49. Sage Publications: Beverly Hills, California.
WEBER, R. P. (1983). Measurement models for content analysis. Quality and Quantity, 17 (2), 127-149.
WEBER, R. P. (1984): Computer-aided content analysis: A short primer. Qualitative Sociology, 7 (1-2),
126-147.
Interrater agreement statistics
BENNETT. E.M., ALPERT, R., & GOLDSTEIN, A.C. (1954). Communications through limited response
questioning. Public Opinion Quarterly, 19, 303-308.
BRENNAN, R.L., & PREDIGER, D. (1981). Coefficient kappa: Some uses, misuses, and alternatives. Educational
and Psychological Measurement, 41, 687-699.
COHEN, J. (1960). A coefficient of agreement for nominal scales. Educational and Psychological measurement, 20,
37-46.
JASON, S., & VEGELIUS, J. (1979). On generalizations of the G index and the phi coefficient to nominal scales.
Multivariate Behavioral Research, 14, 255-269.
KRIPPENDORFF, K. (1970). Bivariate agreement coefficients for reliability of data. In E.F. Borgatta and G.W.
Bohrnstedt (Eds.). Sociological methodology: 1970. San Francisco: Jossey-Bass.
SCOTT. W.A. (1955). Reliability of content analysis: The case of nominal scale coding. Public Opinion Quarterly,
19, 321-325.
ZWICK. R. (1988). Another look at interrater agreement. Psychological Bulletin, 103 (3), 374-378.
Others
GREENACRE, M. (1984). Theory and Applications of Correspondence Analysis. Academic Press. Orlando, Florida.
GREFENSTETTE, G. (1994). Corpus-Derived First, Second and Third-Order Word Affinities. In W. Martin,W. Meijs,
M. Moerland, E. ten Pas, P. van Sterkenburg, and P. Vossen, editors, Proceedings of EURALEX'94, Amsterdam,
The Netherlands.
SEBASTIANI, F. (1999). Machine Learning in Automated Text Categorization. ACM Computing Surveys,
34(1):1–47.
156
WordStat User’s Manual
Technical Support
If you have any comment or suggestion for further improvement please contact Provalis
Research:
By Phone: 514-899-1672
By FAX:
514-899-1750
By Email: [email protected]
Web site: http://www.provalisresearch.com
Mail:
Provalis Research
2414 Bennett Avenue
Montreal, QC
H1V 3S4
WordStat User’s Manual
157