1
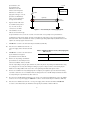
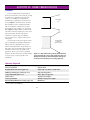
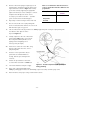
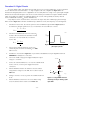
Analysis & Questions
Is the measured voltage across the collector of 2N3904 transistor in Figure 8.3 for the LED "on" and "off"
compare to what you expected? Why or why not?
With the LED "on" in Figure 8.3 calculate the "on" current using the measured data in this activity for Vce (sat)
and Vf.
Using the measured rise time from Table 8.1, calculate the 3 dB bandwidth for the circuit shown in Figure 8.3.
.35
f 3 dB =
τr
τr − rise time, 10 to 90%
f3
dB
− 3 dB bandwidth in Hz
How does the calculated bandwidth compare to the measured bandwidth?
Calculate the average current used by the LED driver in Figure 8.3, assuming it is being driven at a 50 percent
duty cycle.
Using the measured value for Vf , calculate the current through the LED in Figure 8.4.
Calculate the current through the 2N3904 in Figure 8.4 when it is on and the LED is off.
What is the average current though the circuit shown in Figure 8.4, assuming that it is being driven at a 50
percent duty cycle?
- 40 -