1
through 1998, although actual timeframes vary by predator (Table 1). Assumptions about
recruitment, mortality rates, and weight-at-age (Dobiesz 2003, Appendix B) are used to
project future year- and age-specific gross production.
Production estimates are divided by age-specific gross conversion efficiency
(GCE)estimates to compute year- and age-specific consumption. GCE estimates for each
predator population are based on bioenergetics models using Lake Huron specific data on
fish growth, diet, energy density, and water temperature (Dobiesz 2003, Appendix C).
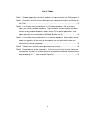
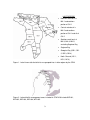
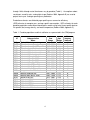
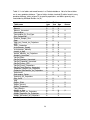
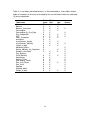
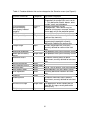
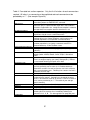
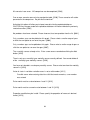
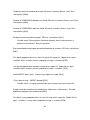
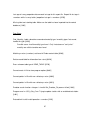
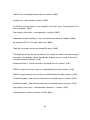
Table 1. Predator populations and their attributes as represented in the CPM program
ID
BUR
CHGB
CHNC
CHS
LATC
LATN
LATS
LGB1
LGB2
LGB3
LGB4
LNC1
LNC2
LNC3
LNSU
WAEB
WAES
WFH1
WFH2
WFH3
WFH4
WFH5
WHSU
Subpopulation
Name
Burbot-Main basin
Chinook salmon-Georgian Bay
Chinook salmon-North Channel
Chinook salmon-Main basin
Lake trout-Main basin, central
Lake trout-Main basin, north
Lake trout-Main basin, south
Lake trout-Georgian Bay1
Lake trout-Georgian Bay2
Lake trout-Georgian Bay3
Lake trout-Georgian Bay4
Lake trout-North Channel1
Lake trout-North Channel2
Lake trout-North Channel3
Longnose sucker-Main basin
Walleye-Saginaw Bay
Walleye-Main basin, south
Whitefish-WFH01
Whitefish-WFH02
Whitefish-WFH03
Whitefish-WFH04
Whitefish-WFH05
White sucker-Main basin
Year
Range
1983 - 1998
1985 - 2001
1985 - 2001
1968 - 1998
1984 - 1998
1977 - 1998
1984 - 1998
1992 - 2001
1988 - 2001
1981 * 2001
1986 - 2001
1992 - 2001
1992 - 2001
1981 - 2001
0
1981 - 2003
1983 - 1998
1976 - 2001
1980 - 2001
1991 - 2001
1981 - 2001
1981 - 2001
0
4
Age
Range
1-15
1-6
1-6
0-5
1-15
1-15
1-15
1-15
1-15
1-15
1-15
1-15
1-15
1-15
0
2-12
2-12
3-10
4-10
4-10
3-10
3-9
0
Sea
lamprey
induced
Y
N
N
N
Y
Y
Y
Y
Y
Y
Y
Y
Y
Y
N
N
N
Y
Y
Y
Y
Y
N