1
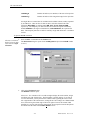
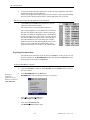
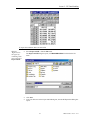
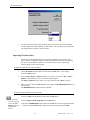
Lesson 5: ITC Data Handling
Lesson 5: ITC Data Handling
Every data plot in Origin has an associated worksheet. The worksheet contains the X, Y
and, if appropriate, the error bar values for the plot. A worksheet can contain values for
more than one data plot.
It is always possible to view the worksheet from which data were plotted. This lesson
shows you how to open the worksheet associated with a particular data plot, copy/paste
the data, export the data to an ASCII file, and import ASCII data.
Reading Worksheet Values from Plotted Data
Begin this lesson by opening the ITC Rnahhh.ITC data file series, as follows:
•
Shortcut: Select the
•
New Project button.
Select File : New : Project.
A new Origin project opens to display the RawITC plot window.
Click on the Read Data.. button.
The File Open dialog box opens, with the ITC Data (*.IT?) file name extension
selected.
•
If you have not previously Set Default Folder... to the samples folder, then navigate to
the C:\Origin70\samples folder.
•
Select Rnahhh from the file name list, and click OK.
As you saw in Lesson 1, Origin plots the Rnahhh data as a line graph in the RawITC
plot window, automatically creates a baseline, integrates the peaks, normalizes the
integration data, and plots the normalized data in the DeltaH plot window. As a result,
the following eight data sets are created:
rnahhh_dh
Experimental heat change resulting from injection i, in
μcal/injection (not displayed).
rnahhh_mt
Concentration of macromolecule in the cell before each
injection i, after correction for volume displacement (not
displayed).
rnahhh_xt
Concentration of injected solute in the cell before each
injection (not displayed).
rnahhh_injv
Volume of injectant added for the injection i.
rnahhh_ndh
Normalized heat change for injection i, in calories per mole of
injectant added (displayed in DeltaH window).
rnahhh_xmt
Molar ratio of ligand to macromolecule after injection i (X
value of data point).
rnahhhbase
Baseline for the injection data (displayed in red in the
RawITC window).
rnahhhraw_cp
All of the original injection data (displayed in black in the
RawITC window).
In addition origin creates two temporary data sets:
43
MAU130010 Rev F-4
ITC Tutorial Guide
rnahhhbegin
Contains the indices (row numbers) of the start of an injection.
rnahhhrange
Contains the indices of the integration range for the injections.
An Origin data set is named after its worksheet and worksheet column, usually separated
by an underscore. Thus the first six data sets above will all be found on the same
worksheet (RNAHHH), in columns named DH, INJV, Xt, Mt, XMt and NDH,
respectively. The temporary two data sets above are located on separate worksheets,
named rnahhhbase (an Origin created baseline) and RnahhhRAW (the experimental
data). The temporary data sets are indices created by Origin and do not have a worksheet
created.
To open the Rnahhh worksheet
Shortcut to worksheet:•
Right-click on the data
trace and select Open
Worksheet.
•
Select the Plot... command from the Format menu.
The Plot Details dialog box opens for the rnahhh_ndh data plot (if the DeltaH window
is active).
Click on the Worksheet button.
The Rnahhh worksheet opens.
Please note: If a worksheet cell is not wide enough to display the entire number, Origin
will fill the cell with ###### signs. The full number is used by Origin. If you wish to
view the full number you may increase the column width, by placing the cursor on the
left or right border of the column name, waiting till the cursor changes to a double headed
arrow, then moving the column edge to the left or right to increase the column width.
Alternatively you may right-click the column name select properties from the drop-down
list and increase the value in the Column Width text box.
44
MAU130010 Rev F-4
Lesson 5: ITC Data Handling
Copy and Paste Worksheet Data
Data can be copied from a worksheet to the clipboard, then pasted from the clipboard into
another Origin worksheet, a plot window, or another Windows application. To copy and
paste worksheet data:
Select a range of worksheet values
•
Select the initial cell, row, or column in the range.
To select a cell, click on the cell. To select an entire row, click on the row number. To
select an entire column, click on the column heading.
•
To select a contiguous portion of worksheet values, click on the first cell, row or column,
keep the mouse button depressed, drag to the final cell, row, or column that you want to
include in the selection range, then release the mouse button. The entire selection range
will now be highlighted. (Note: If you ever wish to select a range of cells where the
initial cell but not the final cell is in view, then click on the first cell and scroll to the final
cell, press and hold the shift key then click the final cell.
Copy the selected values to the clipboard
•
Choose Copy from the Edit menu, alternatively you may click the right mouse button
inside the highlighted text and select Copy from the menu.
The selected values are copied to Windows clipboard.
Select a destination for the copied values
Shortcut:
To open a new
worksheet click on
the New
Worksheet button
from the Standard
toolbar.
•
To paste into a plot window, click on the plot window to make it active.
•
To paste into a worksheet, click on the worksheet (or select File:New:Worksheet to
open a new worksheet), then click to select a single cell. This cell will be in the upper
left corner of the destination range.
45
MAU130010 Rev F-4
ITC Tutorial Guide
•
To paste into another Windows application, switch to the target application, then follow
the pasting procedure for that application.
(Shortcut: If an application is already open you may switch to it by pressing and holding
down the Alt key then pressing the Tab key till the application's icon is selected.
Paste the copied values from the clipboard to the destination
•
Select Paste from the Edit menu, alternatively click the
right mouse button and select Paste.
The selected values are pasted from the clipboard.
Note: It may happen that your worksheet does not show the
data, but only displays pound signs, as shown on the right.
The data is available for manipulations but is not displayed
because the column is not wide enough. You may increase
the column width by moving the cursor to the right edge of
the column header (the cursor will change into a double
headed arrow) then clicking and dragging the cursor to the
right or you may right click the column heading, select
properties, then increase the number for the column width.
Exporting Worksheet Data
The contents of any worksheet can be saved into an ASCII file. In this section you will
open the worksheet for the RnahhhBASE baseline data plotted in the RawITC window,
and export the X and Y data to an ASCII file.
To open the Rnahhhbase worksheet
•
•
Shortcut to
worksheet:
Right-click on the
data trace and select
Open Worksheet.
Click on the RawITC window (or choose RawITC from the Window menu) to make it
the active window.
Select RnahhhBASE from the Data menu.
RnahhhBASE becomes checkmarked to show it is selected.
•
Select Plot... from the Format menu.
The Plot Details dialog box opens.
•
Click on the Worksheet button.
The RnahhhBASE worksheet opens.
46
MAU130010 Rev F-4
Lesson 5: ITC Data Handling
To export the worksheet data as an ASCII file
Shortcut:
Right-click on
the upper left
containing whitespace then select
Export ASCII.
•
Select Export ASCII... from the File menu.
The Export ASCII dialog box opens, with RnahhhBASE.DAT selected as the file
name.
•
•
Click Save.
After you click Save in the Export ASCII dialog box, the ASCIII Export Into dialog box
opens.
47
MAU130010 Rev F-4
ITC Tutorial Guide
•
You may format the output of this ASCII file (Please refer to the Origin User's Manual
for more information about Exporting worksheet data). This file may then be opened into
any application that recognizes ASCII text files.
Importing Worksheet Data
ASCII files can be imported directly into an Origin worksheet or plot window. The
basic worksheet Origin menu supports a number of additional file formats for importing
data (Lotus, Excel, dBASE, LabTech, etc.) while the menus for ITC or DSC Data
Analysis support routine ASCII import.
To import an ASCII file into a new worksheet
•
Choose Worksheet from the New sub-menu under the File menu. A new Origin
worksheet, Data1, opens.
•
Select the File : Import : ASCII command. (If you like, you can select File : ASCII :
Options. This will allow you to set ASCII file import options.)
The Import ASCII dialog box opens, set to open a data file with a .DAT extension.
•
Double-click on a file in the File Name list (for example, the RnahhhBASE.DAT file you
just exported).
The RnahhhBASE data imports into the worksheet.
To import an ASCII data file into a plot window
• Choose Graph from the New sub-menu under the File menu.
Shortcut:
To create a graph,
click on the New
Graph button from
the Standard
toolbar
• Choose Import ASCII: Single File from the File menu.
• Select the rnahhhBASE.dat ASCII file from the Files list. Enter the appropriate Initial
X Value (0 for RnahhhBASE.dat) and Increment in X (28.25287) and click OK.
48
MAU130010 Rev F-4