1
SKF Online Motor Analysis System
NetEP/iNetEP
User Manual Part No. 71-055-EN
User Manual
Please read and thoroughly understand the contents of this entire guide before performing any
installation of this product. Failure to follow the instructions and safety precautions in this manual
can result in serious injury, damage to the product, damage to other equipment, or a malfunctioning
system. Keep this guide in a safe and ready location for future reference.
Copyright © 2012 by Baker Instrument Company, an SKF Group Company
All rights reserved.
4812 McMurry Ave., Suite 100, Fort Collins, CO 80525 USA
Telephone: (970) 282-1200, Fax: (970) 282-1010
Customer Service: 1-800-752-8272
12/3/20131 | 71-055 EN
NetEP User Manual
User Manual
SKF Online Motor Analysis System – NetEP
Baker Instrument Company, an SKF Group Company
SKF Condition Monitoring Center – Fort Collins
4812 McMurry Ave., Suite 100
Fort Collins, CO 80525
(970) 282-1200
(970) 282-1010 (FAX)
800-752-8272 (USA Only)
Note: This equipment has been tested and found to comply with the limits for a Class A digital
device, pursuant to Part 15 of the FCC rules. These limits are designed to provide reasonable
protection against harmful interference when the equipment is operated in its installation. This
equipment generates, uses and radiates radio-frequency energy and, if not installed and used in
accordance with the product manual, may cause harmful interference to radio communications. If
this equipment does cause harmful interference, the user will be required to correct the
interference.
Due to the phenomena being observed and the material properties being measured, this equipment
does radiate radio frequency energy while in the active test mode. Care should be taken to insure
this radio frequency energy causes no harm to individuals or other nearby equipment.
Information furnished in this manual is believed to be accurate and reliable. However, Baker/SKF,
assumes no responsibility for the use of such information or for any infringements of patents or
other rights of third parties that may result from its use. No license is granted by implication or
otherwise under any patent rights of Baker/SKF.
Warning:
Baker/SKF, assumes no liability for damages consequent to the use of this product. No part of this
document may be reproduced in part or in full by any means such as photocopying, photographs,
electronic recording, videotaping, facsimile, etc., without written permission from Baker/SKF, Fort
Collins, Colorado.
Intended use of instrument
The NetEP is intended for the monitoring of electric motors and machines for the purpose of
detecting and reporting early indications of motor and machine faults. It is not intended to be a
control nor safety system.
12/3/20131 | 71-055 EN
NetEP User Manual
License agreement, warranties
Note on Software
While the NetEP is a Microsoft Windows® based instrument, it is specially configured and
optimized to perform the functions for which it was designed. The loading or operation of
unauthorized software may cause the instrument to malfunction or cease functioning and may
void the manufacturer’s warranty.
Software License Agreement
NetEP - test equipment and desktop versions.
Carefully read the following terms and conditions before opening the software envelope or
operating the NetEP. Either opening the envelope or using the software constitutes your
acceptance of these terms and conditions on behalf of any party using the instrument (the “User”).
If you or the User do not agree with these terms, promptly return the instrument with the envelope
unopened for a full refund.
1. Definitions
(a) Computer Software: A Software program provided with the Instrument on CD or other physical
medium for installation and use on the User’s desktop computer(s) or servers, and all updates,
upgrades, enhancements and modifications provided directly or indirectly to the User from time to
time.
(b) Documentation: This User’s Manual and other manuals and documentation relating to the
Instrument and provided directly or indirectly to the User in the original Instrument carton or from
time to time thereafter.
(c) Instrument: The unit of test equipment with which this User’s Manual was provided to the
User.
(d) Instrument Software: The software program pre-loaded on the Instrument, and all updates,
upgrades, enhancements and modifications provided directly or indirectly to the User from time to
time.
(e) Software: The Instrument Software and/or Computer Software, as the context requires.
(f) Intellectual Property Rights: All rights arising or protectable under the copyright, trademark,
patent, or trade secrets laws of the United States or any other nation, including all rights associated
with the protection of computer programs and/or source code.
(g) Person: An individual, a partnership, a company, a corporation, an association, a joint stock
company, a trust, a joint venture, an unincorporated organization, or a governmental entity (or any
department, agency, or political subdivision thereof).
2. License; Related Terms.
(a) Grant of License. Baker/SKF grants the User, pursuant to the terms and conditions of this
Software License, a non-exclusive, non-transferable, and revocable license to (i) use the Instrument
Software only on the Instrument, (ii) the Computer Software(s) on the numbers and types of
desktop and/or other computers specified elsewhere in this User’s Manual, (iii) reproduce the
Software only as necessary to use it and create no more than two copies of the Software in
machine readable form for back-up purpose only; provided in each case that the copy shall include
Baker/SKF's copyright and any other proprietary notices, and (iv) utilize the Documentation only in
conjunction with the use of the Software.
(b) Restrictions on Use. The User shall not (i) permit any parent, subsidiaries, affiliated entities or
third parties to use the Software; (ii) grant third parties use of the Software on a service bureau,
application service provider or other similar basis; (iii) rent, resell, lease, timeshare or lend the
Software to any Person; (iv) sublicense, assign, or transfer the Software or this license for the
Software to any third party, (v) reproduce the Software other than as expressly authorized herein,
or distribute, or publicly display the Software; (vi) make the Software accessible to any Person by
any means, including posting on a web site or through other distribution mechanisms over the
Internet; (vii) reverse assemble, disassemble, reverse engineer, reverse compile, decompile, or
otherwise translate the Software or prepare Derivative Works based on the Software; (viii) place,
reproduce, or make available the Software on the User’s computer network if the User is only
authorized by this Software License to operate the Software on a single workstation; (ix) exceed at
12/3/20131 | 71-055 EN
NetEP User Manual
License agreement, warranties
any given point in time the total number of network clients authorized by the applicable purchase
order or ordering document to use or access the Software; or (x) edit or modify the Software except
as expressly authorized by Baker/SKF, including altering, deleting, or obscuring any proprietary
rights notices embedded in or affixed to the Software.
(c) Protection of Software. The User will take action by instruction, written agreement, or otherwise
as appropriate with any person permitted access to the Software to enable the User to comply with
its obligations hereunder.
(d) Material Terms and Conditions. The User acknowledges that each of the terms and conditions of
this Section 2 is material and that failure of the User to comply with these terms and conditions
shall constitute sufficient cause for Baker/SKF to terminate this Software License and the license
granted hereunder immediately and without an opportunity to cure. This subsection 2(d) shall not
be construed to preclude, or in any way effect, a finding of materiality with respect to any other
provision of this Software License.
3. Ownership. Baker/SKF, as between Baker/SKF and the User, owns all Intellectual Property
Rights related to the Software, including custom modifications to the Software, whether made by
Baker/SKF or any third party. The User agrees that this Software License effects a license, not a
sale, of the Software and that the first sale doctrine, as codified in 17 U.S.C. § 109, does not apply
to the transaction effected by this Software License.
4. Confidential Information. The Software contains proprietary information, including trade
secrets, know-how and confidential information (hereinafter referred to collectively as the
“Confidential Information”), that is the exclusive property of Baker/SKF. During the period this
Software License is in effect and at all times after its termination, the User and its employees and
agents shall maintain the confidentiality of the Confidential Information and shall not sell, license,
publish, display, distribute, disclose or otherwise make available the Confidential Information to any
Person nor use the Confidential Information except as authorized by this Software License. The
User shall not disclose the Confidential Information concerning the Software, including any flow
charts, logic diagrams, user manuals and screens, to persons not an employee of the User without
the prior written consent of Baker/SKF.
5. Limited Warranties; Disclaimer
(a) Baker/SKF’s sole and exclusive warranties with respect to the Instrument and Software are set
forth in this User’s Manual.
(b) EXCEPT AS SET FORTH IN THIS USER’S MANUAL AND TO THE EXTENT PERMITTED BY
APPLICABLE LAW, ALL EXPRESS AND/OR IMPLIED WARRANTIES OR CONDITIONS, INCLUDING
BUT NOT LIMITED TO IMPLIED WARRANTIES OR CONDITIONS OF MERCHANTABILITY,
MERCHANTABILITY OF A COMPUTER PROGRAM, INFORMATIONAL CONTENT, SYSTEM
INTEGRATION, FITNESS FOR A PARTICULAR PURPOSE, AND NON-INFRINGEMENT, ARE HEREBY
DISCLAIMED AND EXCLUDED BY BAKER/SKF.
6. Limitations on Liability
(a) Limitations and Exclusions. IN NO EVENT WILL BAKER/SKF BE LIABLE TO LICENSEE FOR ANY
DIRECT, INDIRECT, INCIDENTAL, CONSEQUENTIAL, PUNITIVE OR OTHER SPECIAL DAMAGES,
LOST PROFITS, OR LOSS OF INFORMATION SUFFERED BY LICENSEE ARISING OUT OF OR
RELATED TO THE INSTRUMENT OR THE USE OF THE INSTRUMENT, FOR ALL CAUSES OF
ACTION OF ANY KIND (INCLUDING TORT, CONTRACT, NEGLIGENCE, STRICT LIABILITY, BREACH
OF WARRANTY OR CONDITION, AND STATUTORY) EVEN IF BAKER/SKF HAS BEEN ADVISED OF
THE POSSIBILITY OF SUCH DAMAGES. THE PRECEDING EXCLUSION AND DISCLAIMER OF
DAMAGES SHALL APPLY TO ALL CLAIMS MADE BY LICENSEE RELATED TO OR ARISING OUT OF
LICENSEE’S USE OF THE SOFTWARE, INCLUDING, BUT NOT LIMITED TO, CLAIMS ALLEGING
THAT THE SOFTWARE, OR ANY COMPONENT THEREOF, FAILED OF ITS ESSENTIAL PURPOSE OR
FAILED IN SOME OTHER RESPECT.
(b) Acknowledgment. The User agrees that the limitations of liability and disclaimers of warranty
set forth in this Software License will apply regardless of whether Baker/SKF has tendered delivery
12/3/20131 | 71-055 EN
NetEP User Manual
License agreement, warranties
of the Software or the User has accepted the Software. The User acknowledges that Baker/SKF has
set its prices and granted the licenses contemplated herein in reliance on the disclaimers of
warranty and the limitations and exclusions of liability set forth in this Software License, and that
the same form an essential basis of the bargain between the Parties.
7. Term and Termination
(a) Term. The licenses granted herein shall commence on the User’s acceptance of the terms of
this Software License, and shall continue in existence until it is terminated in accordance with
Section 7(b) below.
(b) Termination. Baker/SKF may terminate this Software License and the license conveyed
hereunder in the event that the User breaches any provision, term, condition, or limitation set forth
in this Software License, including but not limited to the license restrictions set forth in Section 2(b)
of this Software License.
(c) Effect of Termination. Within ten (10) days after termination of this Software License and the
licenses granted hereunder, the User shall return to Baker/SKF, at the User's expense, the
Computer Software and all copies thereof, and deliver to Baker/SKF a certification, in a writing
signed by an officer of the User, that all copies of the Computer Software have been returned to
Baker/SKF and that the User has complied with the requirements of this Section 7(c).
8. Assignment. The User may assign this Software License in connection with the sale or other
transfer of the Instrument, provided, that the transferee agrees in writing to be bound by the terms
of this Software License. Except as authorized by the preceding sentence, the User shall not assign
or otherwise transfer the Software or this Software License to anyone, including any parent,
subsidiaries, affiliated entities or third Parties, or as part of the sale of any portion of its business, or
pursuant to any merger, consolidation or reorganization, without Baker/SKF's prior written consent.
Any assignment or transfer effected in violation of this Section 8 shall be void ab initio and of no
force or effect.
9. General. The validity and interpretation of this Software License shall be governed by Colorado
Law except as to copyright and other proprietary matters, which may be preempted by United
States laws and international treaties. In the event of any violation of this Software License,
Baker/SKF reserves the right to pursue any state law remedies (including contractual remedies) or
remedies under federal laws or both. The User consents to exclusive jurisdiction in either state or
federal courts in Colorado or both as appropriate and agrees that the prevailing party shall be
entitled to its attorney fees and costs. No decision, act or inaction of Baker/SKF, shall be construed
to be a waiver of any right or remedy, and pursuit of any state or federal causes shall not be
deemed an election or remedies. In the event of any provision of this Software License shall be
deemed unenforceable, or void, or invalid, such provision shall be modified so as to make it valid
and enforceable and as so modified the entire agreement shall remain in full force and effect. This
Software License sets forth the entire understanding and agreement between the parties and no
written or oral representative of any kind whatsoever shall in any way modify or expand the terms
of this User’s Manual.
In the event of any conflict or inconsistency between the terms of this Software License and any
Documentation, this agreement shall preempt such documentation to the extent inconsistent.
WARNING: All material associated with this Software License is copyrighted material.
Federal law provides severe civil and criminal penalties for the unauthorized reproduction,
distribution, or use of copyrighted materials (Title 17, United States Code). The Federal Bureau of
Investigation investigates allegation of criminal infringement for enforcement. Should you have any
questions concerning this User’s Manual, you may contact Baker/SKF, at 4812 McMurry Avenue,
Suite 100, Fort Collins, Colorado 80525. Telephone 970-282-1200; Fax 970-282-1010,
www.bakerinst.com.
12/3/20131 | 71-055 EN
NetEP User Manual
License agreement, warranties
Important notice concerning warranty and repairs
The warranty is void if (i) the NetEP is damaged by improper use, (ii) any party other than
Baker/SKF modifies the Software or loads or operates unauthorized software programs on the
NetEP, or (i11) the User has breached the Software License set forth above. The User assumes all
responsibility and expense for removal, reinstallation, freight, or on-site service charges in
connection with the foregoing remedies.
Baker/SKF’s liability to purchaser relating to the product whether in contract or in part arising out of
warranties, representations, instructions, installations, or defects from any cause, shall be limited
exclusively to correcting the product and under the conditions as aforesaid.
If the NetEP fails, whether it is under warranty or not, call the Baker/SKF service department before
returning the unit for repair. If the unit needs in-house repair, our service staff might direct you to
ship the unit to the authorized service center closest to you. This might save both time and money.
When calling the Baker service department or one of the service centers, please have the model
and serial numbers available. These numbers are located on the rear of the instrument. If the unit
is out of warranty, a purchase order will be required if the unit is returned for repair.
Service department number: (970) 282-1200 or toll free at (800) 752-8272.
Warranties; Disclaimers
Limited Warranty as to Baker/SKF Brand Products. Baker/SKF warrants that Baker/SKF brand
Products, if any, that are sold under the Agreement shall be of the kind and quality described in
Baker/SKF’s acknowledgment of Buyer’s Order, and shall be free of material defects in
workmanship and material for a period from the date of shipment equal to (i) twelve (12) months in
the case of new Products (including factory-installed circuit boards), (ii) six (6) months in the case of
used or refurbished Products, and new circuit boards delivered separately, (iii) a period of ninety
(90) days from the date of shipment in the case of used or refurbished circuit boards. If any such
Product is not as warranted, Buyer must notify Baker/SKF thereof in writing within the applicable
warranty period. Baker/SKF’s sole obligation, and Buyer’s sole remedy, shall be (at Baker/SKF’s sole
option) to adjust or repair or replace of the applicable Product or the affected part of the Product.
Limited Warranty as to Services. Baker/SKF warrants for a period of ninety (90) days following
completion that the services Baker/SKF provides to Buyer will be of workmanlike quality and will be
performed in a workmanlike manner.
No Other Warranty. EXCEPT AS EXPRESSLY PROVIDED BY THIS SECTION 0, BAKER/SKF HAS
NOT MADE, AND DOES NOT INTEND TO MAKE ANY PROMISE, REPRESENTATION, GUARANTEE
OR WARRANTY, EITHER EXPRESS OR IMPLIED, OF ANY KIND WHATSOEVER WITH RESPECT TO
ANY PRODUCT, SERVICE OR REPAIR, INCLUDING AND BAKER/SKF HEREBY DISCLAIMS ANY AND
ALL OTHER WARRANTIES INCLUDING ANY EXPRESS OR IMPLIED WARRANTY OF (1)
MERCHANTABILITY, (2) FITNESS FOR A PARTICULAR PURPOSE (3) THE QUALITY OR CAPACITY,
OR WORKMANSHIP; (4) LATENT DEFECTS; (5) ANY PATENT INFRINGEMENT BY ANY PRODUCT
OR USE THEREOF; OR (6) THE COMPLIANCE OF ANY PRODUCT WITH ANY REQUIREMENTS OF
ANY LAW, RULE, REGULATION, SPECIFICATION, OR CONTRACT PERTAINING THERETO.
CONSISTENT WITH THE FOREGOING, IT IS UNDERSTOOD AND AGREED THAT BAKER/SKF DOES
NOT MAKE ANY PROMISE, REPRESENTATION, GUARANTEE OR WARRANTY, EXPRESS OR
IMPLIED, WITH RESPECT TO THE SUFFICIENCY OF THE SERVICES TO BE PROVIDED
HEREUNDER BY BAKER/SKF, INCLUDING ANY WARRANTY AGAINST THE EQUIPMENT BECOMING
DEFECTIVE OR INOPERABLE, OR THAT THE EQUIPMENT OR ANY OR ALL DEFICIENCIES, ERRORS,
DEFECTS OR NONCONFORMITIES THEREIN WILL BE CORRECTED BY BAKER/SKF.
WITHOUT LIMITING THE PROVISIONS OF SECTION 0, EXCEPT AS TO TITLE, BAKER/SKF MAKES
NO WARRANTIES EITHER EXPRESS OR IMPLIED (INCLUDING ANY WARRANTIES AS TO
MERCHANTABILITY, FITNESS FOR A PARTICULAR PURPOSE OR OTHERWISE) WITH RESPECT TO
12/3/20131 | 71-055 EN
NetEP User Manual
License agreement, warranties
ANY OTHER PRODUCTS AS MAY BE PROVIDED OR SOLD UNDER THE AGREEMENT BY
BAKER/SKF AND BUYER AGREES THAT IT SHALL BE LIMITED TO THE WARRANTIES OF THE
RESPECTIVE MANUFACTURERS OF SUCH PRODUCTS SOLD BY BAKER/SKF UNDER THE
AGREEMENT.
Sole Supplier of Service.
Buyer shall not carry out, or let any other party carry out, maintenance service, which, according to
this Agreement, shall be carried by Baker/SKF unless Baker/SKF gives its prior written consent to
such maintenance service. If Buyer fails to comply with this clause, Baker/SKF shall be relieved of all
further responsibility and liability for maintenance service or remedy promised, or required to be
provided by Baker/SKF under the Agreement.
Virus Alert
The NETEP contains computer software that is vulnerable to damage from computer viruses.
Before shipping, Baker/SKF scanned all data to ensure the NETEP is virus-free. Before inserting
any disks into the disk drive or connecting the NETEP to a computer network, scan all disks for
viruses.
Trademarks
All other trademarks, service marks or registered trademarks appearing in this manual are the
trademarks, service marks or registered trademarks of their respective owners.
12/3/20131 | 71-055 EN
NetEP User Manual
Table of Contents
Intended use of instrument.................................................................................................................... 2
Note on Software ................................................................................................................................ 3
Software License Agreement................................................................................................................. 3
1. Definitions ................................................................................................................................................ 3
Warranties; Disclaimers.......................................................................................................................... 6
Sole Supplier of Service.......................................................................................................................... 7
Virus Alert................................................................................................................................................. 7
Trademarks .............................................................................................................................................. 7
Preface.............................................................................................................................................................12
Important safety information...................................................................................................................12
General Safety Precautions..................................................................................................................12
Safety term definition ...........................................................................................................................12
Symbols/Labels on equipment ............................................................................................................12
Other Important Safety Warnings.......................................................................................................12
Operational safety warnings ................................................................................................................13
CE Declaration of conformity ...............................................................................................................13
Additional regulatory information .......................................................................................................13
1........................................................................................................................................................................14
System description.........................................................................................................................................14
System Description....................................................................................................................................14
Software overview.................................................................................................................................14
Network configuration ..........................................................................................................................16
2........................................................................................................................................................................17
Software Configuration .................................................................................................................................17
SKF Online Motor Analysis System - NetEP server installation .........................................................17
Installation procedure ...........................................................................................................................17
Suggested network topology....................................................................................................................18
Configure your Server ..........................................................................................................................18
Configure network settings for the NetEP device.............................................................................19
3........................................................................................................................................................................21
SKF Motor Condition Surveyor software interface....................................................................................21
Database setup ......................................................................................................................................21
Database Management.............................................................................................................................22
User Permissions...................................................................................................................................22
Software interface overview.....................................................................................................................24
Navigation pane.....................................................................................................................................25
Server tree .........................................................................................................................................25
Right Click Menu................................................................................................................................25
Motor status visual notification .......................................................................................................29
Motor information pane .......................................................................................................................29
Menu items.............................................................................................................................................29
View .........................................................................................................................................................30
Tools........................................................................................................................................................31
Window ...................................................................................................................................................31
Help .........................................................................................................................................................32
Location Tree .........................................................................................................................................32
Server Tree ............................................................................................................................................33
Graph Tools ............................................................................................................................................33
Chapter 4.........................................................................................................................................................35
Parameter definitions & uses in diagnosing machine faults....................................................................35
Parameter definitions ...........................................................................................................................35
Round Robin Measurements: ..........................................................................................................35
Components ...........................................................................................................................................39
Measurements available ..................................................................................................................39
Current....................................................................................................................................................40
12/3/20131 | 71-055 EN
NetEP User Manual
Table of Contents
Possible causes of high current:......................................................................................................40
Distortion ................................................................................................................................................41
Aggregate harmonics measurements are: ....................................................................................42
Machine data..........................................................................................................................................43
Power data .............................................................................................................................................44
Aggregate Power Measurements ...................................................................................................45
Power quality .........................................................................................................................................45
Voltage ....................................................................................................................................................48
Voltage, current and torque spectrum ...............................................................................................48
Cage rotor designs: ...........................................................................................................................49
Wound rotor designs: .......................................................................................................................49
Torque.....................................................................................................................................................50
5........................................................................................................................................................................56
Alarms..............................................................................................................................................................56
Alarms tab overview..................................................................................................................................56
Acknowledging alarms......................................................................................................................57
Alarm parameters .................................................................................................................................57
Use caution when setting Alarm Limit Values...................................................................................58
Enabling alarms .....................................................................................................................................59
Viewing alarm status ............................................................................................................................59
6........................................................................................................................................................................62
Dashboard.......................................................................................................................................................62
7........................................................................................................................................................................67
Voltage/Current..............................................................................................................................................67
Time waveform plots ............................................................................................................................67
Spectrum Plots ......................................................................................................................................69
Markers ...................................................................................................................................................70
8........................................................................................................................................................................74
Torque .............................................................................................................................................................74
Torque time waveform (torque vs time) ............................................................................................74
Torque Spectrum ..................................................................................................................................75
Markers ...................................................................................................................................................76
9........................................................................................................................................................................78
Trending ..........................................................................................................................................................78
Grid View.................................................................................................................................................78
Graph view..............................................................................................................................................79
Multiple Windows ..................................................................................................................................80
Appendix A ......................................................................................................................................................82
Installing MS SQL Server or MS SQL Express 2005, 2008 (reference only) ........................................82
Installing SQL Server or SQL Express 2005..........................................................................................82
Configuring SQL to allow remote connections ..................................................................................84
Restart Database Engine Server and SQL Service Browser ...........................................................85
Installing SQL Server or SQL Express 2005..........................................................................................85
Installing SQL Express 2008................................................................................................................85
Configuring SQL Sever to Allow Remote Connection (XP) ..............................................................88
Configuring Windows firewall to allow remote connection (Windows XP x 86) ...........................89
Appendix B ......................................................................................................................................................90
Technical specifications .................................................................................................................................90
Technical specifications and capabilities.................................................................................................90
NetEP technical specifications .............................................................................................................91
Environmental ...................................................................................................................................91
Standard Compliance .......................................................................................................................91
NetEP Device Computer...................................................................................................................91
External Interfaces ................................................................................................................................91
Ethernet Communication .................................................................................................................91
12/3/20131 | 71-055 EN
NetEP User Manual
Table of Contents
NetEP Device Data Storage .............................................................................................................91
Desktop Computer Requirements (Computer not provided by Baker/SKF) .............................91
Server Requirements (Computer not provided by Baker/SKF) ..................................................91
Voltage Bus Inputs ............................................................................................................................91
Current Transformer Inputs ............................................................................................................92
Analog Measurement .......................................................................................................................92
Calibration ..........................................................................................................................................92
Analysis...............................................................................................................................................92
Features..............................................................................................................................................93
Index ................................................................................................................................................................94
12/3/20131 | 71-055 EN
NetEP User Manual
Table of Contents
12/3/20131 | 71-055 EN
NetEP User Manual
Preface
Important safety information
General Safety Precautions
Note: The general safety information presented here is for both operating and service personnel.
Specific warnings and cautions will be found throughout this manual where they apply.
Note: If the equipment is used in any manner not specified by Baker Instrument Company, an SKF
Group Company, the safety protection provided by the equipment may be impaired.
Safety term definition
DANGER: Indicates a hazardous situation, which, if not avoided, will result in death or serious
injury.
WARNING: Indicates a hazardous situation, which, if not avoided, could result in death or serious
injury.
CAUTION: Indicates a hazardous situation, which, if not avoided, could result in minor or moderate
injury.
NOTICE: This signal word addresses practices that could result in property damage but not
personal injury.
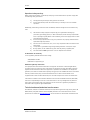
Symbols/Labels on equipment
Voltage level warning. 1000 V Maximum input
Other Important Safety Warnings
1)
Warning: Do not operate the instrument with front door open. When the
instrument door is open, the instrument is not water resistant and should not be
operated. Do not allow the opened instrument to be exposed to water. Water in
contact with the interior of the instrument compromises protection features and
could result in serious injury or death.
2)
Warning: Because of the voltages present, testing should be conducted only by
trained personnel, and adequate safety precautions must be followed to minimize
the risk of serious injury, death, or property damage.
3)
Warning: Because of the dangerous currents, voltages, and forces encountered
when operating, testing or repairing rotating equipment, safety precautions must be
taken for all tests. Follow all safety precautions in this manual and required by your
employer. Due to the wide diversity of machine applications, it is impossible to list all
general safety precautions. However, this manual includes special safety precautions
applicable to the use of the NetEP.
4)
NOTICE The maximum rating of the NetEP is 1000 V. Under no circumstances
connect the voltage sensing circuit to higher voltage levels. Doing so will cause
severe damage to instrument.
12/3/20131 | 71-055 EN
NetEP User Manual
Preface
Operational safety warnings
Baker Instrument Company, an SKF Group Company, recommends that the operator comply with
the following safety precautions:
1)
2)
Comply with all your facility’s safety practices at all times.
Ensure physical setup does not interfere with your facility’s current or intended
operation.
Additionally, these safety precautions must be followed, otherwise dangerous shock hazards may
exist:
1)
2)
3)
4)
5)
6)
Use whatever safety equipment required by your organization including eye
protection, high voltage gloves, arc-flash rated masks, hoods and any required PPC.
Prior to opening any MCC (Motor Control Cabinet), ensure that appropriate arc-flash
protection clothing is worn.
Ensure that appropriate lockout / tag-out procedures are properly understood and
implemented by all personnel.
Do not touch the connections, PT’s, CT’s or any component under test while a test is
being made.
This product is grounded through the grounding conductor of the power input.
During repairs, do not substitute any parts. Use only factory-supplied parts.
This instrument is NOT approved for use in an explosive environment.
CE Declaration of conformity
To be supplied by Intertek based on their testing
2004/108/EC for EMC
EN61326 for equipment type
Additional regulatory information
This equipment has been tested and found to comply with the limits for a Class A digital device,
pursuant to Part 15 of the FCC rules. These limits are designed to provide reasonable protection
against harmful interference when the equipment is operated in its installation. This equipment
generates, uses and can radiate radio frequency energy and, if not installed and used in accordance
with the product manual, may cause harmful interference to radio communications. If this
equipment does cause harmful interference, the user will be required to correct the interference.
Information furnished in this manual is believed to be accurate and reliable. However, Baker/SKF,
assumes no responsibility for the use of such information or for any infringements of patents or
other rights of third parties that may result from its use. No license is granted by implication or
otherwise under any patent rights of Baker/SKF.
Technical assistance/authorized service centers
Should either software or hardware assistance be required during the warranty period, please call
Baker/SKF at (970) 282-1200 or toll free at (800) 752-8272. For authorized service centers
please visit our website at www.bakerinst.com. Service centers are marked with a double asterisk.
12/3/20131 | 71-055 EN
NetEP User Manual
1
System description
System Description
The SKF Online Motor Analysis System NetEP is an Ethernet connected electric motor monitoring
system. It is a permanently mounted system, capable of monitoring up to 32 motors on seven
different voltage busses. The system gathers data from the voltages and currents flowing to the
motor. This data is used to determine key performance levels as well as to generate spectral
measurements. Several alarms levels can be set to identify measurements that are out of range
and alert the user.
Being a network connected system, the measurements, alarms and configuration can be viewed
using the provided desktop software from any computer connected to the network. Authorized
users can also modify the monitoring configuration from the desktop software. The NetEP runs
continuously, thus motors can be monitored 24 hours a day, 7 days a week.
The system provides an at a glance summary displays that show the overall status of all monitored
machines. This is provided even across multiple NetEP’s at multiple locations, making remote
monitoring of all motors from any location possible.
A central data server, running Microsoft SQL Server or Microsoft SQL Express, collects data from
the unit. The server software also runs on the central data server, and is capable of collecting data
from multiple NetEP’s. This allows data viewing from multiple motors, factories, NetEP’s at one
time through the desktop software.
Hardware overview
The system connects to 3 measurement CT’s (current transformers) per motor. The CT’s should be
within 150 feet of the NetEP unit. CT signals are run on standard CAT V networking cable for easy
installation and cable routing. CT’s come in four current ratings, 5 A, 50 A, 200 A and 600 A. The
CT’s are available in either solid core or split core configurations. For best performance, actual
steady state motor currents should be between 10% and 90% of the CT current rating. CT
performance must be calibrated for accurate measurements. Using the optional NetEP calibration
kit, the CT’s can be calibrated at the installation site. CT calibration is also available as a service
from Baker/SKF.
The unit requires 110 V – 240 V 50/60 Hz power for its internal measurement circuitry and
NOTICE: Voltage Busses up to 1,000 V can be connected to the system. It is
strongly recommended that external safety disconnects be provided for each
voltage buss connected to the NetEP. To avoid potential hazards voltage busses
must be de-engergized before opening the NetEP door. The NetEP does not
have any internal disconnect mechanism for the Voltage Busses being measured.
computer. A standard wired LAN connection is also required.
Software overview
NOTICE
There are no user serviceable parts in the NetEP. The system includes a built
in self test capability.
If the built in self test fails, or there is a suspected hardware failure in the
system please contact Baker/SKF service
12/3/20131 | 71-055 EN
NetEP User Manual
The
NetEP
system consists of three software programs; the device software, the server software and the
desktop software (SKF Motor Analysis Surveyor).
12/3/20131 | 71-055 EN
NetEP User Manual
System description
The device software is the embedded software running on the computer in the system box. It is
responsible for the scheduling and acquisition of data from the hardware, and for communicating
that data to the server software via the wired LAN connection. The device software requires little or
no user input after the initial installation and configuration of the NetEP system. During
installation, the hardware calibration and verification of connections to the CT’s and Voltage Busses
are done using the device software. This requires that a monitor and keyboard be connected to the
NetEP device during installation.
To view data, alarms, trends and spectra, the SKF Motor Analysis Surveyor software is used. This
software runs on a Windows® based system, and a network connection is required. The Surveyor
software is the primary system interface. All motor, measurement and alarm limits are set here.
The Surveyor software contains several different views suitable for detailed configuration of the
unit as well as at a glance machine status. It also includes detailed data analysis displays. The
Surveyor software retrieves data from the server software to populate its displays and to perform
analysis.
The server software manages the communication and data storage for the NetEP’s connected to it.
The server software should run on a moderate to high performance Windows® workstation, with
good network connectivity, and preferably UPS power. Microsoft® SQL Server or SQL Express is
required for data storage by the server software. Like the device software, the desktop software
also accesses the server software. Some configuration is required through the server software
interface. The server hardware, software and database are also available as a service from
Baker/SKF.
The NetEP software configuration from the factory is such that the device software will
automatically find and connect to the server software, provided they are on the same subnet.
Surveyor software requires configuration with the IP address of the server software to allow
connection. The NetEP system administrator can assign different levels of capability (ie: view only,
edit etc) to each user of the system.
Network configuration
The system software program uses Standard Ethernet configurations and protocols.
Factory default networking settings (changeable by system administrator).
-
NetEP device software: TCP/IP protocol using port 1100, or UDP on port 1150.
IP Address DHCP.
NetEP server software: TCP/IP protocol using port 1100, or UDP on port 1150.
A static IP Address is recommended.
SKF Motor Analysis Surveyor: TCP/IP protocol using port 1100 or UDP on port
1150. IP Address DHCP.
Configuration of the three software programs is simplified if the Device, Server and Surveyor are on
the same subnet. If they are not, configuration of firewalls to allow connection and communication
between the software programs is required. Without this connectivity, software will not operate
correctly.
12/3/20131 | 71-055 EN
NetEP User Manual
2
Software Configuration
See Appendix A for reference material on installing MS SQL Server and MS SQL Express. In order
to set up the NetEP server installation, MS SQL Server or MS SQL Express must be operational on
the computer.
SKF Online Motor Analysis System - NetEP server installation
The NetEP server software provides for the storage of data from the NetEP. The NetEP server also
is the communication link between the desktop client and the NetEP. As such, the computer
running the NetEP software has the following requirements:
−
−
−
−
−
−
−
−
Greater than2 GHz Pentium, Core2 Duo or equivalent
Greater than2 GB RAM
Greater than 10 GB free disc space per NetEP connected
Windows XP, Vista, 7 or Server 2003
10/100 LAN connection
Microsoft SQL or SQL Express
Static IP Address
UPS recommended
The computer running the NetEP Server software must be continuously operational. If this
computer is off for more than 30 minutes, the NetEP device may run out of storage space and;
therefore, discard data. If this guaranteed operation is unfeasible, there is a NetEP Server Service
available from Baker/SKF that meets this requirement. This server service is greater than 99.9
percent availability. Also note, when the computer running the NetEP server software is
unavailable, the SKF Motor Condition Surveyor software will not be able to view NetEP device data,
nor be able to change any device settings.
The first step for the installation of the NetEP Server software is to install the database to be used.
This database can be either Microsoft SQL or Microsoft SQL Express. Knowledge of the path to the
database is required during the installation of the NetEP server software.
Installation procedure
1)
2)
3)
To install the NetEP server software, locate the NetEP server CD, and insert it
into the computer CD drive.
When prompted, provide the path to the storage database to be used to house
the motor data gathered by the NetEP.
Once the NetEP server software has loaded, if appropriate change the name of
the NetEP server, set the number of NetEP devices that can connect to this
server, and change the Port used to communicate with the NetEP Device.
12/3/20131 | 71-055 EN
NetEP User Manual
SKF Motor Condition Survey software interface
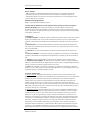
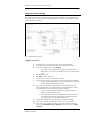
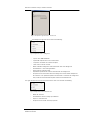
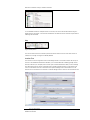
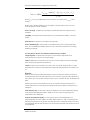
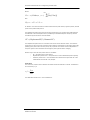
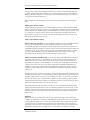
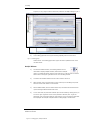
Suggested network topology
The graphic below shows the suggested network topology for the NetEP devices and NetEP Server,
the ports required for operation, and the expected data rates. Consult your organization’s IT group
to properly set up the network.
Fig 2-1: Network topology diagram
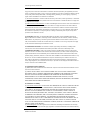
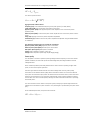
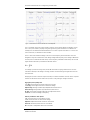
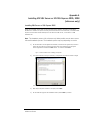
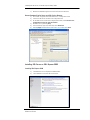
Configure your Server
1)
2)
3)
Go to Start->Run->Surveyor and Launch the Surveyor Application.
If the software is not activated it will ask you to activate your software.
Go to Tools->NetEP Server and click Settings.
i. This option is only available if you are logged on to Windows as an
Administrator, or for Vista/7 the software is being run in administrator
mode.
4)
Select the Servers tab.
5)
Click Add to create a new server.
6)
Give your server a name (or use the default name).
7)
Set the TCP port that your server will use to communicate with your NetEP(s).
i. This port must be unblocked (for TCP) on any firewalls or routers that
are in-between the NetEP and your server.
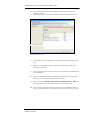
8)
If you want your NetEP(s) to automatically detect and configure their own
network settings place a check in Broadcase Connection Information, select a
port to broadcast on and a time interval to do the broadcast.
i. This port must be unblocked (for UDP) on any firewalls that are inbetween the NetEp and your server.
ii. This setting will only work if the NetEp(s) exist on the same subnet. If
your NetEp(s) are not on the same subnet you should uncheck this
box, and you will need to manually configure them.
9)
Configure the database server settings for your remote client (NetEp)
10) These are the settings the NetEp will use to connect to your database.
11) If your server require different setting to connect to the database configure
them in the Local Database Server Settings, otherwise leave it set to Same
as Remote.
12/3/20131 | 71-055 EN
NetEP User Manual
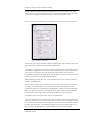
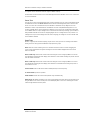
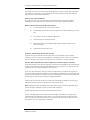
SKF Motor Condition Survey software interface
12) Click Browse and select the database that you would like this server to use.
Fig 2-2: Server setup
NetEP Device Software is factory installed on the instrument. No changes in the configuration are
required, except the entry of the NetEP Server IP address if the broadcast beacon is disabled and
the Server is on a different subnet than the NetEP Device. Upgrades and new revisions of NetEP
device software are included in the NetEP server software, and automatically install on the NetEP
device when the NetEP Server software is updated. Should the NetEP device become corrupted and
need reloading, please contact Baker/SKF for assistance.
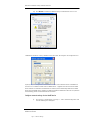
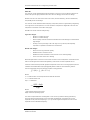
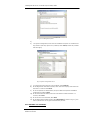
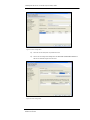
Configure network settings for the NetEP device
1)
Click on Start -> All Programs->Surveyor -> Tools-> NetEP Configuration Tool
and the following form will appear.
12/3/20131 | 71-055 EN
NetEP User Manual
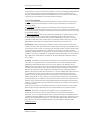
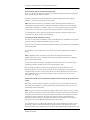
Fig 2-3: Server settings
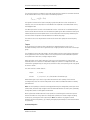
SKF Motor Condition Survey software interface
Fig 2-4: NetEP configuration tool
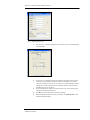
2)
Click on Tools -> Network Configuration menu item, the Server Settings dialog
will be displayed.
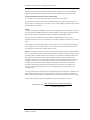
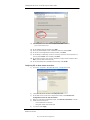
Fig 2-5: Server settings
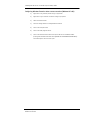
3)
4)
5)
6)
If the server is configured to broadcast connection information then check the
automatic server broadcast checkbox and fill in the broadcast Port with the
same port number from the server. If the server is not broadcasting connection
settings then uncheck automatic server broadcast checkbox, enter the Server
IP Address and port to connect to.
Accept the defaults for delays and connection time outs. These should only be
changed if having connection drops.
Click OK to save the information to the device settings.
When the NetEP Configuration Tool form appears, click Start Service to start
the Baker NetEP Scheduler.
12/3/20131 | 71-055 EN
NetEP User Manual
3
SKF Motor Condition Surveyor software interface
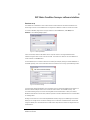
Database setup
The NetEP uses a database to store measurement results and other information needed for the
monitoring of motors. Each NetEP device is mapped to a database in which its results are saved.
To create a database, login to the Surveyor software. On the File menu, select New, then
Database. The following dialog appears.
Fig 3-1: Create Sql database
In the Server field, select the IP address of the computer which is running the NetEP Server
software using the down arrow in the Server field. Then enter the name for the new database to
create and click on the OK button.
If a new NetEP server connection needs to be created (for example, during the initial installation of
the NetEP system), click on the Create New Server Connection icon to bring up the following screen.
Fig 3-2: Connection settings
Type the Server Name (IP address) of the computer which is running the NetEP Server software in
the Server Name field (the search icon can also be used to search for available servers). We
recommend setting the port to 1433 and using SQL Server Authentication. Other ports and/or
Windows authentication can be used, however expertise in network administration is recommended
for utilizing these.
Clicking on the tools icon in the Create Sql Database window, brings up the following screen which
allows you to change server connection settings once a connection is established. We recommend
using the default ports and authentication modes unless experienced in network configuration and
administration.
12/3/20131 | 71-055 EN
NetEP User Manual
SKF Motor Condition Surveyor software interface
Fig 3-3: SQL Server connection settings
On this screen test the connection to the server by clicking the Test Connection button. This is
useful for verifying that the Server Name (address), port, Username and Password are correct.
Changing the port and authentication mode is discouraged unless you have experience in network
configuration.
Once a database is created, a NetEP device needs to be mapped to the database. This tells the
NetEP device which database to use to store its data. This is accomplished in the NetEP Surveyor
software by selecting the Server Tree tab and right clicking on the database icon, and choosing the
Map menu item. This will display all the NetEP devices connected to the server. Select the NetEP
device that you want to use as the data source for this database.
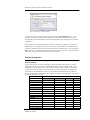
Database Management
User Permissions
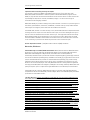
The Surveyor has four user roles for adding user permission levels of the software. In order to
assign these roles to various users, an initial NetEP database must be created by a SQL system
administrator account using Surveyor. The first time Surveyor creates a database user roles are
created. At this time user logins can be assigned specific roles through SQL Server Management
Studio. SQL Server Management Studio is a tool included with Microsoft SQL Server 2005 and
later for configuring and managing Microsoft SQL Server. Below is a table of the user roles and the
permissions assigned to each role.
User Role
Administrator
Analyst
User
Guest
Folders
Create
X
X
X
Edit
X
X
X
Delete
X
X
Voltage Buss
Create
X
X
X
Edit
X
X
X
Delete
X
X
Map/Un-map
X
X
Machines
Create
X
X
X
Edit
X
X
X
Delete
X
X
Map/Un-map
X
X
Alarms
12/3/20131 | 71-055 EN
NetEP User Manual
SKF Motor Condition Surveyor software interface
Edit Alarm Value
Enable Alarm
Disable Alarm
Acknowledge Alarm
View Data
Add/Edit/Delete
User
Create Database
X
X
X
X
X
X
X
X
X
X
X
X
X
X
Now that a connection with the NetEP server has been established, a database has been created,
and a NetEP Device has been mapped to the database, we can create and map the motors to be
monitored.
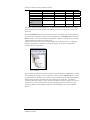
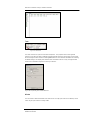
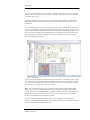
Select the Location Tree tab on the main Surveyor screen. This will allow motors to be organized
in a logical order using folders. Right click on the database icon in the Location Tree and select the
New menu item. The choices are: Folder or Voltage Buss. Folders are optional and can have other
folders beneath them. Folders are a useful way of
organizing the motors to be monitored. Beneath folders can be another folder or a Voltage Bus.
Beneath a Voltage Bus are the motors connected to that bus. An example of using folders to
organize motors is shown below.
Fig 3-4: Database
Once a voltage bus and motor have been created, they must be mapped to a NetEP Device channel
before monitoring can begin. To map a voltage bus or motor, select the Server Tree tab. This tab
is organized with the databases at the top of the tree, with NetEP devices mapped to the database,
Voltage busses mapped to the NetEP, and motors mapped to the voltage bus. The mapping
consists of selecting the voltage or motor channel of the NetEP to which the voltage bus or motor is
physically wired. For the example above, the following mapping options are shown when right
clicking the NetEP icon, selecting Map Voltage Bus and the Voltage Bus icon, selecting Map AC
Machine.
12/3/20131 | 71-055 EN
NetEP User Manual
SKF Motor Condition Surveyor software interface
Fig 3-5: Select voltage bus
Notice that in the drop down menu for the Voltage Bus Channel and the CT input Channel, only the
available channels are shown. That is, channels that are already in use are not shown. The
maximum number of channels available depends on the specific configuration of the NetEP
purchased.
If a mistake is made mapping voltage busses or motors, in the Server Tree view, right click the
voltage bus or motor that was mis-mapped, and select Unmap.
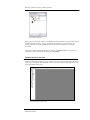
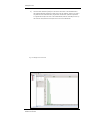
Software interface overview
Login to the SKF Motor Condition Surveyor software. The main screen includes menu items on top
of the screen, a Navigation pane to the left, a row of icons that change the view along the top and a
large machine information pane.
Fig 3-6: Opening Surveyor screen
12/3/20131 | 71-055 EN
NetEP User Manual
SKF Motor Condition Surveyor software interface
Navigation pane
The Navigation pane can be turned on or off by clicking on View and then Navigation Pane and it
will appear at the left side of the screen. The Navigation pane has two views available in it. The
location tree that lists all the motors for a specific location and the server tree, which shows the
connections of motors to NetEP’s and NetEP’s to databases. The Location Tree or Server Tree
views are selected using the tabs at the bottom of the Navigation pane.
Server tree
If the server tree needs to be viewed, click on View and then Server Tree and it will appear at the
bottom of the screen along side the Location Tree. This setting remains on until the screen is
toggled.
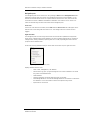
Right Click Menu
The Navigation pane has several right mouse-click menus that offer capabilities and properties
about motors, voltage busses and the database. This menu includes mapping and un-mapping of
voltage busses, closing a database, exporting data via a .xml file, expanding the motor tree and
properties of the selected motor.
On the root directory (database name) or Server level of the motor tree, the right-click menu
Fig 3-7: Right click menu - Server level
displays database activities such:
− New: Folder, Voltage Buss, or AC Machine
− Performance Log: pops up a grid showing time versus size of database. This tracks
the growth of the database data.
− Close Database
− Compact and Repair: Compress data and repair corrupt data.
− Acknowledge All Alarms: This will acknowledge all alarms on all motors connected to
this database. This is useful when an event has impacted many motors.
− Export data to .xml format.
12/3/20131 | 71-055 EN
NetEP User Manual
SKF Motor Condition Surveyor software interface
Fig 3-8: Properties right click menu – Server level
The voltage buss right click menu contains the following.
Fig 3-9: Right click menu – Voltage buss
−
−
−
−
−
−
−
−
−
Import: other MBD databases.
Expand All: expands motor tree to lowest level.
Properties: Set default for machine template.
New: create a new AC machine
Delete: will delete voltage buss and all machines under this voltage buss
Close Database – close existing database.
Export: data via .xml file format.
Expand All: expands all AC machines located within the voltage buss.
Properties: shows information about the voltage buss and the default template for
AC machines. If an updated template for AC machines is created at this voltage buss
level, it will override the default template created at the database level.
The right click menu for the AC machine level of the motor tree contains the following:
Fig 3-10: Right click menu AC Machine level
−
−
−
−
Delete: AC machine.
Close Database: Close currently open database.
Export: to .xml file format.
Properties: shows the AC machine properties.
12/3/20131 | 71-055 EN
NetEP User Manual
SKF Motor Condition Surveyor software interface
Fig 3-11: Properties AC Machine Level
The name plate information is used in several NetEP calculations, therefore, it is important that the
information entered is correct. For example, the NetEP calculates current level %, the name plate
current is defined to be 100%. The Off when Current Level < box defines the current, in Amps,
below which the NetEP assumes the motor is off and no longer collects or saves data for that motor
while it is off. When the current level to the motor rises above this level, the NetEP automatically
begins gathering data on the motor again.
The manufacturer information is saved for reference only and is not used in NetEP calculations.
On line testing has several parameters the NetEP uses for calculating motor performance. Do not
change the default values unless you are certain that the new values are correct.
The Machine parts tab is used to define the bearings used in the motor. Knowing the bearing
models allows the NetEP to calculate the bearing frequencies, and place markers in the spectra to
locate potential problems with bearing degradation. The name entered here will also be shown on
the spectrum marker selector to choose which frequencies on which to place markers.
Fig 3-12: Frequency – add machine parts
12/3/20131 | 71-055 EN
NetEP User Manual
SKF Motor Condition Surveyor software interface
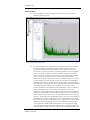
The Data Filter tab is where the data retention settings for the motor are entered. The default
settings are for a server with a 4GB data size limit. This results in an aggressive data filtering set
up. If you server database size is larger than 4 GB, the filter settings can be relaxed.
There are 3 levels of data filtering, Short Term, Medium Term and Long term. For each level of
Fig 3-13: Properties - Data filter
data filtering, a start time for that filter is defined in addition to the amount of data to retain of the
alarm data, the Time Waveform data, and the Round Robin data.
To help plan your data filtering strategy, some data sizes will be helpful. A time waveform result is
approximately 3.2MB each. A time waveform result is generated for each motor approximately
once per hour. A round robin result is generated every 10 seconds for each motor and is
approximately 2.6 KB each. By default, all alarm data is saved, so be sure that the alarm limits are
properly set and motors are not always generating alarms.
Before the Short Term filter start time – in the example above, 12 hours – all data of all types is
retained – nothing is deleted.
Once the Short Term filter start time has been passed, data older than this start time is filtered
according to the settings selected. In the example above, all data which generates an alarm,
regardless of whether it is Time Waveform or Round Robin, is retained. For Time Waveform data
which does not generate an alarm, 1 Time Waveform per hour is retained, and for Round Robin
data which does not generate an alarm, 3 Round Robin results per hour are retained.
The Medium Term and Long Term filters are set in a similar manner.
In the lower right hand corner of the Surveyor software window, the name of the database being
used for the selected motor, the user login name, and the role of the user are displayed. To verify
that the data filtering strategy selected is appropriate, monitor the size of the database as shown in
the lower right hand corner. If the database is filling too quickly, a more aggressive filter set up
may be required. Alternately, a larger capacity database server could also be installed.
12/3/20131 | 71-055 EN
NetEP User Manual
SKF Motor Condition Surveyor software interface
Note: The NetEP will detect if the database is getting too full and will automatically start
deleting the oldest data if the database has less than 500KB free space left.
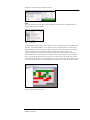
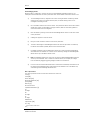
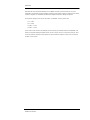
Motor status visual notification
Around each motor is a background square that changes color according to motor status. This is
based on the limits defined within the alarms tab. Default colors are green for all measurements
within limits, blue for a measurement that exceeds the watch limit, yellow for a measurement in the
caution area, red for a measurement in the warning area and grey indicates no data on this motor
– this would most frequently occur when the motor is turned off.
Fig 3-14: Motor status visual notification
If the measurements on a motor exceed the limits defined for that motor, not only will the motor
icon background change color, so will the entries above the motor in the tree. Typically, this will
mean that the voltage buss, folder and database icons will also change background color. This
allows a quick method to determine if any motor is in an alarm condition. To determine which
motor has exceeded the test limits, navigate down the tree looking for the motor with the same
color background – note that there may be more than one motor, which has exceeded its alarm
limits.
Motor information pane
Until a motor is selected, the motor information pane will be blank. Select a motor by double
clicking on it in the Navigation pane. A single click will highlight the motor in the tree, but will not
display the information for that motor – a double click is required. The title at the top of the window
will indicate the displayed motor. The motor information pane has tabs both at the top, and often at
the bottom of each view. The tabs along the top are for alarms, scheduler, dashboard,
voltage/current, time waveforms, and trending. These tabs are discussed in detail in later chapters
of this document.
Menu items
Click on File in the menu bar to create a new database, folder, voltage buss, or motor, to open or
close an existing database, or to exit the program.
12/3/20131 | 71-055 EN
NetEP User Manual
SKF Motor Condition Surveyor software interface
Fig 3-15: File menu
View
The View drop down menu contains refresh, navigation pane and server tree toggle boxes, the
machine status grid and properties.
Fig 3-16: View menu
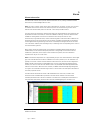
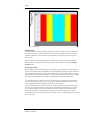
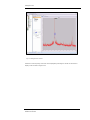
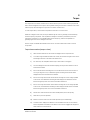
To see the status of all the motors in the databases open on the NetEP, select the Machine Status
Grid view. The data grid displays a color-coded box for each monitored motor. This view can be
toggled between two views. One view has large boxes and the other has small icons. This allows
several hundred motors to be viewed at a glance. Default color coding is Green for all
measurements within limit, Blue for a measurement that exceeds the watch limit, Yellow for a
measurement in the caution area, Red for a measurement in the warning area. Grey indicates no
data on this motor. By placing the mouse pointer in the colored box, a pop up will show the last
measured data for that motor. To quickly navigate to the motor, double click on the square or icon
in the Motor Status Grid View and the detailed motor results screen for that motor will be opened.
Fig 3-17: Machine status grid view
12/3/20131 | 71-055 EN
NetEP User Manual
SKF Motor Condition Surveyor software interface
Fig 3-18: Motor status view
Tools
Fig 3-19: Tools menu
The tools view has two options. Customize and Options. The properties menu offers general
options to how often the data is updated. Changing this will impact the performance of the system.
Do not change this value without consulting Baker/SKF first. The advanced tab allows the resetting
of default settings. The display units selection sets the default units for Torque, though both Nm
and ft-lb are available throughout the Surveyor interface.
Fig 3-20: Properties general and advanced
Window
This menu offers advanced window views and a list of currently open views on the desktop. Some
views may be open and not currently visible.
12/3/20131 | 71-055 EN
NetEP User Manual
SKF Motor Condition Surveyor software interface
Fig 3-21: Window dropdown
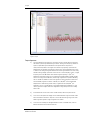
To see detailed results for multiple motors at one time, use the Tile Horizontal selection to get a
display line the one below – note that the windows for the different motors need to be open before
selecting Tile Horizontal.
Help
Fig 3-22 Help menu
This menu contains the user manual in pdf format and an about screen to view what version of
software is currently running on the NetEP, iNetEP.
Location Tree
The Location Tree view organizes motors and voltage busses in an intuitive manner. At the top of
the tree is the database. Beneath the database, it is recommended that a folder (typically used to
describe a location, for example, Plant 17 MCC 3) be created. Beneath the folder, create a voltage
buss describing the buss and its connected motors. Finally, beneath the buss, create motors. Be
sure to create motors that are connected to their specific voltage buss in the location tree. The
location tree is not limited in the number of created voltage busses or motors. Use the location tree
Fig 3-23: Tiled results
12/3/20131 | 71-055 EN
NetEP User Manual
SKF Motor Condition Surveyor software interface
to organize motors and busses without regard to NetEP capacity.
Created items on the location tree are automatically saved to the database. There is no menu item
to save the database.
Server Tree
The Server tree view of the Navigation pane is where mapping occurs of motors and voltage busses
to NetEP devices. Click the Server Tree tab at the bottom of the Navigation pane to switch to the
Server Tree view. As in the location tree, the database is located at the top. Right click on the
database to add or map a NetEP device. A database can have multiple NetEP mapped to it. The
number of NetEP which can be mapped to a database is set in the server configuration. Right click
on the NetEP device to map a voltage buss to a measurement channel (1 through 7) on the device.
Only available channels are shown for mapping. Right click on a voltage buss to map a motor to a
voltage buss. As part of the voltage buss and motor mapping, the voltage or current channel used
in the NetEP is selected.
Graph Tools
When in a graph (time waveform display, torque versus time, spectrum or trending in Use Dates
mode), there are many options available to help inspect the graph.
Zoom: Click the mouse and drag the cursor to define the area to which to zoom. Dragging the
cursor causes a dotted line to appear showing the area that will be displayed when the mouse
button is released.
Zoom X-axis only: Click the left mouse button and drag the cursor straight parallel to the X-axis.
The dotted lines showing the new display area will shift to vertical lines showing the portion of the X
axis that will be zoomed to.
Zoom Y-axis only: Click the left mouse button and drag the cursor straight parallel to the Y-axis.
The dotted lines showing the new display area will shift to horizontal lines showing the portion of
the zoomed in Y-axis.
Cancel a Zoom: with the left mouse button still depressed, hit the escape key
To undo a Zoom: press the spacebar
Undo all Zoom: Press the Control and Spacebar keys simultaneously
Delta cursor: By default, the delta cursor has a green background. Click the left mouse button and
drag the Delta cursor to the second point. Text will display next to the cursor showing the X and Y
value changes between the two points.
12/3/20131 | 71-055 EN
NetEP User Manual
SKF Motor Condition Surveyor software interface
12/3/20131 | 71-055 EN
NetEP User Manual
Chapter 4
Parameter definitions & uses in diagnosing machine faults
Parameter definitions
The NetEP does two types of data acquisitions for monitored motors: Round Robin acquisition and
Time Waveform acquisition. Both of these data acquisition types are automatically performed by
the NetEP, there are no user adjustable settings for either acquisition type. The Round Robin
acquisition is a fast measurement of motor voltages and currents. In a typical installation, every
motor will have a Round Robin data acquisition taken on it approximately every 15 seconds. The
Round Robin data is useful for monitoring overall power quality data as well as detecting
momentary fluctuations in power or motor performance. The Time Waveform acquisition takes
place approximately once per hour for each motor. This is an extended data acquisition that
provides spectrum data and other machine parameters. The list of parameters measured or
calculated from each measurement type is shown below.
Round Robin Measurements:
Voltages:
− Peak Voltage [LN - V]
− V RMS Avg. [LL - V]
− V RMS Avg. [LN - V]
− VA Peak [V]
− VA RMS[V]
− VAB Angle [deg]
− VAB RMS [V]
− VB Angle [deg]
− VB Peak [V]
− VB RMS[V]
− VBC Angle [deg]
− VBC RMS [V]
− VC Angle [deg]
− VC Peak [V]
− VC RMS [V]
− VCA Angle [deg]
− VCA RMS [V]
− Voltage Level [%]
− Voltage Unbalance [%]
− VUF [%]
Currents
−
−
−
−
−
−
−
−
−
−
Current Level [%]
Current Unbalance [%]
Peak Current [A]
I Avg RMS [A]
IA Angle [deg]
IA Peak [A]
IA RMS [A]
IB Angle [deg]
IB Peak [A]
IB RMS [A]
12/3/20131 | 71-055 EN
NetEP User Manual
−
IC Angle [deg]
12/3/20131 | 71-055 EN
NetEP User Manual
Parameter definitions & uses in diagnosing machine faults
−
−
IC Peak [A]
IC RMS[A]
Power quality
Power
−
−
−
−
−
−
−
−
−
−
−
−
−
−
−
−
−
−
−
−
−
c.f. I Avg
c.f. Ia
c.f. Ib
c.f. Ic
c.f. V Avg.
c.f. Va
c.f. Vb
c.f. Vc
Displ. PF a
Displ. PF Avg.
Displ. PF b
Displ. PF c
Harm. PF Avg.
Harm. PFa
Harm. PFb
Harm. PFc
PF Avg
PFa
PFb
PFc
V over F
−
−
−
−
−
−
−
−
−
−
−
−
−
−
−
−
−
−
−
−
−
App. Power a [kVA]
App. Power b [kVA]
App. Power c [kVA]
App. Power [kVA]
Frequency [Hz]
Input Power [kW]
Power a [kW]
Power b [kW]
Power c [kW]
Reactive Power a [kVAr]
Reactive Power b [kVAr]
Reactive Power c [kVAr]
Reactive Power [kVAr]
Z Avg Amp. [Ohms]
Z Unbalance [%]
Za Amp. [Ohms]
Za Ang. [deg]
Zb Amp. [Ohms]
Zb Ang. [deg]
Zc Amp. [Ohms]
Zc Ang. [deg]
Distortion
−
−
Harmonic Distortion I [%]
Harmonic Distortion V [%]
12/3/20131 | 71-055 EN
NetEP User Manual
Parameter definitions & uses in diagnosing machine faults
−
−
−
−
−
−
−
−
−
−
−
−
−
−
−
−
−
−
HVF
HVF A
HVF B
HVF C
Td Ia [%]
Td Ib [%]
Td Ic [%]
Td Va [%]
Td Vb [%]
Td Vc [%]
THDi A [%]
THDi B [%]
THDi C [%]
THDv A [%]
THDv B [%]
THDv C [%]
Total Distortion V [%]
Total Distortion I [%]
Components (symmetrical components)
− Ia1 Amp.[A]
− Ia1 Phase [deg.]
− Ia2 Amp.[A]
− Ia2 Phase [deg.]
− Va1 Amp. [V]
− Va1 Phase [deg.]
− Va2 Amp. [V]
− Va2 Phase [deg]
− Za1 Amp. [Ohms]
− Za1 Phase [deg.]
− Za2 Amp. [Ohms]
− Za2 Phase [deg.]
Machine
−
NEMA derate factor
Time waveform acquisitions
In addition to all the parameters listed above, time waveform acquisitions include:
− Voltage Spectrum
− Current Spectrum
− Torque Spectrum
− Voltage Time Waveform
− Current Time Waveform
− Torque Time Waveform
− Air Gap Torque [ft-lb]
− Air Gap Torque [Nm]
− Eff. Service Factor
− Efficiency [%]
− Load [%]
− Load [hp]
− Load [kW]
− Rotor Bar Sideband [-db]
12/3/20131 | 71-055 EN
NetEP User Manual
Parameter definitions & uses in diagnosing machine faults
−
−
−
−
−
Rotor Sideband Freq. [Hz]
Speed [RPM]
Torque [ft-lb]
Torque [Nm]
Torque Swing [%]
Components
Symmetrical Components are useful for troubleshooting asymmetries in a machine or power
system. For machines, these are typically disconnected coil (cut out of the circuit), contact resistance
in the circuit (not typical as these tend to burn out quickly), repair errors (inconsistent wire gauge or
turn count, connection, reversed coil) resulting in asymmetries.
Symmetrical Components, describe the voltages and currents and impedance in a three phase
power system. They can be decomposed into three phasors or components:
−
−
−
the positive sequence phasor/component (V1, I1, Z1)
the negative sequence phasor/component (V2, I2, Z2)
the zero sequence phasor/component (V0, I0, Z0)
The positive sequence phasor or component works to rotate the shaft of the motor in the intended
direction. Work performed by the positive sequence component has to overcome the negative
sequence component before any real work can be done.
The negative sequence phasor would rotate a motor in the opposite direction that the shaft turns.
Therefore, negative sequence components/phasors works against the positive component/phasor. A
negative sequence component works to slow down the shaft as a brake would. All of this energy
ends up as heat in the motor and is not good.
The zero sequence component/phasor is a ground current. In a balanced three phase system, the
negative sequence term is zero. The NetEP assumes the phasor do not have a zero sequence.
Measurements available
I1: Positive sequence current amplitude
I1 Phase: Positive sequence current phase
I2: Negative sequence current amplitude
I2 Phase: Negative sequence current phase
V1: Positive sequence voltage amplitude
V1 Phase: Positive sequence voltage phase
V2: Negative sequence voltage amplitude
V2 Phase: Negative sequence voltage phase
Z1: Positive sequence impedance magnitude
Z1 Phase: Positive sequence impedance phase
Z2: Negative sequence impedance magnitude
Z2 Phase: Negative sequence impedance phase
12/3/20131 | 71-055 EN
NetEP User Manual
Parameter definitions & uses in diagnosing machine faults
Current
The current measurements are of each single-phase current – in RMS and peak. Limits should be
set by using the nameplate data of the stator current. The aggregate Peak current, Avg RMS
current and Avg RMS as a percentage of nameplate are also measured.
Too much current can overstress particular phases in the motor. The over current test determines
if your motor might be drawing more than its rated current on one or more phases, causing
excessive heat in the motor and decreasing the life of the insulation.
The nameplate information for every motor includes current data. The over current test compares
the highest phases’ current with the rated nameplate current and identifies overheating for that
particular winding.
A typical thermal assessment for a winding examines a particular phase’s current. The current
generates I2R losses, thus creating heat. Although not the entire cause for heat in the motor, I2R
losses are usually the main contributor.
Possible causes of high current:
Overloading: Will typically raise the current levels above nameplate.
Under-voltage: Every machine will either deliver the load required, or stall. The operating speed is
mainly set by the operating frequency, and the load defines the required torque for that operating
speed. The machine has to deliver the required torque that is now defined by frequency, and
resulting operating speed. In order to deliver torque, the machine requires input power delivered by
the voltage buss. If the voltage buss is low, then the required input power will have to be created by
a higher current level.
Error in connection of machine: Errors connecting the machine will dramatically lower the
inductance and resistance seen by the energized leads. Errors in connection will cause dramatic
over currents, even when the machine is running with no load – literally free spinning. This error
typically destroys the stators insulation health within a short time frame.
Mistake in machine rewinding: Mistakes in rewinding will change the properties of the machine. In
this instance over currents is one of the possible outcomes.
Severe rotor cage damage: Rotor cage deterioration lessens the effectiveness of the rotor to
generate torque with slip. The torque required by the load has then to be provided with a higher
operating slip, which in turn causes higher rotor currents. These are then reflected as higher
current levels in the stator.
Current Unbalance: Current Unbalance is measured in percentage. For machines with >50% load,
this value is typically smaller than an eighth of the percentage voltage unbalance.
Unbalanced currents are frequently caused by mildly unbalanced voltages. A common rule of thumb
is that voltage unbalance can be the cause of up to eight times larger current unbalances. Machines
will also show very large current unbalances under very light, or no load conditions – even when
driven by a balanced voltage. These current unbalances are common in healthy machines. These
current unbalances vanish rapidly when the machine is loaded.
NEMA defines current unbalance according to the following equation:
12/3/20131 | 71-055 EN
NetEP User Manual
Parameter definitions & uses in diagnosing machine faults
% I imbal = 100%.
I Avg _ RMS − max{( I A − I B ) : ( I B − I C ) : ( I A − I C )
I Avg _ RMS
Where IA, IB , and IC are the RMS values of the currents of the 3 phases, and IAvg._RMS is their
average.
Another way to analyze unbalances is via the negative to positive sequence ratio. This is the
preferred method in the IEC standards.
Current Level [%]: I avg RMS as a percentage of full load where full load is defined from the
nameplate
I Avg RMS: the average value of all three phases of current in RMS terms (RMS = root mean
square).
Peak Current: the maximum current observed in any phase
Current Unbalance [%]: A measurement of the unbalance of the three currents supplying the
motor. This is a NEMA type unbalance where the ratio is the maximum deviation from average
divided by the average.
For each phase, A, B and C, the following measurements are provided:
I Angle (degrees): the phase angle of the phase current. All phase angle values for all
measurements are in respect to the A phase voltage.
I RMS: the RMS value of the phase current. This is the current a digital volt meter would display
when measuring the signal from the A phase CT.
I Peak: the peak current of the phase. The peak current is the actual maximum value of current
observed by the CT and is the peak amplitude an oscilloscope would display when connected to the
CT.
Distortion
Distortion measurements quantify how different a signal is compared to a perfect sine wave. AC
rotating machinery works best when powered by a pure sine wave. Any power that is delivered to a
motor that is not a pure sine wave creates heat in the motor. Therefore; the lower the distortion the
better.
Distortion can arise from several different sources. For example, upstream transformers can
saturate and warp the sine wave along with variable frequency drives (VFD’s) creating noise on a
voltage bus.
Total distortion (Td): is a ratio of the amount of a signal that is not in the fundamental frequency
to the fundamental signal (either 50Hz or 60Hz). So the Td is a ratio of everything but the
fundamental to the fundamental.
Total harmonic distortion (THD): is a ratio of the harmonics of the fundamental to the
fundamental itself. Harmonics of 60Hz are 120Hz, 180Hz, 240Hz, etc. THD is very different from
total distortion (Td), because Td will sum up all the frequencies in a signal and compare the sum to
the fundamental, while the THD will just sum up the harmonic frequencies and compare the sum to
the fundamental.
12/3/20131 | 71-055 EN
NetEP User Manual
Parameter definitions & uses in diagnosing machine faults
For example: a transformer with a phase saturating will cause the current in the saturated phase to
have many harmonics of 60Hz. Therefore THD will be high. Td will also be high because Td will also
sum up the signal at the harmonics of 60Hz as well as all other frequencies. Secondly consider a
noisy VFD on a voltage bus. The THD of the bus voltage can be low, but the Td can be very high, all
because the noise the VFD makes is not always at the harmonics of 60Hz.
Harmonic voltage factor (HVF): is widely used to de-rate the available power that should be
taken from the motor without damaging the motor in the process. The Harmonic Voltage Factor is
a weighted average of the odd harmonics of a voltage, except those harmonic with orders divisible
by three. Specifically, HVF is
Where:
n= order of odd harmonic except those divisible by three
Vn= the voltage of the nth order harmonic. Again, harmonics eventually end up as heat and are not
good for motors. As such, NEMA has derating curves for motors based upon the HVF.
Fig 4-1: Derating curve for harmonic voltages
In deriving the HVF curve in Fig 1, NEMA assumes the only harmonics present are those included in
the weighted average above. Specifically, any unbalances or other harmonics are not significantly
contributing to the de-rating factor.
Aggregate harmonics measurements are:
− Harmonic Distortion I [%]: The average of the THD for all three phases of current.
− Harmonic Distortion V [%]: The average of the THD for all three phases of voltage.
− HVF: Harmonic Voltage Factor. The average of the HVF for all three voltage phases.
− Total Distortion V [%]: The average of all the distortion in the three phases of
voltage.
− Total Distortion I [%]: The average of all the distortion in the three phases of
current.
For each phase, A, B and C, the following measurements are provided:
HVF: Harmonic Voltage Factor for each phase.
Td I [%]: Total Distortion, in percent, of each phase current.
Td V [%]: Total distortion, in percent, of each phase voltage.
THDi [%]: Total harmonic distortion of each phase current.
THDv [%]: Total harmonic distortion of each phase voltage.
12/3/20131 | 71-055 EN
NetEP User Manual
Parameter definitions & uses in diagnosing machine faults
Dependencies of the harmonic data
If harmonics or noise sources are present in the voltage and current signals, the values listed above
will increase. Using the transformer example above, an upstream transformer with a saturated
phase will have increases in all of the distortion variables. With the measurements of all the phases
and currents available, the offending phase can be identified.
Possible causes: THD I or Td I - saturating the iron in the motor. The motor being incorrectly
connected to an excessive voltage level can cause this or if the motor has multiple voltage inputs
the wrong voltage leads were connected to the voltage bus.
(Excluding VFD’s) THD V, Td V – saturating transformer upstream. Another possible cause is if on
the same bus, there are a high level of non linear loads (arc furnace, power electronics).
Machine data
The machine data measurements give key data regarding the machine load, efficiency, speed, rotor
bar condition and de-rating.
Load is measured and reported in KW, HP and output Torque (both in NM and Ft-Lbs).
Load %: Expresses the delivered power of the motor to the name plate output power. 100% is a
fully loaded motor while 20% is a lightly loaded motor.
Load KW: The power output of the motor expressed in KW
Load HP: The output power of the motor expressed in HP.
Air Gap Torque: is formed by the interaction of the magnetic flux in the gap and the current
flowing in the rotor bars. The air gap torque is similar to the shaft torque, the difference being the
friction & windage losses of the rotor and bearings is included in Air Gap Torque, but not in the
shaft torque.
Torque: The shaft torque. Very close to Air Gap Torque but reduced by friction and windage losses.
See section on Torque for more details.
Effective Service Factor: Divides the estimated percentage load into the NEMA de-rating factor.
The service factor that a motor should be running at based on all the de-ratings caused by
unbalanced currents, over/under voltages, harmonics, etc. It identifies how close the motor is
operating to its effective service factor. The service factor test predicts heat-based deterioration and
provides an accurate thermal assessment of the motor.
Efficiency: Estimates the efficiency (the ratio of the electrical power supplying the motor to the
mechanical output power of the motor) of the motor under its particular operation conditions.
Poor motor performance displays reasons for stress in the motor. Excessive heat generated by the
motor performance will destroy the insulation system causing premature electric motor failure.
Properly diagnosed motor performance issues can either be avoided by correcting the root cause to
the stress, or mitigates so future motor operation does not need to change.
Based on the measurements of voltage and current supplying a motor, the amount of shaft power
the motor is producing is found, as well as how effectively the motor is converting electrical energy
into mechanical energy. Any deviations from the norm can be used to de-rate the motor.
NEMA Derating: how much the full load of the motor should be de-rated based on current
unbalances.
12/3/20131 | 71-055 EN
NetEP User Manual
Parameter definitions & uses in diagnosing machine faults
Rotor Freq [Hz]: the frequency where rotor bar frequencies will appear in current spectrum. For
example: a 1780 RPM 4 pole motor has a slip frequency of 20 RPM or 0.33Hz. Broken rotor bars
show up at the fundamental frequency (60Hz) minus slip (0.33Hz) = 59.67Hz.
Rotor Side Band [dB]: In spectrum plots, the difference between the fundamental peak and the
side band peak caused by broken rotor bars. In the current spectrum, broken rotor bars peaks show
up at the Rotor Freq (above example) which is very near the fundamental. In the torque spectrum,
the broken rotor bar peak shows up at the slip frequency (0.33Hz in this example) very near zero
frequency.
Speed [RPM]: the shaft speed in revolutions per minute.
Power data
Using the voltage and current measurements, the following list of power properties can be
determined. Real power, apparent power, reactive power can be found as well as the power factor
(PF). Real, reactive, and apparent powers are related to each other via the PF.
Apparent power = 3*I avg rms*V avg rms (where V avg rms is with respect to ground - not line to
line)
Real power = (apparent power) * PF
Reactive power = (apparent power) * sqrt(1-PF^2)
There are numerous ways to do the calculations for determining real/reactive/apparent power. The
formulas below show how it is done with arrays of voltage and current data:
First, calculate the RMS value for all three voltages and currents:
Va − rms = [Σ i =0
Va 2 (i )] / NPTS
Vb − rms = [Σ i =0
Vb 2 (i )] / NPTS
Vc − rms = [Σ i =0
Vc 2 (i )] / NPTS
I a − rms = [Σ i =0
Ia 2 (i )] / NPTS
I b − rms = [Σ i =0
Ib 2 (i )] / NPTS
I c − rms = [Σ i =0
Ic 2 (i )] / NPTS
Index full _ cycles
Index full _ cycles
Index full _ cycles
Index full _ cycles
Index full _ cycles
Index full _ cycles
Calculate the apparent power by multiplying the RMS voltages and currents together on a phase by
phase basis:
Papparent = Va − rms * I a − rms + Vb − rms * I b − rms + Vc − rms * I c − rms
The real power is found by summing the voltages and currents per phase on a point by point basis
as shown below:
Preal = (1 / Index full _ cycles )
power factor becomes
12/3/20131 | 71-055 EN
NetEP User Manual
Index full _ cycles
∑ [Va(i) * Ia(i) + Vb(i) * Ib(i) + Vc(i) * Ic(i)] The
i =0
Parameter definitions & uses in diagnosing machine faults
PF = Preal / Papparent
The reactive power becomes
Preactive = Preal * (1 − PF 2 )
Aggregate Power Measurements
Frequency (Hz): The fundamental frequency of the power system (i.e. 50Hz, 60Hz)
Input power (KW): The real electrical input power to the motor
Apparent power (kVA): Total apparent power in kVA. Equals the sum of the three phase’s
apparent power.
Reactive power (kVAr): Total reactive power in kVA. Equals the sum of the three phase’s reactive
power.
Z Avg Amp: Average of the three phase’s impedance amplitudes
Z Unbalance [%]: Unbalance of the three phase’s impedance amplitudes using the NEMA formula
for unbalance.
The following measurements are provided for each phase:
Apparent power phase (kVA): Apparent power of the Phase
Reactive power phase (kVAr): Reactive power of the Phase
Real power phase (power): Real power of Phase A
Z Amp: Phase impedance. Equals V-rms/I-rms.
Z Angle: Phase impedance phase angle. Equals Ang(V)-Ang(I)
Power quality
The nameplate of the motor specifies operating voltage level and frequency for the motor. Under
optimal conditions, the motor will operate at 100% voltage level, 0% voltage unbalance and 0%
voltage distortion.
Power condition problems particularly deteriorate the motors that are operating at higher load
points, or with more frequent cycle times.
Given the high resolution measurements of the three voltages and currents, power quality
information can be obtained. Power quality affects how well the motor can convert the electrical
input power to mechanical output power. As described in the harmonics section, motors work best
when they are powered by a pure sine wave. Unfortunately, power systems and loads can distort
the sine wave. The motor can still operate, although the motor becomes less efficient at producing
mechanical power.
The motor itself can have an effect on the power system, mainly by the phase angle between the
voltage and current drawn to power the motor. This phase angle is represented by the power factor
(PF).
On an individual phase basis, the power factor becomes:
PFa = Preal − a / Papparent − a
12/3/20131 | 71-055 EN
NetEP User Manual
Parameter definitions & uses in diagnosing machine faults
Where
Preal − a = (1 / Index full _ cycles )
Index full _ cycles
∑ [Va(i) * Ia(i)]
i =0
And
Papparent − a = Va − rms * I a − rms
A= Phase A. The same formulas are used to determine the power factors, apparent power, and real
power of the phase B and phase C.
The displacement power factor and the harmonic power factor are concepts used understand the
contributions to the overall power factor provided by the fundamental power frequency and the
contribution by the harmonics as shown below:
PF = ( DisplacmentPF ) * ( HarmonicPF )
The displacement power factor is an artifact of the motor and its inductive nature. The harmonic
power factor is due to the motor’s inductive nature and the characteristics of the power system. By
splitting up the power factor into two pieces, the properties of the motor that are independent of
the power system can be observed even though the power system itself is changing.
Another way to view the three power factors is as follows:
− PF = the power factor of the system
− Displacement power factor = the power factor of the fundamental power frequency
− Harmonic power factor = the contribution from all the other frequencies not in the
fundamental. HarmonicPF = PF / DispPF.
Crest factor
The crest factor is often used to describe how well a waveform looks like a sinusoid. The definition
of Crest Factor (c.f.) is
c. f . =
V peak
V RMS
The table below shows the c.f. various waveforms.
12/3/20131 | 71-055 EN
NetEP User Manual
Parameter definitions & uses in diagnosing machine faults
Fig 4- 1: Crest factors for various waveforms. From Wikipedia.
The c.f is seldom used in the motor industry. However, in the general design of magnetic circuits,
the c.f. can prove useful in properly sizing cores given the type of waveform a core will see. For
example, the core dimensions will be different if a core sees a square wave with c.f.=1. If the core
sees a sine wave, it’s dimensions can be smaller.
V/F is a ratio of the excitation voltage of the core to the frequency of that excitation. Cores are
designed to stay out of saturation at their design voltage and frequency. If the voltage is allowed to
increase, the core will saturate and heat up. If the frequency is allowed to slow down, the core will
again saturate and heat up. Consider the definition of flux:
Φ = ∫ Vdt
If a voltage is present for a long time, the flux Ф can become very large and drive the core into
saturation. Likewise, if the voltage is too high, the flux can become large and again drive the core
into saturation.
Keeping the V/F ratio constant is required to keep core losses minimized. The V/F ratio is of special
interest for VFD driven motors where the V/F ratio is a key setting to configure the drive.
Aggregate power quality fata:
c.f. I Avg: The average Crest Factor of all three currents.
c.f. V Avg: The average Crest Factor of all three voltage
Displ PF Avg: Average of Phase A,B,C Displacement Power Factors
Harm PF Avg: Average Phase a,B,C Harmonic Power Factors
PF Avg: The average of Phase A,B,C (real or total) Power Factors
V over F: The ratio of Voltage to Frequency.
Data is provided for each phase:
c.f I: The Crest Factor for each Phase current
c.f. V: The Crest Factor for each Phase voltage
Displ PF: Displacement Power Factor for each Phase
Harm PF: Harmonic Power Factor for each Phase
PF: The (real or total) Power Factor for each Phase
12/3/20131 | 71-055 EN
NetEP User Manual
Parameter definitions & uses in diagnosing machine faults
Voltage
Poor voltage conditions will expose the motor to additional unnecessary stress. This stress will be
noted, most significantly, in additional heat in the motor, which is the main insulation deterioration
mechanism. NEMA and EASA suggest the rule of thumb that for every 10°C of additional heat to
the windings, the motor’s insulation life is reduced by half.
Power condition problems usually come from up-stream. The motor is exposed to a stressing
voltage condition, which generally is created by the power distribution system (voltage source).
Power condition problems affect the whole voltage bus, and not only the motor that is being
currently monitored. Hence, if the problem is fixed, all motors on this bus will benefit, and longer
lifetimes can be expected.
Common problems can consist of wrong settings on the supply transformer’s taps, poorly
distributed single-phase loads, and overloading (saturating) supply transformers.
Aggregate voltage data:
Peak voltage [LN-V]: The maximum line to neutral voltage of the three phases.
V RMS avg [LN-V]: The average RMS line to neutral voltage
V RMS avg [LL-V]: The average RMS line to line voltage
Voltage level [%]: The percentage of actual voltage to nameplate voltage
Voltage unbalance [%]: The unbalance of the three voltages using the NEMA definition for
unbalance.
VUF [%]: Voltage unbalance factor. Equals the ratio of negative sequence voltage and the positive
sequence voltage. Similar to the NEMA unbalance, but more accurately reflects the effect of
unbalanced amplitudes and phase angles on motor performance.
The following are available for each phase:
V Peak [V]: The peak voltage for the phase (line to neutral)
V RMS [V]: The RMS voltage for phase (line to neutral)
V Angle [degrees]: The angle between two phases line to line voltages
V RMS [V]: The phase to phase line to line voltage in RMS. This is the value measured by a hand
held digital volt meter measuring between phases.
Voltage, current and torque spectrum
The spectrum window (available in voltage/current and in torque) is used to analyze the frequency
spectra of the three line-neutral voltage waveforms, the three line currents and the torque
independently of each other. The current spectrum contains information related to the vibration
spectrum of the machine, among other things. It is possible to identify roller-bearing faults by using
the Mark Frequencies option. It is also feasible to find deteriorating alignment problems, load
unbalances, looseness, eccentricity, and cavitations by analyzing the spectrum.
Note: It has been shown that it is possible to identify the above mentioned faults using the current
spectrum. However, the locations in the spectrum that display the signatures of any particular
fault differ noticeably from the frequencies where vibration analysts identify particular fault types.
This is due to the modulation of the frequency of interest onto the fundamental (50 or 60 Hz).
Experience has shown that it is significantly easier to diagnose mechanical faults using the torque
spectrum, since the modulation of the fundamental is not present in the torque spectrum. It also
needs to be noted that the torque spectrum noise floor is typically almost one decade lower than
in the current spectrum.
12/3/20131 | 71-055 EN
NetEP User Manual
Parameter definitions & uses in diagnosing machine faults
Rotor Bar
The rotor bar marker identifies electrical asymmetries in the rotor circuit of induction machines of
either kind: Squirrel-cage (manufactured or die-cast rotor design), and wound rotor design.
Broken rotor bars can cause excess heat in the motor, decrease efficiency, shorten insulation life,
and possibly cause core damage.
The rotor bar marker identifies salient frequency components, which are generated by a degrading
rotor cage in the current spectrum. The rotor bar alarm compares the magnitude of the rotor bar
frequencies to the limits on the alarm setup page.
Possible root causes of electrical asymmetry:
Cage rotor designs:
− Broken or cracked rotor bars
− Broken or cracked endrings
− Uneven quality of electrical connection between bars and endrings for manufactured
cage designs
− Porosity in the squirrel cage of die-cast cages is very common, and frequently
represents no problem to the lifetime of the machine.
Wound rotor designs:
− Uneven brush-ring connection quality
− Unbalanced rotor-resistance circuit
− Unbalanced contact resistance in external rotor-circuit shorting bridge.
− A turn-turn short in the rotor-winding
Electrical asymmetries in the rotor circuit create currents at various frequencies. It has been shown
that an increasing amount of electrical asymmetry cause these currents’ amplitudes to rise.
Literature shows that the particular signature frequencies of the rotor currents fr depend upon two
variables: the fundamental frequency fN (typically 50Hz or 60Hz for most networks), and the
amount of slip s with which the induction machine is being operated.
fT * h, k ) = f N ⋅ (h + k ⋅ 2 ⋅ s )
Where:
h = a whole number >0 that represents the electrical harmonics
k = is a whole number and
slip s = is defined as:
s=
SySP − OpSp
SySp
Where:
SySp= denotes synchronous speed
OpSp= stands for operating speed.
The most accepted method for the diagnosis of rotor circuit asymmetries during operation by
means of electrical measurements is the Lower Side-band method. It compares the current
amplitude at one particular frequency (h=1, k=-1) of these signature frequencies to the current
amplitude at the fundamental frequency.
12/3/20131 | 71-055 EN
NetEP User Manual
Parameter definitions & uses in diagnosing machine faults
This particular signature is called the Lower Side-band, because it’s location at the lower side-band
of the fundamental current, as can be seen in the following equation:
f rh =1, k = −1 = f n (1 − 2 ⋅ s )
The signature is shown in the spectrum display; a graph that plots the current components vs.
frequency. The current components are normalized to the amplitude of the fundamental current,
and displayed in dB.
The tallest peak of the currents is the fundamental current – 50 or 60 Hz. The fundamental peak
shows one side-band to each side. The automated red-yellow-green-blue assessment made by the
software depends upon the amplitude of the current component at the frequency identified by the
rotor bar marker compared to the limits defined in the alarm setup page.
The effect of rotor circuit asymmetries can also cause various other symptoms in the frequency
domain.
Torque
As an asymmetric rotor feature enters and leaves the magnetized portion of the circuit, it
modulates the ability of the rotor to generate torque. Large asymmetries can be seen in the torque
graph.
This modulation may not be easily visible in the time domain if other torque-signature frequencies
are of significance. If this is the case, switch to the Torque Spectrum where individual frequencies
are separated from each other, making a diagnosis easier.
Other harmonics can be used to attempt to verify rotor circuit asymmetries. If present, these
amplitude peaks are so low that it is advisable to display the spectrum on a logarithmic scale. This
verification is typically done by focusing on one particular h-value, and expecting to see many peaks
at various k-values.
The most common h values used are:
Torque:
6, 12, 18, …
Current:
5, 7, 11, 13, 17, 19, …(odd numbers not divisible by 3)
Deteriorated cages or poor brush-ring contacts decrease the start-up ability of the machine.
Trending startup times for a motor-load system can be used as an additional measure to identify
potential issues.
Note: The startup ability of a machine is strongly influenced by the voltage level, load torque versus
speed profile, and inertia. Any changes to these variables will influence the startup time, potentially
causing false positive or false negative assessments.
Rotor asymmetries will also affect the torque-speed curve, decreasing the amount of torque the
machine can deliver for every speed. For steady-state operation, this results in higher slip being
necessary for producing the same output torque. Note: This effect is very slight for mild to
moderate amounts of asymmetry, yet it keeps growing disproportionately for incremental increases
of asymmetry.
Avoidance/Mitigation
12/3/20131 | 71-055 EN
NetEP User Manual
Parameter definitions & uses in diagnosing machine faults
The potential of a false positive diagnosis delivered by any signature-based diagnostic technique
should be verified using at least one different, non-related technology. Motor Current Signature
Analysis and vibration analysis are the techniques most frequently used together to provide crossverification of the obtained assessment.
After verification of unacceptably high amounts of rotor circuit asymmetry several action paths
open:
Wound rotor induction machine
It may be possible to safely do any of the following while the machine is still in operation: visually
inspect, or take thermo-graphic pictures, or take voltage drop readings at the brushes, brush rings,
and the external circuit connecting the brushes. Resistance and inductance balance readings of the
rotor windings can be taken once the machine is de-energized and in standstill. These types of
measurements may help to pin-point the root cause of the lacking symmetry of the rotor circuit
that was observed via the stator currents.
Squirrel cage induction machine
Rotor bar and rotor-slot shape: The potential ability of a broken rotor bar to dislodge itself from
the rotor slot and wedge itself into the airgap typically influences the action taken when
unacceptably high rotor circuit asymmetry has been diagnosed and verified by two separate and
independent diagnostic techniques. A machine in which rotor bars have the potential to wander into
the airgap is under threat for failure, and is more likely to be scheduled to immediate or prompt
corrective action. Conversely, a rotor bar design that is captive in the rotor iron faces a more
gradual deterioration, allowing a less intrusive schedule for corrective action.
Diecast or manufactured squirrel cage: A second motor-design based differentiator is whether
the squirrel cage is die-cast, or manufactured. The former can have porosity resulting from its
manufacture, whereas the latter cannot. Especially for smaller motors, porosity is a common
imperfection. It only poses a risk to reliability if it is excessively severe. Examples of symptoms of
excessive porosity are: a decrease of the motor’s startup torque capability that falls below the
applications’ requirements; excessive slip during steady-state operation that interfers with the
application; excessive operating temperature decreasing the insulation’s expected life; excessive
vibration, etc.
Diecast squirrel cages can develop broken bars – even though this happens less frequently than for
manufactured squirrel cages. It may be advisable to monitor a diecast squirrel cage machine more
frequently if high amounts of asymmetry are found the first time it is monitored. If the root cause
was porosity, then the amount of asymmetry is unlikely to rise as time goes by – and the period
between measurements may be relaxed. If the diagnosed asymmetry rises as time goes by, then a
situation of broken bars is likely, requiring corrective action.
Manufactured squirrel cages cannot have porosity. Here, rotor asymmetries are probably due to
either a weak electrical joint between rotor bar and end-ring (failure prone in the future), or most
likely due to the stress seen by the machine during normal operation. This is worsened by the fact
that now the squirrel cage is weaker than it was when it first sustained damage, making it more
failure-prone.
Mitigation
Safety, criticality, cost of replacement, cost of repair, down-time to replace, cost of down-time,
availability of replacement, redundancy and availability of capital are just some of the circumstances
that help define a suitable course of action. The particular failure mode of broken bars may offer
the course of action to manage the deterioration for motor designs with captive rotor bars. It is
known that broken bars occur most frequently during line-start processes. Some applications are
designed with multiple motors in parallel that can be switched on or off depending upon the
12/3/20131 | 71-055 EN
NetEP User Manual
Parameter definitions & uses in diagnosing machine faults
momentary requirements. It may be worth assessing whether a captive rotorbar motor diagnosed
with broken bars can be left running continuously until the next planned outage, and expose the
other motors to the start and stop operation.
Rotor bar test: False assessments
It is good practice to cross-verify any signature-based assessment via a second unrelated
technology to rule out false positives, and decrease the risk of false negative assessments.
What are the common sources of false assessments?
1)
Current measurements must be done correctly
2)
Power Quality requirements: Constant Voltage level, Constant Frequency, low noise
floor
3)
The machine must be running with sufficient slip
4)
Load level must be sufficiently constant
5)
Assessment needs to not be influenced by possible natural frequencies of the
motor-load system
6)
Speed assessment must be correct
1) Current measurements must be done correctly.
a) Ensure that current measurements are valid. There is no overloading, no under-voltage
conditions, if the motor has just been installed (or re-installed) there are no errors in connection of
machine, and if the motor has been rewound, there are no mistakes in machine rewinding.
2) Power quality requirements: Constant voltage level, constant frequency, noise floor.
a) The determination of the rotor bar frequency is based upon the knowledge of slip, which depends
of synchronous speed and operating speed. Both these numbers need to be correctly known in the
software to have a properly calculated rotor bar frequency
b) The rotor bar assessment is done on a spectrum measurement. The analysis of this spectrum
can only be valid if steady-state conditions are met. Changes in voltage level or in frequency directly
affect the operating speed of an induction machine, hence breaking the requirement of steady-state
speed during the time waveform acquisition, typically 240 seconds.
c) Ensure that the noise floor of the current spectrum is sufficiently low (20 dB or more) to allow
sufficient separation from the current spectrum to the rotor bar limits.
Note: A significant number of applications exist where lowering the noise floor sufficiently may be
hard to accomplish. Examples: Crushers, conveyor belts, and pulpers.
d)Insufficient separation is the source of false positive assessments.
e) Use the trending page to examine data of sufficient length (~10 minutes) for gaining a good
understanding of the application’s power quality. Look at the V(t) and f(t) traces and ensure that
they are a solid (<1% variation) constant. If this requirement is not met, then the data is known to
be invalid for rotor circuit asymmetry assessments.
12/3/20131 | 71-055 EN
NetEP User Manual
Parameter definitions & uses in diagnosing machine faults
3) The machine must be running with sufficient slip.
a) The rotor asymmetry signature is adjacent to the electrical fundamental and has an amplitude
that is typically orders of magnitude smaller.
b) Sufficient separation in frequencies between the electrical fundamental and the signature
frequency is required to make an assessment possible.
Note: Applications exist where it is impossible to create insufficient separation between the
fundamental and signature frequency. Examples of applications: Motors that are free spinning
(mechanically uncoupled), or most MOV’s, which run at very low loads during the constant load
stroke which is of too short of a duration to allow sufficient separation of these frequencies.
c) Increasing the load to the motor will increase the operating slip, moving the signature peak
further from the peak of the electrical fundamental.
4) Load level must be sufficiently constant.
The rotor circuit asymmetry assessment number is calculated from the amplitudes of the signature
(rotor bar) frequency and the fundamental frequency currents.
a) This sets the requirement of knowing the signature frequency, which depends upon knowledge of
the operating speed.
b) The machine’s speed changes as a function of load requirements (dampened by the system’s
inertia).
Note: A significant number of applications exist where this requirement cannot be met.
Examples: Most mills, cranes, centrifugal shoots, and many applications that require a design D
motor due to dynamic loading.
c) Look at every data point’s torque ripple graph and ensure that the short-time torque ripple is
sufficiently constant to conclude that the rotor bar graph’s data is valid.
d) If the validity of the data is uncertain due to significant torque ripple, AND rotor circuit
asymmetry signature is present, do the following: Look at every datapoint’s torque ripple and
ascertain whether the nature of the torque ripple varies from one datapoint to the other. If this is
the case AND the rotor circuit asymmetry signature remains consistent, then a rotor circuit
asymmetry issue is likely.
5) Assessment needs to not be influenced by possible natural frequencies of the motor-load
system.
Mechanical, or electro-mechanical systems can operate such that natural frequencies near rotor
circuit asymmetry signatures are excited. These excited resonant frequencies are the source of
possible false positive assessments.
Note: The nature of motor current signature analysis is different from vibration analysis in several
ways. One of these differences is that vibration analysis’ information represents the local nature of
the system, whereas motor current signature analysis information is more analogous to a sweep
alongside the energy conveyed to the system. Any electrical or electro-mechanical feature
influencing the flow of energy (e.g. setting off resonances) has the capability of attaching these
frequencies to the spectra obtained through electrical measurements.
a) If a significant rotor circuit asymmetry signature peak has been identified, verify that it is not a
mechanical or electro-mechanical resonance by varying the load. A load variation will vary the
machine’s speed only very slightly (hence the resonance will probably still be excited). However, the
12/3/20131 | 71-055 EN
NetEP User Manual
Parameter definitions & uses in diagnosing machine faults
slip will vary in proportion to the percentage load change – shifting the rotor circuit asymmetry
signature significantly, while keeping the system’s natural resonant peak in the same location.
6. Speed assessment must be correct for the data point
a) The speed must be constant through acquisition and correct in the software
b) Verify that the machine is operating at the speed displayed by the software by reading it with
other means (e.g. a strobe). If this is unrealistic, use the Trending display of Speed to verify that the
speed estimates are consistent.
Torque
This domain specializes in diagnosing mechanical issues, displays transient overloading, and locates
soft-foot mechanical imbalances along with bearing problems. Torque signature analysis shows far
more dramatic results, giving greater confidence in finding and diagnosing problems.
As an asymmetric rotor feature enters and leaves the magnetized portion of the circuit, it
modulates the ability of the rotor to generate torque. Large asymmetries can be seen in the torque
graph.
This modulation may not be easily visible in the time domain if other torque-signature frequencies
are of significance. If this is the case, switch to the torque spectrum where individual frequencies
are separated from each other, making a diagnosis easier.
Torque : The torque time wave form shows the load stress imposed on the motor. RMS quantities
are an accurate measure of the average energy contained in the instantaneously changing current
or voltage signal. If only RMS quantities are monitored, it is impossible to find peak stresses in the
motor’s load. Instantaneous waveform analysis monitors the time-varying or instantaneous
variations in the load. Thus, the torque time waveform can identify peak pulses above the motor’s
nameplate information, even if the average power delivered to the load does not exceed the
nameplate data. A significant portion of a motor’s performance can consist of transient load
fluctuations. Copper losses and their associated heating are proportional to the square of the
currents. Thus, transient load fluctuations are just as significant as the average value of the
operating torque.
The torque time waveform shows the torque propelling the load. Any transients or variations in the
load component should prompt further investigation. For example, the influence of broken fan
blades or worn roller bearings on a conveyor belt can be seen on the torque time waveform display.
Torque swing is the percentage of the transient torque to the steady state in percent:
% torque swing =
12/3/20131 | 71-055 EN
NetEP User Manual
100 ⋅ ( Peak torque − Steady state torque
Steady state torque
Parameter definitions & uses in diagnosing machine faults
12/3/20131 | 71-055 EN
NetEP User Manual
5
Alarms
Alarms tab overview
The alarms tab is where motor specific measurement limits are set, viewing of detailed enabled
alarm status, and acknowledge alarms is done.
Note: This view is a motor specific tab. It shows information for one motor at a time. The overview
of all alarm status is done via the motor selection pane or the machine status grid view. At the
bottom of the alarm window, there are two tabs – alarm setup and alarm status.
The alarm setup tab contains key measurements and motor limits defined for each parameter. Not
all parameters need to have limits, or need to be enabled for alarming. The list of measurements
available for setting alarms is shown on the left of the alarm setup tab view. For each
measurement, a high and low watch, caution and warning limit as well as the alarm enable for the
measurement can be set. If the alarm for the parameter is enabled, the limits will be compared to
the data gathered during monitoring of the motor. If exceeded, the background color of the motor
icon in the motor selection pane will change color, as will the grid box corresponding to the motor in
the machine status grid view.
Alarm status can also be indeterminate, not evaluated or disabled. Indeterminate indicates an
enabled alarm, but an unmeasured specific parameter. This typically occurs when an alarm is
enabled on a parameter, which requires a time waveform acquisition, but a time waveform
acquisition has not yet run on the motor.
Note: time waveform acquisitions occur approximately once per hour. Not Evaluated is coded a light
grey color and indicates that no data is available for this motor; therefore, it is not evaluated. This
typically occurs when a motor has been defined in the location tree, but has not been mapped to a
NetEP channel in the location tree. A Disabled motor is set up and mapped to a NetEP channel;
however, the motor is off at this time. While a motor is off, the NetEP automatically disables data
collection on that motor. When the motor restarts, the NetEP will automatically begin taking data
on it again. The threshold for determining if a motor is off is found in the name plate information in
the motor properties screen.
The Alarm Status tab shows the status of all enabled alarms for this motor, as well as last
measured values of enabled alarm parameters. A motor alarm condition is set when limits
exceeded parameter levels. The alarm condition is not cleared on a subsequent measurement of
this parameter within limits, rather the alarm must be acknowledged by the user before it is
cleared.
12/3/20131 | 71-055 EN
NetEP User Manual
Fig 5-1: Alarms
Alarms
Acknowledging alarms
When an alarm is triggered, it remains set until it is acknowledged regardless whether or not
subsequent measurements of the motor parameter which set the alarm exceed alarm limits or not.
1)
To acknowledge an alarm, navigate to the motor causing the alarm condition by double
clicking on the motor in the motor selection pane, or double clicking on the icon or
rectangle in the data grid view.
2)
Go to the Alarm Status screen for that motor. The parameters which set the alarm status
will be color coded, corresponding to the type of alarm; blue for watch level, yellow for
caution level and red for warning level.
3)
Clear the alarm by clicking on the Click to Acknowledge Alarm column on the color coded
motor parameter.
4)
A dialog box appears to clear the alarm.
5)
Click yes to clear the alarm status for that motor parameter.
6)
The status will change to Acknowledged and the next time this parameter is measured,
the alarm status will be updated, based on the measured value.
7)
If multiple parameters have exceeded alarm limits, each must be cleared individually as
described above or all alarms for a motor can be cleared by clicking the Acknowledge All
Alarms at the top of the Alarm Status screen.
8)
Note: acknowledge all alarms for this motor by using the Acknowledge All Alarms button
at the top of this window. This is useful in a situation where, for example, the voltage
buss momentarily sagged, triggering voltage as well as current alarms.
9)
If an event occurred which affected all motors connected to the NetEP, all the alarms can
be cleared at the database level by right clicking on the database icon in the Motor tree,
and selecting the Acknowledge all alarms item.
Alarm parameters
The motor parameters that can have alarm limits set for them are:
Load [%]
Load [kW]
Power Out [kW]
Rotor Bar Sideband [-db]
Speed [RPM]
Efficency [%]
Eff. Service Factor
Impedance Unbalance [%]
Za
Za angle
Zb
Zb angle
Zc
Zc angle
NEMA Derat.
Input Power [kW]
P. F. Avg
Fig 5-1: Alarm status view
Frequency [Hz]
12/3/20131 | 71-055 EN
NetEP User Manual
Alarms
Current Unbalance [%]
Current Level [%]
Harmonic Distortion I [%]
I Avg RMS [A]
I Peak
Total Distortion I [%]
c.f. I Avg
Voltage Unbalance [%]
VUF [%]
Voltage Level [%]
Total Distortion [%]
V avg RMS [V]
Peak Voltage [V]
Harmonic Distortion [%]
HVF
c.f. V Avg.
These parameters are on the alarm setup tab.
Each motor parameter can have six limits associated with it, low warning, low caution, low watch,
high watch, high caution, high warning. To set an alarm value, type the parameter value into the
appropriate cell in the alarm setup table.
Note: that for parameter limits with no alarm wanted leaves the corresponding alarm cell in the
setup table blank. For example, the rotor bar sideband would most likely be blank for the low
warning, low caution and low watch alarm levels. Alarm limits must be ordered correctly – the low
warning level must be lower than the low caution level, and the low caution level is lower than the
low watch level. Similarly, the high warning level must be higher than the high caution level which is
higher than the high watch level. The high watch level must be higher than the low watch level.
After entering the parameter alarm limits for the motor, click the Apply button near the top of the
alarm setup screen, otherwise changes will be lost. At the top of the alarm setup screen is the Undo
All Changes button. Clicking this button to remove all edits made in the alarm setup screen and
restore all entries to their previous value.
The restore defaults button will load factory pre-set values for all motor alarm parameter limits and
actions. If after examining the defaults, you would prefer not to use them, click the undo all changes
button to restore the previous values.
Use caution when setting Alarm Limit Values
1)
If alarm limits are set too tight, many nuisance alarms could be set, requiring frequent
intervention to acknowledge the alarm state.
2)
Alarm data is saved. If alarm limits are set such that every reading on the motor results
in an alarm condition (that is, one or more of the limits have been exceeded), the data for
the alarm is stored in the database. This can quickly fill the database with the data
associated with the alarms, requiring an administrator to manually clear out database
entries. Having excessive amounts of data in the database can also slow the
responsiveness of the interface.
12/3/20131 | 71-055 EN
NetEP User Manual
Alarms
Fig 5-2: Alarm setup
Enabling alarms
Enabling an Alarm instructs the NetEP to compare the measured values of the motor parameters
to the limits entered in the alarm setup screen. Check the box in the Enable column of the motor
parameter. Only those motor parameters with the Enable box checked are shown on the alarm
status screen.
All limit checking of motor parameters can to turned off (for this motor) by clicking the Disable
Alarms button near the top of the alarm setup screen. Undo this action by clicking the Undo All
Changes button.
Viewing alarm status
When an alarm level is reached, the NetEP sets an alarm for that parameter. If a watch level was
reached, on the Alarm State tab, the Result, Click to Acknowledge, Last Value and Last Tested cells
are all shaded based on the type of alarm limit reached; blue for a watch level, yellow for a caution
level and red for a warning level. Similarly, in the motor selection pane, the motor, and any voltage
buss, folders and databases above it will also be shaded with the appropriate alarm color.
To see the alarm status of all motors, click on the View menu item, choosing the Machine Status
Grid. The data grid has two views, an icon per motor, or a colored rectangle per motor. The view
can be changed by clicking the Toggle Views button near the top of the
screen. The Machine Status Grid view provides an at a glance, single screen showing the status of
all motors. A color shading scheme is used: green for all parameters within limits, blue for watch
limit exceeded, yellow for caution limit exceeded and red for warning limit exceeded. Summary
information for the motor can be viewed by moving the cursor over the motor icon or square
representing that motor. Double clicking on the rectangle or motor icon will display the alarm status
tab for that motor.
12/3/20131 | 71-055 EN
NetEP User Manual
Alarms
Fig 5-3: Motor status grid – block view
Fig 5-4: Motor status grid – Motor view
12/3/20131 | 71-055 EN
NetEP User Manual
Alarms
12/3/20131 | 71-055 EN
NetEP User Manual
6
Dashboard
The Dashboard tab shows the most recent data for motor parameters in either a summary
graphical (gauge) format, or in a detailed text format. The Dashboard is useful for understanding
what is going on with a motor currently. It shows complete power quality, voltage, currents,
distortion, components, power, and machine performance data. However, it does not present the
spectrum data. To view spectrum data, navigate to the Voltage/Current tab for Voltage/Current
spectrum information, or to the torque tab for torque spectrum information.
To open the dashboard view, open a motor window (double click on the motor icon in the location
or server tree) and choose the Dashboard tab at the top of the motor window.
The default view shows the Voltage RMS level, level in percent (of nameplate), harmonic distortion,
and voltage unbalance on the top row. The second row shows the current RMS level, level in
precent (of nameplate), peak current and current unbalance. The third row shows the voltage
frequency, power factor, component avg amplitude, and input power. The last row, machine
guages, shows the motor speed, torque, load in precent of nameplate, and load in KW. The
parameters shown in the guages will update as soon as new data is available. For parameters such
as voltage level and current level, this will be several times per minute. For parameters such as
speed, which require a time waveform acquisition, these will update approximately once per hour.
Each gauge displays the name of the parameter being shown immediately above the guage. The
needle moves to show the value of the parameter on the guage, and a digital display of the value is
shown beneath the guage. The needle position and the digital parameter value update each time
new information is available.
The dashboard gauges can be reconfigured by right clicking on the gauge, then selecting the
parameter for the guage to display. Only 16 gauges can be displayed at one time in the window.
Even though the window is divided into a power gauges and machine guages, any motor parameter
Fig 6-1: Dashboard
12/3/20131 | 71-055 EN
NetEP User Manual
can be placed in either area.
12/3/20131 | 71-055 EN
NetEP User Manual
Dashboard
The grey bars with the title of the gauge section in it also displays the time at which the displayed
data was taken. Seeing that these times update periodically is an easy way to verify that the NetEP
is gathering data properly.
There is no combination drop down box with time stamped results available for the dashboard.
Dashboard shows the most recent data only. To select and view past data for the motor, use the
trending tab.
To see a detailed textual view of the most recent motor data, select the Details tab at the bottom of
the motor results window. This view is grouped by machine, power quality, power, voltage, current,
distortion and components. Detailed information about each phase, as well as the average or sum is
also presented in this details view of the dashboard. Like the gauges, these values update as soon
as new information is available. The title for each group in this detail view includes the time at
which the displayed data was taken.
Fig 6-2: Dashboard text
Click the view phasor diagram to see the voltage and current phasors. This phasor diagram screen
is a read only screen to review data only. No changes can be made here. Connection setup changes
can only be done at the NetEP device using the configuration tool. The phasor diagram represents
the sequence of the voltages and currents for this motor.
Note: This is a function of how the motor is wired to the grid, and also how the NetEP voltage
inputs and CT inputs are connected. The phasor length represents its amplitude, and its angle
position represents its phase angle relative to Va (which is defined as the reference and thus has an
angle of 0). The phasor arrows are color coded to group phase voltages and currents together.
Phase A is red, phase B is blue, and phase C is yellow.
A positive sequence is defined as an A B C sequence, and a negative sequence as an A C B
sequence. See the NetEP data definition section for more information on understanding and using
phasors and components for motor monitoring.
12/3/20131 | 71-055 EN
NetEP User Manual
Dashboard
Note also that the components definition in the NetEP assumes a positive sequence. Thus, V1
amplitude is the positive sequence voltage component if the phasor rotation is positive. If the phasor
rotation is negative, V1 amplitude represents the negative sequence voltage component.
On the phasor diagram, the view of the phasor is selectable. The four choices are:
LN – Y zero
LN – X zero
LN & LL - Y zero
LN & LL - X zero
These choices refer to line to neutral (LN) or line to line (LL) to determine phasor amplitudes, and
where the Va phase (always 0) will be shown, on the Y axis (Y-zero) or on the X axis (X-zero). Thus,
to see the phasors, both line to line and line to neutral with the Va phase on the X axis, choose the
LN & LL X-zero option.
12/3/20131 | 71-055 EN
NetEP User Manual
Dashboard
12/3/20131 | 71-055 EN
NetEP User Manual
7
Voltage/Current
The voltage/current tab is where the time waveform data, spectrum and harmonics for voltages
and currents can be viewed. Note: To view this data, a time waveform acquisition for this motor
must have been acquired. By default, the NetEP performs a time waveform acquisition
approximately once an hour, for every motor.
Unlike the dashboard and trending tabs which show the values of many motor parameters, the
voltage/current tab shows the actual waveforms of the voltages and currents captured by the
NetEP for a specific motor. This is shown as time waveforms – that is, as they would be seen on an
oscilloscope, and also as a spectrum and a harmonics bar chart. The spectrum and harmonics
charts are useful for detecting and diagnosing faults that show up as specific frequencies in the
motor, for example, rotor bar faults.
The time waveform display is a quick way to look at the voltage and current and be sure that
nothing major is wrong. For example, an entire phase has been disconnected. It’s also a quick way
to verify that the motor is indeed on and drawing expected currents.
Time waveform plots
1) Select the voltage/current tab in the motor results window.
2)
On the left hand side of the results window, select the voltages and currents to plot.
By default, all voltages and currents are displayed. The voltages are displayed using
thick lines, while currents are displayed using thin lines. The phases are color coded,
phase A is red, phase B is blue and phase C is yellow.
3)
Use the trigger and slope drop down boxes to control how the display at time zero is
shown. For example, to see phase B current as it crosses zero amps as the starting
point for the graph, select Ib in the trigger box, and falling in the slope box.
4)
Select the date and time for the results to display from the drop down box.
5)
To scroll through the different date time results, use the left and right arrows on the
blue background next to the date time selection box.
12/3/20131 | 71-055 EN
NetEP User Manual
Voltage/Current
Fig 7-1: Voltage/current screen
6)
The power data, voltage, current, symmetrical component data and phasor diagram
are also displayed for reference here.
7)
The scroll bar at the bottom of the waveform display can be used to scroll through
zoomed X-axis data.
8)
Help for controlling the zoom of the display is available by clicking the small ?
symbol at the top of the time waveform screen.
9)
Zoom: Click the mouse and drag the cursor to define the area to which to zoom in
on. As the cursor is dragged, a dotted line appears showing the area that will be
displayed when the mouse button is released.
10) Zoom X-axis only: Click the left mouse button and drag the cursor straight parallel
to the X-axis. The dotted lines showing the new display area will shift to vertical
lines showing the portion of the X-axis that will be zoomed to.
11) Zoom Y-axis only: Click the left mouse button and drag the cursor straight parallel
to the Y-axis. The dotted lines showing the new display area will shift to horizontal
lines showing the portion of the Y-axis that will be zoomed to.
12) Cancel zoom: with the left mouse button still depressed, hit the escape key.
13) Undo zoom: press the spacebar.
14) Reset from Zoom: Press the Control and Spacebar keys simultaneously
12/3/20131 | 71-055 EN
NetEP User Manual
Voltage/Current
Spectrum Plots
1)
Select the Spectrum tab from the lower left hand corner of the motor results
window to view the spectrum
Fig 7-2: Voltage/current spectrum plot
2)
The spectrum display shows the frequency components of a signal. Spectrum plots
are useful for looking for and diagnosing motor problems that have a specific
frequency associated with them. For example, rotor bar faults. As a rotor with a
broken rotor bar rotates in the stator, it creates a disturbance in the currents being
drawn by the motor at a specific frequency. The NetEP calculates this frequency.
Using current spectrum, that particular frequency can be displayed and evaluated
for a rotor bar fault. The height of the line at any frequency represents the
amplitude of the signal at that frequency. Since in an electrical system, currents are
carried in addition to the line frequency current, the line frequency will typically be
the highest peak. However, this peak will vary with each motor type and its load. To
make comparison of frequency peaks easier, spectrum plots are typically normalized
to the height of the line frequency peak. This allows the comparison of other
frequency amplitudes to the amplitude of the fundamental as a ratio, thus allowing
comparisons between motors. For example, the amplitude of the rotor bar
frequency for a motor drawing 1000 A might be 5.6 A, while a motor drawing 300
A might have the amplitude of the rotor bar frequency of only 1.6 A. Yet, relative to
the line frequency amplitude, the ratio of the amplitude of the rotor bar frequency is
the same, -45 dB. Spectrums can be displayed either in log or linear form. Using the
log scale allows much lower signal levels to be seen. Every 20 dB in the log display
represents a factor of 10 in a linear display. That is, a signal frequency that is 20 dB
smaller than another signal frequency is 1/10th the amplitude of the larger signal.
Thus a signal that is 60 dB smaller (smaller signals have a minus sign on the dB
value, where larger signals have a positive dB value), that is -60 dB is 1/1000th the
size of the signal it is being compared to. Note that with the NetEP, signals as small
12/3/20131 | 71-055 EN
NetEP User Manual
Voltage/Current
as -100 dB, or 1/10,000th of the fundamental amplitude are visible. Using a linear
scale, a signal that was 1/10,000th just disappears as it is so small relative to the
fundamental signal amplitude. For this reason, spectrum analysis and motor
diagnostics using the spectrum are usually done in dB.
3)
Similar to the time waveform, select the voltages or currents to display in the upper
left hand corner of the motor results window. Note: The average voltage, current
and the difference of voltage and current is available. These differences are useful in
distinguishing between frequencies coming from the power source (voltage
spectrum), and those frequencies resulting from the action of the machine (found in
the current spectrum).
4)
The Y-axis of the spectrum display can be shifted between a log and a linear scale.
Check the Locked check box to keep the Y axis scale fixed. Using a log Y axis scale
allows a greater dynamic range of signals to be viewed.
5)
The X-axis can similarly be changed between a hertz or a KCPM scale, and can
likewise be locked via the Locked check box.
6)
The window, averages, frequency resolution and maximum frequency (FMAX) are all
read only values displayed here for reference only.
7)
The graph can be normalized in a number of ways, the system determined
fundamental frequency, the highest amplitude frequency, or by manually entering
the frequency whose amplitude the graph will be normalized to. In most cases, using
the system determined fundamental frequency will yield the best results.
8)
Redrawing of the spectrum can be done automatically as changes are made (to
scales or components to plot) if the automatically redraw checkbox is selected, or via
the redraw graph button if the checkbox is not selected.
1)
To assist in identifying frequencies of interest in a spectrum display, markers are
available. In the lower portion of the plots area, click on the markers tab.
2)
Select the frequency to mark in the spectrum using the check boxes at the top of the
marker area. Multiple frequencies of interest can be marked at the same time. This
list consists of the NetEP generated rotor bar, fundamental and speed frequencies,
along with the bearing frequencies defined in the motor properties/machine parts
dialog.
3)
The marker on the spectrum plot is labeled with the frequency name, and the
frequency that is marked. The color of the markers associated with a frequency can
be changed by clicking on the marker color box (the box is filled with the present
color selected for that marker), and then selecting a new color from the pop up
palette of colors.
Markers
12/3/20131 | 71-055 EN
NetEP User Manual
Voltage/Current
Fig 7-3: Voltage/current markers
Harmonics of the frequency of interest can be displayed by selecting the number of harmonics to
display in the harmonics range: to box.
12/3/20131 | 71-055 EN
NetEP User Manual
Voltage/Current
Harmonics
1)
Select the harmonics tab from the lower left hand corner of the motor results
window to view the spectrum harmonics.
2)
Select the date and time for the results to display from the drop down box.
3)
To scroll through the different date time results, use the left and right arrows on the
blue background next to the date time selection box.
4)
The harmonics display shows the harmonics of the system determined fundamental
frequency for the voltage and current components selected.
5)
For reference, harmonic distortion, total distortion and the harmonic voltage factor
and harmonic power factor are displayed.
6)
Harmonics (distortion) measurements quantify how different a signal is compared to
a perfect sine wave. AC rotating machinery works best when powered by a pure sine
wave. Any power that is delivered to a motor that is not a sine wave does not do any
work and ends up as heat. Therefore, the lower the levels of distortion the better.
7)
Distortion can arise from several different sources. For example, upstream
transformers can be saturating and warping the sine wave. VFD’s can impress all
types of noise on a voltage bus.
8)
Total distortion (Td) is a ratio of the amount of a signal that is not in the
fundamental frequency to the fundamental signal (either 50 Hz or 60 Hz).
Therefore, the Td is a ratio of everything but the fundamental to the fundamental.
Fig 7-4: Voltage/Current markers zoom in
12/3/20131 | 71-055 EN
NetEP User Manual
Voltage/Current
9)
Total harmonic distortion (THD) is a ratio of the harmonics of the fundamental to
the fundamental itself. Harmonics of 60 Hz are 120 Hz, 180 Hz, 240 Hz, etc. THD is
very different from total distortion (Td), because Td will sum up all the frequencies
in a signal and compare the sum to the fundamental, while the THD will just sum up
the harmonic frequencies and compare the sum to the fundamental
Fig 7-5: Voltage/current harmonics
12/3/20131 | 71-055 EN
NetEP User Manual
8
Torque
The torque tab in the motor results screen is where both torque versus time and torque spectrum
data is found. Navigate to the torque screen by double clicking on the motor of interest in the motor
selection pane, then selecting the torque tab in the motor results screen.
To view torque data, a time waveform acquisition must have run on the motor.
Unlike the voltage/current view, the torque delivered by the motor is generally not dominated by
the line frequency component. This simplifies the analysis of the motor performance, since the
frequencies of interest are not modulated with the line frequency, and their amplitudes are
generally higher than in the voltage/current view.
See the chapter on NetEP data definitions and use for more information about how to use the
torque data.
Torque time waveform (torque vs time)
1)
Select the date and time for the results to display from the drop down box.
2)
To scroll through the different date time results, use the left and right arrows on the
blue background next to the date time selection box.
3)
For reference, the nameplate rated torque is also drawn on the graph.
4)
Like the voltage/current time waveform display, the torque time waveform can be
zoomed and scrolled.
5)
Zoom: Click the mouse and drag the cursor to define the area to which to zoom in
on. As you drag the cursor, a dotted line appears showing the area that will be
displayed when the mouse button is released.
6)
Zoom X-axis only: Click the left mouse button and drag the cursor straight parallel
to the X-axis. The dotted lines showing the new display area will shift to vertical
lines showing the portion of the X-axis that will be zoomed to.
7)
Zoom Y-axis only: Click the left mouse button and drag the cursor straight parallel
to the Y-axis. The dotted lines showing the new display area will shift to horizontal
lines showing the portion of the Y-axis that will be zoomed to.
8)
Cancel zoom: with the left mouse button still depressed, hit the escape key.
9)
Undo zoom: press the spacebar.
10) Reset from zoom: Press the control and spacebar keys simultaneously.
11) The delta cursor displays the difference in time between the two cursor locations
and the amplitude of the delta cursor. Both cursors can be dragged and dropped to
other locations on the waveform.
12/3/20131 | 71-055 EN
NetEP User Manual
Torque
12)
Fig 8-1: Torque
Torque Spectrum
1)
Like the voltage/current spectrum, the torque spectrum shows all the frequencies
that make up the torque delivered by the motor. Having each frequency visible in a
spectrum plot allows quick identification of frequencies that may show a
motor/machine problem. The height of the line at any frequency represents the
amplitude of the signal at that frequency. Spectrums can be displayed either in log
or linear form. Using the log scale allows much lower signal levels to be seen. Every
20 dB in the log display represents a factor of 10 in a linear display. That is, a signal
frequency that is 20 dB smaller than another signal frequency is 1/10th the
amplitude of the larger signal. Thus a signal that is 60 dB smaller (smaller signals
have a minus sign on the dB value, where larger signals have a positive dB value),
that is -60 dB is 1/1000th the size of the signal it is being compared to. Note that
with the NetEP, signals as small as -100 dB, or 1/10,000th of the fundamental
amplitude are visible. Using a linear scale, a signal that was 1/10,000th just
disappears as it is so small relative to the fundamental signal amplitude. For this
reason, spectrum analysis and motor diagnostics using the spectrum are usually
done in dB.
2)
At the lower left corner of the motor results window, select the spectrum tab.
3)
The Y-axis of the spectrum display can be shifted between a log and a linear scale.
Check the locked check box to keep the Y-axis scale fixed. Using a log Y-axis scale
allows a greater dynamic range of signals to be viewed.
4)
The X-axis can similarly be changed between a hertz or a KCPM scale, and can
likewise be locked via the locked check box.
12/3/20131 | 71-055 EN
NetEP User Manual
Torque
5)
The window, averages, frequency resolution and maximum frequency (FMAX) are all
read only values displayed here for reference only. These values were set as part of
the scheduled time waveform acquisition in the scheduler tab for this motor.
6)
The graph can be normalized in a number of ways, the system determined
fundamental frequency, the highest amplitude frequency, or by manually entering
the frequency whose amplitude the graph will be normalized to. In most cases, using
the system determined fundamental frequency will yield the best results.
7)
Redrawing of the spectrum can be done automatically as changes are made (to
scales or components to plot) if the automatically redraw checkbox is selected, or via
the redraw graph button if the checkbox is not selected.
1)
To assist in identifying frequencies of interest in a spectrum display, markers are
available. In the lower portion of the plots area, click on the markers tab.
2)
Select the frequency to mark in the spectrum using the check boxes at the top of the
marker area. Multiple frequencies of interest can be marked at the same time. This
list consists of the NetEP generated rotor bar, and speed frequencies, along with the
bearing frequencies defined in the motor properties/machine parts dialog.
3)
The marker on the spectrum plot is labeled with the frequency name, and the
frequency that is marked. The color of the markers associated with a frequency can
be changed by clicking on the marker color box (the box is filled with the present
color selected for that marker), and then selecting a new color from the pop up
palette of colors.
Markers
12/3/20131 | 71-055 EN
NetEP User Manual
Torque
12/3/20131 | 71-055 EN
NetEP User Manual
9
Trending
Trending is where the motor’s parameters are examined and how these parameters change over
time. This can be useful for identifying early warning signs of trouble, before a motor failure occurs.
The trending display also shows how motors perform over the course of a day, or other time period.
The trending tab provides both a graphical view of the data, as well as a grid view of actual values
over time. This data can be exported in a CSV format for additional analysis or graphing.
To get to the trending screen, double click the motor to examine in the location pane, then click the
trending tab at the top of the page. On the trending screen, in the lower left hand corner, either
select the grid or graph view.
Grid View
1)
Allows the simultaneous viewing of multiple parameters over time.
2)
Displays data in a textual, grid format.
3)
Double click the parameter name at the top of each column to sort the entire table
by that column. An arrow appears indicating if the column is sorted in ascending or
descending order. To change from ascending to descending or vise versa, click the
column name again.
Fig 9-1: Grid view
12/3/20131 | 71-055 EN
NetEP User Manual
Trending
4)
To the left, the select data area is where the parameters are selected. Parameters
are grouped for easier navigation. By checking the group name, all the parameters
in that group are selected and displayed. In the example above, all the current data
is selected for viewing.
5)
Beneath the parameter selection area, is a time selection area. This allows the
selection of data only from certain periods. This can be either a specific date and
time – using the from\to dates or a time window. The time window shows the most
recent data in the window selected. In the example above, the period from 4/20 at
12:08 PM to 4/20 at 4:08 PM is displayed.
6)
Note that each parameter result has a time stamp associated with it. This makes it
easier to investigate events at specific times.
7)
To update the grid with data gathered since the trending window was initially
opened, click the refresh grid button in the center of the select data pane.
8)
Data from the grid view may by exported in a CSV format by right clicking in the grid
area. Enter a filename and location to save the CSV file.
Graph view
1)
Use the graph view to see a plot of a parameters value over time.
2)
To the left, the plots area is where the parameters you want to see are selected.
Parameters are grouped for easier navigation. Only one parameter can be selected
for viewing at a time. To select a parameter, double click it.
3)
Beneath the parameter selection area, is a time selection area. This allows the
selecting of data only from certain periods. This can be either a specific date and
time – using the from\to dates or a time window. The time window shows the most
recent data in the window selected. In the example below, data from April 20 at
12:08 PM to April 20 at 4:08 PM is displayed.
4)
To change the parameter graphed, simply double click on the parameter name in
the plots parameter pane.
5)
To update a time window graph, double click on the parameter name again.
6)
To change the period displayed, enter new values into the from and to date and
time fields. When done, click the refresh button at the far left of the trending tool
bar.
7)
To see a moving window, over time, select the use time window box. This display
always has now at the end of the X-axis. The data will literally scroll across the
display, showing a display similar to a strip chart for the parameter selected. This is
particularly useful for monitoring values, which may be changing frequently or
periodically.
8)
Trending graphs acan be shown with lines connecting the actual data points, or as
individual points. Use the line or point pull down to select how the graph will plot.
Point view is useful to understand if a transient event (for example a current spike)
was a sustained or single event. Using the point view, with one dot per data point
12/3/20131 | 71-055 EN
NetEP User Manual
Trending
acquired, it is very easy to tell if the event was present for multiple readings or just a
9)
single reading.
The trending graph does not support zooming capability when in the use time
Fig 9-2: Trending graph
window mode. The trending graph does support the zoom capabilities when in the
use dates mode.
Multiple Windows
1)
Like all other NetEP windows, the trending windows can be
minimized to display multiple windows, and therefore multiple
motors or multiple parameter graphs, at the same time. To do this, click the restore
down button in the upper right hand corner of the trending window.
2)
This makes the window smaller than the entire results screen area.
3)
Select another motor and parameter to trend, and set up the trending time period.
Click the restore down button on this window.
4)
On the NetEP toolbar, click the window menu item, and select tile horizontal to line
up the trending windows beneath each other.
5)
To see more data, the parameter selection pane can be hidden by clicking on the pin
icon in the upper right hand corner of the parameter selection pane. To get the
panel back, click on the select data box, then click the pin icon to keep the select data
area displayed. An example multiple window trending display is shown below.
12/3/20131 | 71-055 EN
NetEP User Manual
Fig 9-3: Trending graph, multiple windows
Trending
12/3/20131 | 71-055 EN
NetEP User Manual
Appendix A
Installing MS SQL Server or MS SQL Express 2005, 2008
(reference only)
Installing SQL Server or SQL Express 2005
Either Microsoft SQL Server 2005 or Microsoft SQL Express 2005 is required for the NetEP or
iNetEP server software to operate correctly. Purchase SQL Server from Microsoft, or download SQL
Express from Microsoft. While SQL Express costs less than SQL Server, it is limited to a 4GB
database size.
Note: This installation process is for reference only. When possible, use the most current
Microsoft installation process. The installation process may vary depending on version.
1)
On the End User License Agreement window, read the license agreement, and then
select the check box to accept the licensing terms and conditions. Accepting the
license agreement activates the Next button. To continue select Next.
Fig A-1: Microsoft SQL Server installing prerequisites
2)
The system will then verify the necessary components required for install. To begin
the component install process select Install.
3)
After all prerequisite installs are complete, select Next.
4)
On the welcome page of the installation wizard, select Next to proceed.
12/3/20131 | 71-055 EN
NetEP User Manual
Installing MS SQL Server or MS SQL Express 2005, 2008
Fig A-2: Installing Prerequisites
5)
6)
The System Configuration Check scans the installation computer for conditions that
may interfere with setup. (If there are problems, select Cancel, resolve the problems
and start again.)
Fig A-3: System configuration check
7)
8)
To proceed with setup when the scan completes, select Continue.
On the Registration Information window, enter name and company name within the
text boxes. To continue select Next.
9) On the Components to Install window, accept the default components installation
configuration by selecting Next.
10) On the Instance Name window, select the radio button for Default instance. To
continue, select Next.
11) On the Service account window, select Next.
12) On the Authentication Mode window, select Mixed Mode (as shown in Fig 3-4), and
enter a password for the sa (system administrator) account.
Note: REMEMBER THIS PASSWORD!
12/3/20131 | 71-055 EN
NetEP User Manual
Installing MS SQL Server or MS SQL Express 2005, 2008
13) After the password has been acknowledged, select Next to proceed.
Fig A-4: Authentication mode
14)
15)
16)
17)
On the Collation Settings window, select Next.
Accept the default Report Server Installation Options by selecting Next.
On the Error and Usage Report Settings window, select Next.
On the Ready to Install page, review the summary of features and components. To
proceed, select Install. Once installed, select Next.
18) On the Setup Progress page, monitor installation progress. When complete, select
Next. (This may take several minutes.)
19) On the Completing Setup Installation Wizard page, select Finish.
Configuring SQL to allow remote connections
1)
Go to Start – Programs – Microsoft Sql Server – Configuration Tools.
2)
3)
Launch the SQL Server Surface area configuration tool.
On the SQL Server Surface area configuration window, select Surface Area
Configuration for Service and Connections.
Within the tree below the Database Engine, select Remote Connections as shown.
Enable the radio buttons for:
Local and Remote Connections
Using both TCP/IP and named pipes
To proceed, select Apply.
4)
5)
6)
12/3/20131 | 71-055 EN
NetEP User Manual
Fig A-5: Surface Area Configuration
Installing MS SQL Server or MS SQL Express 2005, 2008
7)
Restart the Database Engine Service and the SQL Server Browser.
Restart Database Engine Server and SQL Service Browser
1)
2)
3)
4)
5)
6)
Go to Start – Programs-Microsoft SQL Server – Configuration Tools.
Launch the SQL Server Surface area configuration tool.
On the SQL Server Surface area configuration window, select Surface Area
Configuration for Service and Connections.
Disable service by selecting Stop.
From the Startup Type drop down box, select Automatic.
Selecting Apply will activate the Start button. To proceed, select Start.
Installing SQL Server or SQL Express 2005
Installing SQL Express 2008
1)
2)
Download and run the Sql Express 2008 installer .
Click installation on the left side of the wizard.
Fig A-6: Surface Area Configuration
12/3/20131 | 71-055 EN
NetEP User Manual
Installing MS SQL Server or MS SQL Express 2005, 2008
3)
4)
Click new SQL Server stand-alone installation or add features to an existing
installation. Click OK.
On the setup support rules page, click Next (the windows firewall warning is ok).
Fig A-7: SQL Express 2008
Fig A-8: Setup support rules
5)
The product key screen is all grayed out with the specify free edition selected. Click
next.
6)
Read the license agreement and if you agree to the terms place a check in the
checkbox, and click next
7)
Other components my be required in order to run the installer. Click install to install
these components.
8)
Another rules wizard will determine if there are any problems in running the SQL
setup files. Correct any failures and click next to continue.
9)
Place a check next to Database engine Services, Management Tools - Basic, and
any other features you would like install with your server and click next.
10) On the instance configuration, enter the instance name you would like to call your
server, and the root directory. The instance name is used to connect to your server.
12/3/20131 | 71-055 EN
NetEP User Manual
Installing MS SQL Server or MS SQL Express 2005, 2008
Fig A-9: Instance configuration
11) Click next on the disk space requirements screen.
12) On the Server Configuration dialog select NT AUTHORITY\NETWORK SERVICE for
SQL server database engine and click next.
Fig A-10: Server configuration
12/3/20131 | 71-055 EN
NetEP User Manual
Installing MS SQL Server or MS SQL Express 2005, 2008
13) On Database Configuration select "Mixed Mode" and enter a password for the
system administrator (sa) account. Rememeber this password you will need it to
access your server. Click Add Current User to create a Windows Administrator
account.
Fig A-11: Database engineer configuration
14) Click next on error usage and reporting.
15) Click next on Installation rules page if your system passed.
16) Verify that items listed to be installed are the items you want and click Install.
17) The installation process will begin. When it is complete verify that it installed
correctly and click next .
18) Click close to exit the installation wizard.
Configuring SQL Sever to Allow Remote Connection (XP)
1)
Go to Start->Program->Microsoft SQL Server 2008->Configuration Tools and
launch SQL server configuration manager.
2)
In the tree on the left pane click the plus next to SQL server network configuration,
then select protocols for SQLEXPRESS2008 where SQLEXPRESS2008 is the
instance name specified of the database engine during installation.
3)
In the right pane right click on TCP/IP and then select enable.
4)
Click ok on the message informing that there is a need to restart the services.
5)
In the left pane select SQL server services.
6)
In the right pane select SQL server right click and go to restart.
12/3/20131 | 71-055 EN
NetEP User Manual
Installing MS SQL Server or MS SQL Express 2005, 2008
Configuring Windows firewall to allow remote connection (Windows XP x 86)
1)
Right click on my network places and go to properties.
2)
Right click on your network connection and go to properties.
3)
Select the advanced tab.
4)
Click the settings button to modify Windows firewall.
5)
Click on the exceptions tab
6)
Click on the add program button.
7)
Click on the browse button and browse to the SQL server installation folder
(C:\Program Files\Microsoft SQL Server)\MSSQL10.SQLEXPRESS\MSSQL\Binn)
and select sqlservr.exe. then click open.
12/3/20131 | 71-055 EN
NetEP User Manual
Technical specifications
Appendix B
Technical specifications
Technical specifications and capabilities
−
−
Continuously monitor 108 parameters on up to 32 motors on up to 7 voltage busses
Peak, RMS, THD, TD, CF, unbalance, imbalance, power factor, input power and symmetrical components
for each V, I phase, and in total.
Time Waveform acquisitions
− Spectrum acquisition (3 phases, voltage and current)
− Rotor bar sideband amplitude
− Time waveform acquisition
− Torque Time Waveform, torque spectrum, torque swing
− Speed
− Power out
− % Load
− % efficiency
− Effective Service Factor
Identify preventative maintenance opportunities
− Set alarms for parameter limits
− Display trends for parameters
Surveryor capabilities
− At a glance status for all machines connected to all NetEP, iNetEP
− Dashboard showing 105 measurements
− Time waveforms
− Voltage, Current, Torque Spectrums with frequency markers, harmonics, sidebands
− Torque time waveform
− Trending
− Add, delete, modify machines, alarms, voltage busses
Specifications
AC Input Power
110 V – 240 V, 50/60 Hz, 2.0 A
Current Transformers
(CT)
5 A – 2000 A, up to 150 ft CT signal runs on Cat V cable, 18 K Hz
signal acquisition
Voltage Busses
Up to 7 different voltage busses, up to 1000 V direct input or PT’s,
line-to-line, line-to-neutral, external disconnect required.
12/3/20131 | 71-055 EN
NetEP User Manual
Technical specifications
NetEP technical specifications
Environmental
− Size: 27.6 in x 19.7 in x 8.3 in
− Weight: NetEP: 56 lbs
− Enclosure: IP52, NEMA 12 (With Feedthru Plate Hole Plugs Installed)
− Operating Temperature: 0 °C to +50 °C Ambient
− Maximum Relative Humidity: 80% non-condensing
− Pollution Degree II
Standard Compliance
− Safety: UL 61010-1, EN 61010-1
− EMC: EN 61000-3/-2-3, EN 61000-4/-2-3-4-5-6-8-11, EN 61000-6/-2-4
NetEP Device Computer
− 1.0GHz Celeron or 1.4GHz Pentium EPIC SBC or Equivalent
− Memory: 2GB or Better
− Compact Flash: 4GB or Better
External Interfaces
− Ethernet RJ45, Video, USB
Ethernet Communication
− 10M/100M BaseT
NetEP Device Data Storage
− Storage Time Without Network Connection: Greater Than 1 Day - Typical (Depends on
number of motors Scheduled)
Desktop Computer Requirements (Computer not provided by Baker/SKF)
− 5 GB Free Disc Space
− Windows XP, Vista or 7
− 1 GHz Pentimum Processor
− 256 Color Display
− 2 GB RAM
− 15” Display or Larger Recommended
− 10/100 LAN Connection
Server Requirements (Computer not provided by Baker/SKF)
− 2 GHz Pentium, Core2 Duo or Equivalent
− 2 GB RAM
− 10 GB Free Disc Space per NetEP Connected
− Windows XP, Vista, 7 or Server 2003
− 10/100 LAN Connection
− Microsoft SQL or SQL Express
− Static IP Address
− UPS Recommended
Voltage Bus Inputs
− 7 Three-Phase Voltage Bus Inputs
− 1000 VAC Maximum
− Measurement Category III
− Input Impedance: 2 MΩ per phase
12/3/20131 | 71-055 EN
NetEP User Manual
Technical specifications
−
−
−
−
Amplitude Accuracy at 50/60Hz: ± 2% After Calibration
Amplitude Resolution: 170mV
Phase Accuracy at 50/60Hz: 0.4° Dwell, 1.0° Round-Robin
External Disconnect Required
Current Transformer Inputs
− 32 Three-Phase AC Induction Machine CT Inputs (Voltage Output CTs)
− CT Options: 5A, 50A, 200A, 600A (Both Solid and Split-Core)
− Amplitude Accuracy at 50/60Hz: 2% (>1.0 A current level) after calibration
Phase Accuracy at 50/60Hz:
− 5A Solid Core CT: < 4° Variation from 10% to 100% Rated Current After Calibration - Typical
− 50A Solid Core CT: < 2° Variation from 10% to 100% Rated Current After Calibration - Typical
− 200A Solid Core CT: < 2° Variation from 10% to 100% Rated Current After Calibration - Typical
− 5A Split Core CT: < 2° Variation from 10% to 100% Rated Current After Calibration - Typical
− 50A Split Core CT: < 2° Variation from 10% to 100% Rated Current After Calibration - Typical
− 200A Split Core CT: < 2° Variation from 10% to 100% Rated Current After Calibration - Typical
− 600A Split Core CT: < 3.5° Variation from 10% to 60% of Rated Current After Calibration - Typical
Frequency Response: 50Hz – 4000 Hz - Typical
Analog Measurement
− 16-bit ADC resolution
− 400 kS/s Aggregate Sampling Rate Maximum
− Frequency Range: DC to 6kHz
Calibration
− Recommended Interval: 12 Months
− Portable Calibration CTs Available
Analysis
− Time Waveforms
− Voltage, Current and Torque Spectra:
− Fmax to 6000Hz. Acquisition times from 30 to 120 seconds. Lines of resolution from 300 to
2.16M. Frequency resolution from 0.004Hz to 0.033Hz.
− Voltage Level - Per Phase and Average
− Voltage Phase Angle - Per Phase
− Voltage Unbalance
− Voltage Distortion
− Current Level, including Peak, and Phase Angle
− Current Phase Angle - Per Phase
− Current Unbalance
− Symmetrical Components
− Impedance Level and Angle
− Harmonics – Up to 100th
− Power - Real, Reactive and Apparent, Per Phase and Sum
− Power Factor - Displacement and Harmonic, Per Phase and Average
− Crest Factor - Voltage and Current, Per Phase and Average
− Fundamental Frequency
− Speed
− Efficiency*
− Torque - Instantaneous and Average (IEEE 1255-2000)*
− HP/kW*
12/3/20131 | 71-055 EN
NetEP User Manual
Technical specifications
−
−
−
Percent Load*
Effective service factor
Rotor bar assessment
Features
− Round-robin
− Six alarm levels per parameter, up to 38 parameters per motor alarmed
− Data buffering in flash or hard drive when communication link is down: one day - typical
− Self-test capability
* Line-to-Line Stator Resistance (Hot) Required for Best Accuracy
Note: Information, specifications or capabilities published in this user manual are
subject to change without notice.
12/3/20131 | 71-055 EN
NetEP User Manual
Index
A
P
Acknowledging alarms · 57
Aggregate Power Measurements · 45
Alarm parameters · 57
Alarms · 56, 57, 59
Power data · 44
C
R
rotor cage · 40, 49
Crest factor · 46
Current · 35, 38, 40, 41, 50, 51, 52, 58, 62, 67
S
D
Safety · 12, 51
Software · 3, 4, 5, 6, 14
Spectrum Plots · 69
Squirrel cage induction machine · 51
Dashboard · 62, 64
Diecast or manufactured squirrel cage: · 51
Distortion · 37, 38, 41, 42, 58, 72
E
Enabling alarms · 59
H
Harmonic voltage factor · 42
Harmonics · 41, 71, 72, 73
T
Time waveform plots · 67
Torque · 38, 39, 43, 50, 54, 74, 75
torque spectrum · 44, 48, 54, 62, 74, 75
Total harmonic distortion · 41, 42, 73
Trending · 50, 54, 78, 79
V
Viewing alarm status · 59
Voltage · 12, 16, 35, 38, 42, 47, 48, 52, 58,
62, 67
M
Machines · 40
Markers · 70, 76
Mitigation · 51
N
W
warnings · 12, 13
Wound rotor induction machine · 51
Z
Network configuration · 16
Zoom · 68, 74
12/3/20131 | 71-055 EN
NetEP User Manual
Index
12/3/20131 | 71-055 EN
NetEP User Manual