1
UNIVERSITÄT STUTTGART
INSTITUT FÜR ELEKTRISCHE UND
OPTISCHE NACHRICHTENTECHNIK
PROF. DR.-ING. MANFRED BERROTH
PFAFFENWALDRING 47
70569 STUTTGART
DEUTSCHLAND
-148.00
RENSSELAER POLYTECHNIC INSTITUTE
ELECTRICAL, COMPUTER AND
SYSTEMS ENGINEERING DEPARTMENT
PROF. MICHAEL SHUR
110 8TH STREET
TROY, NY 12180
USA
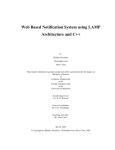
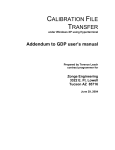
Correlation coefficient: 0.06 ± 0.19
SI(100Hz), (dBArms/√ Hz)
-149.00
-150.00
-151.00
-152.00
-153.00
-154.00
-155.00
-156.00
2.50
2.75
3.00
3.25
3.50
3.75
Fmin(2GHz), (dB)
CORRELATION BETWEEN THE FLICKER AND THE MICROWAVE NOISE OF
GALLIUM NITRIDE HETEROSTRUCTURE FIELD EFFECT TRANSISTORS
TOBIAS WERNER
ELECTRICAL ENGINEERING
UNIVERSITY OF STUTTGART
MATRIKELNUMMER 1710551
DIPLOMA THESIS
DECEMBER 1999 - DECEMBER 2000
ACKNOWLEDGMENT
This Diploma thesis owes its existence to the help, support, and inspiration of many people.
First of all, I would like to express my gratitude to Prof. Dr.-Ing. Manfred Berroth, head of
the Institut für Elektrische und Optische Nachrichtentechnik (INT) at the University of
Stuttgart, for taking the responsibility for these studies and making this stay at the Rensselaer
Polytechnic Institute (RPI) in New York possible.
I also would like to express my sincere appreciation and thankfulness to Prof. Michael Shur
of the Semiconductor Device Research Group (SDG) at RPI, for his support during this year
of my thesis work.
The discussions and cooperation with all of my colleagues have contributed to this work:
Jianyu Deng, Doctoral candidate at the RPI, has been an inexhaustible source for discussions
on all kinds of microwave noise related aspects; Serguei Roumiantsev provided many
comments and suggestions concerning the low frequency noise setup and the mechanisms of
flicker noise.
I also extend my appreciation to all staff members of the institute for their assistance and
help. It was a great pleasure for me to work with them and the friendly atmosphere in the
SDG turned work into pleasure.
Finally, I owe special gratitude to my family for their continuous support and to my fiancée
Sabine for her patience, understanding and love.
ABSTRACT
The correlation between the low frequency flicker noise and the microwave noise at room
temperature of gallium nitride (GaN) heterostructure field effect transistors (HFETs) is
investigated.
The study is based on a comparison between the noise levels of the microwave and the
flicker noise. The minimum noise figure Fmin at 2 GHz represents the microwave noise and
the spectral voltage noise density SV , the spectral current noise density S I , the relative
spectral current noise density S I / I 2 or the Hooge parameter α H at 100 Hz expresses the
flicker noise.
Both noise types are functions of the applied voltages at the gate and drain of the transistor,
but show different behavior. Whereas the optimum bias condition for lowest microwave
noise is in saturation and the noise in the linear region of the transistor is considerably
higher, it behaves in reverse with the flicker noise.
Due to this bias dependence three approaches are chosen to analyze a possible dependence
between the two dominant types of noise in the microwave and low frequency domain:
1) Lowest noise: Fmin in saturation is compared to SV , S I , S I / I 2 and α H in the
linear region for several transistors.
2) Identical bias condition: Fmin is compared to SV and S I for an identical bias
condition in saturation for several transistors.
3) Entire bias range: Fmin is compared to SV and S I for an identical bias condition
for one transistor and several bias conditions. This method was also carried out for
Fmin at additional frequencies of 10 GHz and 26 GHz.
With the aid of the correlation coefficient the dependence of the two noise types is evaluated
and scatter diagrams are used to verify graphically the calculated result.
The spectral current noise density S I appears to be the most expressive parameter to refer to
the flicker noise and correlation coefficients between 0 and -0.3 with an absolute error of
±0.2, due to a small number of observations, are obtained. The small correlation coefficient
is supported by a widely spread point constellation, covering the entire plot area of the
scatter diagrams, which shows no dependence between the flicker and the microwave noise.
TOBIAS WERNER
CORRELATION BETWEEN THE FLICKER AND THE MICROWAVE NOISE OF GAN HFETS
PAGE 1 / 141
TABLE OF CONTENTS
1 INTRODUCTION............................................................................................................... 4
2 NOISE .................................................................................................................................. 6
2.1 FLICKER NOISE OR 1/F-NOISE ......................................................................................... 6
2.1.1 The Hooge parameter ............................................................................................. 7
2.2 MICROWAVE NOISE ........................................................................................................ 8
2.2.1 Theory of microwave noise measurement ............................................................... 9
3 ANALYZED TRANSISTORS ......................................................................................... 10
3.1 TYPICAL DEVICE PERFORMANCE .................................................................................. 12
4 MEASUREMENT SETUP............................................................................................... 17
4.1 MICROWAVE NOISE SETUP ........................................................................................... 17
4.1.1 S-parameter configuration .................................................................................... 19
4.1.2 Noise configuration............................................................................................... 22
4.2 LOW FREQUENCY NOISE SETUP .................................................................................... 25
4.2.1 Measurement with the SR770................................................................................ 27
5 MEASUREMENT RESULTS ......................................................................................... 31
5.1 FLICKER NOISE ............................................................................................................. 31
5.2 MICROWAVE NOISE ...................................................................................................... 34
5.3 CORRELATION BETWEEN THE FLICKER AND THE MICROWAVE NOISE.......................... 35
5.4 METHOD A: BIAS CONDITION FOR LOWEST NOISE ....................................................... 36
5.4.1 Results for GaNHFET10 ....................................................................................... 37
5.4.2 Results for GaNHFET08 ....................................................................................... 40
5.4.3 Results for GaNHFET04 ....................................................................................... 43
5.5 METHOD B: SAME BIAS CONDITION ............................................................................. 45
5.5.1 Results for GaNHFET10, bias condition 1 ........................................................... 46
5.5.2 Results for GaNHFET10, bias condition 2, worst case ........................................ 48
5.6 METHOD C: ENTIRE BIAS RANGE ................................................................................. 50
5.6.1 Results for GaNHFET01 ....................................................................................... 50
6 CONCLUSION.................................................................................................................. 53
TOBIAS WERNER
CORRELATION BETWEEN THE FLICKER AND THE MICROWAVE NOISE OF GAN HFETS
PAGE 2 / 141
APPENDIX A: SYMBOLS AND ABBREVIATIONS ..................................................... 54
APPENDIX B: DERIVATIONS FOR THE FLICKER NOISE ..................................... 57
B.1 DERIVATION OF THE EQUATION RELATING SI WITH SV ............................................... 57
B.1.1 Linear region ........................................................................................................ 57
B.1.2 Saturation region.................................................................................................. 59
B.2 ESTIMATION OF RRES FOR THE PRESENT MEASUREMENT SYSTEM ................................ 60
B.3 ESTIMATION OF THE DIFFERENTIAL RESISTANCE R ..................................................... 62
APPENDIX C: CORRELATION....................................................................................... 63
C.1 THE CORRELATION COEFFICIENT ................................................................................ 63
C.2 LEAST SQUARE REGRESSION ....................................................................................... 64
C.3 OBSERVATION RANGE.................................................................................................. 65
C.4 THE COEFFICIENT OF DETERMINATION ....................................................................... 66
C.5 ERROR DUE TO SMALL NUMBER OF OBSERVATIONS .................................................... 67
APPENDIX D: WAVER INFORMATION....................................................................... 68
D.1 GANHFET01............................................................................................................... 68
D.1.1 Typical material properties.................................................................................. 68
D.1.2 Layer structure ..................................................................................................... 68
D.1.3 Typical DC-characteristics .................................................................................. 69
D.1.4 Waver map ........................................................................................................... 70
D.2 GANHFET04............................................................................................................... 71
D.2.1 Typical material properties.................................................................................. 71
D.2.2 Layer structure ..................................................................................................... 71
D.2.3 Typical DC-characteristics .................................................................................. 72
D.2.4 Waver map ........................................................................................................... 73
D.3 GANHFET08............................................................................................................... 74
D.3.1 Typical material properties.................................................................................. 74
D.3.2 Layer structure ..................................................................................................... 74
D.3.3 Typical DC-characteristics .................................................................................. 75
D.3.4 Waver map ........................................................................................................... 76
D.4 GANHFET10............................................................................................................... 77
D.4.1 Typical material properties.................................................................................. 77
D.4.2 Layer structure ..................................................................................................... 77
D.4.3 Typical DC-characteristics .................................................................................. 78
D.4.4 Noise and gain parameters .................................................................................. 79
D.4.5 Waver map ........................................................................................................... 80
TOBIAS WERNER
CORRELATION BETWEEN THE FLICKER AND THE MICROWAVE NOISE OF GAN HFETS
PAGE 3 / 141
APPENDIX E: LOW FREQUENCY NOISE MEASUREMENT PROGRAM............. 81
E.1 SMOOTHING OF THE GRAPH ......................................................................................... 81
E.2 DESIGN OF THE PROGRAM ............................................................................................ 83
E.3 MANUAL ...................................................................................................................... 85
E.4 PROGRAM CODE........................................................................................................... 86
E.4.1 Header file: FlickerNoiseMeasurement.h ............................................................ 86
E.4.2 Header file: FlickerNoiseMeasurementDlg.h....................................................... 86
E.4.3 Implementation file: FlickerNoiseMeasurement.cpp............................................ 88
E.4.4 Implementation file: FlickerNoiseMeasurementDlg.cpp...................................... 89
APPENDIX F: FIXTURE CHARACTERIZATION ..................................................... 107
F.1 SYSTEMATIC APPROACH ............................................................................................ 109
F.2 PHASE AMBIGUITY ..................................................................................................... 112
F.3 MATLAB PROGRAM .................................................................................................... 114
F.4 VERIFICATION OF THE RESULTS ................................................................................. 115
F.5 MATLAB SOURCE CODE .............................................................................................. 116
APPENDIX G: MICROWAVE SWITCH CONTROL ................................................. 121
G.1 MICROWAVE SWITCHES ............................................................................................. 122
G.2 HARDWARE ............................................................................................................... 123
G.2.1 Schematic ........................................................................................................... 123
G.2.2 Layout................................................................................................................. 125
G.2.3 Printed circuit board.......................................................................................... 126
G.3 SOFTWARE ................................................................................................................. 126
G.3.1 Program code..................................................................................................... 127
G.3.1.1 Header file: LPTSwitchRemote.h ............................................................... 127
G.3.1.2 Header file: LPTSwitchRemoteDlg.h ......................................................... 127
G.3.1.3 Implementation file: LPTSwitchRemote.cpp.............................................. 128
G.3.1.4 Implementation file: LPTSwitchRemoteDlg.cpp........................................ 129
APPENDIX H: INDEXES................................................................................................. 132
H.1 FIGURE INDEX ............................................................................................................ 132
H.2 TABLE INDEX ............................................................................................................. 136
H.3 EQUATION INDEX ....................................................................................................... 137
APPENDIX I: REFERENCES ......................................................................................... 139
I.1 NOISE .......................................................................................................................... 139
I.2 CORRELATION ............................................................................................................. 141
I.3 MEASUREMENT TECHNIQUES ...................................................................................... 141
TOBIAS WERNER
CORRELATION BETWEEN THE FLICKER AND THE MICROWAVE NOISE OF GAN HFETS
PAGE 4 / 141
1 INTRODUCTION
Electronic devices and systems exhibit random fluctuations in the voltage or current at their
terminals, and these fluctuations are usually referred to as noise. Noise is present in every
electronic system and is unwanted because it limits its performance.
a)
b)
c)
Fig. 1.1: Noise distorting (a) an analog signal (b) a regeneratable digital signal,
and (c) a non-regeneratable digital signal.
In analog systems noise distorts a processed signal (Fig. 1.1a) and cannot be separated from
it because of the non-deterministic nature of noise. As a result the signal-to-noise ratio of an
amplifier chain decreases since not only the signal but also the noise is amplified and every
stage adds its own noise contribution. In digital systems the signal (Fig. 1.1b) can be
regenerated but the importance of noise becomes more and more significant as the trend to
lower supply voltages continues (Fig. 1.1c). Thus the reduction of noise is important for both
analog and digital systems.
Electronic noise may be conveniently divided into two categories determined by the noise
source. In the first category the noise source is external to the device under consideration. In
the second category the noise is generated within the circuit element and is called intrinsic
noise.
This work investigates the intrinsic noise behavior of the basic component of electronics,
semiconductor devices. Several aspects, like device geometry or material quality affect the
noise level of transistors. In order to understand the complex interplay between these
parameters and to be able to reduce the noise, the underlying physical phenomena have to be
studied and understood. Often only the assistance of simulation tools can help to gain an idea
about the interaction of different noise origins, but this requires valid noise models.
The dependence of two noise types, namely the flicker or 1/f -noise and the microwave noise,
of gallium nitride (GaN) heterostructure field effect transistors (HFETs) at room temperature
was studied.
TOBIAS WERNER
CORRELATION BETWEEN THE FLICKER AND THE MICROWAVE NOISE OF GAN HFETS
PAGE 5 / 141
Whereas the microwave noise originates in thermal fluctuations of electrons the experts still
lead controversial discussions about the origins of flicker noise. For GaN HFETs with the
electron transport in the two-dimensional electron gas a possible explanation is that traps in
the space-charge region under the gate generate the flicker noise. The trapping and
detrapping of electrons gives rise to a 1/f modulation of the channel conductance, and this
produces flicker noise in the drain current [1].
The flicker and the microwave noise are the dominant sources of noise in the low frequency
and microwave region, respectively. The demand of industry goes to ever increasing
frequencies and one could wonder, why it is important to analyze low frequency noise. This
is due to the fact, that the low frequency noise is up-converted to a higher frequency band
and can there interfere with the main signal, if, for example, a transistor is applied in an
oscillator circuit [2].
GaN is a new promising material combination, especially for high power applications, due to
its higher breakdown voltage in comparison to the state-of-the-art technology, gallium
arsenide (GaAs). For GaN semiconductors a share of the market of 3 billion dollars was
forecasted for the year 20061.
The expression heterostructure denotes that a wide band gap semiconductor layer (AlGaN)
is brought together with a narrow band gap semiconductor layer (GaN). Due to the
difference in electron affinities of these two layers a two-dimensional electron gas (2DEG) is
formed at the so-called heterointerface, what results in an improved electron mobility and
electron velocity.
With the result of this investigation important conclusions can be drawn concerning the noise
mechanisms in semiconductors. This can help to improve noise models and thus to better
predict the noise performance of semiconductors.
The measurement process to determine the minimum noise figure is more complex and thus
more time consuming than the characterization of the flicker noise. Therefore, if dependence
between the flicker and the microwave noise could be found, quicker noise determination of
analyzed devices could be performed.
In Chapter 1 we will introduce different kind of noise with a focus on flicker noise and
microwave noise.
Chapter 2 will give a brief overview about the analyzed transistors, their characteristics and
typical device performance.
To characterize the noise properties of the transistors in the low frequency and the
microwave region two different measurement setups were used and will be presented in
Chapter 3.
In Chapter 4 the obtained measurement results for the flicker and the microwave noise will
be discussed and examined for a possible correlation.
In Chapter 5 we will compare and summarize the obtained results and draw a conclusion.
In the Appendix explanations of the used symbols and abbreviations, long derivations,
specific waver information, program listings, and the references can be found.
1
III-Vs, vol 11, No 1, p. 7, Jan-Feb 1998
TOBIAS WERNER
CORRELATION BETWEEN THE FLICKER AND THE MICROWAVE NOISE OF GAN HFETS
PAGE 6 / 141
2 NOISE
Noise arising in an electronic component or a device is historically classified as thermal
noise, shot noise, or flicker noise.
Thermal noise occurs in any conductor due to the random motion of electrons caused by
thermal agitation. In 1928 Johnson experimentally verified Schottky's theory that the thermal
noise voltage depends only on resistance, temperature and bandwidth and is independent of
material and shape [3]. Because of this discovery thermal noise is also called Johnson noise.
At the same time H. Nyquist showed that the available noise power is always k ⋅ T ⋅ B ,
where B is the equivalent noise bandwidth, T the absolute temperature and k the
Boltzmann constant [4].
Shot noise and flicker noise, which are also called excess noise as a generic name, are
present only when current flows through a conductor by an external means. Flicker noise is
influenced by surface state and bulk imperfection and cannot be described by simple
physical explanations as thermal noise. Since flicker noise has a 1/fγ dependence with γ close
to unity, this noise is often called 1/f-noise.
The dominant noise types in GaN HFETs are the flicker noise in the low frequency range
and the microwave noise for elevated frequencies in the microwave range. The flicker noise
is often overlaid by the so-called generation recombination noise (GR-noise), which is
caused by fluctuations in the number of free carriers and can be related to the presence of
trap centers in the forbidden gap [5].
2.1 Flicker noise or 1/f-noise
When current passes through a resistor or a semiconductor, noise is generated in excess of
the thermal noise in a resistor or the thermal noise plus the shot noise in a semiconductor.
This excess noise has a spectral density, which increases, as the frequency decreases and,
because it is most noticeable at low frequency, it is also known as low frequency noise. In
addition, it is known as flicker noise because of the flickering of a the needle on a meter
measuring the current with a significant component of this type of noise, and used to be
known as semiconductor noise since the noise in early semiconductor devices was
dominated by this type [6].
Numerous scientists have investigated the phenomenon of flicker noise in semiconductor
devices but the details of the mechanisms involved are still not entirely understood. There is
no consensus to the origin of the 1/f-noise and it is very likely that there exist more than one
mechanism, giving rise to the same noise characteristics.
TOBIAS WERNER
CORRELATION BETWEEN THE FLICKER AND THE MICROWAVE NOISE OF GAN HFETS
PAGE 7 / 141
It appears that 1/f-noise can be a surface effect and a bulk effect and the physical origins of
the noise presumably being different in the two cases.
According to McWhorter’s number fluctuation theory [7], 1/f-noise is attributed to the
trapping and detrapping processes of the charges in the oxide traps. Hooge’s empirical model
[8] considers the 1/f-noise as a result of carrier mobility fluctuation due to lattice scattering.
It has been reported that both the carrier number fluctuation and the mobility fluctuation are
possible mechanisms, which lead to the 1/f-noise.
The 1/f-noise in HFETs was at first rather large, extending to 1 GHz. It varied as I d 2 at low
drain currents. The 1/f-noise seems to be generated by traps in the space-charge region under
the gate. The trapping and detrapping of electrons gives rise to a 1/f modulation of the
channel conductance, and this produces 1/f-noise in the drain current. It is not quite clear
how trapping and detrapping of electrons in the space-charge region can give a 1/f
modulation; a distribution in time constants might be responsible [1].
For HFET devices with carrier transport exclusively in the 2DEG, it seems reasonable, that
the hetero interface contributes to the noise by exchanging electrons with the channel [9].
Flicker noise depends on many parameters like temperature, frequency, bias condition,
device geometry, or material characteristic (doping level, layer structure and thickness, etc.).
The noise level can be expressed by the spectral voltage noise density SV , the spectral
current noise density S I , the relative spectral current noise density S I / I 2 or by the
dimensionless Hooge parameter α H .
2.1.1 The Hooge parameter
Hooge proposed in the late 1960s that 1/f fluctuations in all homogeneous materials could be
represented by the empirical formula [10]
S r (ω )
R02
=
αH
N tot ⋅ f
,
(2.1)
where N tot is the total number of charge carriers in the specimen, R0 is the mean resistance,
S r (ω ) is the power spectral density of resistance fluctuations, and α H ≈ 2.0E-3 is a
universal constant.
Later experiments showed that the Hooge parameter is not constant, but can vary between
several orders of magnitude. α H of GaN devices lies in a range of about 1.0E-5 to 1.0E-1
[5], [11]. The Hooge parameter can also be written as [12]
αH =
SI
Id 2
⋅ f ⋅N,
(2.2)
TOBIAS WERNER
CORRELATION BETWEEN THE FLICKER AND THE MICROWAVE NOISE OF GAN HFETS
PAGE 8 / 141
with N the number of carriers and I d the drain source current and can be used to express
the noise level of a transistor for low drain biases.
As mentioned before, equation (2.2) is only valid for homogenous materials. If high drain
source voltages are applied to the device, the electron distribution in the channel gets
inhomogeneous and the use of the Hooge parameter is questionable. Furthermore, the flicker
noise is proportional to I d 2 in the linear region of the transistor, i.e. for low drain source
voltages. Therefore the flicker noise is often normalized to I 2 and also the Hooge parameter
normalizes on this parameter. In saturation however, i.e. for elevated drain source voltages,
the flicker noise is no longer proportional to the squared drain source current and the
normalization and with it the use of the Hooge parameter to express the noise level of the
transistor gets again doubtful.
The Hooge parameter α H takes into account different drain source spacings of compared
transistors by the estimation of the number of carriers N in the source-drain-region.
N can be calculated by
N = w ⋅ l ⋅ ns ,
(2.3)
with the electron sheet density n s , which is determined by measurement, the gate width w ,
and l , the spacing between source and drain (Fig. 2.1).
Fig. 2.1: Dimensions of a transistor.
2.2 Microwave noise
A field effect transistor (FET) can be considered as a voltage controlled resistor. Thermal
noise of this resistor, the channel, plays the dominant role in the microwave region, where
the flicker and GR-noise vanishes.
The microwave noise is a function of temperature, frequency, bias condition, device
geometry, or material characteristics and depends further on the source reflection coefficient
Γ s . The noise level is usually characterized by the noise figure F in dB.
TOBIAS WERNER
CORRELATION BETWEEN THE FLICKER AND THE MICROWAVE NOISE OF GAN HFETS
PAGE 9 / 141
2.2.1 Theory of microwave noise measurement
The noise figure of linear two-ports is a function of the source admittance [13]. The general
equation expressing the noise figure of a network as a function of source reflection
coefficient Γ s is
F = Fmin +
4 ⋅ Rn
⋅
Z0
Γ s − Γ opt
1 + Γ opt
2
(
⋅ 1 − ΓS
2
)
,
(2.4)
where Γ opt is the complex source reflecting coefficient that results in the minimum noise
figure Fmin of the network, Z 0 is the reference impedance for defining Γ s (usually 50 Ω)
and Rn is called the equivalent noise resistance and is an empirical constant with the
dimension of a resistance, relating the sensitivity of the noise figure to the source admittance.
The noise properties of a device are fully characterized by these four noise parameters.
To find Fmin , Γ opt and Rn the noise figure F must be measured at a variety of source
impedances. In principle, since four scalar variables ( Γ opt is complex!) are to be found, only
four measurements are required. In practice, however, more points are measured, and a least
mean square technique is applied to extract the parameters from the over-determined data.
Noise characterization also requires the parameters of the device under test (DUT) to be
separated from the parameters of the measurement system, to which the DUT is connected.
To do this, the system must be calibrated to compensate the system contribution.
The noise contribution of the system (often called the second stage since it follows the DUT)
will vary with its source impedance according to (2.4). Therefore, the complete noise and
gain parameters of the system must be known to determine the system noise contribution
when a particular DUT is connected. This consists of measuring the total noise figure, Ftotal ,
with several different source impedances. The noise figure Fdut of the DUT for each
position is then given from the Friis's cascade equation [14] in (2.5).
Fdut = Ftotal −
Fsys − 1
Gdut
(2.5)
Gdut is the available gain of the DUT and is resolved from the DUT's S-parameters and the
source reflection coefficient.
TOBIAS WERNER
CORRELATION BETWEEN THE FLICKER AND THE MICROWAVE NOISE OF GAN HFETS
PAGE 10 / 141
3 ANALYZED TRANSISTORS
The first Field Effect Transistor (FET) was already proposed in 1930 by Lilienfeld. The FET
is a three-terminal device in which the current through two terminals (source and drain) is
controlled by a voltage at the third terminal (gate). It is a majority carrier device and is
therefore often called a unipolar transistor.
The FET comes in several forms. In a Junction Field Effect Transistor (JFET) the control
gate voltage varies the depletion width of a reverse-biased p-n junction. A similar device
results if the junction is replaced by a Schottky barrier (MEtal Semiconductor Field Effect
Transistor, MESFET). Alternatively the metal gate electrode may be separated from the
semiconductor by an insulator (Metal Insulator Semiconductor Field Effect Transistor,
MISFET). The Metal Oxide Semiconductor Field Effect Transistor (MOSFET) is a common
special case of this type and uses an oxide layer as the insulator.
Since the MESFET is compatible with the use of III-V compounds, it is possible to exploit
the band gap engineering available with heterojunctions in these materials. In order to
maintain high transconductance in a MESFET, the channel conductivity must be as high as
possible. Increasing the doping in the channel and thus the carrier concentration increases the
conductivity. However, increased doping also causes increased scattering by ionized
impurities, which leads to a degradation of mobility. What is needed is a way of creating a
high electron concentration in the channel of a MESFET by some other means than doping.
An approach to this requirement is to grow a thin undoped well (e.g. GaN) bounded by wider
band gap, doped barriers (e.g. AlGaN). This configuration, called modulation doping, results
in conductive GaN when electrons from the doped AlGaN barrier fall into the well and
become trapped there. Since the donors are in the AlGaN rather than the GaN, there is no
impurity scattering of electrons in the well. This device is called a MOdulation Doped Field
Effect Transistor (MODFET) or High Electron Mobility Transistor (HEMT). It is also called
Heterostructure Field Effect Transistor (HFET), Two Dimensional Electron-Gas Field Effect
Transistor (TEGFET) or Selectively Doped Heterostructure Field Effect Transistor
(SDHFET).
When two different semiconductors layers are joined together, the atoms at the interface
have to form chemical bonds. Due to a difference in the electron affinity of these two layers
a two dimensional gas (2DEG) is formed at the so-called heterointerface.
In HFET a wide band gap semiconductor layer separates the gate from the channel
(Fig. 3.1). At the heterointerface between the wide and narrow band gap semiconductor
layers a 2DEG is formed and carries the drain-to-source current.
TOBIAS WERNER
CORRELATION BETWEEN THE FLICKER AND THE MICROWAVE NOISE OF GAN HFETS
PAGE 11 / 141
Fig. 3.1: Examples of modulation doped layers for HFETs.
All analyzed devices were AlGaN/GaN HFETs with an aluminum mole fraction of 15 to 20
percent and were grown on a sapphire or SiC substrate.
The devices were processed in collaboration with Cornell and the University of California
Santa Barbara and were fabricated with a Metal Organic Chemical Vapor Deposition
(MOCVD). The surface was non-passivated.
The carrier sheet density was in the order of 1.1E+13 cm-2 and the mobility varied between
1000 and 1400 cm2/V/s.
All transistors had a T-shaped gate (Fig. 3.2) with a quarter micron gate length and
100 micron gate width.
Fig. 3.2: Examples of GaN HFETs with T-shaped gate.
The waver maps, which describe the location of the analyzed transistors on different wafers,
and specific layer structures and parameters, can be found in Appendix D: Waver
information.
TOBIAS WERNER
CORRELATION BETWEEN THE FLICKER AND THE MICROWAVE NOISE OF GAN HFETS
PAGE 12 / 141
3.1 Typical device performance
Measurement results vary from transistor to transistor and from waver to waver due to the
complex fabrication process. Numerous transistors on four different wavers were examined
and the following graphs represent typical measurement results.
In Fig. 3.3 a current voltage characteristic of a GaN HFET is compared to that of a GaAs
Pseudomorphic High Electron Mobility Transistor (PHEMT). The drain source current I D
and the gate current I G are plotted versus the drain source voltage V D for different gate
source voltages VG . The GaN HFET can stand much higher drain source voltages due to the
elevated breakdown voltage of GaN devices [15]-[17], what can be noticed by the increased
drain voltage range in Fig. 3.3a. While the slope in saturation of the output characteristic
( I D (VG ) vs. V D ) in saturation is positive for GaAs devices (Fig. 3.3b), it shows typically a
negative tendency for GaN HFETs (Fig. 3.3b).
a)
b)
Fig. 3.3: Typical current voltage characteristic of (a) GaN HFETs
in comparison to (b) GaAs PHEMTs.
The gate current is often referred to as the gate leakage current, because ideally it should be
zero for field effect transistors. The HFET devices show a low gate leakage current in the
range of µA, what is especially important for low flicker noise [12].
Fig. 3.4 shows typical S-parameters of a GaN HFET from 2 GHz to 10 GHz for a bias
condition of V D = 10 V and VG = -0.5 V. The S-parameters S 11 and S 22 are typically
presented in a smith chart (lower half of Fig. 3.4) and S 12 and S 21 in a polar chart (upper
half of Fig. 3.4). Nearly all measured devices demonstrated a S 21 smaller than unity at a
reference system impedance of 50 Ω .
TOBIAS WERNER
CORRELATION BETWEEN THE FLICKER AND THE MICROWAVE NOISE OF GAN HFETS
PAGE 13 / 141
Fig. 3.4: S-parameters of a GaN HFET versus frequency at a certain bias condition.
Typically the S21 is smaller than unity at a reference impedance of 50 Ohms.
Over all analyzed samples the minimum noise figure Fmin , which describes the noise level
of the transistor in the microwave region, varied between 0.54 to 10 dB at 2 GHz at an
optimum bias condition in the saturation region of the transistor.
The frequency dependence of the minimum noise figure Fmin and the associated gain Ga at
room temperature from 2 GHz to 26 GHz is shown in Fig. 3.5. For increasing frequencies,
Fmin quickly increases and G a decreases. To compare this result to the state-of-the-art
technology, the lowest noise level of commercial GaAs transistors is also plotted to the chart.
The comparison indicates that the noise performance of GaN HFETs still has to be improved
to compete with GaAs.
Fig. 3.5: Frequency dependence of the minimum noise figure and
the associated gain of GaN HFETs at room temperature.
TOBIAS WERNER
CORRELATION BETWEEN THE FLICKER AND THE MICROWAVE NOISE OF GAN HFETS
PAGE 14 / 141
The bias dependence of two noise parameters can be seen in Fig. 3.6. In the x-y plane the
known output characteristic like in Fig. 3.3 is plotted. On the z-axis the minimum noise
figure Fmin (Fig. 3.6a) and the normalized equivalent noise resistance rn (Fig. 3.6b) at
2 GHz are drawn for different bias conditions.
b)
a)
Fig. 3.6: Bias dependence of (a) the minimum noise figure Fmin and
(b) the normalized equivalent noise resistance rn of GaN HFETs.
As can be seen, Fmin decreases for increasing drain source voltages and decreasing gate
source voltages. The tendencies for VG , approaching the pinch off voltage and V D ,
approaching the drain source breakdown voltage is not shown in the picture. In the first case
Fmin increases sharply, after passing a minimum. In the second case also a minimum can be
found and Fmin than rises again slowly. The optimum bias condition for Fmin was typically
found at about a third of the saturated drain source current I DSS and about half of the drain
source breakdown voltage V DS B or expressed as equations:
I Dopt = 1 / 3 ⋅ I DS S and
(3.1)
V Dopt = 1 / 2 ⋅ V DS B .
(3.2)
The normalized equivalent noise resistance rn was found to be the most sensitive parameter
of the four noise parameters. It showed large variations when including or excluding
impedance points from the least-mean-square algorithm. rn showed no clear tendency
dependent on the bias condition (Fig. 3.6b).
The bias dependence of two kinds of gains is shown in Fig. 3.7. The associated gain at
minimum noise figure G a or the maximum available gain Gmax (or MAG) occurs, if the
input of the device is noise or power matched, respectively.
TOBIAS WERNER
CORRELATION BETWEEN THE FLICKER AND THE MICROWAVE NOISE OF GAN HFETS
a)
PAGE 15 / 141
b)
Fig. 3.7: Bias dependence of (a) the associated gain at minimum noise figure Ga and
(b) the maximum available gain Gmax.
G a is always smaller as Gmax . Ga decreases quickly for decreasing drain source voltages.
The difference between G a and G max gets smaller and smaller as V D increases. This means
that the tradeoff between highest power and lowest noise gets more favorable as V D
increases. Comparing Fig. 3.6a and Fig. 3.7a, we can observe that the bias condition for a
negligible deviation between Ga and G max and the optimum Fmin coincide at the same bias
condition. This is important for low noise applications in first stage amplifiers since not only
lowest noise but also highest gain matters as we can see from the Friis's cascade equation
[20]
F = F1 −
F2 − 1
,
G1
(3.3)
with Fi , the noise figure of the i-th stage, Gi , the gain of the i-th stage, and F , the overall
noise figure.
The noise level of the flicker or 1/f-noise in the linear region of a transistor can be
conveniently described by two parameters, the relative spectral current noise density S I / I 2
and the Hooge parameter α H , which varied between –132 to –109 dB/Hz and 7E-4 to 1E-1
at 100 Hz, respectively over all devices.
The flicker noise versus frequency in the linear region, expressed by the relative spectral
current noise density S I / I 2 , is shown in Fig. 3.8. The slope of the curve varied between
0.9 and 1.4 as described in literature [23] but was typically close to unity.
TOBIAS WERNER
CORRELATION BETWEEN THE FLICKER AND THE MICROWAVE NOISE OF GAN HFETS
PAGE 16 / 141
Fig. 3.8: Typical low frequency noise of a GaN HFET biased in the linear region.
The slope of the red line is ideally proportional to 1/f.
The pure flicker noise was often superimposed by generation recombination noise, which
leads to deviations from a straight line for higher frequencies. The spikes are due to
disturbances from the power system frequencies (60 Hz) and frequencies at 15 kHz of
unknown origin and their harmonics. The minimum Hooge parameter α H was found to be
as low as 7 ⋅ 10 − 4 at zero gate bias and a drain source voltage of 0.5 V, what is comparable to
results reported in [12].
TOBIAS WERNER
CORRELATION BETWEEN THE FLICKER AND THE MICROWAVE NOISE OF GAN HFETS
PAGE 17 / 141
4 MEASUREMENT SETUP
To characterize noise of transistors, specific setups with various instruments have to be used.
The low frequency noise has to be measured with a different system as the microwave noise.
In the succeeding chapters we will discuss what instruments were used for the measurements
and how they were assembled with each other for both systems, the low frequency noise and
the microwave noise setup.
4.1 Microwave noise setup
A picture of the microwave setup is shown in Fig. 4.1.
Fig. 4.1: The microwave setup to characterize DC-characteristics, S-parameters, noise and power of
transistors in the microwave frequency range.
The instruments of the microwave setup were already available, but it was necessary to
assemble and calibrate the system. Design decisions concerning the connections had to be
made and several problems to calibrate the system had to be solved. Most important is, to
make the system insertable (compare Appendix F: Fixture Characterization), what helps to
keep the calibration process simple. This is not always possible and techniques like AdapterRemoval have to be used.
TOBIAS WERNER
CORRELATION BETWEEN THE FLICKER AND THE MICROWAVE NOISE OF GAN HFETS
PAGE 18 / 141
If even this method cannot be applied custom solutions have to be developed. For this
purpose a program was written in Matlab (Appendix F: Fixture Characterization), which
calculates the S-parameters of probe tips connected to a fixture from two sets of HP8510C
error coefficients.
The latest version of the system uses microwave switches to select different setup
configurations and is described in Appendix G: Microwave Switch Control.
With the system power, S-parameters and noise in a frequency range from 2 GHz to
12.42 GHz and DC-characteristics can be measured. For the topic of this work all
measurement types, except power were relevant and the different setups and configurations
of the instruments will be presented. The usual measurement sequence to examine the
microwave noise of a transistor is the following:
-
DC-measurement (Fig. 4.2a) at the beginning, to get a general idea about the
maximum bias ranges of the device under test (DUT).
-
S-parameter measurements (Fig. 4.4a) at the frequencies of interest for different
bias conditions within the limits for the gate and drain voltage, determined by the
DC-measurement.
-
Noise measurements (Fig. 4.11) for the same conditions, concerning frequency and
bias range, as used for the S-parameter measurements.
The DC-characteristics can be measured with the program Automated IV-Curve
Measurement (Fig. 4.14), which controls the HP4145A parameter analyzer via the GPIB, at
any time independent of the setup configuration.
a)
b)
Fig. 4.2: (a) Typical DC measurement result obtained with the aid of a
(b) parameter analyzer (Hewlett Packard HP4145)
For S-parameters and noise measurements different instruments are used and assembled in a
different way. These setups will be explained in the next two chapters.
2
The system is actually designed for a frequency range of 2 GHz to 18 GHz, but is limited by the two
bias-Ts at the input and output of the system that are only specified up to 12.4 GHz. All other
components meet the requirements of 18 GHz as an upper frequency limit.
TOBIAS WERNER
CORRELATION BETWEEN THE FLICKER AND THE MICROWAVE NOISE OF GAN HFETS
PAGE 19 / 141
4.1.1 S-parameter configuration
The configuration of the system for S-parameter measurement is shown in Fig. 4.3.
Fig. 4.3: The microwave setup configured for S-parameter measurements.
The Automated Tuner System (ATS) software MT993C from Maury Microwave3 controls
the entire setup via the General Purpose Instrument Bus (GPIB). For S-parameter
measurements the vector network analyzer (VNA) HP8510C from Hewlett Packard4
(Fig. 4.4b) is used. Its input and output ports are connected to bias-Ts HP11590B of Hewlett
Packard, which are used to apply the gate and drain voltage provided by a parameter
analyzer HP4145 of Hewlett Packard (Fig. 4.2a). The bias-Ts are necessary to adjust the
working point of the analyzed transistor and to prevent interference with the measurement
signal of the VNA.
3
Maury Microwave, 2900 Inland Empire Boulevard, Ontario, California 91764, USA,
Phone: +1(909) 987-4715, Fax: +1(909) 987-1112, www.maurymw.com
4
Hewlett Packard (Agilent), www.agilent.com
TOBIAS WERNER
CORRELATION BETWEEN THE FLICKER AND THE MICROWAVE NOISE OF GAN HFETS
a)
PAGE 20 / 141
b)
Fig. 4.4: (a) Typical result of a S-parameter measurement obtained with the aid of a
(b) vector network analyzer (Hewlett Packard HP8150C).
A tuner controller MT966B02 from Maury Microwave manages two mechanical tuners
MT982A01 (Fig. 4.5) from the same company at the source and load position. Tuners are
used to change the impedance, seen by the DUT at its input and output and are set to
50 Ohms during the S-parameter measurement.
Fig. 4.5: Picture of two mechanical tuners (MT982A01) with
a tuner controller (MT966B02) of Maury Microwave.
Two very-high-temperature probes VHT40A-GSG-150P (Fig. 4.6a) of GGB Industries5,
with ground-signal-ground configuration and 150 µm contact spacing, are used to contact
transistors on-waver.
5
GGB Industries, 4196 Corporate Square, Naples, FL 34104, USA,
Phone: +1(941) 643-4400, Fax: +1(941) 643-4403, www.ggb.com
TOBIAS WERNER
CORRELATION BETWEEN THE FLICKER AND THE MICROWAVE NOISE OF GAN HFETS
a)
PAGE 21 / 141
b)
Fig. 4.6: (a) Probe tip (VHT40A-GSG-150P) and
(b) probe tips contacting a through on a calibration substrate.
To get accurate results for the S-parameters, the VNA has to be calibrated before the
measurement. This is required to shift the reference plane to the probe tips, where the
measurement is carried out. Precisely known calibration standards (open, short, load,
through) are measured and compared to the expected response. The VNA then calculates
error coefficients, which compensate the loss, phase error and frequency response. The
calibration can only remove systematic errors of the system. For the on-waver calibration, a
substrate CS-5 from GGB Industries with a full-two-port-LRM6 (line-reflect-match)
technique was utilized. For the "reflect", the short standards were used. As recommended by
a Maury engineer the averaging factor of the VNA was 128 for the reflect, match (50 Ohm
load) and line (through standard) and 1024 for the isolation calibration with the load.
If S-parameter measurements of active devices are made, it is important to adjust the output
power of the VNA to 0 dBm, because otherwise the device will be additionally biased by the
VNA and not only by the bias control, as intended.
The S-parameter setup, like it is depicted in the Maury software can be seen in Fig. 4.7.
Fig. 4.7: The representation of the S-parameter setup in the ATS software of Maury Microwave.
6
Also called TRM (Through-Reflect-Match)
TOBIAS WERNER
CORRELATION BETWEEN THE FLICKER AND THE MICROWAVE NOISE OF GAN HFETS
PAGE 22 / 141
4.1.2 Noise configuration
The core of the system, formed by the bias control, the bias-Ts, both tuners and the two
probes, remains unchanged and is assembled like described in the previous chapter. A
detailed view of the system, configured for noise measurement can be seen in Fig. 4.8.
Fig. 4.8: The microwave setup configured for noise measurements.
At the input of the system a noise source MT7618E (Fig. 4.9a) from Maury Microwave is
connected, which can be switched between two noise temperatures by a noise figure meter
MT2075C (Fig. 4.9b) of Maury Microwave. The direct input tuning range of the noise figure
meter is limited to frequencies below 2.047 GHz. The microwave setup however is designed
to cover a frequency range up to 18 GHz, which is above the maximum direct input
frequency of the noise figure meter. An external down-conversion to an intermediate
frequency within the frequency range of the instrument is required [32].
a)
b)
Fig. 4.9: (a) Noise source (MT7618E) and (b) Noise Gain Analyzer (MT2075C).
TOBIAS WERNER
CORRELATION BETWEEN THE FLICKER AND THE MICROWAVE NOISE OF GAN HFETS
PAGE 23 / 141
For this purpose a frequency extender MT868C of Maury Microwave is inserted at the
output of the system. The noise signal is down-converted by a modulation with a signal,
generated by an oscillator HP83752A of Hewlett Packard, to a frequency range, which is
suitable for the noise figure meter.
For the noise measurement the source and load tuner have different responsibilities. The
impedance setting of the load tuner has no influence on the noise level of the measurement,
but it can be necessary to adjust its impedance to prevent the setup from oscillating. In some
cases the system can be even more stable without a tuner at the load position [34]. To find
the output impedance however at which the transistor is power matched, a load tuner must be
present.
Fig. 4.10: Example of source and load positions for a noise measurement. The light blue crosses in
the smith chart indicate the range, which can be covered by the mechanical tuners at 2 GHz. The red
crosses in the source chart are the positions, where the noise figure is measured and will be used to
determine the noise parameters. The red cross in the load chart point to the position of the load
impedance.
The noise level of the DUT, expressed by the noise figure F , depends on the impedance at
its input. The role of the source tuner is, to adjust this impedance level in order to find the
position, where the lowest noise is exhibited by the DUT. Fig. 4.10 shows a typical selection
of source and load impedances for a noise measurement.
A typical noise measurement result obtained with the ATS is shown in Fig. 4.11.
TOBIAS WERNER
CORRELATION BETWEEN THE FLICKER AND THE MICROWAVE NOISE OF GAN HFETS
PAGE 24 / 141
Fig. 4.11: Typical noise measurement screen in the ATS of Maury Microwave. The optimum source
reflection coefficient Γopt is indicated by the square in the smith chart. Circles of constant noise figure
for different source impedances are plotted in red color into the smith chart.
The noise setup, like it is depicted in the Maury software can be seen in Fig. 4.12.
Fig. 4.12: The representation of the noise setup in the ATS software of Maury Microwave.
TOBIAS WERNER
CORRELATION BETWEEN THE FLICKER AND THE MICROWAVE NOISE OF GAN HFETS
PAGE 25 / 141
4.2 Low frequency noise setup
The low frequency noise setup is used to characterize the noise properties of transistors in a
frequency range of typically 1 Hz to 100 kHz. The system is very sensitive to vibrations and
electromagnetic disturbances and is therefore placed inside a shielded metal box on an air
suspended table. In Fig. 4.13 a picture of the employed instruments to measure the low
frequency noise can be seen.
Fig. 4.13: Picture of the setup to measure the low frequency noise properties of transistors.
The output characteristic of the transistors was measured with the parameter analyzer
HP4156B of Hewlett Packard. The measurement gives on the one hand an idea about the
maximum bias ranges of the transistor and is on the other hand necessary, to extract the
differential resistance of the transistor for a certain bias condition. The use of this resistance
will be explained later.
Fig. 4.14: User interface of the program Automated IV-Curve Measurement.
TOBIAS WERNER
CORRELATION BETWEEN THE FLICKER AND THE MICROWAVE NOISE OF GAN HFETS
PAGE 26 / 141
The parameter analyzer can be remoted over the GPIB by the program Automated IV-Curve
Measurement, which is based on a driver from Maury Microwave and was extended in
functionality. The interface of this program can be seen in Fig. 4.14.
The main instrument to measure the noise level of transistors is the SR770, a FFT spectrum
analyzer (Fig. 4.15b), of Stanford Research Systems7. It measures the power spectral density
(PSD) of a signal at its input at a resolution of 5 nVrms/Hz (-166dBVrms/Hz).
a)
b)
Fig. 4.15: (a) The noise floor of the low frequency noise measurement system. The spikes at
harmonics of the power system frequency (60 Hz) cannot be suppressed by the shielding enclosure.
The graph also shows disturbances at 15 kHz and harmonics of unknown origin.
(b) The FFT spectrum analyzer (SR770) of Stanford Research Systems.
The measurement system's noise floor versus frequency is shown in Fig. 4.15a and is limited
by the performance of the FFT spectrum analyzer. The lowest measured noise level was
much higher than the noise floor and only some spikes, which can easily be separated from
the noise contribution of the transistor, interfered with the measurement.
Fig. 4.16: Schematic view of the low frequency noise setup.
7
Stanford Research Systems, 1290-D Reamwood Avenue, Sunnyvale, CA 94089, USA,
Phone: +1(408)744-9040, Fax: +1(408)744-9049, www.stanfordresearch.com
TOBIAS WERNER
CORRELATION BETWEEN THE FLICKER AND THE MICROWAVE NOISE OF GAN HFETS
PAGE 27 / 141
As can be seen from the schematic view of the low frequency noise setup in Fig. 4.16, the
input of the spectrum analyzer is connected to the drain of a biased transistor. The gate
source voltage VG and the drain source voltage VD can be adjusted by potentiometers P1
(100 Ω) and P2 (2 KΩ), which are connected to batteries.
Batteries are used instead of power supplies, because the voltage is free from any harmonic
distortions, caused by multiples of the fundamental power system frequency (60Hz), spikes
and electrical noise, due to radio transmitters, power electronic circuits, arcing loads and
switching power supplies.
To determine the drain source current I D , a resistor R (100 Ω or 220 Ω) is placed between
the potentiometer and the drain contact and I D can be calculated by the expression
ID =
VR − VD
.
R
(4.1)
All voltages were measured with a digital multimeter HP34401A from Hewlett Packard.
The quality of measurement relies to a great degree on the contact between the probe tips
and the transistor pads. Therefore it is indispensable to clean the tips with alcohol proceeding
to each measurement. The contact also depends on the applied pressure on the needles and
should be varied until no significant alteration of the noise spectrum is noticed.
4.2.1 Measurement with the SR770
The power spectral density SV of flicker noise is proportional to 1/f.
Fig. 4.17: Comparison between the same function, proportional to 1/f,
plotted versus a linear (left) and a logarithmic (right) axis.
If SV is plotted versus a logarithmic scale (Fig. 4.17 b) instead of a linear (Fig. 4.17 a) the
dependence on 1/f is more perceptible, because the graph transforms into a straight line.
TOBIAS WERNER
CORRELATION BETWEEN THE FLICKER AND THE MICROWAVE NOISE OF GAN HFETS
PAGE 28 / 141
The logarithmic scale however interferes with the measurement procedure of the FFT
spectrum analyzer. The SR770 divides the measurement range into 400 equidistant spaced
steps and takes a measurement after each segment. For a measurement range from 1 Hz to
100000 Hz this means that every 250 Hz a measurement is taken.
Fig. 4.18: The measurement has to be split into several measurement sections,
because an insufficient number of samples represent the lower part of the spectrum.
Fig. 4.18 shows that in this case the lower part of the spectrum is only represented by two
samples at 1 Hz and 251 Hz (Fig. 4.18 a). This is to imprecise and therefore the
measurement range has to be composed by several individual measurement sections
(Fig. 4.18 b).
For all low frequency noise measurements the frequency range was divided into three spans
from 1 Hz to 100 Hz, from 100 Hz to 3000 Hz and from 3000 Hz to 100000 Hz. Because
noise is a fluctuating quantity, a noise measurement consists of an averaged number of single
measurements. Table 4.1 shows, which number of averages was used for the measurement,
depending on the frequency span.
Start frequency, (Hz)
1
100
3000
Stop frequency, (Hz)
100
3000
100000
Number of averages
50
200
500
Table 4.1: Number of averages for different frequency spans.
Although there is a possibility to store frequently used settings for a measurement in a file
and to recall the settings later from disk, not all parameters are saved and have to be
manually adjusted each time the frequency range is changed. This is a possible source of
error, if the parameters are not carefully examined.
The conventional way to measure with the SR770, is the following:
- Recall a set of parameters for a certain measurement range from floppy disc and adjust
parameters, which could not be recalled.
- Carry out the measurement.
- Save the results of the measurement on floppy disc.
TOBIAS WERNER
CORRELATION BETWEEN THE FLICKER AND THE MICROWAVE NOISE OF GAN HFETS
PAGE 29 / 141
This had to be repeated for every individual measurement section. Afterwards the
measurements were combined by hand in Excel with overlapping sections in mind.
Because a large number of transistors had to be measured for an analysis of the correlation
between the flicker and microwave noise, the decision was made to rather invest the time to
create a program than to take the time to compile all separate measurements by hand.
This has several advantages:
- The measurement can run unattended and there is no need to interact, while the
measurement is running. Other things can be done in the meantime.
- The data is directly transferred to the controlling computer. No floppy disc has to be
used.
- The individual sections are combined automatically and the program eliminates
overlapping sections. Combination errors of the numerous files are prevented.
- Eliminating unnecessary redundant samples and restricting the data to logarithmic
equidistant steps can reduce the number of measurement points. Thus file size is
decreased while the qualitative meaning is preserved.
- Wrong parameter settings and with it wrong measurement results can be prevented,
because the program takes care of setting all parameters to the correct values.
- The measurement conditions and parameter settings are written directly into the file for
further reference and no additional notes are needed. The measurement situation can
therefore be reconstructed.
- The measurement file is named with the corresponding parameter settings and is not
restricted to 8 characters. This helps to keep the work organized and to locate the files
quicker.
- The measurement takes less time is more flexible.
TOBIAS WERNER
CORRELATION BETWEEN THE FLICKER AND THE MICROWAVE NOISE OF GAN HFETS
PAGE 30 / 141
Fig. 4.19: The user interface of the program to measure the low frequency noise.
The program is named Automated Low Frequency Noise Measurement (ALFNM) and the
user interface can be seen in Fig. 4.19. The description and manual of the program can be
found in Appendix E: Low Frequency Noise Measurement Program.
To display the measurements, a macro was written in Microsoft Excel, which directly opens
and displays the latest measurement result.
TOBIAS WERNER
CORRELATION BETWEEN THE FLICKER AND THE MICROWAVE NOISE OF GAN HFETS
PAGE 31 / 141
5 MEASUREMENT RESULTS
5.1 Flicker noise
To characterize the low frequency noise, the spectral voltage noise density SV was measured
at the drain of a biased transistor at room temperature.
Fig. 5.1: Typical result of a low frequency noise measurement with the slope proportional to 1/f.
Fig. 5.1 shows a typical noise measurement result of SV versus frequency from 1 Hz to
100 kHz for a transistor, biased at VG = 0 V and VD = 0.5 V (linear region). The noise
spectrum in the presented example is ideally proportional to 1/f, but the slope showed a 1/fγ
dependence with γ varying from 0.9 to 1.4 over all measurements. The dominant source of
noise in the low frequency range, the flicker noise, was sometimes overlaid by the so called
Generation Recombination Noise for frequencies above 100 Hz (Fig. 5.2).
TOBIAS WERNER
CORRELATION BETWEEN THE FLICKER AND THE MICROWAVE NOISE OF GAN HFETS
PAGE 32 / 141
Fig. 5.2: Contribution of generation recombination noise.
To refer only to the flicker noise, the reference value of the spectral voltage noise density
SV was taken at 100 Hz to express the noise level of the low frequency flicker noise.
SV is a function of the voltage, applied to the gate ( VG ) and drain ( V D ) of the transistor.
Fig. 5.3: Bias condition for lowest flicker noise.
In the linear region, the flicker noise is proportional to the squared drain current I D 2 and is
much smaller than in the saturation region of the transistor (Fig. 5.3).
TOBIAS WERNER
CORRELATION BETWEEN THE FLICKER AND THE MICROWAVE NOISE OF GAN HFETS
PAGE 33 / 141
Quantity to represent the flicker noise
The spectral voltage noise density SV , measured at the drain of the transistor (Meas)
depends on the following drain bias network, which can be represented like depicted in
Fig. 5.4.
Fig. 5.4: Drain bias network.
The potentiometer (compare Fig. 4.16) to adjust the drain source voltage V D can be
described by two resistors R1 and R2 . The differential resistance of the transistor depends
on the drain voltage and is expressed by the resistor r . The resistor R is used to determine
the drain current by measuring the two voltages V D and V R .
When adjusting SV to the desired drain source voltage by changing the resistance ratio
between R1 and R2 , the bias network will change its resulting resistance Rres , seen by the
DUT, which can be calculated by
Rres = R +
R1 ⋅ R2
.
R1 + R2
(5.1)
The resistors R1 and R2 can not be measured in situ and were determined by measured
voltages. The derivation of the formula relating the voltages with the resistors can be found
in Appendix B.2 Estimation of Rres for the present measurement system.
The altered drain bias network also affects of course the measured spectral voltage noise
density. To have a common base to compare measurement results independent of the bias
network, the spectral current noise density S I was calculated by
2
r + Rres
S I = SV ⋅
,
r ⋅ Rres
(5.2)
TOBIAS WERNER
CORRELATION BETWEEN THE FLICKER AND THE MICROWAVE NOISE OF GAN HFETS
PAGE 34 / 141
where r is the differential resistance, and Rres the resulting bias network resistance. A
detailed derivation of (5.2) can be found in Appendix B.1 Derivation of the Equation relating
SI with SV.
The measured transistors on the wavers had the same gate length (0.25 µm) and gate width
(100 µm), but different source drain spacings. To examine, if this influences significantly
the result of the correlation between the flicker and the microwave noise, the Hooge
parameter α H , which takes into account this drain source spacing, was calculated.
To examine, if the correlation coefficient is varying considerably dependent on the applied
parameter, the minimum noise figure Fmin was not only compared to SV , S I and the
Hooge parameter α H , but also to the normalized spectral current noise density S I / I D 2 (in
the following only referred to as S I / I 2 ), which is often referred to in papers. It normalizes
on the squared drain current, due to the fact that the flicker noise in the linear region of a
transistor is proportional to I D 2 . Furthermore, the comparison between S I , S I / I 2 and
α H allows to separate the influence of the normalization to I D 2 and the contribution of the
different source drain spacings.
5.2 Microwave noise
To characterize the microwave noise, the minimum noise figure Fmin was estimated at
2 GHz at room temperature with the help of the Automated Tuner System Software of
Maury Microwave.
Fig. 5.5: Frequency dependence of the minimum noise figure Fmin.
TOBIAS WERNER
CORRELATION BETWEEN THE FLICKER AND THE MICROWAVE NOISE OF GAN HFETS
PAGE 35 / 141
Fig. 5.5 shows a typical noise measurement result of Fmin versus frequency from 2 GHz to
26 GHz for a transistor biased at VG = -5 V and VD = 8 V (saturation region). Fmin is also a
function of the voltage, applied to the gate ( VG ) and drain ( V D ) of the transistor.
Fig. 5.6: Bias conditions for lowest microwave noise.
The minimum noise figure Fmin of the examined GaN HFETs was found to be minimal for
a bias condition of approximately a third of the saturated drain source current8 I DSS and
half of the drain source breakdown voltage VDSB , thus in the saturation region (Fig. 5.6).
5.3 Correlation between the flicker and the microwave noise
A graphical way of analyzing a dependence of two data ranges is, to plot them versus each
other in a so-called scatter plot and to examine a visible tendency of the points in the graph.
If a dependence of two data ranges (in our case the parameter, representing the level of the
flicker noise and the microwave noise) is not directly perceptible, a mathematical approach
can help to identify the degree of reliance between the two ranges. The correlation
coefficient is such a mathematical aid and a short overview is given in Appendix C:
Correlation.
To investigate a possible correlation between the low frequency 1/f-noise and the microwave
noise, three different approaches A, B, and C were chosen as illustrated in Fig. 5.7.
8
This current occurs when the gate-to-source voltage VG is held to zero and the drain-to-source
voltage VDS is set to a specified value (usually about 3 V).
TOBIAS WERNER
CORRELATION BETWEEN THE FLICKER AND THE MICROWAVE NOISE OF GAN HFETS
PAGE 36 / 141
Fig. 5.7: Different approaches to analyze the correlation between the flicker and the microwave noise.
Method A compares the noise dependence at the bias condition for lowest noise. This means
in the linear region for the low frequency noise and in saturation for the microwave noise
(Fig. 5.7A).
Method B compares the flicker and the microwave noise for an identical bias condition in
the saturation, what is the common working point for transistors (Fig. 5.7B).
Method C examines the dependence also for a similar bias condition, like in method B , but
not only for one bias point and several transistors, but covering the entire bias range of one
transistor (Fig. 5.7C).
5.4 Method A: Bias condition for lowest noise
Method A , bias condition for lowest noise, was carried out for 26 transistors on waver
GaNHFET10, 15 transistors on GaNHFET08 and 18 transistors on GaNHFET04 as depicted
in Fig. 5.8.
Fig. 5.8: Compared parameters and number of devices on wavers for method A.
TOBIAS WERNER
CORRELATION BETWEEN THE FLICKER AND THE MICROWAVE NOISE OF GAN HFETS
PAGE 37 / 141
5.4.1 Results for GaNHFET10
The minimum noise figure Fmin was measured at 2 GHz in saturation at an optimum bias
condition for lowest microwave noise and was compared to SV , S I , S I / I 2 and α H at
100 Hz in the linear region ( VG = 0 V, V D = 0.5 V). To ensure reliable results and to better
detect measurement errors, the microwave noise was measured at four different working
points. Although the flicker noise measurement is sensitive to the contact quality between
the probe tips and the transistor pads, the measurement process is less complex and one
measurement is sufficient to ensure a consistent measurement result.
Table 5.1: Correlation results for bias conditions of lowest noise; GaNHFET10.
Table 5.1 shows the individual low frequency and microwave noise results for each device
on the waver GaNHFET10. The header row gives information about the measurement
conditions, parameters and units. The lower main row shows the minimum, maximum and
average values of the corresponding columns. The correlation coefficient was calculated for
each column of the low frequency noise and the microwave noise and is shown in a matrix at
the bottom of the table.
For the waver GaNHFET10, the correlation coefficient demonstrates only a negligible
dependence on the microwave noise bias condition.
TOBIAS WERNER
CORRELATION BETWEEN THE FLICKER AND THE MICROWAVE NOISE OF GAN HFETS
PAGE 38 / 141
SV represents the measured quantity, which is only specified for reference. S I showed a
negative correlation coefficient of about -0.2, what indicates no significant dependence
considering the small number of available devices. A different correlation close to zero is
obtained, if the spectral current noise density is normalized to the drain current ( S I / I 2 )
and additionally the source drain spacing is taken into account ( α H ).
It is difficult to judge, which parameter is the most suitable to express the flicker noise level,
however taking into consideration that for the microwave noise no normalization was
applied, the spectral current noise density S I appears to be the most expressive parameter.
The scatter diagrams for S I therefore are framed. To make it possible to draw own
conclusions and to compare the parameters to each other, all parameters however were listed.
The following scatter diagrams will help to get a graphical idea of the dependence and to
better judge the bare correlation result.
a)
b)
c)
d)
Fig. 5.9: Scatter diagrams for a comparison between Fmin at 2 GHz, representing the microwave
noise, and SV, SI, SI/I2 and αH at 100 Hz, representing the flicker noise, GaNHFET10.
TOBIAS WERNER
CORRELATION BETWEEN THE FLICKER AND THE MICROWAVE NOISE OF GAN HFETS
PAGE 39 / 141
Fig. 5.9 shows four representative scatter diagrams for the bias condition with the lowest
averaged minimum noise figure (1.65 dB). On the ordinate SV , S I , S I / I 2 and α H at
100 Hz are plotted versus the minimum noise figure Fmin at 2 GHz on the abscissa. One dot
in the diagram represents a certain transistor on the same waver with its minimum noise
figure and corresponding low frequency noise parameter. The correlation coefficient and the
regression line are drawn in red color to each plot. Also indicated with the correlation
coefficient is the error due to a small number of observations, which is introduced in
Appendix C.5 Error due to small number of observations. For all analyzed wavers the error
was in the order of about ±0.2.
For a significant linear correlation the points in the diagrams should lie close to the
regression line, what is not the case for this waver. The dots rather show a wide distributed
pattern covering the entire plot area.
The normalization of S I to the drain current leads to a slight displacement of the points
(Fig. 5.9b versus Fig. 5.9c). This indicates that the correlation of α H with Fmin does not
only reflect the influence of a different source drain spacing, but also the effect of the
normalization to the drain current, which alters the correlation result.
The different point constellation between Fig. 5.9c and Fig. 5.9d is mainly due to the
changed non-logarithmic scale, used for the Hooge parameter. A comparison, if also the
Hooge parameter is displayed in dB is shown in Fig. 5.10 and demonstrates a better
agreement between the points. Still there is a deviation, what can be ascribed to the different
source drain spacing of the transistors.
Fig. 5.10: Comparison between the point constellation of SI /I2 (filled dots, solid line)
and the Hooge parameter in dB (non-filled dots, dashed line).
The highest value of the correlation coefficient results from the comparison between Fmin
and the spectral current noise density S I , but a correlation coefficient of about -0.2 still does
not indicate a significant dependence.
TOBIAS WERNER
CORRELATION BETWEEN THE FLICKER AND THE MICROWAVE NOISE OF GAN HFETS
PAGE 40 / 141
In summary it may be concluded for waver GaNHFET10, that the correlation coefficient is
quite small and the points show no clear tendency. This indicates, that there appears to be no
dependence between the low frequency noise and the microwave noise for this waver.
5.4.2 Results for GaNHFET08
The minimum noise figure Fmin for this waver was measured at 2 GHz for six different bias
points in the saturation region and was compared, as before, to SV , S I , S I / I 2 and α H at
100 Hz for one bias point in the linear region ( VG = 0 V, V D = 0.5 V).
Table 5.2: Correlation results for bias conditions of lowest noise; GaNHFET08.
Table 5.2 shows again the individual low frequency and microwave noise results for each
device on the waver GaNHFET08.
Independent of the low frequency noise parameter, the correlation coefficient is increasing, if
the bias condition of the microwave noise is chosen closer to that, where the low frequency
noise was measured (Fig. 5.11).
TOBIAS WERNER
CORRELATION BETWEEN THE FLICKER AND THE MICROWAVE NOISE OF GAN HFETS
PAGE 41 / 141
Fig. 5.11: The correlation increases for decreasing source drain voltages.
This suggests, that a better correlation might be found, if the microwave and the low
frequency noise are examined for an identical bias condition, what will be analyzed in 5.5
Method B: Same bias condition.
a)
b)
c)
d)
Fig. 5.12: Scatter diagrams for a comparison between the minimum noise figure
Fmin at 2 GHz, and SV, SI, SI/I2 and αH at 100 Hz, GaNHFET08.
TOBIAS WERNER
CORRELATION BETWEEN THE FLICKER AND THE MICROWAVE NOISE OF GAN HFETS
PAGE 42 / 141
The four scatter diagrams in Fig. 5.12 are arranged in the same way as described before for
the bias condition with the lowest averaged minimum noise figure (2.11 dB).
The constellation of the points in Fig. 5.12, however, is very sensitive to errors, because only
a few entries represent the microwave noise with elevated noise figures. To illustrate this
sensitivity, the comparison in Fig. 5.13 shows that the correlation coefficient changes
considerably, if only one point is inserted into the data range.
a)
b)
Fig. 5.13: Dependent on the constellation of the points in the scatter diagram, the correlation
coefficient is very sensitive to errors. Only one additional point can change the
correlation coefficient from 0.564 (a) to 0.223 (b).
Unfortunately, the analyzed devices were the only correctly working transistors on the waver
GaNHFET08. Other transistors on the waver seemed to work, but could not be pinched off
and were not considered for this examination.
The results for this waver could not be regarded as reliable due to the presented constellation
sensitivity and the low number of analyzed devices. This example visualizes, that the bare
correlation coefficient is only qualified expressive and that a look at the point constellation
in a scatter diagram provides important information to judge the reliability of the correlation
result.
TOBIAS WERNER
CORRELATION BETWEEN THE FLICKER AND THE MICROWAVE NOISE OF GAN HFETS
PAGE 43 / 141
5.4.3 Results for GaNHFET04
The minimum noise figure Fmin for waver GaNHFET04 was measured at 2 GHz for two
different bias points in the saturation region and was compared as before to SV , S I , S I / I 2
and α H at 100 Hz for one bias point in the linear region ( VG = 0 V, V D = 0.5 V).
Table 5.3: Correlation results for bias conditions of lowest noise; GaNHFET04.
Table 5.3 shows the individual low frequency and microwave noise results for each device
on the waver GaNHFET04.
The correlation coefficient for this waver differs only slightly for the two microwave noise
bias conditions.
Independent of the selected flicker noise parameter the correlation coefficient lies in the
same range, what does not necessarily imply that the normalization to I D 2 and the source
drain spacing have no effect on the location of the points in the scatter diagram.
TOBIAS WERNER
CORRELATION BETWEEN THE FLICKER AND THE MICROWAVE NOISE OF GAN HFETS
a)
b)
c)
d)
PAGE 44 / 141
Fig. 5.14: Scatter diagrams for a comparison between the minimum noise figure
Fmin at 2 GHz, and SV, SI, SI/I2 and αH at 100 Hz, GaNHFET04.
Fig. 5.14 shows again the four scatter diagrams for the bias condition with the lowest
averaged minimum noise figure (3.79 dB) for waver GaNHFET04.
The correlation coefficient for all four low frequency noise parameters compared with the
minimum noise figure resulted in a negative correlation between -0.24 and -0.27. Even so,
the points are arbitrarily scattered and do not lie close to the regression line. An increased
number of transistors on the waver GaNHFET04 would have been desirable, but only
devices with widely differing properties were left on the waver and were not usable.
When comparing the correlation coefficient between Fmin and the spectral current noise
density S I , obtained for GaNHFET04 and GaNHFET10, we can notice that both are
negative and show about the same value of -0.2 ±0.2. No uniform correlation result is
obtained, when other flicker noise parameters are taken to compare to Fmin .
In all analyzed cases for method A the scatter diagrams showed a cloud of points that were
widely scattered from the regression line. The correlation coefficient in general was small
and no clear tendency for the dependence of the flicker and the microwave noise was found.
TOBIAS WERNER
CORRELATION BETWEEN THE FLICKER AND THE MICROWAVE NOISE OF GAN HFETS
PAGE 45 / 141
5.5 Method B: Same bias condition
This method was carried out for 21 devices on waver GaNHFET10, one of the wavers
method A was already applied to. As for method A the minimum noise figure Fmin at
2 GHz was compared to SV , S I , S I / I 2 and α H at 100 Hz, but this time for an identical
bias condition in the saturation region of the transistor.
Fig. 5.15: Compared parameters and number of devices on waver GaNHFET10 for method B.
Dependent on the chosen bias conditions large variations in the correlation result were
obtained. Therefore two cases, where only the gate source voltage VG was altered, will be
compared to each other.
TOBIAS WERNER
CORRELATION BETWEEN THE FLICKER AND THE MICROWAVE NOISE OF GAN HFETS
PAGE 46 / 141
5.5.1 Results for GaNHFET10, bias condition 1
The minimum noise figure Fmin for waver GaNHFET10 was measured at 2 GHz for a
working point in the saturation region ( VG = -1 V, V D = 10 V) and was compared to SV ,
S I , S I / I 2 and α H at 100 Hz for the same bias condition.
Table 5.4: Correlation results for an identical bias conditions in saturation; GaNHFET10.
Table 5.4 shows the individual low frequency and microwave noise results for each device
on the waver GaNHFET10.
The correlation coefficient shows a large variation dependent on the applied flicker noise
parameter, if either SV , S I or S I / I 2 or α H are used.
In saturation the flicker noise is no longer proportional to I D 2 and the electron distribution
in the channel gets inhomogeneous. Therefore the two flicker noise parameters S I / I 2 and
α H have no significant meaning and are only presented in the table for completeness.
TOBIAS WERNER
CORRELATION BETWEEN THE FLICKER AND THE MICROWAVE NOISE OF GAN HFETS
a)
PAGE 47 / 141
b)
Fig. 5.16: Scatter diagrams for a comparison between
the minimum noise figure Fmin at 2 GHz, and SV and SI at 100 Hz.
Fig. 5.16 shows the scatter diagrams for a bias condition VG = -1 V and V D = 10 V of waver
GaNHFET10. Only the graphs comparing SV and S I with Fmin are of importance and
show about the same point constellation. Comparing the flicker noise scales in Fig. 5.9 and
Fig. 5.16 it can be noticed that the flicker noise level is much higher in saturation as in the
linear region, as mentioned at the beginning of this chapter (Fig. 5.5).
Whereas the correlation coefficient of the same waver for method A was close to zero
(-0.01 ±0.20) when correlating Fmin and SV , the regression line for this investigation,
method B , shows a negative tendency and the correlation coefficient is -0.24 ±0.21.
The comparison between Fmin and S I resulted in both cases in a negative correlation
coefficient of -0.19 ±0.19 for method A and of -0.32 ±0.21 for method B .
The points are, as before, randomly distributed and the correlation coefficient is still small
enough to classify the result as uncorrelated.
TOBIAS WERNER
CORRELATION BETWEEN THE FLICKER AND THE MICROWAVE NOISE OF GAN HFETS
PAGE 48 / 141
5.5.2 Results for GaNHFET10, bias condition 2, worst case
The same examination was carried out for three additional bias conditions. The obtained
results differ from the one before and the worst case will be presented in this section.
The noise level of transistors depend on a vast number of influences and the differing results
show, how problematical it is, to find the right conditions for investigating the reliance
between the flicker and the microwave noise.
In this example all parameters were chosen as before, except the gate source voltage was
decreased by 0.5 V from -1.0 V to -1.5 V.
Table 5.5: Correlation results for an identical bias conditions in saturation; GaNHFET10.
Table 5.5 shows an increased correlation result for SV and S I . As before the other two
flicker noise parameters have no meaning and are presented only for completeness.
TOBIAS WERNER
CORRELATION BETWEEN THE FLICKER AND THE MICROWAVE NOISE OF GAN HFETS
a)
PAGE 49 / 141
b)
Fig. 5.17: Scatter diagrams for a comparison between Fmin at 2 GHz,
and SV and SI (logarithmic scale) at 100 Hz for a altered gate source voltage.
Fig. 5.17 shows again the two scatter diagrams, this time for the bias condition VG = -1.5 V
and V D = 10 V of waver GaNHFET10. As can be seen from the two graphs, comparing SV
and S I with Fmin , the point constellation shows a clear negative tendency. This could
indicate that there is a possible partly correlation between the flicker and the microwave
noise and shows again the sensitivity of the analysis.
When using a non-logarithmic scale for the flicker noise parameters (dB is a logarithmic
scale) the correlation coefficient decreases to -0.25 ±0.21 and -0.28 ±0.20 for SV and S I as
parameters, respectively and is illustrated in Fig. 5.18.
a)
b)
Fig. 5.18: Scatter diagrams for a comparison between Fmin at 2 GHz,
and SV and SI (non-logarithmic scale) at 100 Hz for an altered gate source voltage.
To consider all possible cases and to analyze the deviation of the correlation coefficient for
different working points, would have required additional measurements.
TOBIAS WERNER
CORRELATION BETWEEN THE FLICKER AND THE MICROWAVE NOISE OF GAN HFETS
PAGE 50 / 141
5.6 Method C: Entire bias range
In contrast to the preceding methods, where numerous transistors on the same waver were
examined, method C was carried out for 29 working points of a single transistor on waver
GaNHFET01, as illustrated in Fig. 5.19. The minimum noise figure and the flicker noise
parameter were estimated for an identical bias condition, covering the entire bias range of the
analyzed transistor.
Fig. 5.19: Compared parameters and number of devices on wavers for method C.
5.6.1 Results for GaNHFET01
The minimum noise figure Fmin was measured at 2 GHz , 10 GHz and 26 GHz and was
compared to SV , S I , and S I / I 2 at 100 Hz. As before, S I / I 2 is only listed for reference
and is no expressive parameter, because working points in the saturation region of the
transistor are compared to each other.
TOBIAS WERNER
CORRELATION BETWEEN THE FLICKER AND THE MICROWAVE NOISE OF GAN HFETS
PAGE 51 / 141
Table 5.6: Correlation results for working points, covering
the entire bias range of one transistor on GaNHFET01.
Table 5.6 shows the individual low frequency and microwave noise results for different bias
conditions of a single device on waver GaNHFET01. In the first two columns the bias
condition, i.e. the voltage at the gate and drain, is indicated. The following three columns
hold the individual flicker noise parameters and the last three columns specify the minimum
noise figure at three frequencies.
The correlation coefficient shows no frequency dependence and is close to zero independent
of the selected low flicker noise parameter.
TOBIAS WERNER
CORRELATION BETWEEN THE FLICKER AND THE MICROWAVE NOISE OF GAN HFETS
a)
c)
b)
d)
PAGE 52 / 141
Fig. 5.20: Scatter diagrams for a comparison between the minimum noise figure Fmin
at a), b) 2 GHz and c),d) at 26 GHz and SV and SI at 100 Hz.
Fig. 5.20 shows again the scatter diagrams for a comparison between SV and S I , measured
at 100 Hz and Fmin at 2 GHz and 26 GHz. This time a dot in a diagram represents a certain
bias condition of the same transistor with its corresponding Fmin and flicker noise
parameter.
As expected the microwave noise level at 26 GHz is much higher than at 2 GHz (compare
Fig. 5.5). The constellation of points at 26 GHz seems to be shifted towards higher noise
figures and cover a larger range (9.7 dB to 12.5 dB) in comparison to 2 GHz (2.7 dB to
3.6 dB).
All diagrams a) to d) show a point constellation, which support the correlation coefficient
close to zero and show no association between the two noise types.
The individual results for the three presented methods will be compared to each other and a
general statement concerning the topic of this investigation, if the flicker and the microwave
noise of GaN HFETs is correlated, will be given in the following chapter, the conclusion.
TOBIAS WERNER
CORRELATION BETWEEN THE FLICKER AND THE MICROWAVE NOISE OF GAN HFETS
PAGE 53 / 141
6 CONCLUSION
The correlation between the flicker and the microwave noise of GaN HFETs at room
temperature was investigated.
For this purpose a microwave system had to be assembled and put into service.
The comparison of the minimum noise figure Fmin , which expresses the microwave noise
level, with the spectral current noise density S I , which was considered to be the most
expressive parameter to refer to the flicker noise level, allows to draw the conclusion that the
flicker and the microwave noise are not correlated.
Method A
Method B
Method C
GaNHFET10:
GaNHFET10:
GaNHFET01 (2 GHz):
GaNHFET04:
GaNHFET10 (worst case):
GaNHFET01 (26 GHz):
One result (Method B, GaNHFET10, worst case) yielded to a correlation coefficient of
-0.56 ±0.15, but considering all reliable other cases, always a small negative correlation
coefficient between -0.2 ±0.2 (Method A) and -0.3 ±0.2 (Method B) or close to zero
(Method C) was obtained (see table).
The presented conclusion is supported by the constellation of widely spread points in the
scatter diagrams, which showed no clear tendency concerning reliance between the flicker
and the microwave noise.
This result indicates, that two independent noise sources are responsible for the flicker and
the microwave noise. A noise model can thus be established, which describes the microwave
and the flicker noise as a superposition of uncorrelated noise sources.
TOBIAS WERNER
CORRELATION BETWEEN THE FLICKER AND THE MICROWAVE NOISE OF GAN HFETS
PAGE 54 / 141
Appendix A: SYMBOLS AND ABBREVIATIONS
Symbol
αH
β
λ
ϕ
σX
σY
Γ opt
Γs
Fmin
Unit
1/m
m
rad
optimum complex source reflection coefficient
F
Ftotal
Fdut
Ga
Gmax
Gdut
VG
VD
V DS B
dB
dB
dB
dB
dB
dB
dB
V
V
V
Vmeas
V
VR
Vbat
ID
IG
I DSS
V
V
V
V
A
A
A
∂I
Rn
rn
R
R0
Description
Hooge parameter
phase constant of the line
wave length
phase of S-parameter S12
standard deviation of data set X
standard deviation of data set Y
A
Ω
Ω
Ω
complex source reflection coefficient
minimum noise figure
noise figure
total noise figure
noise figure of the DUT
associated gain at minimum noise figure
maximum available gain (MAG)
available gain of the DUT
gate source voltage
drain source voltage
drain source breakdown voltage
measured voltage at the drain of the DUT
supply voltage
voltage drop over the resistor
battery voltage
drain source current
gate current
saturated drain source current
variation of the drain current
equivalent noise resistance
normalized equivalent noise resistance
resistance of the resistor at the drain of the DUT
mean resistance of the DUT
TOBIAS WERNER
CORRELATION BETWEEN THE FLICKER AND THE MICROWAVE NOISE OF GAN HFETS
Symbol
R ges
Unit
Ω
r
ri
∂r
rDC
P1
P2
SV
SI
N tot
ns
f
w
l
X
Y
rX ,Y
Ω
Ω
Ω
Ω
Ω
Ω
V2/Hz
A2/Hz
cm-2
Hz
m
m
PAGE 55 / 141
Description
resulting bias network resistance
differential resistance of the DUT
differential resistance for bias point i
variation of the DUT's differential resistance
DC resistance of the of the DUT
resistance of the potentiometer at the drain of the DUT
resistance of the potentiometer at the gate of the DUT
spectral voltage noise density
spectral current noise density
total number of charge carriers
electron sheet density
frequency
gate width
gate length
data set
data set
correlation coefficient of data set X and data set Y
rX ,Y 2
coefficient of determination, goodness of fit
cov X ,Y
covariance of data set X and data set Y
average of data set X
average of data set Y
slope of the regression line
intercept of the regression line with the y-axis
velocity of light
bias point i
HP8510 error coefficient, representing the frequency response
HP8510 error coefficient, representing the directivity
HP8510 error coefficient, representing the source match
S-parameter matrix, describing the error adapter of the first calibration
chain matrix transformed matrix A S
x
y
m
c
c
Pi
ER
ED
ES
AS
AT
BS
BT
CS
CT
l
Z0
m/s
S-parameter matrix, describing the fixture
chain matrix transformed matrix B S
m
Ω
S-parameter matrix, describing error adapter of the second calibration
chain matrix transformed matrix C S
electrical length of a line
reference impedance of the system (50 Ω)
TOBIAS WERNER
CORRELATION BETWEEN THE FLICKER AND THE MICROWAVE NOISE OF GAN HFETS
Abbreviation
ALFNM
AlGaN
AlN
ATS
DUT
FET
FFT
GaAs
GaN
GPIB
HBT
HEMT
HFET
HJFET
JFET
LF
MESFET
MHEMT
MISFET
MMIC
MODFET
MOSFET
MW
PHEMT
PHFET
PSD
SDHFET
SiC
TEGFET
VNA
Meaning
Automated Low Frequency Noise Measurement
Aluminum Gallium Nitride
Aluminum Nitride
Automated Tuner System (Maury Microwaves)
Device Under Test
Field Effect Transistor
Fast Fourier Transformation
Gallium Arsenide
Gallium Nitride
General Purpose Instrument Bus
Heterojunction Bipolar Transistor
High Electron Mobility Transistor
Heterostructure Field Effect Transistor
Heterojunction Field Effect Transistor
Junction Field Effect Transistor
Low Frequency
Metal Epitaxial Semiconductor Field Effect Transistor
Metamorphic High Electron Mobility Transistors
Metal Insulator Semiconductor Field Effect Transistor
Monolithic Microwave Integrated Circuit
Modulation Doped Semiconductor Field Effect Transistor
Metal Oxide Semiconductor Field Effect Transistor
Microwave
Pseudomorphic High Electron Mobility Transistor
Pseudomorphic Heterojunction Field Effect Transistor
Power Spectral Density
Selectively Doped Heterostructure Field Effect Transistor
Silicon Carbide
Two Dimensional Electron-Gas Field Effect Transistor
Vector Network Analyzer
PAGE 56 / 141
TOBIAS WERNER
CORRELATION BETWEEN THE FLICKER AND THE MICROWAVE NOISE OF GAN HFETS
PAGE 57 / 141
Appendix B: DERIVATIONS FOR THE FLICKER
NOISE
B.1 Derivation of the Equation relating SI with SV
The spectral voltage noise density SV , measured at the drain of a biased transistor depends
on the following drain bias network, which is changing if the voltage is adjusted.
Therefore the spectral current noise density S I is calculated from SV to have a common
base to compare measurement results. Further, in papers this parameter is mainly used to
characterize the flicker noise level and the results of this investigation can be easier
compared to results referenced in publications.
B.1.1 Linear region
If a field effect transistor is operating in the linear region, it can be considered as a voltage
controlled resistor r .
If we consider the voltage V and the value of the resistor Rres as constant, a variation ∂r of
the resistor r will lead to a variation ∂I , due to Ohm's law.
Fig. B.1: Simplified circuit to derive the relation between SI and SV.
The resistor network in Fig. B.1 shows a voltage divider, formed by r and Rres . Vmeas can
be expressed by
TOBIAS WERNER
CORRELATION BETWEEN THE FLICKER AND THE MICROWAVE NOISE OF GAN HFETS
Vmeas =
V ⋅r
.
Rres + r
PAGE 58 / 141
(B.1)
If we calculate the derivative of (B.1) with respect to r we get
∂Vmeas
V ⋅ (Rres + r ) − V ⋅ r
V ⋅ Rres
V
V ⋅r
=
−
=
=
.
2
2
∂r
Rres + r (R + r )
(Rres + r )2
(Rres + r )
res
(B.2)
Solved for ∂r and divided by r , equation (B.2) can be written as
2
∂r ∂Vmeas (Rres + r )
=
⋅
.
r
V
Rres ⋅ r
(B.3)
If we insert (B.1) in (B.3) we get
∂r ∂Vmeas Rres + r
=
⋅
.
r
Vmeas
Rres
(B.4)
For the short circuit current fluctuation, we can write
∂I ∂r ∂Vmeas Rres + r
=
=
⋅
.
I
r
Vmeas
Rres
(B.5)
If we solve (B.5) for ∂I with
Vmeas = Rres ⋅ I ,
(B.6)
square both sides of the equation and divide by ∆f , we get
2
2
∂I 2 ∂Vmeas Rres + r
=
⋅
.
∆f
∆f
Rres ⋅ r
(B.7)
The expression in (B.7) can be written as
2
R +r
S I = SV ⋅ res
,
Rres ⋅ r
(B.8)
with S I , the spectral current noise density and SV , the spectral voltage noise density [1].
TOBIAS WERNER
CORRELATION BETWEEN THE FLICKER AND THE MICROWAVE NOISE OF GAN HFETS
PAGE 59 / 141
B.1.2 Saturation region
Expression (B.8) can also be written in the form
2
1
1
S I = SV ⋅
+ .
Rres r
(B.9)
Fig. B.2: Differential resistance in the linear and saturation region.
In the saturation region the differential resistance r is much higher than in the linear region
(Fig. B.2). If r >> Rres the second term in (B.9) can be neglected and the equation can be
written as
S I = SV ⋅
1
Rres 2
.
(B.10)
TOBIAS WERNER
CORRELATION BETWEEN THE FLICKER AND THE MICROWAVE NOISE OF GAN HFETS
PAGE 60 / 141
B.2 Estimation of Rres for the present measurement system
Fig. B.3: Derivation of all parameters by the measured voltages and known resistors.
A schematic drawing of the noise measurement setup is shown in Fig. B.3a. The resistance
of R and the potentiometer P2 are known and the voltages V D , V R and Vbat are determined
for each noise measurement.
The drain source current I D can be estimated by the expression
ID =
VR − VD
R
(B.11)
and with this result the DC resistance rDC of the FET can be determined
rDC =
VD
.
ID
(B.12)
The potentiometer P2 can be replaced by two resistors R1 and R2 (Fig. B.3b), which are
related by
TOBIAS WERNER
CORRELATION BETWEEN THE FLICKER AND THE MICROWAVE NOISE OF GAN HFETS
PAGE 61 / 141
P2 = R1 + R2 .
(B.13)
rDC , R2 and R can be united to the resistor R x (Fig. B.3c), which is given by
Rx =
(rDC + R) ⋅ R2
.
rDC + R + R2
(B.14)
R1 and R x form a voltage divider and the resistance of R1 can be calculated by
R1 =
Vbat
⋅ Rx − Rx .
VR
(B.15)
Inserting (B.13) and (B.14) into (B.15) and solving for R1 , we obtain the equation
R1 =
1
⋅ (Vbat ⋅ R + Vbat ⋅ rDC + V R ⋅ P2
2 ⋅ VR
V R 2 ⋅ P2 2 + Vbat 2 ⋅ R 2 + Vbat 2 ⋅ rDC 2
+ − 2 ⋅ V R ⋅ Vbat ⋅ R ⋅ P2 − 2 ⋅ V R ⋅ Vbat ⋅ rDC ⋅ P2
.
)
(B.16)
+ 2 ⋅ Vbat 2 ⋅ R ⋅ rDC + 4 ⋅ V R 2 ⋅ R ⋅ P2 + 4 ⋅ V R 2 ⋅ rDC ⋅ P2
This equation consists only of known or measured quantities and can thus be solved.
R2 can then be determined from (B.13)
R2 = P2 − R1 .
(B.17)
With this result the network in Fig. B.3a can be transformed to that of Fig. B.1 with
Rres = R +
R1 ⋅ R2
.
R1 + R2
(B.18)
TOBIAS WERNER
CORRELATION BETWEEN THE FLICKER AND THE MICROWAVE NOISE OF GAN HFETS
PAGE 62 / 141
B.3 Estimation of the differential resistance r
Spontaneous fluctuations in current and voltage is referred to as noise. Thus it is no static but
a time dependent process. To estimate the resistance of the device under test, a linear
approximation in its working point is made. Fig. B.4 shows a sector of an IV-Curve (blue
curve) with the red dots representing the discrete measured points of the drain current
I D versus drain voltage V D .
Fig. B.4: Calculation of the differential resistance ri in the bias point Pi.
The resulting differential resistance ri for the bias point Pi can be calculated by the relation:
ri =
ri −1,i + ri,i +1
,
2
(B.19)
with
ri −1,i =
V D i − V D i −1
(B.20)
I D i − I D i −1
and
ri ,i +1 =
V D i +1 − V D i
I D i +1 − I D i
.
(B.21)
TOBIAS WERNER
CORRELATION BETWEEN THE FLICKER AND THE MICROWAVE NOISE OF GAN HFETS
PAGE 63 / 141
Appendix C: CORRELATION
If a dependence of two data ranges (in our case the parameter, representing the noise level of
the flicker noise and the microwave noise) is not directly perceptible, a mathematical
approach can help to identify the degree of reliance between the two ranges. The correlation
coefficient is such a mathematical aid and a short overview will be given how it was applied
to analyze the data.
C.1 The Correlation Coefficient
The correlation coefficient is a measure to compare, if two ranges of data X and Y are
dependent on each other. That is, whether large values of one set are associated with large
values of the other (positive correlation, correlation coefficient rX ,Y = 1), whether small
values of one set are associated with large values of the other (negative correlation,
rX ,Y = -1), or whether values in both sets are unrelated (correlation near zero, rX ,Y = 0).
The correlation coefficient is defined as the covariance of two data sets X and Y divided by
the product of their standard deviations [29]
rX ,Y =
cov X ,Y
,
σ X ⋅σ Y
(C.1)
with the covariance defined as
cov X ,Y =
1 n
⋅ ∑ ( x − x ) ⋅ ( yi − y )
n i =1 i
(C.2)
and the standard deviations defined as
n
σX =
∑ ( xi − x ) 2
i =1
n
n
, σY =
∑ ( yi − y ) 2
i =1
n
n indicates the number of points in the data range.
.
(C.3)
TOBIAS WERNER
CORRELATION BETWEEN THE FLICKER AND THE MICROWAVE NOISE OF GAN HFETS
PAGE 64 / 141
Equations (C.2) and (C.3) contain the average or mean x and y of the two data ranges,
which can be calculated by
x=
1 n
1 n
⋅ ∑ xi , y = ⋅ ∑ y i .
n i =1
n i =1
(C.4)
C.2 Least Square Regression
To visualize a dependence of two data ranges, one range is plotted versus the other in a
so-called scatter diagram (Fig. C.1).
Fig. C.1: Example of a scatter diagram.
An intuitive idea of finding a linear approximation of the relationship between the
independent and dependent variables can be obtained by drawing a line that is chosen to
minimize the squared distances between the points and the line (Fig. C.2).
TOBIAS WERNER
CORRELATION BETWEEN THE FLICKER AND THE MICROWAVE NOISE OF GAN HFETS
PAGE 65 / 141
Fig. C.2: The least squares line minimizes the squared distances between the line and the points.
The line is given [29] by
y =m⋅x +c,
(C.5)
with the slope m calculated by
m=
cov X ,Y
σX
(C.6)
and the intercept with the y-axis
c = y −m⋅x .
(C.7)
C.3 Observation range
If a dependence of two measurement sets should be analyzed, it is also important to know the
possible range of the parameters. To illustrate this idea, two graphs are shown in Fig. C.3.
The left picture shows an example, where measurement results cover the entire range of
possible values. In this case a correlation coefficient close to 1 is obtained. If the same graph
is taken, but only a sector is considered (Fig. C.3b), the correlation coefficient drops to a
much smaller value.
TOBIAS WERNER
CORRELATION BETWEEN THE FLICKER AND THE MICROWAVE NOISE OF GAN HFETS
a)
PAGE 66 / 141
b)
Fig. C.3: Different correlation results dependent on the chosen range. a) Entire range b) small sector.
In practice the parameter range is sometimes unknown or the measurement results occur only
in a limited range. In this case, a misinterpretation of the obtained result gets very likely.
C.4 The Coefficient of Determination
The regression line is defined to be the line, lying closest to the data points. It is often useful
to be able to evaluate how close the line approximate the points, what is often referred to as
the goodness of fit of the regression line.
Fig. C.4 shows a comparison of two scatter plots with regression lines with the same slope.
Although both diagrams have the same regression line, the left is referred to have a better fit
than the other, because the points are closer to the line.
Fig. C.4: Comparison of goodness of fit for two regression lines with the same slope.
TOBIAS WERNER
CORRELATION BETWEEN THE FLICKER AND THE MICROWAVE NOISE OF GAN HFETS
PAGE 67 / 141
The measure of relative closeness for evaluating the goodness of fit is called the coefficient
of determination. Because of its relationship to the correlation coefficient, this measure is
generally referred to as the rX ,Y 2 . (The coefficient of determination is the square of the
correlation coefficient.) It describes the proportion of variance in common between the two
variables. If we multiply this by 100, we get the percentage of variance in common.
C.5 Error due to small number of observations
The error due to a small number of observations can be calculated [30] by
σr =
1 − rX ,Y 2
n
,
(C.8)
with n the number of observations. The correlation coefficient can thus be written as
rres = r ± σ r .
(C.9)
TOBIAS WERNER
CORRELATION BETWEEN THE FLICKER AND THE MICROWAVE NOISE OF GAN HFETS
PAGE 68 / 141
Appendix D: WAVER INFORMATION
D.1 GaNHFET01
The high frequency properties of these devices were measured at Raytheon Corporation in a
frequency range from 2 GHz to 26 GHz.
D.1.1 Typical material properties
Mobility:
1000 cm2/Vs
Carrier sheet density:
1x1013 cm-2
Aluminum mole fraction:
Surface passivation:
Process:
15%
No
MOCVD (low pressure)
D.1.2 Layer structure
Fig. D.1: Layer structure of GaNHFET01.
TOBIAS WERNER
CORRELATION BETWEEN THE FLICKER AND THE MICROWAVE NOISE OF GAN HFETS
PAGE 69 / 141
D.1.3 Typical DC-characteristics
A typical output characteristic and typical gate leakage current is shown in Fig. D.2 for a
transistor (6,3) on waver GaNHFET01.
Fig. D.2: Typical IV-Curve for GaNHFET01.
TOBIAS WERNER
CORRELATION BETWEEN THE FLICKER AND THE MICROWAVE NOISE OF GAN HFETS
PAGE 70 / 141
D.1.4 Waver map
Transistors marked red were working devices. The DC-characteristics, S-parameters, and the
flicker and microwave noise were measured for these devices. All other device, were either
working, but had differing properties, or were not analyzed.
Fig. D.3: Waver map of GaNHFET01.
TOBIAS WERNER
CORRELATION BETWEEN THE FLICKER AND THE MICROWAVE NOISE OF GAN HFETS
D.2 GaNHFET04
D.2.1 Typical material properties
Mobility
1000 cm2/Vs
Carrier sheet density:
1x1013 cm-2
Aluminum mole fraction:
Surface passivation:
Process:
15-20%
No
MOCVD (low pressure)
D.2.2 Layer structure
Fig. D.4: Layer structure of GaNHFET04.
PAGE 71 / 141
TOBIAS WERNER
CORRELATION BETWEEN THE FLICKER AND THE MICROWAVE NOISE OF GAN HFETS
PAGE 72 / 141
D.2.3 Typical DC-characteristics
A typical output characteristic and typical gate leakage current is shown in Fig. D.5 for a
transistor (J07) on waver GaNHFET04.
Fig. D.5: Typical I-V-curve for GaNHFET04.
TOBIAS WERNER
CORRELATION BETWEEN THE FLICKER AND THE MICROWAVE NOISE OF GAN HFETS
PAGE 73 / 141
D.2.4 Waver map
Transistors marked red were working devices. The DC-characteristics, S-parameters, and the
flicker and microwave noise were measured for these devices. Devices marked gray, were
not working. All other device, were either working, but had differing properties, or were not
analyzed.
Fig. D.6: Map of the waver GaNHFET04.
TOBIAS WERNER
CORRELATION BETWEEN THE FLICKER AND THE MICROWAVE NOISE OF GAN HFETS
D.3 GaNHFET08
D.3.1 Typical material properties
Mobility
1400 cm2/Vs
Carrier sheet density:
1.1x1013 cm-2
Aluminum mole fraction:
Surface passivation:
Process:
15%
No
MOCVD (low pressure)
D.3.2 Layer structure
Fig. D.7: Layer structure of GaNHFET08.
PAGE 74 / 141
TOBIAS WERNER
CORRELATION BETWEEN THE FLICKER AND THE MICROWAVE NOISE OF GAN HFETS
PAGE 75 / 141
D.3.3 Typical DC-characteristics
A typical output characteristic and typical gate leakage current is shown in Fig. D.8 for a
transistor (C12) on waver GaNHFET08.
Fig. D.8: Typical I-V-curve for GaNHFET08.
TOBIAS WERNER
CORRELATION BETWEEN THE FLICKER AND THE MICROWAVE NOISE OF GAN HFETS
PAGE 76 / 141
D.3.4 Waver map
Transistors marked red were working devices. The DC-characteristics, S-parameters, and the
flicker and microwave noise were measured for these devices. Devices marked gray, were
not working. All other device, were either working, but had differing properties, or were not
analyzed.
Fig. D.9: Map of the waver GaNHFET08.
TOBIAS WERNER
CORRELATION BETWEEN THE FLICKER AND THE MICROWAVE NOISE OF GAN HFETS
D.4 GaNHFET10
The microwave noise on this waver was the lowest of all measured wavers.
D.4.1 Typical material properties
Mobility
1400 cm2/Vs
Carrier sheet density:
1.1x1013 cm-2
Aluminum mole fraction:
Surface passivation:
Process:
15-20%
No
MOCVD (low pressure)
D.4.2 Layer structure
Fig. D.10: Layer structure of GaNHFET10.
PAGE 77 / 141
TOBIAS WERNER
CORRELATION BETWEEN THE FLICKER AND THE MICROWAVE NOISE OF GAN HFETS
PAGE 78 / 141
D.4.3 Typical DC-characteristics
A typical output characteristic and typical gate leakage current is shown in Fig. D.11 for a
transistor (F07) on waver GaNHFET10.
Fig. D.11: Typical I-V-curve for GaNHFET10.
TOBIAS WERNER
CORRELATION BETWEEN THE FLICKER AND THE MICROWAVE NOISE OF GAN HFETS
PAGE 79 / 141
D.4.4 Noise and gain parameters
The transistor F07 on waver GaNHFET109 had the lowest measured noise level and the
noise properties of this transistor will be therefore mentioned.
Fig. D.12 shows the noise parameters and different gains as a function of the selected bias
condition. The minimum noise figure Fmin , the relative noise resistance rn , the associated
gain at minimum noise figure G a and the maximum available gain Gmax are specified for
each working point of the analyzed transistor. The optimum source reflection coefficient is
also indicated as a red dot in a small smith chart.
Fig. D.12: Noise parameters and gains of GaNHFET10_F07.
TOBIAS WERNER
CORRELATION BETWEEN THE FLICKER AND THE MICROWAVE NOISE OF GAN HFETS
PAGE 80 / 141
D.4.5 Waver map
Transistors marked red were working devices. The DC-characteristics, S-parameters, and the
flicker and microwave noise were measured for these devices. Devices marked gray, were
not working. All other device, were either working, but had differing properties, or were not
analyzed.
Fig. D.13: Map of the waver GaNHFET10.
TOBIAS WERNER
CORRELATION BETWEEN THE FLICKER AND THE MICROWAVE NOISE OF GAN HFETS
PAGE 81 / 141
Appendix E: LOW FREQUENCY NOISE
MEASUREMENT PROGRAM
Before the program was created, the low frequency noise measurement was very time
consuming and complicated. Fortunately, the SR770 is equipped with a GPIB9 interface and
can be therefore controlled by a host computer, equipped with a GPIB card.
The program provides a Windows compatible user interface, where measurement parameters
can be set and it is intended to automate the entire measurement process.
According to the settings in the interface, the measurement is divided into several sub
sections. The parameters are transferred to the instrument and the measurement is started.
When the measurement for a single section has ended, the measurement results are
transmitted back to the computer, the parameters are adjusted for the next section and the
measurement process starts again. When the last measurement section has passed, the results
are transferred to the host computer and all single measurement results are combined to one
data file, which is then stored on hard disk.
A macro for Microsoft Excel, written in Visual Basic for Applications accesses the data file
and displays the entire measurement result.
The following chapters describe roughly the implementation of the program and the user
interface. It was not the main topic of the Diploma thesis to create this program and the
documentation will therefore only give a brief overview.
E.1 Smoothing of the graph
The FFT spectrum analyzer SR770 is only capable of measuring at equidistant linear
frequency steps. If the acquired data is then plotted versus a logarithmic frequency scale, the
density of measurement points increases for higher frequencies, without providing additional
information about the qualitative course of the graph (blue graph, Fig. E.1). The program
Automated Low Frequency Noise Measurement takes this into account and provides an
option to reduces the overhead of information in the higher frequency band. If selected, only
relevant samples in a logarithmic reference frequency interval are taken. (red graph,
Fig. E.1).
9
General Purpose Instrument Bus
TOBIAS WERNER
CORRELATION BETWEEN THE FLICKER AND THE MICROWAVE NOISE OF GAN HFETS
PAGE 82 / 141
Fig. E.1: Comparison between the original (blue) and the converted data (red).
The low frequency noise was measured from 1 Hz to 100 kHz. As described before, the
entire graph consists of several single measurements in order to accurately describe as well
the lower part of the spectrum.
Fig. E.2: Comparison between combined sections of measurements taken
at linear (left, blue) and logarithmic (right, red) equidistant steps.
If measurement sections have to be combined the graph will show steps, due to a continual
increase and a sudden decrease of information, when the next measurement section begins.
This case is illustrated in the left graph of Fig. E.2 for three frequency sections. The right
picture shows the same graph, if the presented algorithm, which eliminates redundant
measurement points, is used. The graph now looks smooth like a single measurement.
TOBIAS WERNER
CORRELATION BETWEEN THE FLICKER AND THE MICROWAVE NOISE OF GAN HFETS
PAGE 83 / 141
E.2 Design of the program
The program is written in Microsoft Visual C++ 6.0 and communicates with the instrument
over the GPIB. It is designed as a multithreading application and the measurement can be as
a result interrupted at any time. This is important due to the fact that measurements can take
a long time and there should be a possibility to stop and restart it, if a wrong setting or a
sudden perturbation is discovered.
Very convenient is that the time until the predicted end of the measurement is displayed in
the status bar of the program. Especially if long measurements are taken, this makes it easy
to leave the setup unattended and to come back right when the measurement has finished.
All parameters are examined for wrong settings and items in the interface are enabled or
disabled depending on the interaction with the user, to make wrong program handling
impossible. A main rule was that the program had to be intuitive. Therefore the user interface
was designed with great care and can be seen in Fig. E.3.
Fig. E.3: The user interface of the automated low frequency noise measurement program.
TOBIAS WERNER
CORRELATION BETWEEN THE FLICKER AND THE MICROWAVE NOISE OF GAN HFETS
PAGE 84 / 141
The interface of the dialog-based program is divided into the categories Voltages, Resistors,
Frequency range, Averaging ranges, GPIB Setup, Command files and Data file. A schematic
diagram of the measurement setup shows where the corresponding voltages are measured
and resistors are located. The measurement range can be defined with a start and stop
frequency and will be split up into several sections, depending on the setting in the category
Averaging ranges. An automatic or a file-based solution can be chosen and will decide how
many sections will be used and what averaging will be applied in these sections.
In the next category the GPIB time out and GPIB address can be adjusted. To set up the
system easier, a scan function has been implemented, which scans the GPIB bus for the
name string of the SR770 and changes the address accordingly, if the instrument was found.
The initialization and setup procedure of the analyzer is not fixed and can be altered in a file.
To reduce the overhead of redundant information, an algorithm was implemented to convert
data points from an equidistant linear to an equidistant logarithmic scale. The start sample
for this conversion and if the values should be averaged can be selected.
Fig. E.4: Expressive icons are used to reflect the status of the program. Their meaning from left to
right: GPIB card search, GPIB card found, GBIP card failure, SR770 search, SR770 found,
SR770 failure, SR770 warning, SR770 save data, SR770 measurement, SR770 measurement
interrupted, SR770 measurement completed, SR770 setup ready, SR770 transferring data,
general information, general question.
Help messages for all parameters and the progress of the measurement are displayed in the
status bar of the program. Icons help to illustrate, if the messages are related to the GBIB
card, the SR770 or if it is a general hint or question. Some of the icons can be seen in
Fig. E.4.
TOBIAS WERNER
CORRELATION BETWEEN THE FLICKER AND THE MICROWAVE NOISE OF GAN HFETS
E.3 Manual
PAGE 85 / 141
TOBIAS WERNER
CORRELATION BETWEEN THE FLICKER AND THE MICROWAVE NOISE OF GAN HFETS
E.4 Program Code
The main source code can be found in the following subchapters.
E.4.1 Header file: FlickerNoiseMeasurement.h
// FlickerNoiseMeasurement.h : main header file for the FLICKERNOISEMEASUREMENT application
//
#if !defined(AFX_FLICKERNOISEMEASUREMENT_H__FF726924_2E4B_11D4_B354_0006295283FA__INCLUDED_)
#define AFX_FLICKERNOISEMEASUREMENT_H__FF726924_2E4B_11D4_B354_0006295283FA__INCLUDED_
#if _MSC_VER > 1000
#pragma once
#endif // _MSC_VER > 1000
#ifndef __AFXWIN_H__
#error include 'stdafx.h' before including this file for PCH
#endif
#include "resource.h"
#include "Decl-32.h"
// main symbols
/////////////////////////////////////////////////////////////////////////////
// CFlickerNoiseMeasurementApp:
// See FlickerNoiseMeasurement.cpp for the implementation of this class
//
class CFlickerNoiseMeasurementApp : public CWinApp
{
public:
CFlickerNoiseMeasurementApp();
// Overrides
// ClassWizard generated virtual function overrides
//{{AFX_VIRTUAL(CFlickerNoiseMeasurementApp)
public:
virtual BOOL InitInstance();
//}}AFX_VIRTUAL
// Implementation
//{{AFX_MSG(CFlickerNoiseMeasurementApp)
// NOTE - the ClassWizard will add and remove member functions here.
//
DO NOT EDIT what you see in these blocks of generated code !
//}}AFX_MSG
DECLARE_MESSAGE_MAP()
};
/////////////////////////////////////////////////////////////////////////////
//{{AFX_INSERT_LOCATION}}
// Microsoft Visual C++ will insert additional declarations immediately before the previous line.
#endif // !defined(AFX_FLICKERNOISEMEASUREMENT_H__FF726924_2E4B_11D4_B354_0006295283FA__INCLUDED_)
E.4.2 Header file: FlickerNoiseMeasurementDlg.h
// FlickerNoiseMeasurementDlg.h : header file
//
#if !defined(AFX_FLICKERNOISEMEASUREMENTDLG_H__FF726926_2E4B_11D4_B354_0006295283FA__INCLUDED_)
#define AFX_FLICKERNOISEMEASUREMENTDLG_H__FF726926_2E4B_11D4_B354_0006295283FA__INCLUDED_
#if _MSC_VER > 1000
#pragma once
#endif // _MSC_VER > 1000
#define DATA_TO_DIALOG FALSE
#define DIALOG_TO_DATA TRUE
const
const
const
const
WM_DISPLAY_STATUS
= WM_USER + 100; //benutzerdefinierte Nachricht
WM_SAVE_DATA
= WM_USER + 101; //benutzerdefinierte Nachricht
WM_MEASUREMENT_STOPED = WM_USER + 102; //benutzerdefinierte Nachricht
WM_START_COUNTDOWN = WM_USER + 103; //benutzerdefinierte Nachricht
UINT MeasureThread(LPVOID pParam); //Thread is globally defined!
/////////////////////////////////////////////////////////////////////////////
// CFlickerNoiseMeasurementDlg dialog
class CAveragingRangeType
{
public:
double Frequency;
int Averaging;
};
class CFlickerNoiseMeasurementDlg : public CDialog
{
// Construction
public:
PAGE 86 / 141
TOBIAS WERNER
CORRELATION BETWEEN THE FLICKER AND THE MICROWAVE NOISE OF GAN HFETS
int CalculateMeasurementTime();
void CorrectTimeFormat(char *Element);
void ConvertToMinutesAndSeconds(int *Seconds, int *Minutes);
int m_SecondsCounter;
void CountDownSeconds(int Seconds);
bool PollForSettlingCompletion(CFlickerNoiseMeasurementDlg* pApp, int Span);
char m_FileNameRaw[200];
int m_ComboRefStartValue;
void SetDlgControlState(bool DisableFlag);
HWND m_hWnd;
int m_DataTransferTime;
bool CreateInitInstrumentStandardFile(FILE* Handle);
bool CreateSystemSetupStandardFile(FILE* Handle);
bool CreateAveragingRangesStandardFile(FILE* Handle);
//CWinThread* m_MeasureThread;
bool InstrumentInitialized;
int CalculateAveraging(double Start, double Stop, double Factor);
// standard constructor
CFlickerNoiseMeasurementDlg(CWnd* pParent = NULL);
// functions prototypes
voidSetStandardVariableValues();
boolCalculateAveragingRanges();
boolCheckVariableRanges();
boolInstrumentActive(char *IdentificationString);
boolGetAveragingRangeEntry(char* Line, double *Frequency, int * Averaging);
int
GetNumberOfLinesInFile(FILE *Handle);
boolGetAveragingRangesFromFile();
int
GetFrequencySpan(double StartFrequency, double StopFrequency);
voidGetLastVariableSettingsFromFile();
boolGetMeasurementData(CFlickerNoiseMeasurementDlg* pApp);
boolProcessData(char *data, double *MeasurementData, int *DataPointer);
boolPollForCommandCompletion(CFlickerNoiseMeasurementDlg* pApp);
boolPollForMeasurementCompletion(CFlickerNoiseMeasurementDlg* pApp);
int
ControlFrequencyRange(double Start, double Stop, double Limit);
boolReceiveDataSR770(char *data, int count, bool exit, CFlickerNoiseMeasurementDlg* pApp);
boolSendDataSR770(char *command, CFlickerNoiseMeasurementDlg* pApp);
boolDisableBoard();
boolDoMeasurement(double StartFrequency, double StopFrequency, int Averaging, CFlickerNoiseMeasurementDlg* pApp);
boolInitInstrument();
voidGPIB_error(char *msg);
boolFindGBIPCard();
boolFindInstrument(CString IdentificationString);
voidDisplayStatus(CString StatusMessage, UINT Type=0);
voidCalculateCurrentID();
boolSaveMeasurementDataToFile();
voidSaveLastVariableSettingsToFile();
voidpause(long delay);
boolValidCommand(char* Command);
// Member Variables
int
m_DataPointerX;
int
m_DataPointerY;
double*m_MeasurementDataX;
double*m_MeasurementDataY;
charm_FileName[200];
charm_IdentificationString[50];
boolm_FirstAverage;
int
m_NumberOfPassedFrequencyRanges;
int
m_NumberOfAveragingRanges;
CAveragingRangeType *m_AveragingRanges;
int
m_InstrumentHandle;
int
m_PrimaryInstrumentAddress;
int
m_SecondaryInstrumentAddress;
int
m_TimeOut;
CString m_LastMessage;
CString m_MessageBoxCaption;
// Dialog Data
//{{AFX_DATA(CFlickerNoiseMeasurementDlg)
enum { IDD = IDD_FLICKERNOISEMEASUREMENT_DIALOG };
CComboBox m_ComboLogSample;
CStatic m_StatusIcon;
CButton m_Button_MeasureStop;
CButton m_Button_EditAvg;
CComboBox m_Combo_GPIB_Timeout;
CComboBox m_GPIB_Address;
CString m_Status;
doublem_Vr;
doublem_Vg;
doublem_Vd;
doublem_R;
doublem_P2;
doublem_P1;
doublem_FStop;
doublem_FStart;
BOOLm_CheckAverage;
int
m_Radio_AveragingMode;
BOOLm_CheckLogAverage;
CString m_TimeToGo;
//}}AFX_DATA
// ClassWizard generated virtual function overrides
//{{AFX_VIRTUAL(CFlickerNoiseMeasurementDlg)
protected:
virtual void DoDataExchange(CDataExchange* pDX); // DDX/DDV support
//}}AFX_VIRTUAL
// Implementation
protected:
HICON m_hIcon;
// Generated message map functions
//{{AFX_MSG(CFlickerNoiseMeasurementDlg)
virtual BOOL OnInitDialog();
afx_msg LONG OnStartCountdown(WPARAM Seconds, LPARAM lParam);
afx_msg LONG OnDisplayStatus(WPARAM Message, LPARAM Status);
afx_msg LONG OnSaveData(WPARAM wParam, LPARAM lParam);
afx_msg LONG OnMeasurementStoped(WPARAM wParam, LPARAM lParam);
afx_msg void OnSysCommand(UINT nID, LPARAM lParam);
afx_msg void OnPaint();
afx_msg HCURSOR OnQueryDragIcon();
afx_msg void OnMeasure();
PAGE 87 / 141
TOBIAS WERNER
CORRELATION BETWEEN THE FLICKER AND THE MICROWAVE NOISE OF GAN HFETS
PAGE 88 / 141
afx_msg void OnKillfocusEditR();
afx_msg void OnSetfocusEditFstart();
afx_msg void OnSetfocusEditFstop();
afx_msg void OnSetfocusEditP1();
afx_msg void OnSetfocusEditP2();
afx_msg void OnSetfocusEditR();
afx_msg void OnSetfocusEditVd();
afx_msg void OnSetfocusEditVg();
afx_msg void OnSetfocusEditVr();
afx_msg void OnFind();
afx_msg void OnSelchangeComboGpibAddr();
afx_msg void OnSetupSystem();
afx_msg void OnButtonEditSetup();
afx_msg void OnButtonEditInit();
afx_msg void OnButtonEditAvg();
afx_msg void OnRadioAvgAuto();
afx_msg void OnRadioAvgFile();
afx_msg void OnSetfocusComboGpibAddr();
afx_msg void OnSetfocusComboGpibTout();
afx_msg void OnSelchangeComboGpibTimeOut();
afx_msg void OnKillfocusEdit();
afx_msg void OnDestroy();
afx_msg void OnSelchangeComboLogSample();
afx_msg void OnSetfocusComboLogSample();
afx_msg void OnTimer(UINT nIDEvent);
//}}AFX_MSG
DECLARE_MESSAGE_MAP()
};
//{{AFX_INSERT_LOCATION}}
// Microsoft Visual C++ will insert additional declarations immediately before the previous line.
#endif // !defined(AFX_FLICKERNOISEMEASUREMENTDLG_H__FF726926_2E4B_11D4_B354_0006295283FA__INCLUDED_)
E.4.3 Implementation file: FlickerNoiseMeasurement.cpp
// FlickerNoiseMeasurement.cpp : Defines the class behaviors for the application.
//
#include "stdafx.h"
#include "FlickerNoiseMeasurement.h"
#include "FlickerNoiseMeasurementDlg.h"
#ifdef _DEBUG
#define new DEBUG_NEW
#undef THIS_FILE
static char THIS_FILE[] = __FILE__;
#endif
/////////////////////////////////////////////////////////////////////////////
// CFlickerNoiseMeasurementApp
BEGIN_MESSAGE_MAP(CFlickerNoiseMeasurementApp, CWinApp)
//{{AFX_MSG_MAP(CFlickerNoiseMeasurementApp)
// NOTE - the ClassWizard will add and remove mapping macros here.
//
DO NOT EDIT what you see in these blocks of generated code!
//}}AFX_MSG
ON_COMMAND(ID_HELP, CWinApp::OnHelp)
END_MESSAGE_MAP()
/////////////////////////////////////////////////////////////////////////////
// CFlickerNoiseMeasurementApp construction
CFlickerNoiseMeasurementApp::CFlickerNoiseMeasurementApp()
{
// TODO: add construction code here,
// Place all significant initialization in InitInstance
}
/////////////////////////////////////////////////////////////////////////////
// The one and only CFlickerNoiseMeasurementApp object
CFlickerNoiseMeasurementApp theApp;
/////////////////////////////////////////////////////////////////////////////
// CFlickerNoiseMeasurementApp initialization
BOOL CFlickerNoiseMeasurementApp::InitInstance()
{
AfxEnableControlContainer();
// Standard initialization
// If you are not using these features and wish to reduce the size
// of your final executable, you should remove from the following
// the specific initialization routines you do not need.
#ifdef _AFXDLL
Enable3dControls();
// Call this when using MFC in a shared DLL
#else
Enable3dControlsStatic(); // Call this when linking to MFC statically
#endif
CFlickerNoiseMeasurementDlg dlg;
m_pMainWnd = &dlg;
int nResponse = dlg.DoModal();
if (nResponse == IDOK)
{
// TODO: Place code here to handle when the dialog is
// dismissed with OK
}
else if (nResponse == IDCANCEL)
{
// TODO: Place code here to handle when the dialog is
TOBIAS WERNER
CORRELATION BETWEEN THE FLICKER AND THE MICROWAVE NOISE OF GAN HFETS
//
PAGE 89 / 141
dismissed with Cancel
}
// Since the dialog has been closed, return FALSE so that we exit the
// application, rather than start the application's message pump.
return FALSE;
}
E.4.4 Implementation file: FlickerNoiseMeasurementDlg.cpp
// FlickerNoiseMeasurementDlg.cpp : implementation file
//
#include
#include
#include
#include
#include
#include
#include
"stdafx.h"
"FlickerNoiseMeasurement.h"
"FlickerNoiseMeasurementDlg.h"
<sys\timeb.h> // used in pause()
<string.h>
<math.h>
<process.h>
/* _beginthread, _endthread */
#ifdef _DEBUG
#define new DEBUG_NEW
#undef THIS_FILE
static char THIS_FILE[] = __FILE__;
#endif
#define
#define
#define
#define
#define
#define
#define
#define
#define
#define
#define
#define
#define
#define
#define
#define
#define
#define
#define
#define
#define
#define
#define
DISABLED
FALSE
ENABLED
TRUE
STATUS_INFO
0
STATUS_QUESTION
1
STATUS_WARNING 2
STATUS_ERROR 3
STATUS_SUCCESS 4
STATUS_MEASURE 5
STATUS_TRANS 6
STATUS_CARD
7
STATUS_FIND
8
STATUS_CARD_FIND 9
STATUS_SR770 10
STATUS_SR770_OK
11
STATUS_SAVE
12
STATUS_CARD_ERROR 13
STATUS_STOPPED 14
VERSION_STRING "V1.4"// Version of parameter file
BOARD_INDEX
0
// Board index
EOTMODE
1
// Enable the END message
EOSMODE
0
// Disable the EOS mode
COMMAND
1
// Used for poll function
MEASUREMENT
2
// Used for poll function
volatile bool ThreadExitFlag;
char buffer[200];
/////////////////////////////////////////////////////////////////////////////
// CAboutDlg dialog used for App About
class CAboutDlg : public CDialog
{
public:
CAboutDlg();
// Dialog Data
//{{AFX_DATA(CAboutDlg)
enum { IDD = IDD_ABOUTBOX };
//}}AFX_DATA
// ClassWizard generated virtual function overrides
//{{AFX_VIRTUAL(CAboutDlg)
protected:
virtual void DoDataExchange(CDataExchange* pDX);
// DDX/DDV support
//}}AFX_VIRTUAL
// Implementation
protected:
//{{AFX_MSG(CAboutDlg)
//}}AFX_MSG
DECLARE_MESSAGE_MAP()
};
CAboutDlg::CAboutDlg() : CDialog(CAboutDlg::IDD)
{
//{{AFX_DATA_INIT(CAboutDlg)
//}}AFX_DATA_INIT
}
void CAboutDlg::DoDataExchange(CDataExchange* pDX)
{
CDialog::DoDataExchange(pDX);
//{{AFX_DATA_MAP(CAboutDlg)
//}}AFX_DATA_MAP
}
BEGIN_MESSAGE_MAP(CAboutDlg, CDialog)
//{{AFX_MSG_MAP(CAboutDlg)
// No message handlers
//}}AFX_MSG_MAP
END_MESSAGE_MAP()
/////////////////////////////////////////////////////////////////////////////
// CFlickerNoiseMeasurementDlg dialog
CFlickerNoiseMeasurementDlg::CFlickerNoiseMeasurementDlg(CWnd* pParent /*=NULL*/)
TOBIAS WERNER
CORRELATION BETWEEN THE FLICKER AND THE MICROWAVE NOISE OF GAN HFETS
: CDialog(CFlickerNoiseMeasurementDlg::IDD, pParent)
{
//{{AFX_DATA_INIT(CFlickerNoiseMeasurementDlg)
m_Status = _T("");
m_Vr = 0.0;
m_Vg = 0.0;
m_Vd = 0.0;
m_R = 0.0;
m_P2 = 0.0;
m_P1 = 0.0;
m_FStop = 0.0;
m_FStart = 0.0;
m_CheckAverage = FALSE;
m_Radio_AveragingMode = -1;
m_CheckLogAverage = FALSE;
m_TimeToGo = _T("");
//}}AFX_DATA_INIT
// Note that LoadIcon does not require a subsequent DestroyIcon in Win32
m_hIcon = AfxGetApp()->LoadIcon(IDR_MAINFRAME);
}
void CFlickerNoiseMeasurementDlg::DoDataExchange(CDataExchange* pDX)
{
CDialog::DoDataExchange(pDX);
//{{AFX_DATA_MAP(CFlickerNoiseMeasurementDlg)
DDX_Control(pDX, IDC_COMBO_LOG_SAMPLE, m_ComboLogSample);
DDX_Control(pDX, IDC_STATUS_ICON, m_StatusIcon);
DDX_Control(pDX, IDB_Measure, m_Button_MeasureStop);
DDX_Control(pDX, IDC_BUTTON_EDIT_AVG, m_Button_EditAvg);
DDX_Control(pDX, IDC_COMBO_GPIB_TOUT, m_Combo_GPIB_Timeout);
DDX_Control(pDX, IDC_COMBO_GPIB_ADDR, m_GPIB_Address);
DDX_Text(pDX, IDC_STATUS, m_Status);
DDX_Text(pDX, IDC_EDIT_VR, m_Vr);
DDX_Text(pDX, IDC_EDIT_VG, m_Vg);
DDX_Text(pDX, IDC_EDIT_VD, m_Vd);
DDX_Text(pDX, IDC_EDIT_R, m_R);
DDX_Text(pDX, IDC_EDIT_P2, m_P2);
DDX_Text(pDX, IDC_EDIT_P1, m_P1);
DDX_Text(pDX, IDC_EDIT_FSTOP, m_FStop);
DDX_Text(pDX, IDC_EDIT_FSTART, m_FStart);
DDX_Check(pDX, IDC_CHECK_AVG, m_CheckAverage);
DDX_Radio(pDX, IDC_RADIO_AVG_AUTO, m_Radio_AveragingMode);
DDX_Check(pDX, IDC_CHECK_LOG_AVG, m_CheckLogAverage);
DDX_Text(pDX, IDC_TIMETOGO, m_TimeToGo);
//}}AFX_DATA_MAP
}
BEGIN_MESSAGE_MAP(CFlickerNoiseMeasurementDlg, CDialog)
//{{AFX_MSG_MAP(CFlickerNoiseMeasurementDlg)
ON_MESSAGE(WM_START_COUNTDOWN, OnStartCountdown)
ON_MESSAGE(WM_DISPLAY_STATUS, OnDisplayStatus)
ON_MESSAGE(WM_SAVE_DATA, OnSaveData)
ON_MESSAGE(WM_MEASUREMENT_STOPED, OnMeasurementStoped)
ON_WM_SYSCOMMAND()
ON_WM_PAINT()
ON_WM_QUERYDRAGICON()
ON_BN_CLICKED(IDB_Measure, OnMeasure)
ON_EN_KILLFOCUS(IDC_EDIT_R, OnKillfocusEditR)
ON_EN_SETFOCUS(IDC_EDIT_FSTART, OnSetfocusEditFstart)
ON_EN_SETFOCUS(IDC_EDIT_FSTOP, OnSetfocusEditFstop)
ON_EN_SETFOCUS(IDC_EDIT_P1, OnSetfocusEditP1)
ON_EN_SETFOCUS(IDC_EDIT_P2, OnSetfocusEditP2)
ON_EN_SETFOCUS(IDC_EDIT_R, OnSetfocusEditR)
ON_EN_SETFOCUS(IDC_EDIT_VD, OnSetfocusEditVd)
ON_EN_SETFOCUS(IDC_EDIT_VG, OnSetfocusEditVg)
ON_EN_SETFOCUS(IDC_EDIT_VR, OnSetfocusEditVr)
ON_BN_CLICKED(IDC_Find, OnFind)
ON_CBN_SELCHANGE(IDC_COMBO_GPIB_ADDR, OnSelchangeComboGpibAddr)
ON_BN_CLICKED(IDC_SETUP_SYSTEM, OnSetupSystem)
ON_BN_CLICKED(IDC_BUTTON_EDIT_SETUP, OnButtonEditSetup)
ON_BN_CLICKED(IDC_BUTTON_EDIT_INIT, OnButtonEditInit)
ON_BN_CLICKED(IDC_BUTTON_EDIT_AVG, OnButtonEditAvg)
ON_BN_CLICKED(IDC_RADIO_AVG_AUTO, OnRadioAvgAuto)
ON_BN_CLICKED(IDC_RADIO_AVG_FILE, OnRadioAvgFile)
ON_CBN_SETFOCUS(IDC_COMBO_GPIB_ADDR, OnSetfocusComboGpibAddr)
ON_CBN_SETFOCUS(IDC_COMBO_GPIB_TOUT, OnSetfocusComboGpibTout)
ON_CBN_SELCHANGE(IDC_COMBO_GPIB_TOUT, OnSelchangeComboGpibTimeOut)
ON_EN_KILLFOCUS(IDC_EDIT_FSTART, OnKillfocusEdit)
ON_WM_DESTROY()
ON_CBN_SELCHANGE(IDC_COMBO_LOG_SAMPLE, OnSelchangeComboLogSample)
ON_CBN_SETFOCUS(IDC_COMBO_LOG_SAMPLE, OnSetfocusComboLogSample)
ON_EN_KILLFOCUS(IDC_EDIT_VR, OnKillfocusEditR)
ON_EN_KILLFOCUS(IDC_EDIT_VD, OnKillfocusEditR)
ON_EN_KILLFOCUS(IDC_EDIT_FSTOP, OnKillfocusEdit)
ON_EN_KILLFOCUS(IDC_EDIT_P1, OnKillfocusEdit)
ON_EN_KILLFOCUS(IDC_EDIT_P2, OnKillfocusEdit)
ON_EN_KILLFOCUS(IDC_EDIT_VG, OnKillfocusEdit)
ON_CBN_KILLFOCUS(IDC_COMBO_GPIB_ADDR, OnKillfocusEdit)
ON_CBN_KILLFOCUS(IDC_COMBO_GPIB_TOUT, OnKillfocusEdit)
ON_CBN_KILLFOCUS(IDC_COMBO_LOG_SAMPLE, OnKillfocusEdit)
ON_WM_TIMER()
//}}AFX_MSG_MAP
END_MESSAGE_MAP()
/////////////////////////////////////////////////////////////////////////////
// CFlickerNoiseMeasurementDlg message handlers
BOOL CFlickerNoiseMeasurementDlg::OnInitDialog()
{
CDialog::OnInitDialog();
// Add "About..." menu item to system menu.
// IDM_ABOUTBOX must be in the system command range.
ASSERT((IDM_ABOUTBOX & 0xFFF0) == IDM_ABOUTBOX);
ASSERT(IDM_ABOUTBOX < 0xF000);
CMenu* pSysMenu = GetSystemMenu(FALSE);
if (pSysMenu != NULL)
{
PAGE 90 / 141
TOBIAS WERNER
CORRELATION BETWEEN THE FLICKER AND THE MICROWAVE NOISE OF GAN HFETS
CString strAboutMenu;
strAboutMenu.LoadString(IDS_ABOUTBOX);
if (!strAboutMenu.IsEmpty())
{
pSysMenu->AppendMenu(MF_SEPARATOR);
pSysMenu->AppendMenu(MF_STRING, IDM_ABOUTBOX, strAboutMenu);
}
}
// Set the icon for this dialog. The framework does this automatically
// when the application's main window is not a dialog
SetIcon(m_hIcon, TRUE);
// Set big icon
//SetIcon(m_hIcon, FALSE); // Set small icon
// TODO: Add extra initialization here
m_TimeToGo = "";
m_MessageBoxCaption = "Automated Flicker Noise Measurement";
sprintf(m_IdentificationString, "Stanford_Research_Systems,SR770,s/n24484,ver091");
GetLastVariableSettingsFromFile();
if(m_Radio_AveragingMode == 0)m_Button_EditAvg.EnableWindow(FALSE);
m_GPIB_Address.SetCurSel(m_PrimaryInstrumentAddress-1); //Set GPIB address
m_Combo_GPIB_Timeout.SetCurSel(m_TimeOut); //Set time out
m_ComboLogSample.SetCurSel(m_ComboRefStartValue);
CalculateCurrentID();
UpdateData(DATA_TO_DIALOG);
InstrumentInitialized = FALSE;
return TRUE; // return TRUE unless you set the focus to a control
}
void CFlickerNoiseMeasurementDlg::OnSysCommand(UINT nID, LPARAM lParam)
{
if ((nID & 0xFFF0) == IDM_ABOUTBOX)
{
CAboutDlg dlgAbout;
dlgAbout.DoModal();
}
else
{
CDialog::OnSysCommand(nID, lParam);
}
}
// If you add a minimize button to your dialog, you will need the code below
// to draw the icon. For MFC applications using the document/view model,
// this is automatically done for you by the framework.
void CFlickerNoiseMeasurementDlg::OnPaint()
{
if (IsIconic())
{
CPaintDC dc(this); // device context for painting
SendMessage(WM_ICONERASEBKGND, (WPARAM) dc.GetSafeHdc(), 0);
// Center icon in client rectangle
int cxIcon = GetSystemMetrics(SM_CXICON);
int cyIcon = GetSystemMetrics(SM_CYICON);
CRect rect;
GetClientRect(&rect);
int x = (rect.Width() - cxIcon + 1) / 2;
int y = (rect.Height() - cyIcon + 1) / 2;
}
// Draw the icon
dc.DrawIcon(x, y, m_hIcon);
}
else
{
CDialog::OnPaint();
}
// The system calls this to obtain the cursor to display while the user drags
// the minimized window.
HCURSOR CFlickerNoiseMeasurementDlg::OnQueryDragIcon()
{
return (HCURSOR) m_hIcon;
}
void CFlickerNoiseMeasurementDlg::GetLastVariableSettingsFromFile()
{
FILE *Handle;
char Line[100];
Handle = fopen( "FNM_LastSettings.txt", "rb" );
if(Handle == NULL)
{ //no file existe! set options to standard values
SetStandardVariableValues();
}
else
{ //file exists! read lines from file.
fgets( Line, 100, Handle ); //VERSION_INFO
if(strncmp(Line, VERSION_STRING, strlen(VERSION_STRING)) == 0)
{//version identical
fgets( Line, 100, Handle );//skip file name
fgets( Line, 100, Handle );
m_Vg = atof(Line);
fgets( Line, 100, Handle );
m_Vd = atof(Line);
fgets( Line, 100, Handle );
m_Vr = atof(Line);
fgets( Line, 100, Handle );
m_P1= atof(Line);
fgets( Line, 100, Handle );
m_R = atof(Line);
fgets( Line, 100, Handle );
m_P2 = atof(Line);
fgets( Line, 100, Handle );
m_FStart = atof(Line);
fgets( Line, 100, Handle );
m_FStop = atof(Line);
PAGE 91 / 141
TOBIAS WERNER
CORRELATION BETWEEN THE FLICKER AND THE MICROWAVE NOISE OF GAN HFETS
PAGE 92 / 141
fgets( Line, 100, Handle );
m_PrimaryInstrumentAddress = atoi(Line);
fgets( Line, 100, Handle );
m_TimeOut = atoi(Line);
fgets( Line, 100, Handle );
m_CheckAverage = atoi(Line);
fgets( Line, 100, Handle );
m_Radio_AveragingMode = atoi(Line);
fgets( Line, 100, Handle );
m_ComboRefStartValue = atoi(Line);
fgets( Line, 100, Handle );
m_CheckLogAverage = atoi(Line);
fclose(Handle);
}
else
{
MessageBox("Old file version of settings file FNM_LastSettings.txt! \nStandard settings are used!",m_MessageBoxCaption,
MB_OK|MB_ICONWARNING);
SetStandardVariableValues();
}
}
}
void CFlickerNoiseMeasurementDlg::SaveLastVariableSettingsToFile()
{
FILE *Handle;
//Generate data file name
sprintf(m_FileName, "Vd=%2.4fV,Vg=%2.4fV,start=%.2fHz,stop=%.2fHz.txt", m_Vd, m_Vg, m_FStart, m_FStop);
//generate the FilName
//Generate raw data file name
sprintf(m_FileNameRaw, "Vd=%2.4fV,Vg=%2.4fV,start=%.2fHz,stop=%.2fHz_raw.txt", m_Vd, m_Vg, m_FStart, m_FStop); //generate the FilName
Handle = fopen( "FNM_LastSettings.txt", "w" );
if(Handle == NULL)
{
DisplayStatus("Error opening file FNM_LastSettings.txt for writing! Continueing...", STATUS_WARNING);
pause(1000);
}
else
{
UpdateData(DIALOG_TO_DATA);
fprintf(Handle,"%s\n", VERSION_STRING);
fprintf(Handle,"%s\n",m_FileName);
fprintf(Handle,"%4.6f\n",m_Vg);
fprintf(Handle,"%4.6f\n",m_Vd);
fprintf(Handle,"%4.6f\n",m_Vr);
fprintf(Handle,"%4.6f\n",m_P1);
fprintf(Handle,"%4.6f\n",m_R);
fprintf(Handle,"%4.6f\n",m_P2);
fprintf(Handle,"%4.6f\n",m_FStart);
fprintf(Handle,"%4.6f\n",m_FStop);
fprintf(Handle,"%d\n",m_PrimaryInstrumentAddress);
fprintf(Handle,"%d\n",m_TimeOut);
fprintf(Handle,"%d\n",m_CheckAverage);
fprintf(Handle,"%d\n",m_Radio_AveragingMode);
fprintf(Handle,"%d\n",m_ComboRefStartValue);
fprintf(Handle,"%d",m_CheckLogAverage);//Last no carriage return!!!
fclose(Handle);
}
}
void CFlickerNoiseMeasurementDlg::CalculateCurrentID()
{
double dCurrentId;
if(m_R != 0)
{
dCurrentId = (m_Vr - m_Vd)/m_R;
// m_Id.Format("ID = %4.2f mA",dCurrentId);
}
else
DisplayStatus("Resistor R = 0 is not allowed!",STATUS_WARNING);
}
void CFlickerNoiseMeasurementDlg::OnKillfocusEditR()
{
UpdateData(TRUE);
CalculateCurrentID();
DisplayStatus("");
}
void CFlickerNoiseMeasurementDlg::DisplayStatus(CString StatusMessage, UINT Type)
{
UpdateData(DIALOG_TO_DATA); //used, to update changes
CBitmap StatusIcon;
if(StatusMessage=="")
{
StatusIcon.LoadBitmap(IDB_ICON_EMPTY);
}
else
{
switch(Type)
{
case STATUS_INFO:
StatusIcon.LoadBitmap(IDB_ICON_INFORMATION);
//
MessageBeep(MB_OK);
break;
case STATUS_QUESTION:
StatusIcon.LoadBitmap(IDB_ICON_QUESTION);
//
MessageBeep(MB_ICONQUESTION);
break;
case STATUS_WARNING:
StatusIcon.LoadBitmap(IDB_ICON_WARNING);
MessageBeep(MB_ICONEXCLAMATION);
break;
case STATUS_ERROR:
StatusIcon.LoadBitmap(IDB_ICON_ERROR);
MessageBeep(MB_ICONEXCLAMATION); //MB_ICONHAND
break;
case STATUS_SUCCESS:
TOBIAS WERNER
CORRELATION BETWEEN THE FLICKER AND THE MICROWAVE NOISE OF GAN HFETS
//
//
//
//
//
StatusIcon.LoadBitmap(IDB_ICON_SUCCESS);
MessageBeep(MB_OK);
break;
case STATUS_MEASURE:
StatusIcon.LoadBitmap(IDB_ICON_MEASURE);
MessageBeep(MB_OK);
break;
case STATUS_TRANS:
StatusIcon.LoadBitmap(IDB_ICON_TRANS);
MessageBeep(MB_OK);
break;
case STATUS_CARD:
StatusIcon.LoadBitmap(IDB_ICON_CARD);
break;
case STATUS_CARD_FIND:
StatusIcon.LoadBitmap(IDB_ICON_CARD_FIND);
break;
case STATUS_CARD_ERROR:
StatusIcon.LoadBitmap(IDB_ICON_CARD_ERROR);
MessageBeep(MB_ICONEXCLAMATION);
break;
case STATUS_SAVE:
StatusIcon.LoadBitmap(IDB_ICON_SAVE);
break;
case STATUS_SR770:
StatusIcon.LoadBitmap(IDB_ICON_SR770);
MessageBeep(MB_OK);
break;
case STATUS_SR770_OK:
StatusIcon.LoadBitmap(IDB_ICON_SR770_OK);
MessageBeep(MB_OK);
break;
case STATUS_FIND:
StatusIcon.LoadBitmap(IDB_ICON_FIND);
MessageBeep(MB_OK);
break;
case STATUS_STOPPED:
StatusIcon.LoadBitmap(IDB_ICON_STOP);
MessageBeep(MB_ICONEXCLAMATION);
break;
default:
MessageBox("Wrong argument for function DisplayStatus");
}
}
m_StatusIcon.SetBitmap(HBITMAP(StatusIcon));
//CDialog::OnPaint;
UpdateWindow();
//RedrawWindow();
StatusIcon.Detach();
m_Status = StatusMessage;
UpdateData(DATA_TO_DIALOG);
}
void CFlickerNoiseMeasurementDlg::OnSetfocusEditVg()
{
m_LastMessage = "Please enter the voltage for VG in V.";
DisplayStatus(m_LastMessage);
}
void CFlickerNoiseMeasurementDlg::OnSetfocusEditVd()
{
m_LastMessage = "Please enter the voltage for VD in V.";
DisplayStatus(m_LastMessage);
}
void CFlickerNoiseMeasurementDlg::OnSetfocusEditVr()
{
m_LastMessage = "Please enter the voltage for VR in V.";
DisplayStatus(m_LastMessage);
}
void CFlickerNoiseMeasurementDlg::OnSetfocusEditP1()
{
m_LastMessage = "Please enter the resistor value for the potentiometer P1 in kOhm.";
DisplayStatus(m_LastMessage);
}
void CFlickerNoiseMeasurementDlg::OnSetfocusEditR()
{
m_LastMessage = "Please enter the resistor value for the drain resistor R in kOhm.";
DisplayStatus(m_LastMessage);
}
void CFlickerNoiseMeasurementDlg::OnSetfocusEditP2()
{
m_LastMessage = "Please enter the resistor value for the potentiometer P2 in kOhm.";
DisplayStatus(m_LastMessage);
}
void CFlickerNoiseMeasurementDlg::OnSetfocusEditFstart()
{
m_LastMessage = "Please set the start frequency in Hz. (0 Hz < start < 100000 Hz)";
DisplayStatus(m_LastMessage);
}
void CFlickerNoiseMeasurementDlg::OnSetfocusEditFstop()
{
m_LastMessage = "Please set the stop frequency in Hz. (0 Hz < stop <= 100000 Hz)";
DisplayStatus(m_LastMessage);
}
void CFlickerNoiseMeasurementDlg::OnSetfocusComboGpibAddr()
{
m_LastMessage = "Please select the GPIB Adress of the SR770. (Standard: 10)";
DisplayStatus(m_LastMessage);
}
void CFlickerNoiseMeasurementDlg::OnSetfocusComboLogSample()
{
m_LastMessage = "Please select the start sample for the logarithmic data conversion. (Standard: 20)";
PAGE 93 / 141
TOBIAS WERNER
CORRELATION BETWEEN THE FLICKER AND THE MICROWAVE NOISE OF GAN HFETS
DisplayStatus(m_LastMessage);
}
void CFlickerNoiseMeasurementDlg::OnSetfocusComboGpibTout()
{
m_LastMessage = "Please select the timeout for the SR770. (Standard: 10 s)";
DisplayStatus(m_LastMessage);
}
void CFlickerNoiseMeasurementDlg::GPIB_error(char *msg)
{
char str[100];
char tempbuf[20];
// Start the Message with the failing GPIB call.
sprintf(str, msg);
// Add ibsta information to the Message String.
strcat(str, " ibsta = &H");
itoa(ibsta, tempbuf, 16);
strcat(str, tempbuf);
strcat(str, " <");
if (ibsta & ERR ) strcat(str, " ERR");
if (ibsta & TIMO) strcat(str, " TIMO");
if (ibsta & END ) strcat(str, " END");
if (ibsta & SRQI) strcat(str, " SRQI");
if (ibsta & RQS ) strcat(str, " RQS");
if (ibsta & CMPL) strcat(str, " CMPL");
if (ibsta & LOK ) strcat(str, " LOK");
if (ibsta & REM ) strcat(str, " REM");
if (ibsta & CIC ) strcat(str, " CIC");
if (ibsta & ATN ) strcat(str, " ATN");
if (ibsta & TACS) strcat(str, " TACS");
if (ibsta & LACS) strcat(str, " LACS");
if (ibsta & DTAS) strcat(str, " DTAS");
if (ibsta & DCAS) strcat(str, " DCAS");
strcat(str, " >");
// Add iberr information to the Message String.
strcat(str, "\niberr = ");
itoa(iberr, tempbuf, 10);
strcat(str, tempbuf);
if (iberr == EDVR) strcat(str, " EDVR <DOS Error>");
if (iberr == ECIC) strcat(str, " ECIC <Not CIC>");
if (iberr == ENOL) strcat(str, " ENOL <No Listener>");
if (iberr == EADR) strcat(str, " EADR <Address error>");
if (iberr == EARG) strcat(str, " EARG <Invalid argument>");
if (iberr == ESAC) strcat(str, " ESAC <Not Sys Ctrlr>");
if (iberr == EABO) strcat(str, " EABO <Op. aborted>");
if (iberr == ENEB) strcat(str, " ENEB <No GPIB board>");
if (iberr == EOIP) strcat(str, " EOIP <Async I/O in prg>");
if (iberr == ECAP) strcat(str, " ECAP <No capability>");
if (iberr == EFSO) strcat(str, " EFSO <File sys. error>");
if (iberr == EBUS) strcat(str, " EBUS <Command error>");
if (iberr == ESTB) strcat(str, " ESTB <Status byte lost>");
if (iberr == ESRQ) strcat(str, " ESRQ <SRQ stuck on>");
if (iberr == ETAB) strcat(str, " ETAB <Table Overflow>");
// Add ibcntl information to the Message String.
strcat(str, "\nibcntl = ");
ultoa(ibcntl, tempbuf, 16);
strcat(str, tempbuf);
AfxMessageBox(str, MB_ICONSTOP, 0);
// Call the ibonl function to disable the hardware and software.
ibonl(0, 0);
}
bool CFlickerNoiseMeasurementDlg::FindGBIPCard()
{
DisplayStatus("Searching GPIB card...", STATUS_CARD_FIND);
pause(1000);
SendIFC(0); //at board address 0
if (ibsta & ERR)
{
SetDlgControlState(ENABLED);
sprintf(buffer, "No GPIB card was found on this computer!");
DisplayStatus(buffer,STATUS_CARD_ERROR);
return(FALSE);
}
DisplayStatus("GPIB card found!", STATUS_CARD);
pause(1000);
return(TRUE);
}
bool CFlickerNoiseMeasurementDlg::InitInstrument()
{
FILE *Handle;
char Command[100];
DisplayStatus("Initializing the instrument...", STATUS_SR770);
sprintf(Command, "FNM_InstrumentInit.txt");
Handle = fopen(Command, "rb" );
if(Handle == NULL)
{ //no file existe! Create file with standard init commands
Handle = fopen(Command, "w" );
if(Handle == NULL)
{
SetDlgControlState(ENABLED);
DisplayStatus("Error creating file FNM_SystemSetup.txt! Write protection? Disc space?",STATUS_ERROR);
return(FALSE);
}
CreateInitInstrumentStandardFile(Handle);
fclose(Handle);
Handle = fopen(Command, "rb" );
}
while(!feof(Handle))
{
PAGE 94 / 141
TOBIAS WERNER
CORRELATION BETWEEN THE FLICKER AND THE MICROWAVE NOISE OF GAN HFETS
PAGE 95 / 141
fgets(Command, 100, Handle ); //get Command
if(ValidCommand(Command))
{
if(!SendDataSR770(Command, this))
{
SetDlgControlState(ENABLED);
DisplayStatus("ERROR Initializing the SR770!",STATUS_ERROR);
return(FALSE);
}
if(!strncmp(Command,"ARNG1",6))
pause(5000); //after Autoranging
}
}
DisplayStatus("Instrument initialized!", STATUS_SR770_OK);
pause(1000);
return(TRUE);
}
bool CFlickerNoiseMeasurementDlg::SaveMeasurementDataToFile()
{
int Answer;
char MessageString[200];
FILE *Handle1, *Handle2;
int CurrentRangeINDEX, CurrentValueINDEX, CurrentFrequencyRangeINDEX,CurrentSeriesValueINDEX, FirstRefValue, MeanCounter;
double LastFrequency, RefFrequencyStep_log, ThisFrequency_log, NextFrequency_log, MeanAccuY, MeanFrequency, LastMeanFrequency;
DisplayStatus("Storing data...",STATUS_SAVE);
pause(1000); //to display the information
//try to open the data file for read to look if file existes
Handle1 = fopen( m_FileName, "rb" );
if(Handle1 != NULL)
{
fclose(Handle1);
sprintf(MessageString, "The file %s existes!\nDo you want to overwrite the existing file!", m_FileName);
Answer = MessageBox(MessageString,m_MessageBoxCaption, MB_OKCANCEL|MB_ICONWARNING);
if(Answer == 2)//Cancel selected
return(FALSE);
}
do{
Handle1 = fopen( m_FileName, "w" );
if(Handle1 == NULL)
{
sprintf(MessageString, "Error opening file %s for writing!\nPlease make sure, that file is not opened by another application!", m_FileName);
Answer = MessageBox(MessageString,m_MessageBoxCaption, MB_RETRYCANCEL|MB_ICONWARNING);
if(Answer == 2)//Cancel selected
return(FALSE);
}
}while(Handle1 == NULL);
//try to open the raw data file for read to look if file existes
Handle2 = fopen( m_FileNameRaw, "rb" );
if(Handle2 != NULL)
{
fclose(Handle2);
sprintf(MessageString, "The file %s existes!\nDo you want to overwrite the existing file!", m_FileNameRaw);
Answer = MessageBox(MessageString,m_MessageBoxCaption, MB_OKCANCEL|MB_ICONWARNING);
if(Answer == 2)//Cancel selected
return(FALSE);
}
do{
Handle2 = fopen(m_FileNameRaw, "w" );
if(Handle2 == NULL)
{
sprintf(MessageString, "Error opening file %s for writing!\nPlease make sure, that file is not opened by another application!",
m_FileNameRaw);
Answer = MessageBox(MessageString,m_MessageBoxCaption, MB_RETRYCANCEL|MB_ICONWARNING);
if(Answer == 2)//Cancel selected
return(FALSE);
}
}while(Handle2 == NULL);
m_ComboLogSample.GetLBText(m_ComboRefStartValue, buffer);
FirstRefValue = atoi(buffer)-1;
LastFrequency = -1; //0Hz can also be for the first value
//Output all the settings and frequency ranges to the file
fprintf(Handle1, "VG =\t%6.6f\tVD =\t%6.6f\tVR =\t%6.6f\n", m_Vg, m_Vd, m_Vr);
fprintf(Handle1, "P1 =\t%6.6f\tR =\t%6.6f\tP2 =\t%6.6f\n", m_P1, m_R, m_P2);
fprintf(Handle1, "ConvStart =\tsample %d\tAVG =\t%d\n", FirstRefValue+1, m_CheckLogAverage);
fprintf(Handle1, "FStart =\t%6.6f\tFStop =\t%6.6f\n", m_FStart, m_FStop);
fprintf(Handle1, "RANGE\tFREQ[Hz]\tAveraging\tRang#=\t%d\n", m_NumberOfAveragingRanges);
for(CurrentRangeINDEX=0; CurrentRangeINDEX<m_NumberOfAveragingRanges; CurrentRangeINDEX++)
{
fprintf(Handle1, "Range%d\t%6.6f\t%d\n", CurrentRangeINDEX+1,
m_AveragingRanges[CurrentRangeINDEX].Frequency,m_AveragingRanges[CurrentRangeINDEX].Averaging);
}
//Output the measurement values
for(CurrentFrequencyRangeINDEX = 0; CurrentFrequencyRangeINDEX < m_NumberOfPassedFrequencyRanges ; CurrentFrequencyRangeINDEX++)
{
MeanCounter = 0;
MeanAccuY = 0;
for(CurrentSeriesValueINDEX = 0; CurrentSeriesValueINDEX < 400; CurrentSeriesValueINDEX++)
{
CurrentValueINDEX = CurrentFrequencyRangeINDEX*400 + CurrentSeriesValueINDEX;
//output to raw data file (entire samples)
fprintf(Handle2, "%6.6f\t%6.6f\n", m_MeasurementDataX[CurrentValueINDEX], m_MeasurementDataY[CurrentValueINDEX]);
if(m_MeasurementDataX[CurrentValueINDEX]>LastFrequency && m_MeasurementDataX[CurrentValueINDEX]>=0)
{
if(CurrentValueINDEX<FirstRefValue)
{//take the first "FirstRefValue" values and write it to the file
fprintf(Handle1, "%6.6f\t%6.6f\n", m_MeasurementDataX[CurrentValueINDEX], m_MeasurementDataY[CurrentValueINDEX]);
LastFrequency = m_MeasurementDataX[CurrentValueINDEX];
}
else
{
if(CurrentValueINDEX==FirstRefValue)
{
TOBIAS WERNER
CORRELATION BETWEEN THE FLICKER AND THE MICROWAVE NOISE OF GAN HFETS
PAGE 96 / 141
fprintf(Handle1, "%6.6f\t %6.6f\n", m_MeasurementDataX[CurrentValueINDEX], m_MeasurementDataY[CurrentValueINDEX]);
RefFrequencyStep_log = log(m_MeasurementDataX[CurrentValueINDEX]) - log(m_MeasurementDataX[CurrentValueINDEX-1]);
NextFrequency_log = log(m_MeasurementDataX[CurrentValueINDEX])+RefFrequencyStep_log;
LastFrequency = m_MeasurementDataX[CurrentValueINDEX];
}
else
{
ThisFrequency_log = log(m_MeasurementDataX[CurrentValueINDEX]);
MeanCounter++;
if(MeanCounter == 1)LastMeanFrequency=m_MeasurementDataX[CurrentValueINDEX];
MeanAccuY += m_MeasurementDataY[CurrentValueINDEX];
if(ThisFrequency_log > NextFrequency_log)
{
if(m_CheckLogAverage) //take the mean for the last values
{
MeanFrequency = LastMeanFrequency + (m_MeasurementDataX[CurrentValueINDEX]-LastMeanFrequency)/2.0;
fprintf(Handle1, "%6.6f\t %6.6f\n", MeanFrequency, MeanAccuY/MeanCounter);
}
else //take only the value at this frequency
fprintf(Handle1, "%6.6f\t %6.6f\n", m_MeasurementDataX[CurrentValueINDEX], m_MeasurementDataY[CurrentValueINDEX]);
MeanCounter = 0;
MeanAccuY = 0;
NextFrequency_log += RefFrequencyStep_log;
LastFrequency = m_MeasurementDataX[CurrentValueINDEX];
}
else
{
if(CurrentValueINDEX == ((m_NumberOfPassedFrequencyRanges *400)-1)) //store last value in series
fprintf(Handle1, "%6.6f\t %6.6f\n", m_MeasurementDataX[CurrentValueINDEX], m_MeasurementDataY[CurrentValueINDEX]);
}
}
}
}
}
}
fclose(Handle1);
fclose(Handle2);
return(TRUE);
}
bool CFlickerNoiseMeasurementDlg::DisableBoard()
{
ibonl (BOARD_INDEX, 0);
SendDataSR770("LOCL0", this); // set to local
//free allocated memory NOCH: Wieder aktivieren und ueberlegen!
//free(m_MeasurementDataX);
//free(m_MeasurementDataY);
//free(m_AveragingRanges);
return(TRUE);
}
bool CFlickerNoiseMeasurementDlg::SendDataSR770(char *command, CFlickerNoiseMeasurementDlg* pApp)
{
char Command[100];
sprintf(Command,"%s", command);
strcat(Command, "\n"); //NOCH: Ueberpruefen, ob richtig x0D = 13
ibwrt (pApp->m_InstrumentHandle, Command, strlen(Command));
if (ibsta & ERR)
{
sprintf(buffer, "Send ERROR! Unrecognized command >>%s<<. Check commands in initialization or system setup file!", command);
pApp->DisplayStatus(buffer, STATUS_ERROR);
return(FALSE); //Quit function
}
if(!pApp->PollForCommandCompletion(pApp))return(FALSE);
return(TRUE);
}
bool CFlickerNoiseMeasurementDlg::ReceiveDataSR770(char *data, int count, bool exit, CFlickerNoiseMeasurementDlg* pApp)
{
ibrd (pApp->m_InstrumentHandle, data, count);
if ((ibsta & ERR) && exit==TRUE)
{
sprintf(data, "Error reading from instrument at address %d!", pApp->m_PrimaryInstrumentAddress);
::PostMessage(pApp->m_hWnd, WM_DISPLAY_STATUS, (WPARAM)data, (LPARAM)STATUS_ERROR);
return(FALSE);
}
else
{
data[ibcnt-1] = '\0';
}
if(!pApp->PollForCommandCompletion(pApp))return(FALSE);
return(TRUE);
}
int CFlickerNoiseMeasurementDlg::ControlFrequencyRange(double Start, double Stop, double Limit)
{
if(Start < Limit && Stop <= Limit)
return(0); //both are in the region
if(Start < Limit && Stop > Limit)
return(1); //overlapping
if(Start >= Limit && Stop > Limit)
return(2); //not in region
return(2);
}
void CFlickerNoiseMeasurementDlg::pause(long delay)
{//delay - time to pause in milliseconds
long stop_ms,ms;
struct timeb tbuf;
ftime(&tbuf);
stop_ms = tbuf.time/1000000;
stop_ms = tbuf.time - stop_ms * 1000000;
stop_ms = 1000 * stop_ms + tbuf.millitm + delay;
do
{
ftime(&tbuf);
ms = tbuf.time/1000000;
TOBIAS WERNER
CORRELATION BETWEEN THE FLICKER AND THE MICROWAVE NOISE OF GAN HFETS
ms = tbuf.time - ms * 1000000;
ms = 1000 * ms + tbuf.millitm;
}
while (ms < stop_ms);
} /* end pause */
int CFlickerNoiseMeasurementDlg::GetFrequencySpan(double StartFrequency, double StopFrequency)
{
double FrequencySpan = StopFrequency - StartFrequency;
if(FrequencySpan < 0.191)
return(0);
if(FrequencySpan < 0.382)
return(1);
if(FrequencySpan < 0.763)
return(2);
if(FrequencySpan < 1.5)
return(3);
if(FrequencySpan < 3.1)
return(4);
if(FrequencySpan < 6.1)
return(5);
if(FrequencySpan < 12.2)
return(6);
if(FrequencySpan < 24.4)
return(7);
if(FrequencySpan < 48.75)
return(8);
if(FrequencySpan < 97.5)
return(9);
if(FrequencySpan < 195)
return(10);
if(FrequencySpan < 390)
return(11);
if(FrequencySpan < 780)
return(12);
if(FrequencySpan < 1560)
return(13);
if(FrequencySpan < 3125)
return(14);
if(FrequencySpan < 6250)
return(15);
if(FrequencySpan < 12500)
return(16);
if(FrequencySpan < 25000)
return(17);
if(FrequencySpan < 50000)
return(18);
else
return(19);
}
bool CFlickerNoiseMeasurementDlg::PollForMeasurementCompletion(CFlickerNoiseMeasurementDlg* pApp)
{
char serPol;
int Status;
//delete the OVERLOAD flag (ignore any previous overloads)
/*ibwrt (m_InstrumentHandle, "ERRE7,0", 7);
if (ibsta & ERR)
{
return(FALSE);
}
*///start polling
do
{
ibrsp(pApp->m_InstrumentHandle,&serPol);
/* //Check overload
ibwrt (m_InstrumentHandle, "ERRS?", 5);
if (ibsta & ERR)
{
return(FALSE);
}
ibrd (m_InstrumentHandle, buffer, 100);
if (ibsta & ERR)
{
return(FALSE);
}
buffer[ibcnt-1] = '\0';
Status = atoi(buffer);
if( Status!=128)
*/
}while ((serPol&1)==0 && ThreadExitFlag==FALSE); //Frage, ob man das ueberhaupt braucht?
if(ThreadExitFlag==TRUE)
{
::PostMessage(pApp->m_hWnd, WM_MEASUREMENT_STOPED, 0, 0);
return(FALSE);
}
return(TRUE);
}
bool CFlickerNoiseMeasurementDlg::PollForSettlingCompletion(CFlickerNoiseMeasurementDlg *pApp, int Span)
{
int Status;
UINT counter=0;
do
{
ibwrt (m_InstrumentHandle, "FFTS?", 5);
if (ibsta & ERR)
{
return(FALSE);
}
ibrd (m_InstrumentHandle, buffer, 100);
if (ibsta & ERR)
{
return(FALSE);
}
buffer[ibcnt-1] = '\0';
PAGE 97 / 141
TOBIAS WERNER
CORRELATION BETWEEN THE FLICKER AND THE MICROWAVE NOISE OF GAN HFETS
PAGE 98 / 141
counter++;
Status = atoi(buffer);
}while ((counter==1 || Status!=128) && ThreadExitFlag==FALSE && counter<(100000));
return(TRUE);
}
bool CFlickerNoiseMeasurementDlg::PollForCommandCompletion(CFlickerNoiseMeasurementDlg* pApp)
{
char serPol;
do
{
ibrsp(pApp->m_InstrumentHandle,&serPol);
}while ((serPol&2)==0&& ThreadExitFlag==FALSE); //Frage, ob das ueberhaupt gebraucht wird, da der Networkanalyzer sowieso das Flag hochzieht,
nachdem er ein Stopkommando erhalten hat!
if(ThreadExitFlag==TRUE)
{
::PostMessage(pApp->m_hWnd, WM_MEASUREMENT_STOPED, 0, 0);
ThreadExitFlag =FALSE;
return(FALSE);
}
return(TRUE);
}
bool CFlickerNoiseMeasurementDlg::GetMeasurementData(CFlickerNoiseMeasurementDlg* pApp)
{
char dataBuffer[30];
char Message[200];
int CurrentValueINDEX;
sprintf(Message, "Getting measurement data from SR770...");
::PostMessage(pApp->m_hWnd, WM_DISPLAY_STATUS, (WPARAM)Message, (LPARAM)STATUS_TRANS);
for(CurrentValueINDEX=0;CurrentValueINDEX<400;CurrentValueINDEX++)
{
sprintf(dataBuffer, "SPEC?0,%d",CurrentValueINDEX);
if(!pApp->SendDataSR770(dataBuffer,pApp))return(FALSE);
if(!pApp->ReceiveDataSR770(dataBuffer, 30, TRUE, pApp))return(FALSE);
pApp->m_MeasurementDataY[pApp->m_DataPointerY] = atof(dataBuffer);
pApp->m_DataPointerY++;
}
for(CurrentValueINDEX=0;CurrentValueINDEX<400;CurrentValueINDEX++)
{
sprintf(dataBuffer, "BVAL?0,%d",CurrentValueINDEX);
if(!pApp->SendDataSR770(dataBuffer,pApp))return(FALSE);
if(!pApp->ReceiveDataSR770(dataBuffer, 30, TRUE,pApp))return(FALSE);
pApp->m_MeasurementDataX[pApp->m_DataPointerX] = atof(dataBuffer);
pApp->m_DataPointerX++;
}
return(TRUE);
}
bool CFlickerNoiseMeasurementDlg::GetAveragingRangesFromFile()
{
FILE *Handle;
char Line[100];
int CurrentLimitINDEX;
}
Handle = fopen( "FNM_AveragingRanges.txt", "rb" );
if(Handle == NULL)
{ //no file existe! set options to standard values
Handle = fopen("FNM_AveragingRanges.txt", "w" );
if(Handle == NULL)
{
SetDlgControlState(ENABLED);
DisplayStatus("Error creating file FNM_AveragingRanges.txt! Write protection? Disc space?", STATUS_ERROR);
return(FALSE);
}
CreateAveragingRangesStandardFile(Handle);
fclose(Handle);
Handle = fopen( "FNM_AveragingRanges.txt", "rb" );
}
m_NumberOfAveragingRanges = GetNumberOfLinesInFile(Handle)- 17;
fclose(Handle);
Handle = fopen( "FNM_AveragingRanges.txt", "rb" );
m_AveragingRanges = (CAveragingRangeType*)calloc((unsigned)m_NumberOfAveragingRanges, sizeof(CAveragingRangeType));
for(CurrentLimitINDEX = 0; CurrentLimitINDEX < 17; CurrentLimitINDEX++)
fgets( Line, 100, Handle ); //skip line (used for comments)
for(CurrentLimitINDEX = 0; CurrentLimitINDEX < m_NumberOfAveragingRanges; CurrentLimitINDEX++)
{
fgets( Line, 100, Handle );
GetAveragingRangeEntry(Line, &m_AveragingRanges[CurrentLimitINDEX].Frequency, &m_AveragingRanges[CurrentLimitINDEX].Averaging);
}
if(m_AveragingRanges[CurrentLimitINDEX-1].Frequency!=100000)
m_AveragingRanges[CurrentLimitINDEX-1].Frequency = 100000; //Last frequency has to be 100000
fclose(Handle);
return(TRUE);
int CFlickerNoiseMeasurementDlg::GetNumberOfLinesInFile(FILE *Handle)
{
char Line[100], LastLine[100];
FILE *BufferHandle;
BufferHandle = Handle;
int LineCounter = 0;
}
while(!feof(Handle))
{
fgets( Line, 100, Handle );
if(strncmp(Line,LastLine,strlen(Line)))
{
if(ValidCommand(Line))
LineCounter++;
}
strcpy(LastLine,Line);
}
Handle = BufferHandle;
return(LineCounter);
TOBIAS WERNER
CORRELATION BETWEEN THE FLICKER AND THE MICROWAVE NOISE OF GAN HFETS
PAGE 99 / 141
bool CFlickerNoiseMeasurementDlg::GetAveragingRangeEntry(char *Line, double *Frequency, int *Averaging)
{
char *Search, *Search2;
Search = Line;
Search2 = Search;
while(*Search2 != ',' && *Search2 != 0 ) Search2++;
*Search2 = 0;
*Frequency= atof(Search);
Search = ++Search2;
while(*Search2 != 0 ) Search2++;
*Search2 = 0;
*Averaging= atoi(Search);
return(TRUE);
}
void CFlickerNoiseMeasurementDlg::OnFind()
{
int loop, num_listeners, pad, sad, Dev;
Addr4882_t instruments[32], result[31];
char Message[100];
if(!FindGBIPCard()) return;
DisplayStatus("Searching for SR770 on GPIB bus...", STATUS_FIND);
pause(1000);
for (loop = 0; loop <= 30; loop++)
{
instruments[loop] = (Addr4882_t)loop;
}
instruments[31] = NOADDR;
FindLstn(0, &instruments[1], (Addr4882_t *)result, 31);
if (ibsta & ERR)
{
DisplayStatus("ERROR finding SR770. No instruments found on the bus! Connected to bus?", STATUS_ERROR);
return;
}
num_listeners = ibcnt;
for (loop = 0; loop < num_listeners; loop++)
{
pad = GetPAD(result[loop]);
sad = GetSAD(result[loop]);
sprintf(Message, "Trying to query instrument at address %d...", pad);
DisplayStatus(Message, STATUS_SR770);// Normally replaced quickly by following messages
pause(1000);
Dev = ibdev(BOARD_INDEX, pad, sad, 13, EOTMODE, EOSMODE);
if(!(ibsta & ERR))
{//no error occured
ibclr(Dev);
/* Clear the device
*/
if(!(ibsta & ERR))
{//no error clearing the device
sprintf(Message, "Trying to get identification string from instrument at address %d...", pad);
DisplayStatus(Message, STATUS_SR770);// Normally replaced quickly by following messages
ibwrt (Dev, "*IDN?\n", 7L);
if(!(ibsta & ERR))
{//no error sending identification string
ibrd (Dev, buffer, 100);
if(!(ibsta & ERR))
{//no error getting identification string
buffer[ibcnt-1] = '\0'; //eliminate the carriage return (Asc: 10)
if (strncmp(buffer, m_IdentificationString, strlen(m_IdentificationString)) == 0)
{
sprintf(buffer,"SR770 found at address %d!",pad);
DisplayStatus(buffer, STATUS_SR770_OK);
m_PrimaryInstrumentAddress = (Addr4882_t)pad; //Init the Instrument address
m_SecondaryInstrumentAddress = (Addr4882_t)sad;
m_InstrumentHandle = Dev;
m_GPIB_Address.SetCurSel(m_PrimaryInstrumentAddress-1);
UpdateData(DATA_TO_DIALOG);
break; //quit the for loop
}
}
}
}
}
}
/* End of FOR loop */
if (loop >= num_listeners)
{
DisplayStatus("The FFT Network Analyzer SR770 has not been found! \nPlease make sure, that the device is powered on and is properly connected
to the GPIB bus.", STATUS_ERROR);
return;
}
}
void CFlickerNoiseMeasurementDlg::OnSelchangeComboGpibAddr()
{
m_PrimaryInstrumentAddress = m_GPIB_Address.GetCurSel()+1;
}
bool CFlickerNoiseMeasurementDlg::InstrumentActive(char *IdentificationString)
{
int Dev, pad, sad;
DisplayStatus("Searching for SR770 on GPIB bus...", STATUS_FIND);
pause(1000);
pad = GetPAD(m_PrimaryInstrumentAddress);
sad = GetSAD(m_PrimaryInstrumentAddress);
Dev = ibdev(BOARD_INDEX, pad, sad, m_TimeOut, EOTMODE, EOSMODE);
if (ibsta & ERR)
{
SetDlgControlState(ENABLED);
sprintf(buffer, "Unable to open device SR770 at address %d!", m_PrimaryInstrumentAddress);
DisplayStatus(buffer, STATUS_ERROR);
ibonl(0, 0); //free GPIB card
return FALSE;
}
TOBIAS WERNER
CORRELATION BETWEEN THE FLICKER AND THE MICROWAVE NOISE OF GAN HFETS
ibclr(Dev);
/* Clear the device
*/
if (ibsta & ERR)
{
SetDlgControlState(ENABLED);
sprintf(buffer, "Unable to clear device SR770 at address %d!", m_PrimaryInstrumentAddress);
DisplayStatus(buffer, STATUS_ERROR);
ibonl(0, 0); //free GPIB card
return FALSE;
}
ibwrt (Dev, "*IDN?\n", 7L);
if (ibsta & ERR)
{
SetDlgControlState(ENABLED);
DisplayStatus("ERROR! SR770 turned on? Connected to GPIB bus? Time out? Address?", STATUS_ERROR);
ibonl(0, 0); //free GPIB card
return FALSE;
}
ibrd (Dev, buffer, 100);
if (ibsta & ERR)
{
SetDlgControlState(ENABLED);
DisplayStatus("ERROR! SR770 turned on? Connected to GPIB bus? Time out? Address?", STATUS_ERROR);
ibonl(0, 0); //free GPIB card
return FALSE;
}
buffer[ibcnt-1] = '\0';
if (strncmp(buffer, IdentificationString, strlen(IdentificationString)) == 0)
{
sprintf(buffer,"SR770 found at address %d!",pad);
DisplayStatus(buffer, STATUS_SR770_OK);
pause(1000);
m_InstrumentHandle = Dev;
m_PrimaryInstrumentAddress = (Addr4882_t)pad;
m_SecondaryInstrumentAddress = (Addr4882_t)sad;
return(TRUE);
}
SetDlgControlState(ENABLED);
sprintf(buffer, "SR770 not found at address %d! Use Find... to search for the instrument!", m_PrimaryInstrumentAddress);
DisplayStatus(buffer, STATUS_ERROR);
return(FALSE);
}
void CFlickerNoiseMeasurementDlg::OnSetupSystem()
{
FILE *Handle;
char Command[100];
int AveragingFlag;
}
if(!FindGBIPCard()) return;
if(!InstrumentActive(m_IdentificationString)) return;
if(!InitInstrument()) return;
DisplayStatus("Prepare instrument for setup...", STATUS_SR770);
sprintf(Command, "FNM_SystemSetup.txt");
Handle = fopen(Command, "rb" );
if(Handle == NULL)
{ //no file existe! Create file with standard init commands
Handle = fopen(Command, "w" );
if(Handle == NULL)
{
SetDlgControlState(ENABLED);
DisplayStatus("Error creating file FNM_SystemSetup.txt! Write protection? Disc space?", STATUS_ERROR);
return;
}
CreateSystemSetupStandardFile(Handle);
fclose(Handle);
Handle = fopen(Command, "rb" );
}
if(!SendDataSR770("ALRM0", this))return; //disable sound
while(!feof(Handle))
{
fgets(Command, 100, Handle ); //get Command
if(ValidCommand(Command))
{
if(!SendDataSR770(Command, this))
{
DisplayStatus("ERROR preparing the SR770 for Setup!!", STATUS_ERROR);
return;
}
if(!strncmp(Command,"ARNG1",6))
{
// BEGIN
if(!SendDataSR770("AVGO?", this))return; //Query Averaging
if(!ReceiveDataSR770(Command, 30, TRUE, this))return; //Get result for Averaging
AveragingFlag = atoi(Command);
if(!SendDataSR770("AVGO0", this))return; //Averaging OFF
if(!SendDataSR770("STRT", this))return; //Start measurement
if(!SendDataSR770("ARNG1", this))return; //Auto ranging on
pause(5000);
if(!SendDataSR770("ARNG0", this))return; //Auto ranging off
if(!SendDataSR770("STOP", this))return; //Start measurement
sprintf(Command, "AVGO%d",AveragingFlag);
if(!SendDataSR770(Command, this))return; //Set Averaging back to last setting
}
}
}
DisplayStatus("System is now ready for setup!", STATUS_SR770_OK);
SendDataSR770("ALRM1", this);
SendDataSR770("MSGSSYSTEM_READY", this);
bool CFlickerNoiseMeasurementDlg::CheckVariableRanges()
{
double Dummy;
if(m_FStart<=0)
{
SetDlgControlState(ENABLED);
GetDlgItem(IDC_EDIT_FSTART)->SetFocus();
PAGE 100 / 141
TOBIAS WERNER
CORRELATION BETWEEN THE FLICKER AND THE MICROWAVE NOISE OF GAN HFETS
DisplayStatus("Start frequency has to be positive and unequal to unity!",STATUS_WARNING);
return(FALSE);
}
if(m_FStop<=0)
{
SetDlgControlState(ENABLED);
GetDlgItem(IDC_EDIT_FSTOP)->SetFocus();
DisplayStatus("Stop frequency has to be positive and unequal to unity!",STATUS_WARNING);
return(FALSE);
}
if(m_FStart>100000)
{
SetDlgControlState(ENABLED);
GetDlgItem(IDC_EDIT_FSTART)->SetFocus();
DisplayStatus("Start frequency has to be below 100000 Hz!",STATUS_WARNING);
return(FALSE);
}
if(m_FStop>100000)
{
SetDlgControlState(ENABLED);
GetDlgItem(IDC_EDIT_FSTOP)->SetFocus();
DisplayStatus("Stop frequency has to be below 100000 Hz!",STATUS_WARNING);
return(FALSE);
}
if(m_FStart==m_FStop)
{
SetDlgControlState(ENABLED);
GetDlgItem(IDC_EDIT_FSTART)->SetFocus();
DisplayStatus("Please select different values for start and stop frequency!",STATUS_WARNING);
return(FALSE);
}
if(m_FStop < m_FStart)
{
Dummy = m_FStart;
m_FStart = m_FStop;
m_FStop = Dummy;
UpdateData(DATA_TO_DIALOG);
}
return(TRUE);
}
void CFlickerNoiseMeasurementDlg::OnButtonEditSetup()
{
FILE *Handle;
Handle = fopen("FNM_SystemSetup.txt", "rb" );
if(Handle == NULL)
{ //no file existe! Create file with standard init commands
Handle = fopen("FNM_SystemSetup.txt", "w" );
if(Handle == NULL)return;
CreateSystemSetupStandardFile(Handle);
fclose(Handle);
}
system("Notepad FNM_SystemSetup.txt"); //NOCH: esgibt noch einen besseren Befehl!
}
void CFlickerNoiseMeasurementDlg::OnButtonEditInit()
{
FILE *Handle;
Handle = fopen("FNM_InstrumentInit.txt", "rb" );
if(Handle == NULL)
{ //no file existe! Create file with standard init commands
Handle = fopen("FNM_InstrumentInit.txt", "w" );
if(Handle == NULL)return;
CreateInitInstrumentStandardFile(Handle);
fclose(Handle);
}
system("Notepad FNM_InstrumentInit.txt"); //NOCH: esgibt noch einen besseren Befehl!
//tobi = WinExec("C:\windows\Notepad.exe",SW_SHOW);
}
void CFlickerNoiseMeasurementDlg::OnButtonEditAvg()
{
FILE *Handle;
Handle = fopen("FNM_AveragingRanges.txt", "rb" );
if(Handle == NULL)
{ //no file existe! Create file with standard init commands
Handle = fopen("FNM_AveragingRanges.txt", "w" );
if(Handle == NULL)return;
CreateAveragingRangesStandardFile(Handle);
fclose(Handle);
}
system("Notepad FNM_AveragingRanges.txt"); //NOCH: esgibt noch einen besseren Befehl!
}
void CFlickerNoiseMeasurementDlg::OnRadioAvgAuto()
{
m_Radio_AveragingMode=0; //Auto mode for averaging
m_Button_EditAvg.EnableWindow(FALSE);
}
void CFlickerNoiseMeasurementDlg::OnRadioAvgFile()
{
m_Radio_AveragingMode=1; //ranges from file for averaging
m_Button_EditAvg.EnableWindow(TRUE);
}
bool CFlickerNoiseMeasurementDlg::CalculateAveragingRanges()
{
double FSpan_log, FStart_log, FStop_log, FStep_log, FStart, FStop;
int CurrentFrequencyINDEX;
FStart_log = log10(m_FStart);
FStop_log = log10(m_FStop);
FSpan_log = FStop_log - FStart_log;
m_NumberOfAveragingRanges = (int)ceil(FSpan_log);
m_AveragingRanges = (CAveragingRangeType*)calloc((unsigned)m_NumberOfAveragingRanges, sizeof(CAveragingRangeType));
if(m_NumberOfAveragingRanges == 0) m_NumberOfAveragingRanges =1;
FStep_log = FSpan_log/m_NumberOfAveragingRanges;
FStart = m_FStart;
for(CurrentFrequencyINDEX = 0; CurrentFrequencyINDEX < m_NumberOfAveragingRanges-1; CurrentFrequencyINDEX++)
PAGE 101 / 141
TOBIAS WERNER
CORRELATION BETWEEN THE FLICKER AND THE MICROWAVE NOISE OF GAN HFETS
{
FStop = pow(10, FStart_log + (CurrentFrequencyINDEX+1) * FStep_log);
m_AveragingRanges[CurrentFrequencyINDEX].Frequency = FStop;
m_AveragingRanges[CurrentFrequencyINDEX].Averaging = CalculateAveraging(FStart, FStop, (CurrentFrequencyINDEX+1)*FStep_log);
FStart = FStop;
}
m_AveragingRanges[CurrentFrequencyINDEX].Frequency = m_FStop;
m_AveragingRanges[CurrentFrequencyINDEX].Averaging = CalculateAveraging(FStart, m_FStop, (CurrentFrequencyINDEX+1)*FStep_log);
return(TRUE);
}
void CFlickerNoiseMeasurementDlg::SetStandardVariableValues()
{
m_Vg = -1; //V
m_Vd = 3; //V
m_Vr = 4; //V
m_P1 = 10; //kOhm
m_R = 10; //kOhm
m_P2 = 10; //kOhm
m_FStart = 100; //Hz
m_FStop = 3000; //Hz
m_PrimaryInstrumentAddress = 10; //Standard GPIB address: 10
m_TimeOut = 13; //Standard: 10s
m_CheckAverage = FALSE; //
m_Radio_AveragingMode = 1; //take from file!
m_CheckLogAverage = 1;
m_ComboRefStartValue = 4;
}
void CFlickerNoiseMeasurementDlg::OnSelchangeComboLogSample()
{
m_ComboRefStartValue = m_ComboLogSample.GetCurSel();
}
void CFlickerNoiseMeasurementDlg::OnSelchangeComboGpibTimeOut()
{
CString SelectedText;
m_TimeOut = m_Combo_GPIB_Timeout.GetCurSel();
if(InstrumentInitialized)
{
ibtmo (m_InstrumentHandle, m_TimeOut);
if(!(ibsta & ERR))
{
m_Combo_GPIB_Timeout.GetLBText( m_TimeOut, SelectedText);
sprintf(buffer, "Time out successfully changed to:%s.", SelectedText );
DisplayStatus(buffer, STATUS_SR770_OK);
}
else
{
DisplayStatus("ERROR changing time out!", STATUS_ERROR);
}
}
}
bool CFlickerNoiseMeasurementDlg::ValidCommand(char* Command)
{
char *Search, *Search2;
}
Search = Command;
while(*Search <= 32 && *Search != 0) Search++; //skip leading spaces
Search2 = Search;
if(*Search == 0) return(FALSE); //Quit, Line is empty!
while(*Search2 != 0 && *Search2 != 37) Search2++; //Go to the end of the string
while((*Search2 <= 32 || *Search2 == 37) && Search2 >= Search) Search2--;
if(Search == Search2) return(FALSE); //
Search2++;
*Search2 = 0;
if(strlen(Search)<=2) return(FALSE); //GPIB commands are longer then 2 letters
Command = Search;
return(TRUE);
int CFlickerNoiseMeasurementDlg::CalculateAveraging(double Start, double Stop, double Factor)
{
int Averaging;
int NumberOfSeconds = 200; //max time to wait for 400 samples
Averaging = (int)ceil((NumberOfSeconds/Factor*(Stop - Start)/400));
return(Averaging);
}
void CFlickerNoiseMeasurementDlg::OnKillfocusEdit()
{
UpdateData(DIALOG_TO_DATA); //keep database consistent
DisplayStatus("");
}
bool CFlickerNoiseMeasurementDlg::CreateAveragingRangesStandardFile(FILE* Handle)
{
fprintf(Handle,"This File is used to set the averaging for different frequency ranges.\n");
fprintf(Handle,"You can erase or add ranges manually, but always sort in increasing\n");
fprintf(Handle,"order of frequencies and use the following format:\n");
fprintf(Handle,"FREQUENCY, AVERAGING\n");
fprintf(Handle,"/////////////////////////////////////////////////////////\n");
fprintf(Handle,"/
/\n");
fprintf(Handle,"/ 0 Hz < FREQUENCY <= 100000 Hz
/\n");
fprintf(Handle,"/ 2 <= AVERAGING <= 32000
/\n");
fprintf(Handle,"/ The entry indicates, what AVERAGING should be used
/\n");
fprintf(Handle,"/ below the specified FREQUENCY.
/\n");
fprintf(Handle,"/
/\n");
fprintf(Handle,"/ ©2000 Tobias Werner
/\n");
fprintf(Handle,"/ University of Stuttgart
/\n");
fprintf(Handle,"/ GERMANY
/\n");
fprintf(Handle,"/
/\n");
fprintf(Handle,"/////////////////////////////////////////////////////////\n");
fprintf(Handle,"================= Frequency list ========================\n");
fprintf(Handle,"100, 50\n");
fprintf(Handle,"3000, 200\n");
fprintf(Handle,"100000, 500");
return(TRUE);
}
PAGE 102 / 141
TOBIAS WERNER
CORRELATION BETWEEN THE FLICKER AND THE MICROWAVE NOISE OF GAN HFETS
bool CFlickerNoiseMeasurementDlg::CreateSystemSetupStandardFile(FILE* Handle)
{
fprintf(Handle,"SPAN14\t%%span 3.125kHz\n");
fprintf(Handle,"STRF100\t%%start frequency 100Hz\n");
fprintf(Handle,"OVLP0\t%%overlapping 0 pecent\n");
fprintf(Handle,"NAVG200\t%%number of averages 200\n");
fprintf(Handle,"AVGO1\t%%averaging on\n");
fprintf(Handle,"ARNG1\t%%autoranging on\n");
fprintf(Handle,"ARNG0\t%%autoranging off\n");
fprintf(Handle,"AOFF\t%%perform offset calibration\n");
fprintf(Handle,"AUTS0\t%%auto scale");
//Last command no carriage return
return(TRUE);
}
bool CFlickerNoiseMeasurementDlg::CreateInitInstrumentStandardFile(FILE* Handle)
{
fprintf(Handle,"*RST\t%%reset the instrument\n");
fprintf(Handle,"STOP\t%%stop measurement\n");
fprintf(Handle,"FMTS1\t%%display dual\n");
fprintf(Handle,"DISP0,0\t%%display log/mag\n");
fprintf(Handle,"XAXS0,1\t%%x-axis log\n");
fprintf(Handle,"MEAS0,1\t%%measurement PSD\n");
fprintf(Handle,"UNIT0,3\t%%dBVrms\n");
fprintf(Handle,"WNDO0,2\t%%window function Hanning\n");
fprintf(Handle,"MRKW0,2\t%%marker spot");
//last Command no carriage return!
return(TRUE);
}
//NOCH Diese Funktion wieder loeschen
UINT TestThread(LPVOID pParam)
{
char Message[100];
int Nummer=0;
CFlickerNoiseMeasurementDlg* pApp = (CFlickerNoiseMeasurementDlg*)pParam;
while (!ThreadExitFlag)
{
Nummer++;
sprintf(Message, "Die Nummer ist: %d", Nummer);
::PostMessage(pApp->m_hWnd, WM_DISPLAY_STATUS, (WPARAM)Message, (LPARAM)STATUS_MEASURE);
pApp->pause(1000);
if(Nummer == 3) break;
}
::PostMessage(pApp->m_hWnd, WM_MEASUREMENT_STOPED, 0, 0);
return 0;
}
void CFlickerNoiseMeasurementDlg::OnMeasure()
{
CString ButtonCaption;
UpdateData(DIALOG_TO_DATA);
m_Button_MeasureStop.GetWindowText(ButtonCaption);
if(ButtonCaption == "&Measure")
{
SetDlgControlState(DISABLED);
if(!CheckVariableRanges()) return;
if(m_Radio_AveragingMode)
{if(!GetAveragingRangesFromFile())return;} //Get the frequency ranges from file
else
{if(!CalculateAveragingRanges())return;}
//Get the frequency ranges from file
SaveLastVariableSettingsToFile(); //Save last used settings to a parameter file
//CalculateCurrentID(); //NOCH: Wieder irgendwo im Dialog die Variable Id einfuegen!
if(!FindGBIPCard()) return;
if(!InstrumentActive(m_IdentificationString)) return;
if(!InitInstrument()) return;
ThreadExitFlag = FALSE;
GetDlgItem(IDB_Measure)->EnableWindow(ENABLED);
m_hWnd = GetSafeHwnd(); //Save window handle in member variable
CountDownSeconds(CalculateMeasurementTime());
AfxBeginThread(MeasureThread,(LPVOID)this,THREAD_PRIORITY_NORMAL);
}
else //Button caption Stop
{
DisplayStatus("Terminating the measurement process. Please wait...", STATUS_STOPPED);
GetDlgItem(IDB_Measure)->EnableWindow(DISABLED);
CountDownSeconds(0);
SendDataSR770("STCO", this); //Stop measurement
ThreadExitFlag = TRUE; //Exit measurement //NOCH: Reihenfolge veraendert nochmal ueberdenken!
}
}
UINT MeasureThread(LPVOID pParam)
{
CFlickerNoiseMeasurementDlg* pApp = (CFlickerNoiseMeasurementDlg*)pParam;
double Start, Stop;
bool ExitFlag = FALSE;
int CurrentLimitINDEX;
char Message[200];
pApp->m_NumberOfPassedFrequencyRanges = 0;
pApp->m_MeasurementDataX = (double*)calloc((unsigned)pApp->m_NumberOfAveragingRanges*400, sizeof(double));
pApp->m_MeasurementDataY = (double*)calloc((unsigned)pApp->m_NumberOfAveragingRanges*400, sizeof(double));
Start = pApp->m_FStart;
Stop = pApp->m_FStop;
pApp->m_DataPointerX = 0;
pApp->m_DataPointerY = 0;
pApp->m_FirstAverage = TRUE;
sprintf(Message, "Performing auto offset calibration...");
::PostMessage(pApp->m_hWnd, WM_DISPLAY_STATUS, (WPARAM)Message, (LPARAM)STATUS_SR770);
//::PostMessage(pApp->m_hWnd, WM_START_COUNTDOWN, (WPARAM)16, 0);
if(!pApp->SendDataSR770("ALRM0", pApp))return(0); //disable sound
if(!pApp->SendDataSR770("AOFF", pApp))return(0); //performe auto offset calibration
if(!pApp->SendDataSR770("AOFM0", pApp))return(0); //disable auto offset
PAGE 103 / 141
TOBIAS WERNER
CORRELATION BETWEEN THE FLICKER AND THE MICROWAVE NOISE OF GAN HFETS
PAGE 104 / 141
for(CurrentLimitINDEX = 0; CurrentLimitINDEX < pApp->m_NumberOfAveragingRanges && ExitFlag == FALSE; CurrentLimitINDEX++)
{
switch(pApp->ControlFrequencyRange(Start, Stop, pApp->m_AveragingRanges[CurrentLimitINDEX].Frequency))
{
case 0: //start and stop are below the frequency limit
if(!pApp->DoMeasurement(Start,Stop,pApp->m_AveragingRanges[CurrentLimitINDEX].Averaging, pApp))
{
sprintf(Message, "Measurement failed!");
::PostMessage(pApp->m_hWnd, WM_DISPLAY_STATUS, (WPARAM)Message, (LPARAM)STATUS_ERROR);
::PostMessage(pApp->m_hWnd, WM_MEASUREMENT_STOPED, 0, 0);
return(0);
}
ExitFlag = TRUE; //Exit the while loop
pApp->m_NumberOfPassedFrequencyRanges++;
break;
case 1: //only start is below the frequency limit
if(!pApp->DoMeasurement(Start,pApp->m_AveragingRanges[CurrentLimitINDEX].Frequency,pApp>m_AveragingRanges[CurrentLimitINDEX].Averaging,pApp))
{
sprintf(Message, "Measurement failed!");
::PostMessage(pApp->m_hWnd, WM_DISPLAY_STATUS, (WPARAM)Message, (LPARAM)STATUS_ERROR);
::PostMessage(pApp->m_hWnd, WM_MEASUREMENT_STOPED, 0, 0);
return(0);
}
Start = pApp->m_AveragingRanges[CurrentLimitINDEX].Frequency;
pApp->m_NumberOfPassedFrequencyRanges++;
break;
default: //start and stop are above the frequency limit
break; //do nothing
};
}
::PostMessage(pApp->m_hWnd, WM_SAVE_DATA, 0, 0); //Call save data
return(0);//Thread finished successfully
}
bool CFlickerNoiseMeasurementDlg::DoMeasurement(double StartFrequency, double StopFrequency, int Averaging, CFlickerNoiseMeasurementDlg* pApp)
{
int FrequencySpanIndex, TimeForSettling; // , TimeForMeasurement;
double FrequencySpan;
FrequencySpanIndex = pApp->GetFrequencySpan(StartFrequency, StopFrequency);
sprintf(buffer, "SPAN%d", FrequencySpanIndex); //0..100,000Hz
if(!pApp->SendDataSR770(buffer, pApp))return(FALSE);
sprintf(buffer, "STRF%f.2", StartFrequency); //0..100,000Hz
if(!pApp->SendDataSR770(buffer, pApp))return(FALSE);
FrequencySpan = 100000/(pow(2,19-FrequencySpanIndex));
TimeForSettling = (int)(400/FrequencySpan);
if(TimeForSettling!=0)
{
::PostMessage(pApp->m_hWnd, WM_DISPLAY_STATUS, (WPARAM)"Frequency range set. Waiting for FFT settling to finish...", (LPARAM)STATUS_MEASURE);
// ::PostMessage(pApp->m_hWnd, WM_START_COUNTDOWN, (WPARAM)TimeForSettling, 0);
PollForSettlingCompletion(pApp, FrequencySpanIndex);
}
//Calculating the measurement time
//TimeForMeasurement = (int)(400/FrequencySpan*Averaging);
//::PostMessage(pApp->m_hWnd, WM_START_COUNTDOWN, (WPARAM)TimeForMeasurement, 0);
sprintf(buffer, "Measuring from %.0f Hz to %.0f Hz (Average %d) ...",StartFrequency, StopFrequency, Averaging);
::PostMessage(pApp->m_hWnd, WM_DISPLAY_STATUS, (WPARAM)buffer, (LPARAM)STATUS_MEASURE);
if(!pApp->SendDataSR770("AVGO0", pApp))return(FALSE); //Averaging OFF
if(!pApp->SendDataSR770("STRT", pApp))return(FALSE); //Start measurement
if(m_FirstAverage==TRUE)
{
if(!SendDataSR770("ARNG1", pApp))return(FALSE); //Auto ranging on
pause(5000);
if(!SendDataSR770("ARNG0", pApp))return(FALSE); //Auto ranging off
if(pApp->m_CheckAverage==TRUE)
{
pApp->m_FirstAverage=FALSE;
}
}
if(!pApp->SendDataSR770("STOP", pApp))return(FALSE); //Stop measurement
if(!pApp->SendDataSR770("AVGO1", pApp))return(FALSE); //Averaging ON
sprintf(buffer, "NAVG %d", Averaging); //Set averaging factor
if(!pApp->SendDataSR770(buffer, pApp))return(FALSE);
if(!pApp->SendDataSR770("OVLP0", pApp))return(FALSE); //Overlapping = 0
if(!pApp->SendDataSR770("AUTS0", pApp))return(FALSE); //Auto scale
if(!pApp->SendDataSR770("STRT", pApp))return(FALSE); //Start measurement
if(!pApp->SendDataSR770("AUTS0", pApp))return(FALSE); //Auto scale
if(!pApp->PollForMeasurementCompletion(pApp))return(FALSE);
if(!pApp->SendDataSR770("AUTS0", pApp))return(FALSE); //Auto scale
//::PostMessage(pApp->m_hWnd, WM_START_COUNTDOWN, (WPARAM)10, 0);
if(!pApp->GetMeasurementData(pApp))return(FALSE);
return(TRUE);
}
LONG CFlickerNoiseMeasurementDlg::OnDisplayStatus(WPARAM Message, LPARAM Status)
{
DisplayStatus((char*)Message, (UINT)Status);
return(0);
}
LONG CFlickerNoiseMeasurementDlg::OnSaveData(WPARAM wParam, LPARAM lParam)
{
if(SaveMeasurementDataToFile())
{
SetDlgControlState(ENABLED);
CountDownSeconds(0);
DisplayStatus("Measurement finished successfully!", STATUS_SUCCESS);
SendDataSR770("ALRM1", this);
SendDataSR770("MSGS(C)TOBIAS_WERNER_2000", this);
}
else
{
SetDlgControlState(ENABLED);
TOBIAS WERNER
CORRELATION BETWEEN THE FLICKER AND THE MICROWAVE NOISE OF GAN HFETS
DisplayStatus("Measurement was canceled!", STATUS_STOPPED);
}
DisableBoard();
return(0);
}
LONG CFlickerNoiseMeasurementDlg::OnMeasurementStoped(WPARAM wParam, LPARAM lParam)
{
SetDlgControlState(ENABLED);
DisplayStatus("Measurement stopped!", STATUS_STOPPED);
DisableBoard();
return(0);
}
void CFlickerNoiseMeasurementDlg::OnDestroy()
{
CDialog::OnDestroy();
SendDataSR770("AOFM1", this); //enable auto offset
SendDataSR770("ALRM1", this); //enable sound
KillTimer(ID_TIMER1);
ThreadExitFlag = TRUE; //Exit measurement
}
void CFlickerNoiseMeasurementDlg::SetDlgControlState(bool DisableFlag)
{
GetDlgItem(IDC_EDIT_VG)->EnableWindow(DisableFlag);
GetDlgItem(IDC_EDIT_VD)->EnableWindow(DisableFlag);
GetDlgItem(IDC_EDIT_VR)->EnableWindow(DisableFlag);
GetDlgItem(IDC_EDIT_P1)->EnableWindow(DisableFlag);
GetDlgItem(IDC_EDIT_R)->EnableWindow(DisableFlag);
GetDlgItem(IDC_EDIT_P2)->EnableWindow(DisableFlag);
GetDlgItem(IDC_EDIT_FSTART)->EnableWindow(DisableFlag);
GetDlgItem(IDC_EDIT_FSTOP)->EnableWindow(DisableFlag);
GetDlgItem(IDC_RADIO_AVG_AUTO)->EnableWindow(DisableFlag);
GetDlgItem(IDC_RADIO_AVG_FILE)->EnableWindow(DisableFlag);
if(m_Radio_AveragingMode)
{
GetDlgItem(IDC_BUTTON_EDIT_AVG)->EnableWindow(DisableFlag);
}
GetDlgItem(IDC_CHECK_LOG_AVG)->EnableWindow(DisableFlag);
GetDlgItem(IDC_COMBO_LOG_SAMPLE)->EnableWindow(DisableFlag);
GetDlgItem(IDC_BUTTON_EDIT_INIT)->EnableWindow(DisableFlag);
GetDlgItem(IDC_BUTTON_EDIT_SETUP)->EnableWindow(DisableFlag);
GetDlgItem(IDC_CHECK_AVG)->EnableWindow(DisableFlag);
GetDlgItem(IDC_COMBO_GPIB_ADDR)->EnableWindow(DisableFlag);
GetDlgItem(IDC_COMBO_GPIB_TOUT)->EnableWindow(DisableFlag);
GetDlgItem(IDC_SETUP_SYSTEM)->EnableWindow(DisableFlag);
GetDlgItem(IDC_Find)->EnableWindow(DisableFlag);
if(DisableFlag)
{
m_Button_MeasureStop.SetWindowText("&Measure");
GetDlgItem(IDB_Measure)->EnableWindow(DisableFlag);
}
else
{
m_Button_MeasureStop.SetWindowText("&Stop");
GetDlgItem(IDB_Measure)->EnableWindow(DisableFlag);
}
}
void CFlickerNoiseMeasurementDlg::OnTimer(UINT nIDEvent)
{
char sSeconds[2], sMinutes[2];
CTime curTime = CTime::GetCurrentTime();
int Minutes, Seconds;
m_SecondsCounter--;
Seconds = m_SecondsCounter;
if(m_SecondsCounter == 0)
{
KillTimer(ID_TIMER1);
m_TimeToGo = "";
}
else
{
ConvertToMinutesAndSeconds(&Seconds, &Minutes);
sprintf(sSeconds, "%d", Seconds);
CorrectTimeFormat(sSeconds);
sprintf(sMinutes, "%d", Minutes);
CorrectTimeFormat(sMinutes);
m_TimeToGo.Format("%s:%s",sMinutes, sSeconds);
}
UpdateData(FALSE);
CDialog::OnTimer(nIDEvent);
}
void CFlickerNoiseMeasurementDlg::CountDownSeconds(int Seconds)
{
int Minutes=0;
char sSeconds[2], sMinutes[2];
if(Seconds!=0)
{
KillTimer(ID_TIMER1);
m_SecondsCounter = Seconds;
ConvertToMinutesAndSeconds(&Seconds, &Minutes);
sprintf(sSeconds, "%d", Seconds);
CorrectTimeFormat(sSeconds);
sprintf(sMinutes, "%d", Minutes);
CorrectTimeFormat(sMinutes);
m_TimeToGo.Format("%s:%s",sMinutes, sSeconds);
SetTimer(ID_TIMER1, 1000, NULL);
}
else
{
m_TimeToGo = "";
KillTimer(ID_TIMER1);
}
UpdateData(FALSE);
}
PAGE 105 / 141
TOBIAS WERNER
CORRELATION BETWEEN THE FLICKER AND THE MICROWAVE NOISE OF GAN HFETS
void CFlickerNoiseMeasurementDlg::ConvertToMinutesAndSeconds(int *Seconds, int *Minutes)
{
*Minutes=(int)ceil(*Seconds/60);
*Seconds = *Seconds - (*Minutes*60);
}
void CFlickerNoiseMeasurementDlg::CorrectTimeFormat(char *Element)
{
char DummyString[2];
if(strlen(Element)==1)
sprintf(DummyString, "0%s",Element);
else
sprintf(DummyString, "%s",Element);
strcpy(Element,DummyString);
}
LONG CFlickerNoiseMeasurementDlg::OnStartCountdown(WPARAM Seconds, LPARAM lParam)
{
CountDownSeconds((int)Seconds);
return(0);
}
int CFlickerNoiseMeasurementDlg::CalculateMeasurementTime()
{
int EntireTime, OffsetTime, SettlingTime, MeasurementTime, TransferTime, OverheadTime, AveragingRangeINDEX;
double Start,Stop,FrequencySpan;
OffsetTime = 16; //s
TransferTime = 10; //s
OverheadTime = 7; //s
EntireTime = OverheadTime + OffsetTime;
Start = m_FStart;
Stop = m_FStop;
for(AveragingRangeINDEX=0; AveragingRangeINDEX<m_NumberOfAveragingRanges;AveragingRangeINDEX++)
{
switch(ControlFrequencyRange(Start, Stop, m_AveragingRanges[AveragingRangeINDEX].Frequency))
{
case 0: //start and stop are below the frequency limit
FrequencySpan = 100000/(pow(2,19-GetFrequencySpan(Start, Stop)));
SettlingTime = (int)(400/FrequencySpan);
MeasurementTime = (int)(400/FrequencySpan*m_AveragingRanges[AveragingRangeINDEX].Averaging);
EntireTime += SettlingTime + MeasurementTime + TransferTime + OverheadTime;
return(EntireTime);
case 1: //only start is below the frequency limit
FrequencySpan = 100000/(pow(2,19-GetFrequencySpan(Start, m_AveragingRanges[AveragingRangeINDEX].Frequency)));
Start = m_AveragingRanges[AveragingRangeINDEX].Frequency;
SettlingTime = (int)(400/FrequencySpan);
MeasurementTime = (int)(400/FrequencySpan*m_AveragingRanges[AveragingRangeINDEX].Averaging);
EntireTime += SettlingTime + MeasurementTime + TransferTime + OverheadTime;
break;
default: //start and stop are above the frequency limit
break; //do nothing
};
}
return(EntireTime);
}
PAGE 106 / 141
TOBIAS WERNER
CORRELATION BETWEEN THE FLICKER AND THE MICROWAVE NOISE OF GAN HFETS
PAGE 107 / 141
Appendix F: FIXTURE CHARACTERIZATION
In a microwave noise measurement setup, all elements of the system have to be characterized
concerning their high frequency properties in order to get accurate results. Vector network
analyzers (VNA) are used for this purpose and measure the S-parameters, which describe
these properties.
To get accurate measurement results for the S-parameters, the VNA has to be calibrated. A
measurement calibration is a process, which mathematically derives the error model for the
VNA. This error model is an array of vector coefficients used to establish a fixed reference
plane of zero phase shift, zero magnitude and known impedance. The array coefficients are
computed by measuring a set of "known" devices, connected at a fixed point and solving the
vector difference between the modeled and the measured response. These known devices are
called calibration standards and they have a precisely known magnitude and phase response
as a function of frequency.
In general a microwave measurement setup consists of devices with the same connector
family and insertable connections, i.e. a female contact on one side and a male contact on the
other side. In this case it is very easy to measure the S-parameters of this device, because it is
the configuration intended for a VNA measurement process. Fig. F.1 shows an example of
an insertable system component.
Fig. F.1: Example of an insertable system component with APC3.5 female connectors at the input
and APC3.5 male connectors at the output.
If the S-parameters of a non-insertable system component has to be measured the adapter
removal technique [35] can be used. Fig. F.2 shows an example of a non-insertable system
component.
TOBIAS WERNER
CORRELATION BETWEEN THE FLICKER AND THE MICROWAVE NOISE OF GAN HFETS
PAGE 108 / 141
Fig. F.2: Example of a non-insertable system component with
APC3.5 female connectors at the input and output.
If even the connector family is different for a device, there is still a way to measure the
S-parameters as described in [35].
Fig. F.3: Example of a device with an APC3.5 male connector on one side
and a connector-less end on the other side.
In our case we had the problem to characterize the high frequency properties of a fixture,
consisting of a low loss cable and a microwave probe tip, shown in Fig. F.3.
The following chapter describes, how this problem was solved by performing two one port
calibrations and applying the two sets of corresponding error terms of the HP8510C to
calculate the S-parameters of the fixture.
TOBIAS WERNER
CORRELATION BETWEEN THE FLICKER AND THE MICROWAVE NOISE OF GAN HFETS
PAGE 109 / 141
F.1 Systematic approach
If a one-port calibration is performed, the error coefficients E R , representing the frequency
response, E D , the directivity and E S , the source match, are calculated from solving an
equation for an open, short and load calibration standard, connected to the reference plane of
the VNA [38]. These error coefficients represent the S-parameters of the network between
the VNA and the reference plane at which the calibration was carried out. The network is
considered passive and reciprocal. Fig. F.4 shows an illustration of the so-called error
adapter calculated from the error coefficients.
Fig. F.4: The error model for a one-port calibration with the HP8510C.
The error adapter can be described by the S-parameter matrix
ED
AS =
ER
1
.
E S
(F.1)
Two calibrations have to be performed to calculate the S-parameters of the fixture. One
calibration at the coaxial reference plane with a 3.5 mm calibration kit, the other with the
fixture connected at the previous reference plane with an on-waver calibration substrate, like
demonstrated on the left and right side of Fig. F.5.
TOBIAS WERNER
CORRELATION BETWEEN THE FLICKER AND THE MICROWAVE NOISE OF GAN HFETS
PAGE 110 / 141
Fig. F.5: The error terms of two one-port calibrations can be used to
calculate the S-parameters of the fixture.
For the first calibration we get a set of coefficients expressed by the matrix
E
A S = D1
E R1
1
.
E S1
(F.2)
The second set of error coefficients is expressed by the matrix
E
CS = D2
ER2
1
E S 2
(F.3)
and consists of the same matrix A S as in (F.2) in chain with a matrix B S expressing the
S-parameters of the fixture.
To calculate the matrix B S we transform the two S-parameter matrices A S and C S into
chain matrices AT and CT by the conversion
X T 11 = X S12 −
X T 12 =
X S11
X S 21
X T 21 = −
X T 22 =
and get
X S 22
X S 21
1
X S 21
X S11 ⋅ X S 22
X S 21
(F.4)
TOBIAS WERNER
CORRELATION BETWEEN THE FLICKER AND THE MICROWAVE NOISE OF GAN HFETS
E R1-E D1 ⋅ E S1
E R1
AT =
E
- S1
E R1
E D1
E R1
,
1
E R1
PAGE 111 / 141
(F.5)
and
E R 2 -E D 2 ⋅ E S 2
ER2
CT =
E
- S2
ER2
E D2
ER2
.
1
E R 2
(F.6)
For the chain matrix can be written
CT = AT ⋅ BT ,
(F.7)
BT = AT −1 ⋅ CT .
(F.8)
or
With (F.5) and (F.6) in (F.8) we get
E R 2 -E D 2 ⋅ E S 2 + E D1 ⋅ E S 2
E R2
BT =
E S1 ⋅ E R 2 -E S1 ⋅ E D 2 ⋅ E S 2 -E S 2 ⋅ E R1 + E S 2 ⋅ E D1 ⋅ E S1
E R2
E D 2 -E D1
.
E R2
E S1 ⋅ E D 2+E R1-E D1 ⋅ E S1
E R2
(F.9)
After converting (F.9) back to S-parameters by the formula
X S11 =
X T 12
X T 22
X S12 = X T 11 −
X S 21 =
X T 21 ⋅ X T 22
X T 22
1
X T 22
X S 22 = −
X T 21
X T 22
and taking into account that S12 equals S21 for the fixture, we get
(F.10)
TOBIAS WERNER
CORRELATION BETWEEN THE FLICKER AND THE MICROWAVE NOISE OF GAN HFETS
ED 2-ED1
E ⋅ E +E -E ⋅ E
S1
D2
R1 D1
S1
BS =
ER1 ⋅ ER 2
±
(ES1 ⋅ ED 2+ER1-ED1 ⋅ ES1 )2
ER1 ⋅ ER 2
(ES1 ⋅ ED 2+ER1-ED1 ⋅ ES1 )2
-ES1 ⋅ ER 2+ES1 ⋅ ED 2 ⋅ ES 2+ES 2 ⋅ ER1-ES 2 ⋅ ED1 ⋅ ES1
ES1 ⋅ ED 2+ER1-ED1 ⋅ ES1
PAGE 112 / 141
±
(F.11)
Equation (F.11) represents the S-parameters of the unknown fixture by the error coefficients
of two one-port calibrations. As can be seen from this equation, there are two possible
solutions for S12 and S21, equal in magnitude but 180 degrees apart in phase.
To get the correct physical result, further investigations has to be made and will be discussed
in the next chapter.
F.2 Phase ambiguity
For an ideal loss less transmission line the S-parameters are given by
0
D S = − j⋅β ⋅l
e
e − j⋅β ⋅l
,
0
(F.12)
with l , the electrical length of the line and β , the phase constant.
From (F.12) follows for the phase ϕ of S12 and S21
ϕ = −β ⋅ l ,
with β =
2 ⋅π
λ
ϕ(f) = −
and the wavelength λ =
2 ⋅π ⋅ l
⋅f .
c
(F.13)
c
in (F.13) the phase will be
f
(F.14)
From (F.14) can be seen that the phase has a linear frequency dependence. The slope m of
the line is
m=−
2 ⋅π ⋅ l
.
c
(F.15)
Fig. F.6 shows the course of S12 = S21, if only one solution of (F.11) is taken into account.
The phase varies between -90 and + 90 degreed and not -180 and +180 as expected.
TOBIAS WERNER
CORRELATION BETWEEN THE FLICKER AND THE MICROWAVE NOISE OF GAN HFETS
PAGE 113 / 141
Fig. F.6: Uncorrected phase of S12 and S21.The dots represent the discrete
measured values and the line is the linear interpolation between them.
The slope of a line segment can be calculated by taking two discrete points with frequency f
and corresponding phase ϕ :
m=
∆ ϕ ϕ 2 ( f 2 ) − ϕ1 ( f1 )
=
.
∆f
f 2 − f1
(F.16)
If we compare (F.15) and (F.16) and solve for the electrical length l , we get
l=−
c ϕ 2 ( f 2 ) − ϕ1 ( f1 )
⋅
.
2 ⋅π
f 2 − f1
(F.17)
This electrical length l can now be inserted in (F.13) to calculate the theoretical value of the
phase at each frequency of S12 and S21. Than the theoretical value can be compared to the
calculated value of the phase from measurement and can be corrected by 180 degrees if
necessary. Fig. F.7 shows the corrected phase information for S12 and S21.
TOBIAS WERNER
CORRELATION BETWEEN THE FLICKER AND THE MICROWAVE NOISE OF GAN HFETS
PAGE 114 / 141
Fig. F.7: Corrected phase of S12 and S21
The algorithm to calculate the electrical length will only work, if the frequency spacing is
close enough related to the electrical length of the fixture. Fig. F.8 shows a good (left) and
an unsuitable (right) selection for the frequency spacing.
Fig. F.8: The slope of the line segment can be easily calculated in the left example,
but will lead to a wrong result for the electrical length in the right example.
F.3 Matlab Program
The presented procedure to calculate the S-parameters of a fixture from the error coefficients
of two VNA one-port calibrations was implemented in Matlab. The program accepts two
standard calibration files of the HP8510C and calculates the S-parameters with corrected
phase information for S12 and S21. The S-parameters are then written to a file in a touchstone
compatible format and can be used to setup the microwave systems.
TOBIAS WERNER
CORRELATION BETWEEN THE FLICKER AND THE MICROWAVE NOISE OF GAN HFETS
PAGE 115 / 141
F.4 Verification of the results
To control that the program is working correctly, the S-parameters of a fixture were
calculated by applying the presented algorithm and the result was compared to that of a
commercial fixture characterization program (Maury Microwave, MT956 Fixture Software,
$3500). The conditions were not exactly the same, because the rigid low loss cable was
bended between the two measurements and therefore changed its electrical characteristics
slightly. Nevertheless the agreement between these two measurements is very good and
shows that the implemented algorithm is working excellent.
Fig. F.9: Comparison between the results for an S-parameter determination
of a commercial system (blue) and the presented Matlab program (red). On the left side is the
magnitude and on the right side the phase of the S-parameters.
TOBIAS WERNER
CORRELATION BETWEEN THE FLICKER AND THE MICROWAVE NOISE OF GAN HFETS
PAGE 116 / 141
F.5 Matlab source code
function y = CalculateFixture
%
Funktion:
Calculate Fixture
%
Author:
Tobias Werner, Universitaet Stuttgart
%
Date:
Februar 2000
%
DESCRIPTION:
%
============
%
Function opens two calibration sets of the HP8510C and calculates
%
the S-Parameters of the fixture.
clear all
clc
home
disp('
')
disp('
F I X T U R E
C A L C U L A T I O N')
disp('
=====================================')
disp(' ____________________________________________________')
disp('|
|')
disp('|
This program calculates the S-parameters of a
|')
disp('|
fixture from two HP8510 error correction terms. |')
disp('|
|')
disp('|
(c) Februar 2000
|')
disp('|
Tobias Werner
|')
disp('|
University of Stuttgart
|')
disp('|____________________________________________________|')
% ---------Ask for calibration file without fixture to open------text = sprintf('\nIn the current directory the following calibration files were found:\n');
disp(text);
eval('ls CS*');
%%%%%%%%%%%%%% SELECT AND OPEN CALFILE WITHOUT FIXTURE %%%%%%%%%%%%%%
file_name1 = input('\nPlease select the file, which contains the calibration information WITHOUT FIXTURE:\n[Type the name of the file]
','s');
% ---------open and control the selected file------CalFile1 = fopen(file_name1,'r');
if CalFile1 == -1
text = sprintf('File %s not found!', file_name1);
disp(text);
disp('E X I T P R O G R A M')
return;
end
NumberOfErrorTerms1 = CheckFor8510CalibFile(CalFile1);
if NumberOfErrorTerms1 == 0
fclose(CalFile1)
return;
end
%%%%%%%%%%%%%% SELECT AND OPEN CALFILE WITH FIXTURE %%%%%%%%%%%%%%
file_name2 = file_name1;
while strcmp(file_name1, file_name2)
file_name2 = input('\nPlease select the file, which contains the calibration information WITH FIXTURE:\n[Type the name of the file]
if strcmp(file_name1, file_name2)
text = sprintf('\nERROR! You have chosen the same file as before. Try again:');
disp(text);
end
end
','s');
% ---------open and control the selected file------CalFile2 = fopen(file_name2,'r');
if CalFile2 == -1
text = sprintf('File %s not found!', file_name2);
disp(text);
disp('E X I T P R O G R A M')
return;
end
NumberOfErrorTerms2 = CheckFor8510CalibFile(CalFile2);
if NumberOfErrorTerms2 == 0
fclose(CalFile2)
return;
end
% ---------enter electrical length, if known
Electrical_Length = str2num(input('\nPlease specify the ELECTRICAL LENGTH of the fixture, if known, or press ENTER to let the program calculate it
automatically.\n(NOTE! If the electrical length is calculated by the program, please make sure that the frequency spacing of the two calibration
sets has been chosen small enough! Otherwise, the program will calculate a incorrect value!)\n[Type in the electrical length in m or press ENTER
to continue:] ','s'));
%%%%%%%%%%%%%%%%%% Read the frequencies of both files and compare them %%%%%%%%%%%%%%%%%%
disp(' ')
disp('================ PROCCESSING DATA ================')
disp(' ')
text = sprintf('- Proccessing error correction file WITHOUT FIXTURE (%s):', file_name1);
disp(text)
FrequencyArray1 = ReadFrequencyList(CalFile1);
if FrequencyArray1 == 0
return
end
NumberOfFrequencies1 = size(FrequencyArray1,1);
text = sprintf('- Proccessing error correction file WITH FIXTURE (%s):', file_name2);
disp(text)
FrequencyArray2 = ReadFrequencyList(CalFile2);
if FrequencyArray2 == 0
return
end
NumberOfFrequencies2 = size(FrequencyArray2,1);
% Control, if frequency ranges are the same
if FrequencyArray1 ~= FrequencyArray2
TOBIAS WERNER
CORRELATION BETWEEN THE FLICKER AND THE MICROWAVE NOISE OF GAN HFETS
disp('You have to use the same frequency spacing for the two calibration files!')
disp('E X I T P R O G R A M')
return
end
%%%%%%%%%%%%%%%%%% Read the error terms from the two files %%%%%%%%%%%%%%%%%%
text = sprintf('- Proccessing error correction file WITHOUT FIXTURE (%s):', file_name1);
disp(text)
for CurrentErrorTerm_INDEX1 = 1:NumberOfErrorTerms1
Buffer = ReadErrorTerms(CalFile1, NumberOfFrequencies1);
if size(Buffer,1) ~= NumberOfFrequencies1
disp('ERROR! The number of frequencies differs from the number of error terms!')
disp('E X I T P R O G R A M')
return
else
ErrorTermArray1(:,CurrentErrorTerm_INDEX1) = Buffer;
end
end
text = sprintf('- Proccessing error correction file WITH FIXTURE (%s):', file_name2);
disp(text)
for CurrentErrorTerm_INDEX2 = 1:NumberOfErrorTerms2
Buffer = ReadErrorTerms(CalFile2, NumberOfFrequencies2);
if size(Buffer,1) ~= NumberOfFrequencies2
disp('ERROR! The number of frequencies differs from the number of error terms!')
disp('E X I T P R O G R A M')
return
else
ErrorTermArray2(:,CurrentErrorTerm_INDEX2) = Buffer;
end
end
%%%%%%%%%%%%%%%%%% Calculate the S-parameters for the fixture %%%%%%%%%%%%%%%%%%
Fixture_S_MA = CalculateFixtureSParameter(ErrorTermArray1,ErrorTermArray2, FrequencyArray1, Electrical_Length);
%%%%%%%%%%%%%%%%%% Store the S-parameters for the fixture %%%%%%%%%%%%%%%%%%
if StoreFixtureFile(Fixture_S_MA, file_name1, file_name2)
return %Error
end
text = sprintf('\nPROGRAMM FINISHED SUCCESSFULLY');
disp(text);
fclose(CalFile1);
fclose(CalFile2);
return
%END OF MAIN PROGRAM
% ========================FUNCTIONS===================================
%%%%%%%%%%%%%%%%%%%%%%%%%%%%%%%%%%%%%%%%%%%%%%%%%%%%%%%%%%%%%%%%%%%%%%%
% FUNCTION: CheckFor8510CalibFile(FileHandler)
%
% INPUT:
FileHeandler
%
% OUTPUT:
Number of error terms
%
% AUTOR:
Tobias Werner, Universitaet Stuttgart
%
% DATE:
February 29, 2000
%
%%%%%%%%%%%%%%%%%%%%%%%%%%%%%%%%%%%%%%%%%%%%%%%%%%%%%%%%%%%%%%%%%%%%%%%
function y = CheckFor8510CalibFile(CalFile)
% Look for the word DATA in CalFile
exit_counter = 1;
while isempty(findstr(fgetl(CalFile), 'DATA')) & exit_counter < 10
exit_counter = exit_counter + 1;
end
% Count the occurence of the word DATA in CalFile
DATA_counter = 1;
while ~isempty(findstr(fgetl(CalFile), 'DATA'))
DATA_counter = DATA_counter + 1;
end
switch DATA_counter
case 3
disp('1-PORT HP8510C CALIBRATION FILE: 3 ERROR TERMS FOUND.')
y = DATA_counter;
case 12
disp('ERROR! The algorithm for a 2-Port calibration file is not yet implemented!')
disp('E X I T P R O G R A M')
y = DATA_counter;
otherwise
disp('ERROR! The file is not a HP8510C calibration file!')
disp('E X I T P R O G R A M')
y = 0;
end
return
PAGE 117 / 141
TOBIAS WERNER
CORRELATION BETWEEN THE FLICKER AND THE MICROWAVE NOISE OF GAN HFETS
%%%%%%%%%%%%%%%%%%%%%%%%%%%%%%%%%%%%%%%%%%%%%%%%%%%%%%%%%%%%%%%%%%%%%%%
% FUNCTION: ReadFrequencyList(FileHandler)
%
% INPUT:
FileHeandler
%
% OUTPUT:
Vektor (Frequency list read from indicated file)
%
% AUTOR:
Tobias Werner, Universitaet Stuttgart
%
% DATE:
February 29, 2000
%
%%%%%%%%%%%%%%%%%%%%%%%%%%%%%%%%%%%%%%%%%%%%%%%%%%%%%%%%%%%%%%%%%%%%%%%
function y = ReadFrequencyList(CalFile)
exit_counter = 1;
current_String = fgetl(CalFile);
while isempty(findstr(current_String,'_LIST_'))
exit_counter = exit_counter + 1;
if exit_counter > 19
disp('ERROR in file format!')
disp('E X I T P R O G R A M')
y = 0;
return
end
current_String = fgetl(CalFile);
end
if strncmp(current_String, 'VAR_LIST_BEGIN', 14)
%%%%%%%%%%%% Read the frequencies for VAR_LIST %%%%%%%%%%%%%
text = sprintf(' Reading frequencies... \n');
disp(text);
FREQUENCY_counter = 0;
Current_Frequency = fgetl(CalFile);
while ~strncmp(Current_Frequency, 'VAR_LIST_END', 12)
FREQUENCY_counter = FREQUENCY_counter + 1;
Frequency_Array(FREQUENCY_counter,1) = str2num(Current_Frequency);
Current_Frequency = fgetl(CalFile);
if FREQUENCY_counter > 800
disp('ERROR! The number of frequencies in the file is bigger than the maximum number for the HP8510 (801)')
disp('E X I T P R O G R A M')
y = 0;
return
end
end
y = Frequency_Array;
elseif strncmp(current_String, 'SEG_LIST_BEGIN', 14)
%%%%%%%%%%%%% Read the frequencies for SEG_LIST %%%%%%%%%%%%%
text = sprintf(' Reading frequencies... \n');
disp(text);
Current_Frequency = fgetl(CalFile);
Right = Current_Frequency(4: size(Current_Frequency,2));
frequency_range = str2num(Right);
Frequency_Array = (frequency_range(1): (frequency_range(2) - frequency_range(1))/(frequency_range(3)-1): frequency_range(2));
y = Frequency_Array';
return
else
y = 0;
return
end
return
%%%%%%%%%%%%%%%%%%%%%%%%%%%%%%%%%%%%%%%%%%%%%%%%%%%%%%%%%%%%%%%%%%%%%%%
% FUNCTION: ReadErrorTerms(FileHandler, NumberOfFrequencies)
%
% INPUT:
FileHeandler
%
% OUTPUT:
Vektor (Frequency list read from indicated file)
%
% AUTOR:
Tobias Werner, Universitaet Stuttgart
%
% DATE:
February 29, 2000
%
%%%%%%%%%%%%%%%%%%%%%%%%%%%%%%%%%%%%%%%%%%%%%%%%%%%%%%%%%%%%%%%%%%%%%%%
function y = ReadErrorTerms(CalFile, NumberOfFrequencies)
exit_counter = 1;
while isempty(findstr(fgetl(CalFile), 'BEGIN'))
exit_counter = exit_counter + 1;
if exit_counter > 20
disp('ERROR in file format!')
disp('E X I T P R O G R A M')
return
end
end
% Read the error terms for every frequency
text = sprintf(' Reading error terms for %d frequencies... \n', NumberOfFrequencies);
disp(text);
ErrorTerm_counter = 0;
Current_ErrorTerm = fgetl(CalFile);
while isempty(findstr(Current_ErrorTerm, 'END'))
ErrorTerm_counter = ErrorTerm_counter + 1;
zahl = str2num(Current_ErrorTerm);
zahl1 = zahl(:,1)+ i.*zahl(:,2);
ErrorTerm_Array(ErrorTerm_counter,1) = zahl1;
Current_ErrorTerm = fgetl(CalFile);
if ErrorTerm_counter > NumberOfFrequencies
disp('ERROR in file format!')
disp('E X I T P R O G R A M')
y = 0;
return
end
end
y = ErrorTerm_Array;
return
PAGE 118 / 141
TOBIAS WERNER
CORRELATION BETWEEN THE FLICKER AND THE MICROWAVE NOISE OF GAN HFETS
PAGE 119 / 141
%%%%%%%%%%%%%%%%%%%%%%%%%%%%%%%%%%%%%%%%%%%%%%%%%%%%%%%%%%%%%%%%%%%%%%%%%%%%%%%%%%%%%%%%
% FUNCTION: CalculateFixtureSParameter(ErrorTermArry1, ErrorTermArry2, FrequencyArray) %
% INPUT:
ErrorTermArry1, ErrorTermArry2, FrequencyArray, Electrical_Length
%
% OUTPUT:
Fixture_S_MA (Fixture file with frequency list in Magnitude and Angle)
%
% AUTOR:
Tobias Werner, Universitaet Stuttgart
%
% DATE:
February 29, 2000
%
%%%%%%%%%%%%%%%%%%%%%%%%%%%%%%%%%%%%%%%%%%%%%%%%%%%%%%%%%%%%%%%%%%%%%%%%%%%%%%%%%%%%%%%%
function y = CalculateFixtureSParameter(e1, e2, FrequencyArray, Electrical_Length)
%Calculate the S-parameters in Re/Im for the fixture
text = sprintf('- Calculating the S-parameters for the fixture... \n');
disp(text);
Fixture_S_RI(:,1) = ( - e2(:,1) + e1(:,1)) ./ ( - e1(:,2) .* e2(:,1) - e1(:,3) + e1(:,1) .* e1(:,2)); %S11
Fixture_S_RI(:,2) = sqrt((e1(:,3).*e2(:,3)) ./ ( - e1(:,2) .* e2(:,1) - e1(:,3) + e1(:,1) .* e1(:,2)).^2); %S12
Fixture_S_RI(:,3) = Fixture_S_RI(:,2); %S21 = S12
Fixture_S_RI(:,4) = (e1(:,2) .* e2(:,3) - e1(:,2) .* e2(:,1) .* e2(:,2) - e2(:,2) .* e1(:,3) + e2(:,2) .* e1(:,1) .* e1(:,2)) ./ ( - e1(:,2) .*
e2(:,1) - e1(:,3) + e1(:,1) .* e1(:,2)); %S22
%convert the parameters from Re/Im to Ma/Ag
% Frequency list
Fixture_S_MA(:,1) = FrequencyArray./1000000000; % Frequency in GHz
% Using TEMPORARY the second column of Fixture_S_MA to store the uncorrected phase information
Fixture_S_MA(:,2) = angle(Fixture_S_RI(:,2)).*180./pi; %ONLY TEMPORARY
Fixture_S_MA(:,5) = CorrectPhase(Fixture_S_MA, Electrical_Length);
% S11 Magnitude and Phase
Fixture_S_MA(:,2) = abs(Fixture_S_RI(:,1)); %overwrite the second column with the magnitude values of S11
Fixture_S_MA(:,3) = angle(Fixture_S_RI(:,1)).*180./pi;
% S12 Magnitude and Phase
Fixture_S_MA(:,4) = abs(Fixture_S_RI(:,2));
% Fixture_S_MA(:,5) was assigned before!
% S21 = S12
Fixture_S_MA(:,6) = Fixture_S_MA(:,4);
Fixture_S_MA(:,7) = Fixture_S_MA(:,5);
% S22 Magnitude and Phase
Fixture_S_MA(:,8) = abs(Fixture_S_RI(:,4));
Fixture_S_MA(:,9) = angle(Fixture_S_RI(:,4)).*180./pi;
y = Fixture_S_MA;
return
%%%%%%%%%%%%%%%%%%%%%%%%%%%%%%%%%%%%%%%%%%%%%%%%%%%%%%%%%%%%%%%%%%%%%%%%%%%%%%%%%%%%%%%%
% FUNCTION: StoreFixtureFile(Fixture_S_MA)
%
% INPUT:
Fixture_S_MA (Fixture file with frequency list in Magnitude and Angle)
%
% OUTPUT:
S-parameter file named "fixture.s2p"
%
% AUTOR:
Tobias Werner, Universitaet Stuttgart
%
% DATE:
February 29, 2000
%
%%%%%%%%%%%%%%%%%%%%%%%%%%%%%%%%%%%%%%%%%%%%%%%%%%%%%%%%%%%%%%%%%%%%%%%%%%%%%%%%%%%%%%%%
function y = StoreFixtureFile(Fixture_S_MA, File_name1, File_name2)
%Create output file name
fixture_file_name = sprintf('Fixture_%s_%s.s2p', File_name1(4:size(File_name1,2)), File_name2(4:size(File_name2,2)));
text = sprintf('- Storing the calculated S-parameters in the file "%s" ...', fixture_file_name);
disp(text);
SParamFile1 = fopen(fixture_file_name,'w');
if SParamFile1 == -1
text = sprintf('ERROR! Can not write file output file "%s"! Write protection?', fixture_file_name);
disp(text);
disp('E X I T P R O G R A M')
fclose(SParamFile1);
y = 1;
end
fprintf(SParamFile1 ,'! S-parameter file\n');
fprintf(SParamFile1 ,'! Matlab programm Calculate Fixture, Tobias Werner, February 2000\n');
fprintf(SParamFile1 ,'! Fixture S-Parameters\n');
fprintf(SParamFile1 ,'! Date/time %s\n', datestr(now));
fprintf(SParamFile1 ,'# GHZ S MA R 50\n');
fprintf(SParamFile1 ,'! Scattering Parameters\n');
fprintf(SParamFile1 ,'%1.5f %1.5f %8.6g %1.5f %8.6g %1.5f %8.6g %1.5f %8.6g\n',Fixture_S_MA' );
fclose(SParamFile1);
y = 0;
return
%%%%%%%%%%%%%%%%%%%%%%%%%%%%%%%%%%%%%%%%%%%%%%%%%%%%%%%%%%%%%%%%%%%%%%%%%%%%%%%%%%%%%%%%
% FUNCTION: CorrectPhase(Fixture_S_MA[:,2], Electrical_Length)
%
% INPUT:
Fixture_S_MA[:,1] = Frequency, Fixture_S_MA[:,2] = uncorr. phase of S12
%
% OUTPUT:
Corrects the phase of S_21
%
% AUTOR:
Tobias Werner, Universitaet Stuttgart
%
% DATE:
March 02, 2000
%
%%%%%%%%%%%%%%%%%%%%%%%%%%%%%%%%%%%%%%%%%%%%%%%%%%%%%%%%%%%%%%%%%%%%%%%%%%%%%%%%%%%%%%%%
function y = CorrectPhase(Fixture_S_A_S21, Electrical_Length)
text = sprintf('- Applying phase correction to S12 and S21.');
disp(text);
Velocity_of_light = 3E8; %m/s
if isempty(Electrical_Length)
Electrical_Length = CalculateElectricalLength(Fixture_S_A_S21);
text = sprintf(' (The electrical length of the fixture was calculated by the program: %2.6f m.)\n', Electrical_Length);
else
text = sprintf(' (The electrical length of the fixture was entered by the user: %2.6f m.)\n', Electrical_Length);
end
disp(text);
Ideal_phase = RangePhase(-2*180*Fixture_S_A_S21(:,1)*1E9*Electrical_Length/Velocity_of_light);
Number_of_phases = size(Ideal_phase,1);
for Current_Phase_INDEX = 1 : Number_of_phases
if abs(Fixture_S_A_S21(Current_Phase_INDEX,2)-Ideal_phase(Current_Phase_INDEX)) > 160
Fixture_S_A_S21(Current_Phase_INDEX,2) = Fixture_S_A_S21(Current_Phase_INDEX,2) - 180;
if Fixture_S_A_S21(Current_Phase_INDEX,2) < -180
Fixture_S_A_S21(Current_Phase_INDEX,2) = Fixture_S_A_S21(Current_Phase_INDEX,2) + 360;
end
end
end
y = Fixture_S_A_S21(:,2);
return
TOBIAS WERNER
CORRELATION BETWEEN THE FLICKER AND THE MICROWAVE NOISE OF GAN HFETS
%%%%%%%%%%%%%%%%%%%%%%%%%%%%%%%%%%%%%%%%%%%%%%%%%%%%%%%%%%%%%%%%%%%%%%%%%%%%%%%%%%%%%%%%
% FUNCTION: CalculateElectricalLength(Fixture_S_MA[:,2])
%
% INPUT:
Fixture_S_MA[:,1] = Frequency, Fixture_S_MA[:,2] = uncorr. phase of S12
%
% OUTPUT:
Electrical length
%
% AUTOR:
Tobias Werner, Universitaet Stuttgart
%
% DATE:
March 02, 2000
%
%%%%%%%%%%%%%%%%%%%%%%%%%%%%%%%%%%%%%%%%%%%%%%%%%%%%%%%%%%%%%%%%%%%%%%%%%%%%%%%%%%%%%%%%
function y = CalculateElectricalLength(Fixture_S_A_S21)
%Get array size
Number_of_phases = size(Fixture_S_A_S21,1);
Phase_jump_counter = 0;
for Current_Phase_INDEX = 1 : Number_of_phases - 1
if (Fixture_S_A_S21(Current_Phase_INDEX+1,2) - Fixture_S_A_S21(Current_Phase_INDEX,2)) > 130
if Phase_jump_counter == 0
Start_phase = Fixture_S_A_S21(Current_Phase_INDEX+1,2);
Start_frequency = Fixture_S_A_S21(Current_Phase_INDEX+1,1);
end
Phase_jump_counter = Phase_jump_counter + 1;
End_phase = Fixture_S_A_S21(Current_Phase_INDEX,2);
Stop_frequency = Fixture_S_A_S21(Current_Phase_INDEX,1);
end
end
delta_phase = -(Phase_jump_counter - 2) * 180 - Start_phase + End_phase; %degree
delta_frequency = (Stop_frequency - Start_frequency) *1E9; % Frequency in Hz!
slope = delta_phase/delta_frequency;
Velocity_of_light = 3E8; %m/s
electrical_length = slope * -Velocity_of_light/(2*180);
y = electrical_length;
return
%%%%%%%%%%%%%%%%%%%%%%%%%%%%%%%%%%%%%%%%%%%%%%%%%%%%%%%%%%%%%%%%%%%%%%%%%%%%%%%%%%%%%%%%
% FUNCTION: RangePhase(Phase)
%
% INPUT:
Phase in degree
%
% OUTPUT:
Phase ranged on -180...+180
%
% AUTOR:
Tobias Werner, Universitaet Stuttgart
%
% DATE:
March 02, 2000
%
%%%%%%%%%%%%%%%%%%%%%%%%%%%%%%%%%%%%%%%%%%%%%%%%%%%%%%%%%%%%%%%%%%%%%%%%%%%%%%%%%%%%%%%%
function y = RangePhase(Phase) %in degrees!
Sign_of_phase = sign(Phase);
Phase = mod(Phase, 360);
Number_of_phases = size(Phase,1);
for Current_Phase_INDEX = 1 : Number_of_phases
if Phase(Current_Phase_INDEX) > 180
RangedPhase(Current_Phase_INDEX) = Sign_of_phase(Current_Phase_INDEX) .* (360 - Phase(Current_Phase_INDEX));
else
RangedPhase(Current_Phase_INDEX) = -Sign_of_phase(Current_Phase_INDEX) .* Phase(Current_Phase_INDEX);
end
end
y = RangedPhase';
return
PAGE 120 / 141
TOBIAS WERNER
CORRELATION BETWEEN THE FLICKER AND THE MICROWAVE NOISE OF GAN HFETS
PAGE 121 / 141
Appendix G: MICROWAVE SWITCH CONTROL
The microwave setup is intended to characterize transistors on waver in the microwave
frequency range from 2 GHz to 18 GHz, concerning S-parameters, power and noise. The
system is also capable to measure DC-characteristics (I-V curves, etc.).
For each measurement type a different system configuration is necessary. This means, that
different instruments have to be combined and as a result the sensitive connections have to
be unscrewed and reconnected very often. The contact quality declines, this affects the
repeatability of the contacts, and it is then required to perform a time-consuming system
calibration as often as the configuration changes. Furthermore it is not possible to determine
several properties of the same transistor without releasing the contacts between the
microwave probes and the pads of the transistor. In case the transistor remains connected,
vibrations can damage the device while the system configuration is altered.
To make measurement less time-consuming and to get rid of the mentioned disadvantages,
the system was extended by two microwave switches.
Fig. G.1: The new microwave setup to characterize DC-characteristics, S-parameters, power and
noise of transistors in the microwave frequency range from 2 GHz to 18 GHz.
Microwave switches at the input and output allow to switch between different
setup configurations without having to calibrate the system again.
TOBIAS WERNER
CORRELATION BETWEEN THE FLICKER AND THE MICROWAVE NOISE OF GAN HFETS
PAGE 122 / 141
Fig. G.1 shows the changed setup with the microwave switches at the input and output of the
system. If the entire setup is initially characterized, it is now possible to switch between
S-parameter, power and noise measurement without having to disassemble or calibrate the
system again. DC-measurements can be performed at any time independent of the selected
measurement path. Measurements can now be carried out much quicker.
It was desirable to control the switches by software and to fully integrate it into the existing
software tool of Maury Microwaves. For this purpose a system, consisting of hardware and
software, was developed and will be discussed in the following chapters.
G.1 Microwave switches
Microwave switches from DowKey10 were chosen, because of their superior RF
characteristics and power handling capabilities, (Table G.1).
Frequency
GHz
DC-4
4-8
8-12
12-18
VSWR
(max)
1.25
1.35
1.40
1.50
Isolation
dB (min)
70
65
60
60
Insertion Loss
dB (max)
0.20
0.30
0.40
0.50
RF Power
Watts (CW)
100
70
60
45
Table G.1: RF properties of the used microwave switches.
A three way, normally-open switch model with the part number DowKey 535-520822A was
selected, because the coil voltage was specified for 12 V and it was possible to control the
switch with TTL compatible logic (5 V). The switch was equipped with SMA connectors
and indicator contacts to reflect the currently selected path.
Fig. G.2: (left) The two microwave switches with indicator LEDs connected to the control cable. Rigid
microwave cables at the inputs and outputs are mounted to connect to the system components.
(right) A mounted microwave switch on the load side of the system.
10
DowKey Microwave Corporation, 1667 Walter Street, Ventura, California 93003, USA,
PHONE (805) 650-0260 • FAX (805) 650-1734
TOBIAS WERNER
CORRELATION BETWEEN THE FLICKER AND THE MICROWAVE NOISE OF GAN HFETS
PAGE 123 / 141
G.2 Hardware
In general, computers provide supply voltages of +12V and +5 V for the main board and
additional devices. Therefore, the microwave switch control was designed to use as well the
computer supply to power the microwave switches.
The parallel port (LPT) of a computer uses TTL compatible11 voltages and is thus able to
send control information to the switch.
Unfortunately, the Maury Software ATS12 is protected against illegal copies by a hardware
key at the parallel port.
The following subchapters describe the hardware, designed to prevent from interaction
between the hardware key and the control commands, intended for the microwave switch.
G.2.1 Schematic
The hardware key itself passes all signals from the input to the output. To control a
microwave switch, a positive voltage of 5 V has to be sent to one of its three TTL ports to
activate the normally opened corresponding signal path. The switch only accepts a single
high level at one of the three TTL ports and must be protected against unsuited signals. This
is what the circuit is intended for.
Fig. G.3: The schematic of the microwave switch control.
11
High: +2.0 V to +5.2 V, Low: 0 V to +0.8 V
12
Automated Tuner System
TOBIAS WERNER
CORRELATION BETWEEN THE FLICKER AND THE MICROWAVE NOISE OF GAN HFETS
PAGE 124 / 141
The heart of the schematic shown in Fig. G.3 is the 74HCT245, a 3-state octal bus
transceiver. In the selected configuration, it passes the data (byte) at port A to Port B, if the
enable port G is activated (low active).
The connector labeled LPT_IN receives the parallel port signal from the motherboard and
passes it directly to the LPT port on the rear of the computer via the connector labeled
LPT_OUT. The data byte of the parallel port signal is also passed to the transceiver data
input ports. The printer enable signal (nSelect-Printer) is connected to the enable port G of
the transceiver and activates the setting of the microwave switches.
The port assignment of the parallel port and corresponding signal name is outlined in
Table G.2.
Pin No Pin
No Pin
No
Direction
Hardware
SPP Signal
Register
(D-Type) (main board) (Centronics)
In/out
Inverted
1
1
1
nStrobe
In/Out Control Yes
2
3
2
Data 0
Out
Data
3
5
3
Data 1
Out
Data
4
7
4
Data 2
Out
Data
5
9
5
Data 3
Out
Data
6
11
6
Data 4
Out
Data
7
13
7
Data 5
Out
Data
8
15
8
Data 6
Out
Data
9
17
9
Data 7
Out
Data
10
19
10
nAck
In
Status
11
21
11
Busy
In
Status Yes
12
23
12
Paper-Out / Paper-End
In
Status
13
25
13
Select
In
Status
14
2
14
nAuto-Linefeed
In/Out Control Yes
15
4
32
nError / nFault
In
Status
16
6
31
nInitialize
In/Out Control
17
8
36
nSelect-Printer / nSelect-In In/Out Control Yes
18
10
19
Ground
Gnd
19
12
20
Ground
Gnd
20
14
21
Ground
Gnd
21
16
22
Ground
Gnd
22
18
23
Ground
Gnd
23
20
24
Ground
Gnd
24
22
25
Ground
Gnd
25
24
26
Ground
Gnd
26 (NC)
27
Ground
Gnd
28
Ground
Gnd
29
Ground
Gnd
30
Ground
Gnd
Table G.2: Parallel port (LPT) assignment and signal names.
TOBIAS WERNER
CORRELATION BETWEEN THE FLICKER AND THE MICROWAVE NOISE OF GAN HFETS
PAGE 125 / 141
Only the three least significant bits of the parallel port signal are utilized to control the
position of the switch. Table G.3 shows which one of the three possible signal paths is
connected to the common contact, depending on the data byte and the enable port G state.
Enable port G Data byte Connected signal path
0
xxxx x001 Common with port 1
0
xxxx x010 Common with port 2
0
xxxx x100 Common with port 3
0
xxxx x000 No port connected to common
1
xxxx xxxx No port connected to common
Table G.3: Control settings and the relating activated signal path of the microwave switch.
To protect the bus transceiver from oscillations in the supply voltage, a 100 nF capacitor is
applied.
The output ports of the transceiver are three state ports, i.e. the port can be high (5 V), low
(GND) or can be in a high ohmic state. To guarantee a proper voltage level in the latter case,
according to the TTL definition, pull-down resistors are connected to the outputs of the
transceiver.
The control signals and the 12 V coil supply voltage are interfaced by a female 9-pin sub D
connector by which it can be easily mounted inside a standard PC enclosure.
G.2.2 Layout
The layout and schematic was developed with an educational version of Eagle V3.55r3 of
CadSoft. The layout from the component view of the microwave switch control and the
placement of the components can be seen in Fig. G.4.
Fig. G.4: The layout (left) and the component placement (right) of the microwave switch control.
TOBIAS WERNER
CORRELATION BETWEEN THE FLICKER AND THE MICROWAVE NOISE OF GAN HFETS
PAGE 126 / 141
In the left most part of the circuit board, the two connectors used to pass and access the
parallel port signal. In the middle the transceiver circuit, above it the block capacitor and
underneath, to save space, the three pull down resistors. In the upper right area the two
connectors for the power supply and on the right most side the female 9-pin sub D connector.
G.2.3 Printed circuit board
Fig. G.5 illustrates the technical realization of the printed circuit board from the component
and the solder side.
Fig. G.5: Top and bottom view of the printed circuit board to control the microwave switches.
G.3 Software
The program to control the hardware via the parallel port of the computer was written in
Microsoft Visual C++ 6.0. Fig. G.6 shows the user interface of the program.
The microwave measurement setup can be switched to the three configurations, S-parameter,
Power and Noise or can be turned offline; in this case no signal path is activated.
TOBIAS WERNER
CORRELATION BETWEEN THE FLICKER AND THE MICROWAVE NOISE OF GAN HFETS
Fig. G.6: The user interface to control the microwave switches.
G.3.1 Program code
In the following the source code with all functions can be found.
G.3.1.1 Header file: LPTSwitchRemote.h
// LPTSwitchRemote.h : main header file for the LPTSWITCHREMOTE application
//
#if !defined(AFX_LPTSWITCHREMOTE_H__0BD27EC4_5C15_11D4_B354_0006295283FA__INCLUDED_)
#define AFX_LPTSWITCHREMOTE_H__0BD27EC4_5C15_11D4_B354_0006295283FA__INCLUDED_
#if _MSC_VER > 1000
#pragma once
#endif // _MSC_VER > 1000
#ifndef __AFXWIN_H__
#error include 'stdafx.h' before including this file for PCH
#endif
#include "resource.h"
// main symbols
/////////////////////////////////////////////////////////////////////////////
// CLPTSwitchRemoteApp:
// See LPTSwitchRemote.cpp for the implementation of this class
//
class CLPTSwitchRemoteApp : public CWinApp
{
public:
CLPTSwitchRemoteApp();
// Overrides
// ClassWizard generated virtual function overrides
//{{AFX_VIRTUAL(CLPTSwitchRemoteApp)
public:
virtual BOOL InitInstance();
//}}AFX_VIRTUAL
// Implementation
//{{AFX_MSG(CLPTSwitchRemoteApp)
// NOTE - the ClassWizard will add and remove member functions here.
//
DO NOT EDIT what you see in these blocks of generated code !
//}}AFX_MSG
DECLARE_MESSAGE_MAP()
};
/////////////////////////////////////////////////////////////////////////////
//{{AFX_INSERT_LOCATION}}
// Microsoft Visual C++ will insert additional declarations immediately before the previous line.
#endif // !defined(AFX_LPTSWITCHREMOTE_H__0BD27EC4_5C15_11D4_B354_0006295283FA__INCLUDED_)
G.3.1.2 Header file: LPTSwitchRemoteDlg.h
// LPTSwitchRemoteDlg.h : header file
//
#if !defined(AFX_LPTSWITCHREMOTEDLG_H__0BD27EC6_5C15_11D4_B354_0006295283FA__INCLUDED_)
#define AFX_LPTSWITCHREMOTEDLG_H__0BD27EC6_5C15_11D4_B354_0006295283FA__INCLUDED_
#if _MSC_VER > 1000
#pragma once
#endif // _MSC_VER > 1000
/////////////////////////////////////////////////////////////////////////////
// CLPTSwitchRemoteDlg dialog
class CLPTSwitchRemoteDlg : public CDialog
{
// Construction
public:
UINT GetLPTPortBaseAddress(int PortNumber);
PAGE 127 / 141
TOBIAS WERNER
CORRELATION BETWEEN THE FLICKER AND THE MICROWAVE NOISE OF GAN HFETS
int ControlOutput(int SendByte);
int ReadPortStatus();
CLPTSwitchRemoteDlg(CWnd* pParent = NULL);
// standard constructor
// Dialog Data
//{{AFX_DATA(CLPTSwitchRemoteDlg)
enum { IDD = IDD_LPTSWITCHREMOTE_DIALOG };
int
m_SetupConfig;
//}}AFX_DATA
// ClassWizard generated virtual function overrides
//{{AFX_VIRTUAL(CLPTSwitchRemoteDlg)
protected:
virtual void DoDataExchange(CDataExchange* pDX); // DDX/DDV support
//}}AFX_VIRTUAL
// Implementation
protected:
HICON m_hIcon;
// Generated message map functions
//{{AFX_MSG(CLPTSwitchRemoteDlg)
virtual BOOL OnInitDialog();
afx_msg void OnSysCommand(UINT nID, LPARAM lParam);
afx_msg void OnPaint();
afx_msg HCURSOR OnQueryDragIcon();
afx_msg void OnExit();
afx_msg void OnChangeConfig();
//}}AFX_MSG
DECLARE_MESSAGE_MAP()
};
//{{AFX_INSERT_LOCATION}}
// Microsoft Visual C++ will insert additional declarations immediately before the previous line.
#endif // !defined(AFX_LPTSWITCHREMOTEDLG_H__0BD27EC6_5C15_11D4_B354_0006295283FA__INCLUDED_)
G.3.1.3 Implementation file: LPTSwitchRemote.cpp
// LPTSwitchRemote.cpp : Defines the class behaviors for the application.
//
#include "stdafx.h"
#include "LPTSwitchRemote.h"
#include "LPTSwitchRemoteDlg.h"
#ifdef _DEBUG
#define new DEBUG_NEW
#undef THIS_FILE
static char THIS_FILE[] = __FILE__;
#endif
/////////////////////////////////////////////////////////////////////////////
// CLPTSwitchRemoteApp
BEGIN_MESSAGE_MAP(CLPTSwitchRemoteApp, CWinApp)
//{{AFX_MSG_MAP(CLPTSwitchRemoteApp)
// NOTE - the ClassWizard will add and remove mapping macros here.
//
DO NOT EDIT what you see in these blocks of generated code!
//}}AFX_MSG
ON_COMMAND(ID_HELP, CWinApp::OnHelp)
END_MESSAGE_MAP()
/////////////////////////////////////////////////////////////////////////////
// CLPTSwitchRemoteApp construction
CLPTSwitchRemoteApp::CLPTSwitchRemoteApp()
{
// TODO: add construction code here,
// Place all significant initialization in InitInstance
}
/////////////////////////////////////////////////////////////////////////////
// The one and only CLPTSwitchRemoteApp object
CLPTSwitchRemoteApp theApp;
/////////////////////////////////////////////////////////////////////////////
// CLPTSwitchRemoteApp initialization
BOOL CLPTSwitchRemoteApp::InitInstance()
{
// Standard initialization
// If you are not using these features and wish to reduce the size
// of your final executable, you should remove from the following
// the specific initialization routines you do not need.
#ifdef _AFXDLL
Enable3dControls();
// Call this when using MFC in a shared DLL
#else
Enable3dControlsStatic(); // Call this when linking to MFC statically
#endif
CLPTSwitchRemoteDlg dlg;
m_pMainWnd = &dlg;
int nResponse = dlg.DoModal();
if (nResponse == IDOK)
{
// TODO: Place code here to handle when the dialog is
// dismissed with OK
}
else if (nResponse == IDCANCEL)
{
// TODO: Place code here to handle when the dialog is
// dismissed with Cancel
}
// Since the dialog has been closed, return FALSE so that we exit the
// application, rather than start the application's message pump.
return FALSE;
}
PAGE 128 / 141
TOBIAS WERNER
CORRELATION BETWEEN THE FLICKER AND THE MICROWAVE NOISE OF GAN HFETS
G.3.1.4 Implementation file: LPTSwitchRemoteDlg.cpp
// LPTSwitchRemoteDlg.cpp : implementation file
//
#include
#include
#include
#include
#include
"stdafx.h"
"LPTSwitchRemote.h"
"LPTSwitchRemoteDlg.h"
<conio.h>
<dos.h>
#ifdef _DEBUG
#define new DEBUG_NEW
#undef THIS_FILE
static char THIS_FILE[] = __FILE__;
#endif
# define LPT1
0x378
//lpt1
# define STATUS
LPT1 + 1//lpt1
# define CONTROL
LPT1 + 2//lpt1
# define ERROR
0
# define SUCCESS
1
# define SWITCH_ENABLE 236 // 11101100
# define SWITCH_DISABLE
228 // 11100100
# define SWITCH_OFFLINE
000 //DB0,DB1,DB2,DB3,DB4,DB5,DB6,DB7=high 255
# define SWITCH_S_PARAMETER 001 //DB0=low, DB1,DB2,DB3,DB4,DB5,DB6,DB7=high 254
# define SWITCH_POWER
002 //DB1=low, DB0,DB2,DB3,DB4,DB5,DB6,DB7=high 253
# define SWITCH_NOISE
004 //DB2=low, DB0,DB1,DB3,DB4,DB5,DB6,DB7=high 251
//# define LPT2 0x278 //lpt2
CString MessageControlString;
/////////////////////////////////////////////////////////////////////////////
// CAboutDlg dialog used for App About
class CAboutDlg : public CDialog
{
public:
CAboutDlg();
// Dialog Data
//{{AFX_DATA(CAboutDlg)
enum { IDD = IDD_ABOUTBOX };
//}}AFX_DATA
// ClassWizard generated virtual function overrides
//{{AFX_VIRTUAL(CAboutDlg)
protected:
virtual void DoDataExchange(CDataExchange* pDX);
// DDX/DDV support
//}}AFX_VIRTUAL
// Implementation
protected:
//{{AFX_MSG(CAboutDlg)
//}}AFX_MSG
DECLARE_MESSAGE_MAP()
};
CAboutDlg::CAboutDlg() : CDialog(CAboutDlg::IDD)
{
//{{AFX_DATA_INIT(CAboutDlg)
//}}AFX_DATA_INIT
}
void CAboutDlg::DoDataExchange(CDataExchange* pDX)
{
CDialog::DoDataExchange(pDX);
//{{AFX_DATA_MAP(CAboutDlg)
//}}AFX_DATA_MAP
}
BEGIN_MESSAGE_MAP(CAboutDlg, CDialog)
//{{AFX_MSG_MAP(CAboutDlg)
// No message handlers
//}}AFX_MSG_MAP
END_MESSAGE_MAP()
/////////////////////////////////////////////////////////////////////////////
// CLPTSwitchRemoteDlg dialog
CLPTSwitchRemoteDlg::CLPTSwitchRemoteDlg(CWnd* pParent /*=NULL*/)
: CDialog(CLPTSwitchRemoteDlg::IDD, pParent)
{
//{{AFX_DATA_INIT(CLPTSwitchRemoteDlg)
m_SetupConfig = -1;
//}}AFX_DATA_INIT
// Note that LoadIcon does not require a subsequent DestroyIcon in Win32
m_hIcon = AfxGetApp()->LoadIcon(IDR_MAINFRAME);
}
void CLPTSwitchRemoteDlg::DoDataExchange(CDataExchange* pDX)
{
CDialog::DoDataExchange(pDX);
//{{AFX_DATA_MAP(CLPTSwitchRemoteDlg)
DDX_Radio(pDX, IDC_RADIO_OFFLINE, m_SetupConfig);
//}}AFX_DATA_MAP
}
BEGIN_MESSAGE_MAP(CLPTSwitchRemoteDlg, CDialog)
//{{AFX_MSG_MAP(CLPTSwitchRemoteDlg)
ON_WM_SYSCOMMAND()
ON_WM_PAINT()
ON_WM_QUERYDRAGICON()
ON_BN_CLICKED(IDB_EXIT, OnExit)
ON_BN_CLICKED(IDC_RADIO_OFFLINE, OnChangeConfig)
ON_BN_CLICKED(IDC_RADIO_SPARAMETER, OnChangeConfig)
ON_BN_CLICKED(IDC_RADIO_POWER, OnChangeConfig)
ON_BN_CLICKED(IDC_RADIO_NOISE, OnChangeConfig)
PAGE 129 / 141
TOBIAS WERNER
CORRELATION BETWEEN THE FLICKER AND THE MICROWAVE NOISE OF GAN HFETS
//}}AFX_MSG_MAP
END_MESSAGE_MAP()
/////////////////////////////////////////////////////////////////////////////
// CLPTSwitchRemoteDlg message handlers
BOOL CLPTSwitchRemoteDlg::OnInitDialog()
{
CDialog::OnInitDialog();
// Add "About..." menu item to system menu.
// IDM_ABOUTBOX must be in the system command range.
ASSERT((IDM_ABOUTBOX & 0xFFF0) == IDM_ABOUTBOX);
ASSERT(IDM_ABOUTBOX < 0xF000);
CMenu* pSysMenu = GetSystemMenu(FALSE);
if (pSysMenu != NULL)
{
CString strAboutMenu;
strAboutMenu.LoadString(IDS_ABOUTBOX);
if (!strAboutMenu.IsEmpty())
{
pSysMenu->AppendMenu(MF_SEPARATOR);
pSysMenu->AppendMenu(MF_STRING, IDM_ABOUTBOX, strAboutMenu);
}
}
// Set the icon for this dialog. The framework does this automatically
// when the application's main window is not a dialog
SetIcon(m_hIcon, TRUE);
// Set big icon
SetIcon(m_hIcon, FALSE); // Set small icon
//UINT PortBaseAdress;
//PortBaseAdress = GetLPTPortBaseAddress(1);
m_SetupConfig = ReadPortStatus();
UpdateData(false);
// TODO: Add extra initialization here
}
return TRUE;
// return TRUE
unless you set the focus to a control
void CLPTSwitchRemoteDlg::OnSysCommand(UINT nID, LPARAM lParam)
{
if ((nID & 0xFFF0) == IDM_ABOUTBOX)
{
CAboutDlg dlgAbout;
dlgAbout.DoModal();
}
else
{
CDialog::OnSysCommand(nID, lParam);
}
}
// If you add a minimize button to your dialog, you will need the code below
// to draw the icon. For MFC applications using the document/view model,
// this is automatically done for you by the framework.
void CLPTSwitchRemoteDlg::OnPaint()
{
if (IsIconic())
{
CPaintDC dc(this); // device context for painting
SendMessage(WM_ICONERASEBKGND, (WPARAM) dc.GetSafeHdc(), 0);
// Center icon in client rectangle
int cxIcon = GetSystemMetrics(SM_CXICON);
int cyIcon = GetSystemMetrics(SM_CYICON);
CRect rect;
GetClientRect(&rect);
int x = (rect.Width() - cxIcon + 1) / 2;
int y = (rect.Height() - cyIcon + 1) / 2;
// Draw the icon
dc.DrawIcon(x, y, m_hIcon);
}
else
{
CDialog::OnPaint();
}
}
// The system calls this to obtain the cursor to display while the user drags
// the minimized window.
HCURSOR CLPTSwitchRemoteDlg::OnQueryDragIcon()
{
return (HCURSOR) m_hIcon;
}
int CLPTSwitchRemoteDlg::ReadPortStatus()
{
//possible: 1,2,4 low active!
int ControlByte;
int DataByte;
int OptionSetting;
ControlByte = _inp(CONTROL);
if(ControlByte == SWITCH_DISABLE)
{
OptionSetting = 0;
}
else
{
DataByte = _inp(LPT1);
switch(DataByte)
{
case 255:
OptionSetting = 0;
break;
PAGE 130 / 141
TOBIAS WERNER
CORRELATION BETWEEN THE FLICKER AND THE MICROWAVE NOISE OF GAN HFETS
case 254:
OptionSetting = 1;
break;
case 253:
OptionSetting = 2;
break;
case 251:
OptionSetting = 3;
break;
default:
_outp(LPT1,SWITCH_OFFLINE);
OptionSetting = _inp(LPT1);
if(OptionSetting != SWITCH_OFFLINE)
{
MessageControlString.Format("An error occured! Wrong data (%d) was read from LPT1!",OptionSetting);
MessageBox(MessageControlString);
}
}
}
return(OptionSetting);
}
void CLPTSwitchRemoteDlg::OnChangeConfig()
{
int SendByte = 0;
UpdateData(true);
switch(m_SetupConfig)
{
case 1: // S-parameter setup selected
SendByte = SWITCH_S_PARAMETER;
break;
case 2: // Power setup selected
SendByte = SWITCH_POWER;
break;
case 3: // Noise setup selected
SendByte = SWITCH_NOISE;
break;
default: // Switches turned off
SendByte = SWITCH_OFFLINE;
break;
}
_outp(LPT1, SendByte); // sends byte to port lpt1
_outp(CONTROL,SWITCH_ENABLE); //enable nPrSel => send bin1111100 => low active: Pin3=low!
//check if changes were reflected!
if(ControlOutput(SendByte) == ERROR)
{
_outp(CONTROL,SWITCH_DISABLE); //disable nPrSel => send bin1110100 => low active: Pin3=high!
}
}
void CLPTSwitchRemoteDlg::OnExit()
{
// if exit program => set port disabled
// set LPT data ports to disabled
_outp(LPT1,SWITCH_OFFLINE); //set all high = LOWACTIVE 0
// set LPT control ports to disabled
_outp(CONTROL,SWITCH_DISABLE); //disable nPrSel default = bin1110100 (dec228)
}
// if switches were not yet turned offline manually,
// display message
if(m_SetupConfig!=0)
MessageBox("Switches turned OFFLINE.");
CDialog::OnOK();
int CLPTSwitchRemoteDlg::ControlOutput(int SendByte)
{
int ReadByte;
ReadByte = _inp(LPT1);
if(ReadByte != SendByte)
{
MessageBox("ERROR setting switch!");
return(ERROR);
}
else
{
switch(ReadByte)
{
case SWITCH_S_PARAMETER: // S-Parameter
MessageBox("Switched to S-PARAMETER configuration!");
break;
case SWITCH_POWER: // Power
MessageBox("Switched to POWER configuration.");
break;
case SWITCH_NOISE: // Noise
MessageBox("Switched to NOISE configuration.");
break;
case SWITCH_OFFLINE: // Switches turned off
MessageBox("Switches turned OFFLINE.");
break;
default :
MessageBox("Wrong argument in modul ControlOutput!");
return(ERROR);
}
return(SUCCESS);
}
}
UINT CLPTSwitchRemoteDlg::GetLPTPortBaseAddress(int PortNumber)
{
//return *((unsigned int far *)MK_FP(0x40, 6) + 2 * PortNumber);
return 0;
}
PAGE 131 / 141
TOBIAS WERNER
CORRELATION BETWEEN THE FLICKER AND THE MICROWAVE NOISE OF GAN HFETS
PAGE 132 / 141
Appendix H: INDEXES
H.1 Figure index
Fig. 1.1: Noise distorting (a) an analog signal (b) a regeneratable digital signal, and
(c) a non-regeneratable digital signal. .................................................................... 4
Fig. 2.1: Dimensions of a transistor. ....................................................................................... 8
Fig. 3.1: Examples of modulation doped layers for HFETs. ................................................. 11
Fig. 3.2: Examples of GaN HFETs with T-shaped gate......................................................... 11
Fig. 3.3: Typical current voltage characteristic of (a) GaN HFETs in comparison to
(b) GaAs PHEMTs................................................................................................. 12
Fig. 3.4: S-parameters of a GaN HFET versus frequency at a certain bias condition.
Typically the S21 is smaller than unity at a reference impedance of 50
Ohms. ..................................................................................................................... 13
Fig. 3.5: Frequency dependence of the minimum noise figure and the associated
gain of GaN HFETs at room temperature. ............................................................ 13
Fig. 3.6: Bias dependence of (a) the minimum noise figure Fmin and (b) the
normalized equivalent noise resistance rn of GaN HFETs. ................................... 14
Fig. 3.7: Bias dependence of (a) the associated gain at minimum noise figure Ga and
(b) the maximum available gain Gmax. ................................................................... 15
Fig. 3.8: Typical low frequency noise of a GaN HFET biased in the linear region.
The slope of the red line is ideally proportional to 1/f. ......................................... 16
Fig. 4.1: The microwave setup to characterize DC-characteristics, S-parameters,
noise and power of transistors in the microwave frequency range. ...................... 17
Fig. 4.2: (a) Typical DC measurement result obtained with the aid of a (b)
parameter analyzer (Hewlett Packard HP4145) ................................................... 18
Fig. 4.3: The microwave setup configured for S-parameter measurements. ......................... 19
Fig. 4.4: (a) Typical result of a S-parameter measurement obtained with the aid of a
(b) vector network analyzer (Hewlett Packard HP8150C).................................... 20
Fig. 4.5: Picture of two mechanical tuners (MT982A01) with a tuner controller
(MT966B02) of Maury Microwave. ....................................................................... 20
TOBIAS WERNER
CORRELATION BETWEEN THE FLICKER AND THE MICROWAVE NOISE OF GAN HFETS
PAGE 133 / 141
Fig. 4.6: (a) Probe tip (VHT40A-GSG-150P) and (b) probe tips contacting a through
on a calibration substrate. ..................................................................................... 21
Fig. 4.7: The representation of the S-parameter setup in the ATS software of Maury
Microwave. ............................................................................................................ 21
Fig. 4.8: The microwave setup configured for noise measurements...................................... 22
Fig. 4.9: (a) Noise source (MT7618E) and (b) Noise Gain Analyzer (MT2075C). ............... 22
Fig. 4.10: Example of source and load positions for a noise measurement. The light
blue crosses in the smith chart indicate the range, which can be covered by
the mechanical tuners at 2 GHz. The red crosses in the source chart are
the positions, where the noise figure is measured and will be used to
determine the noise parameters. The red cross in the load chart point to
the position of the load impedance. ....................................................................... 23
Fig. 4.11: Typical noise measurement screen in the ATS of Maury Microwave. The
optimum source reflection coefficient Γopt is indicated by the square in the
smith chart. Circles of constant noise figure for different source
impedances are plotted in red color into the smith chart. ..................................... 24
Fig. 4.12: The representation of the noise setup in the ATS software of Maury
Microwave. ............................................................................................................ 24
Fig. 4.13: Picture of the setup to measure the low frequency noise properties of
transistors. ............................................................................................................. 25
Fig. 4.14: User interface of the program Automated IV-Curve Measurement. ..................... 25
Fig. 4.15: (a) The noise floor of the low frequency noise measurement system. The
spikes at harmonics of the power system frequency (60 Hz) cannot be
suppressed by the shielding enclosure. The graph also shows disturbances
at 15 kHz and harmonics of unknown origin. (b) The FFT spectrum
analyzer (SR770) of Stanford Research Systems. .................................................. 26
Fig. 4.16: Schematic view of the low frequency noise setup.................................................. 26
Fig. 4.17: Comparison between the same function, proportional to 1/f, plotted versus
a linear (left) and a logarithmic (right) axis.......................................................... 27
Fig. 4.18: The measurement has to be split into several measurement sections,
because an insufficient number of samples represent the lower part of the
spectrum................................................................................................................. 28
Fig. 4.19: The user interface of the program to measure the low frequency noise. .............. 30
Fig. 5.1: Typical result of a low frequency noise measurement with the slope
proportional to 1/f.................................................................................................. 31
Fig. 5.2: Contribution of generation recombination noise. ................................................... 32
Fig. 5.3: Bias condition for lowest flicker noise. ................................................................... 32
Fig. 5.4: Drain bias network.................................................................................................. 33
Fig. 5.5: Frequency dependence of the minimum noise figure Fmin. ...................................... 34
Fig. 5.6: Bias conditions for lowest microwave noise. .......................................................... 35
TOBIAS WERNER
CORRELATION BETWEEN THE FLICKER AND THE MICROWAVE NOISE OF GAN HFETS
PAGE 134 / 141
Fig. 5.7: Different approaches to analyze the correlation between the flicker and the
microwave noise. ................................................................................................... 36
Fig. 5.8: Compared parameters and number of devices on wavers for method A................. 36
Fig. 5.9: Scatter diagrams for a comparison between Fmin at 2 GHz, representing the
microwave noise, and SV, SI, SI/I2 and αH at 100 Hz, representing the
flicker noise, GaNHFET10. ................................................................................... 38
Fig. 5.10: Comparison between the point constellation of SI /I2 (filled dots, solid line)
and the Hooge parameter in dB (non-filled dots, dashed line).............................. 39
Fig. 5.11: The correlation increases for decreasing source drain voltages. ......................... 41
Fig. 5.12: Scatter diagrams for a comparison between the minimum noise figure Fmin
at 2 GHz, and SV, SI, SI/I2 and αH at 100 Hz, GaNHFET08................................... 41
Fig. 5.13: Dependent on the constellation of the points in the scatter diagram, the
correlation coefficient is very sensitive to errors. Only one additional point
can change the correlation coefficient from 0.564 (a) to 0.223 (b)...................... 42
Fig. 5.14: Scatter diagrams for a comparison between the minimum noise figure Fmin
at 2 GHz, and SV, SI, SI/I2 and αH at 100 Hz, GaNHFET04................................... 44
Fig. 5.15: Compared parameters and number of devices on waver GaNHFET10 for
method B. ............................................................................................................... 45
Fig. 5.16: Scatter diagrams for a comparison between the minimum noise figure Fmin
at 2 GHz, and SV and SI at 100 Hz. ........................................................................ 47
Fig. 5.17: Scatter diagrams for a comparison between Fmin at 2 GHz, and SV and SI
(logarithmic scale) at 100 Hz for a altered gate source voltage. .......................... 49
Fig. 5.18: Scatter diagrams for a comparison between Fmin at 2 GHz, and SV and SI
(non-logarithmic scale) at 100 Hz for an altered gate source voltage.................. 49
Fig. 5.19: Compared parameters and number of devices on wavers for method C. ............. 50
Fig. 5.20: Scatter diagrams for a comparison between the minimum noise figure Fmin
at a), b) 2 GHz and c),d) at 26 GHz and SV and SI at 100 Hz................................ 52
Fig. B.1: Simplified circuit to derive the relation between SI and SV..................................... 57
Fig. B.2: Differential resistance in the linear and saturation region. ................................... 59
Fig. B.3: Derivation of all parameters by the measured voltages and known resistors. ....... 60
Fig. B.4: Calculation of the differential resistance ri in the bias point Pi. ............................ 62
Fig. C.1: Example of a scatter diagram................................................................................. 64
Fig. C.2: The least squares line minimizes the squared distances between the line and
the points................................................................................................................ 65
Fig. C.3: Different correlation results dependent on the chosen range. a) Entire
range b) small sector. ............................................................................................ 66
Fig. C.4: Comparison of goodness of fit for two regression lines with the same slope......... 66
Fig. D.1: Layer structure of GaNHFET01............................................................................. 68
TOBIAS WERNER
CORRELATION BETWEEN THE FLICKER AND THE MICROWAVE NOISE OF GAN HFETS
PAGE 135 / 141
Fig. D.2: Typical IV-Curve for GaNHFET01. ....................................................................... 69
Fig. D.3: Waver map of GaNHFET01. .................................................................................. 70
Fig. D.4: Layer structure of GaNHFET04............................................................................. 71
Fig. D.5: Typical I-V-curve for GaNHFET04. ...................................................................... 72
Fig. D.6: Map of the waver GaNHFET04. ............................................................................ 73
Fig. D.7: Layer structure of GaNHFET08............................................................................. 74
Fig. D.8: Typical I-V-curve for GaNHFET08. ...................................................................... 75
Fig. D.9: Map of the waver GaNHFET08. ............................................................................ 76
Fig. D.10: Layer structure of GaNHFET10........................................................................... 77
Fig. D.11: Typical I-V-curve for GaNHFET10. .................................................................... 78
Fig. D.12: Noise parameters and gains of GaNHFET10_F07. ............................................. 79
Fig. D.13: Map of the waver GaNHFET10. .......................................................................... 80
Fig. E.1: Comparison between the original (blue) and the converted data (red).................. 82
Fig. E.2: Comparison between combined sections of measurements taken at linear
(left, blue) and logarithmic (right, red) equidistant steps...................................... 82
Fig. E.3: The user interface of the automated low frequency noise measurement
program. ................................................................................................................ 83
Fig. E.4: Expressive icons are used to reflect the status of the program. Their
meaning from left to right: GPIB card search, GPIB card found, GBIP
card failure, SR770 search, SR770 found, SR770 failure, SR770 warning,
SR770 save data, SR770 measurement, SR770 measurement interrupted,
SR770 measurement completed, SR770 setup ready, SR770 transferring
data, general information, general question. ........................................................ 84
Fig. F.1: Example of an insertable system component with APC3.5 female connectors
at the input and APC3.5 male connectors at the output. .................................... 107
Fig. F.2: Example of a non-insertable system component with APC3.5 female
connectors at the input and output. ..................................................................... 108
Fig. F.3: Example of a device with an APC3.5 male connector on one side and a
connector-less end on the other side.................................................................... 108
Fig. F.4: The error model for a one-port calibration with the HP8510C. .......................... 109
Fig. F.5: The error terms of two one-port calibrations can be used to calculate the
S-parameters of the fixture. ................................................................................. 110
Fig. F.6: Uncorrected phase of S12 and S21.The dots represent the discrete
measured values and the line is the linear interpolation between them. ............. 113
Fig. F.7: Corrected phase of S12 and S21........................................................................... 114
Fig. F.8: The slope of the line segment can be easily calculated in the left example,
but will lead to a wrong result for the electrical length in the right
example. ............................................................................................................... 114
TOBIAS WERNER
CORRELATION BETWEEN THE FLICKER AND THE MICROWAVE NOISE OF GAN HFETS
PAGE 136 / 141
Fig. F.9: Comparison between the results for an S-parameter determination of a
commercial system (blue) and the presented Matlab program (red). On the
left side is the magnitude and on the right side the phase of the
S-parameters........................................................................................................ 115
Fig. G.1: The new microwave setup to characterize DC-characteristics, Sparameters, power and noise of transistors in the microwave frequency
range from 2 GHz to 18 GHz. Microwave switches at the input and output
allow to switch between different setup configurations without having to
calibrate the system again. .................................................................................. 121
Fig. G.2: (left) The two microwave switches with indicator LEDs connected to the
control cable. Rigid microwave cables at the inputs and outputs are
mounted to connect to the system components. (right) A mounted
microwave switch on the load side of the system................................................. 122
Fig. G.3: The schematic of the microwave switch control................................................... 123
Fig. G.4: The layout (left) and the component placement (right) of the microwave
switch control....................................................................................................... 125
Fig. G.5: Top and bottom view of the printed circuit board to control the microwave
switches................................................................................................................ 126
Fig. G.6: The user interface to control the microwave switches. ........................................ 127
H.2 Table index
Table 4.1: Number of averages for different frequency spans............................................... 28
Table 5.1: Correlation results for bias conditions of lowest noise; GaNHFET10. ............... 37
Table 5.2: Correlation results for bias conditions of lowest noise; GaNHFET08. ............... 40
Table 5.3: Correlation results for bias conditions of lowest noise; GaNHFET04. ............... 43
Table 5.4: Correlation results for an identical bias conditions in saturation;
GaNHFET10. ....................................................................................................... 46
Table 5.5: Correlation results for an identical bias conditions in saturation;
GaNHFET10. ....................................................................................................... 48
Table 5.6: Correlation results for working points, covering the entire bias range of
one transistor on GaNHFET01............................................................................ 51
Table G.1: RF properties of the used microwave switches.................................................. 122
Table G.2: Parallel port (LPT) assignment and signal names. ........................................... 124
Table G.3: Control settings and the relating activated signal path of the microwave
switch. ................................................................................................................ 125
TOBIAS WERNER
CORRELATION BETWEEN THE FLICKER AND THE MICROWAVE NOISE OF GAN HFETS
PAGE 137 / 141
H.3 Equation index
(2.1).......................................................................................................................................... 7
(2.2).......................................................................................................................................... 7
(2.3).......................................................................................................................................... 8
(2.4).......................................................................................................................................... 9
(2.5).......................................................................................................................................... 9
(3.1)........................................................................................................................................ 14
(3.2)........................................................................................................................................ 14
(3.3)........................................................................................................................................ 15
(4.1)........................................................................................................................................ 27
(5.1)........................................................................................................................................ 33
(5.2)........................................................................................................................................ 33
(B.1) ....................................................................................................................................... 58
(B.2) ....................................................................................................................................... 58
(B.3) ....................................................................................................................................... 58
(B.4) ....................................................................................................................................... 58
(B.5) ....................................................................................................................................... 58
(B.6) ....................................................................................................................................... 58
(B.7) ....................................................................................................................................... 58
(B.8) ....................................................................................................................................... 58
(B.9) ....................................................................................................................................... 59
(B.10) ..................................................................................................................................... 59
(B.11) ..................................................................................................................................... 60
(B.12) ..................................................................................................................................... 60
(B.13) ..................................................................................................................................... 61
(B.14) ..................................................................................................................................... 61
(B.15) ..................................................................................................................................... 61
(B.16) ..................................................................................................................................... 61
(B.17) ..................................................................................................................................... 61
(B.18) ..................................................................................................................................... 61
(B.19) ..................................................................................................................................... 62
TOBIAS WERNER
CORRELATION BETWEEN THE FLICKER AND THE MICROWAVE NOISE OF GAN HFETS
PAGE 138 / 141
(B.20) ..................................................................................................................................... 62
(B.21) ..................................................................................................................................... 62
(C.1) ....................................................................................................................................... 63
(C.2) ....................................................................................................................................... 63
(C.3) ....................................................................................................................................... 63
(C.4) ....................................................................................................................................... 64
(C.5) ....................................................................................................................................... 65
(C.6) ....................................................................................................................................... 65
(C.7) ....................................................................................................................................... 65
(C.8) ....................................................................................................................................... 67
(C.9) ....................................................................................................................................... 67
(F.1) ..................................................................................................................................... 109
(F.2) ..................................................................................................................................... 110
(F.3) ..................................................................................................................................... 110
(F.4) ..................................................................................................................................... 110
(F.5) ..................................................................................................................................... 111
(F.6) ..................................................................................................................................... 111
(F.7) ..................................................................................................................................... 111
(F.8) ..................................................................................................................................... 111
(F.9) ..................................................................................................................................... 111
(F.10) ................................................................................................................................... 111
(F.11) ................................................................................................................................... 112
(F.12) ................................................................................................................................... 112
(F.13) ................................................................................................................................... 112
(F.14) ................................................................................................................................... 112
(F.15) ................................................................................................................................... 112
(F.16) ................................................................................................................................... 113
(F.17) ................................................................................................................................... 113
TOBIAS WERNER
CORRELATION BETWEEN THE FLICKER AND THE MICROWAVE NOISE OF GAN HFETS
PAGE 139 / 141
Appendix I: REFERENCES
I.1 Noise
[1]
Aldert van der Ziel, "Noise in Solid State Devices and Circuits," John Wiley & Sons, 1986
[2]
J. Verdier, O. Llopis, R. Plana, and J. Graffeuil, "Analysis of noise up-conversion in microwave
field-effect transistor oscillators," IEEE Transactions on Microwave Theory and Techniques,
vol.44, no.8 p. 1478-83, Aug. 1996
[3]
J. B. Johnson, "Thermal agitation of electric charge in conductors," Physical Review, vol. 28,
pp.74-103, 1928
[4]
H. Nyquist, "Thermal agitation of electricity in conductors," Physical Review, vol. 28, pp.110113, 1928
[5]
S. Rumyantsev, M. E. Levinshtein, R. Gaska, M. S. Shur, J. W. Yang, and M. A. Khan, "Lowfrequency noise in AlGaN/GaN heterojunction field effect transistors on SiC and sapphire
substrates," Journal of Applied Physics, vol.87, no.4 p. 1849-54, 15 Feb. 2000
[6]
P. J. Fish, "Electronic Noise and low noise design," McGraw-Hill, Inc, New York, 1994
[7]
A. L. McWhorter, “1/f-noise and germanium surface properties,” Semiconductor Surface
Physics, Philadelphia, PA, Univ. of Pennsylvania Press, p. 207, 1957
[8]
F. N. Hooge, "1/f-noise," Physica, vol.83B, p. 14, 1976
[9]
V. Sommer, P. -B. Albert, T. Zerbe, A. Schnell, A. Mesquida Kusters, and K. Heime,
"Characterization of hetero interfaces in InP/In75Ga25As/InP HFETs by means of digital signal
processing of measured low frequency noise spectra," Conference Proceedings. Sixth
International Conference on Indium Phosphide and Related Materials (Cat. No.94CH3369-6),
p. viii+656, 415-18, 1994
[10] Buckingham, M. J., "Noise in electronic devices and systems," Ellis Horwood Limited, 1983
[11] A. Balandin, S. Morozov, G. Wijeratne, S. J. Cai, R. Li, J. Li, K. L. Wang, C. R. Viswanathan,
and Yu. Dubrovskii, "Effect of channel doping on the low-frequency noise in GaN/AlGaN
heterostructure field-effect transistors," Applied Physics Letters, vol.75, no.14 p. 2064-6, 4 Oct.
1999
[12] N. Pala, R.Gaska, S. Rumyantsev, M. S. Shur, M. Asif Kahn, X. Hu, G. Simin and J. Yang,
"Low-frequency noise in AlGaN/GaN MOS-HFETs," Electronic Letters, vol. 36, no.3, p. 26870, 3 Feb. 2000
[13] Fukui, H., "Available Power Gain, Noise Figure and Noise Measure of Two Ports and Their
Graphical Representation," IEEE Trans. on CT, vol. CT- 13, No. 2, pp 137-142.
TOBIAS WERNER
CORRELATION BETWEEN THE FLICKER AND THE MICROWAVE NOISE OF GAN HFETS
PAGE 140 / 141
[14] H. T. Friis, "Noise Figures of Radio Receivers," Proceedings of the IRE, Vol. 32, pp 419422,
July 1944
[15] N. X. Nguyen, M. Micovic, W. -S. Wong, P. Hashimoto, P. Janke, D. Harvey, and C. Nguyen,
"Robust low microwave noise GaN MODFETs with 0.60 dB noise figure at 10 GHz,"
Electronics Letters, vol.36, no.5 p. 469-71, 2 March 2000
[16] O. Breitschadel, H. Grabeldinger, B. Kuhn, F. Scholz, W. Walthes, M. Berroth, I. Daumiller, K.
B. Schad, E. Kohn, and H. Schweizer, "Short-channel AlGaN/GaN HEMTs with 70 nm T-gate,"
Electronics Letters, vol.35, no.23 p. 2018-19, 11 Nov. 1999
[17] A. Vescan, R. Dietrich, A. Wieszt, H. Tobler, H. Leier, J. M. Van Hove, P. P. Chow, and A. M.
Wowchak, "MBE grown AlGaN/GaN MODFETs with high breakdown voltage," J. Cryst.
Growth (Netherlands), Journal of Crystal Growth, vol.201-202 p. 327-31, May 1999
[18] Michael Shur, "GaAs Devices and Circuits," Plenum Press, New York 1987
[19] Michael Shur, "Introduction to Electronic Devices," John Wiley & Sons, 1996
[20] G. D. Vendelin, A. M. Pavio, and U. L. Rohde "Microwave circuit design using linear and
nonlinear techniques," John Wiley & Sons, New York, 1990
[21] A. Cappy, "Noise modeling and measurement techniques (HEMTs)," IEEE Transactions on
Microwave Theory and Techniques, vol.36, no.1 p. 1-10, Jan. 1988
[22] Jin Wei, P. C. H. Chan, S. K. H. Fung, and P. K. Ko, "Shot-noise-induced excess low-frequency
noise in floating-body partially depleted SOI MOSFET's," IEEE Transactions on Electron
Devices, vol.46, no.6 p. 1180-5, June 1999
[23] J. A. Garrido, B. E. Foutz, J. A. Smart, J. R. Shealy, M. J. Murphy, W. J. Schaff, L. F. Eastman,
"Low-frequency noise and mobility fluctuations in AlGaN/GaN heterostructure filed-effect
transistors," Applied Physics Letters, vol.76, no.23, p. 3442-44, 5 Jun. 2000
[24] M. E. Levinshtein, S. L. Rumyantsev, R. Gaska, J. W. Yang, and M. S. Shur, "AlGaN/GaN high
electron mobility field effect transistors with low 1/f-noise," Applied Physics Letters, vol.73,
no.8 p. 1089-91, 24 Aug. 1998
[25] M. E. Levinshtein, F. Pascal, S. Contreras, W. Knap, S. L. Rumyantsev, R. Gaska, J. W. Yang,
and M. S. Shur, "Low-frequency noise in GaN/GaAlN heterojunctions," Applied Physics Letters,
vol.72, no.23 p. 3053-5, 8 June 1998
[26] M. E. Levinshtein, S. L. Rumyantsev, D. C. Look, R. J. Molnar, M. A. Khan, G. Simin, V.
Adivarahan, and M. S. Shur, "Low-frequency noise in n-GaN with high electron mobility,"
Journal of Applied Physics, vol.86, no.9 p. 5075-8, 1 Nov. 1999
[27] S. Rumyantsev, M. E. Levinshtein, R. Gaska, M. S. Shur, A. Khan, J. W. Yang, G. Simin, A.
Ping, and T. Adesida, "Low 1/f-noise in AlGaN/GaN HEMTs on SiC substrates," Phys. Status
Solidi A (Germany), Physica Status Solidi A, vol.176, no.1 p. 201-4, 16 Nov. 1999
[28] Jin Wei, P. C. H. Chan, S. K. H. Fung, and P. K. Ko, "Shot-noise-induced excess low-frequency
noise," IEEE Transactions on Electron Devices, vol.46, no.6 p. 1180-5, June 1999
TOBIAS WERNER
CORRELATION BETWEEN THE FLICKER AND THE MICROWAVE NOISE OF GAN HFETS
PAGE 141 / 141
I.2 Correlation
[29] Stuart L. Meyer, "Data Analysis For Scientists And Engineers," John Wiley & Sons, 1975
[30] B. M. Shchigolev, "Mathematical Analysis Of Observations," American Elsevier Publishing
Company Inc., 1965
[31] Larry D. Schroeder, "Understanding Regression Analysis – An Introductory Guide," Sage
Publications, 1986
I.3 Measurement techniques
[32] Hewlett Packard, "Fundamentals of RF and microwave Noise Figure Measurements," Hewlett
Packard Application Note 57-1, 1983
[33] Maury Microwave, "Automated Tuner System, User Manual - MT993-2," Maury Microwave,
2000
[34] Focus Microwaves, "Basics on Load Pull and Noise Measurement," Focus Microwaves Application Note 8, 1994
[35] Hewlett Packard, "A new technique for measuring components using the HP 8510C Network
Analyzer," Product Note 8510-13, Hewlett-Packard Company, 1999
[36] Hewlett Packard, "Specifying calibration standards for the HP 8510 network analyzer," Product
Note 8510-5A, Hewlett-Packard Company, 1997
[37] Hewlett Packard, "In-Fixture Measurements Using Vector Network Analyzers," Application
Note 1287-9, Hewlett-Packard Company, 1999
[38] Glenn Elmore, "De-Embedding measurements using the HP 8510 Microwave Network
Analyzer," RF & Microwave Measurement Symposium and Exhibition, Hewlett-Packard
Company, 1985