1
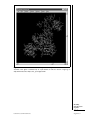
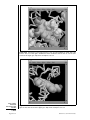
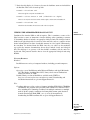
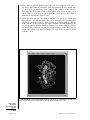
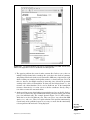
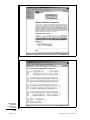
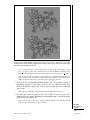
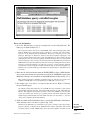
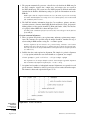
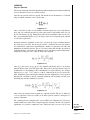
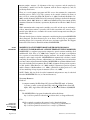
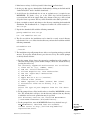
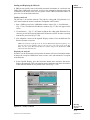
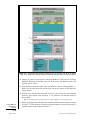
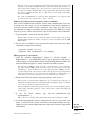
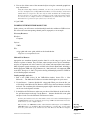
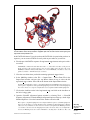
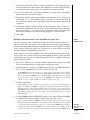
Figure 5.6.10
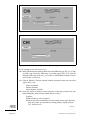
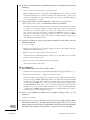
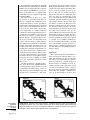
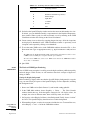
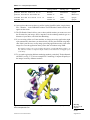
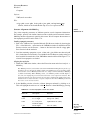
File evaluate model.py, used to generate a pseudo-energy profile for the model.
Evaluating a model
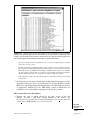
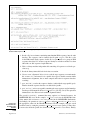
If several models are calculated for the same target, the best model can be selected
by picking the model with the lowest value of the MODELLER objective function,
which is reported in the second line of the model PDB file. In this example, the first
model (TvLDH.B99990001.pdb) has the lowest objective function. The value of the
objective function in MODELLER is not an absolute measure, in the sense that it can
only be used to rank models calculated from the same alignment.
Once a final model is selected, there are many ways to assess it. In this example, the
DOPE potential in MODELLER is used to evaluate the fold of the selected model. Links
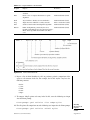
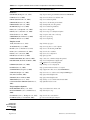
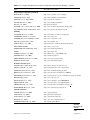
to other programs for model assessment can be found in Table 5.6.1. However, before any
external evaluation of the model, one should check the log file from the modeling run for
runtime errors (model-single.log) and restraint violations (see the MODELLER
manual for details).
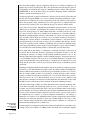
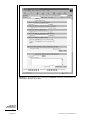
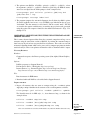
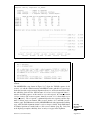
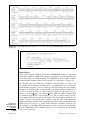
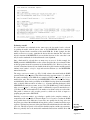
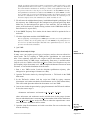
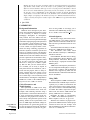
The script, evaluate model.py (Fig. 5.6.10) evaluates the model with the DOPE
potential. In this script, sequence is first transferred (using append model()), and then
the atomic coordinates of the PDB file are transferred (using transfer xyz()), to a
model object, mdl. This is necessary for MODELLER to correctly calculate the energy,
and additionally allows for the possibility of the PDB file having atoms in a nonstandard
order, or having different subsets of atoms (e.g., all atoms including hydrogens, while
MODELLER uses only heavy atoms, or vice versa). The DOPE energy is then calculated
using assess dope(). An energy profile is additionally requested, smoothed over a
15-residue window, and normalized by the number of restraints acting on each residue.
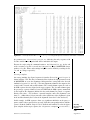
This profile is written to a file TvLDH.profile, which can be used as input to a
graphing program such as GNUPLOT.
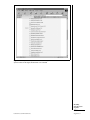
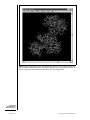
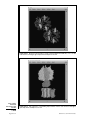
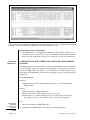
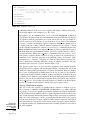
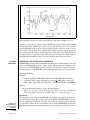
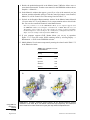
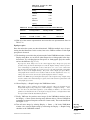
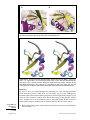
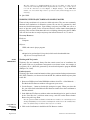
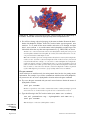
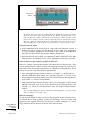
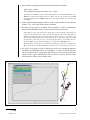
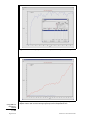
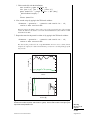
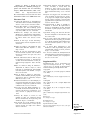
Similarly, evaluate model.py calculates a profile for the template structure. A
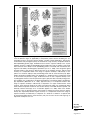
comparison of the two profiles is shown in Figure 5.6.11. It can be seen that the DOPE
score profile shows clear differences between the two profiles for the long active-site
loop between residues 90 and 100 and the long helices at the C-terminal end of the target
sequence. This long loop interacts with region 220 to 250, which forms the other half of the
active site. This latter region is well resolved in both the template and the target structure.
However, probably due to the unfavorable nonbonded interactions with the 90 to 100
Modeling
Structure from
Sequence
5.6.11
Current Protocols in Bioinformatics
Supplement 15