1
CIMMYT Institutional Multimedia Publications Repository
http://repository.cimmyt.org/
CIMMYT
Socioeconomics
A general guide to data preparation for
computer analysis of farm survey data
Hesse, E.
1982
Downloaded from the CIMMYT Institutional Multimedia Publications Repository
A GENERAL GUIDE TO DATA PREPARATION FOR
COMPUTER ANALYSIS OF FARM
SURVEY DATA
Edith Hesse de Polanco*
Economics Training Note
1982
CENTRO INTERNACIONAL DE MEJOIAMIENTO DE MAIZ Y TllGO
INTERNATIONAL MAIZE AND WHEAT IMPROVEMENT CENTER
M•xtco
A GENERAL GUiDE TO DATA PREPARATION FOR
COMPUTER ANALYSIS OF FARM
SURVEY DATA
Edith Hesse de Polanco*
Economics Training Note
1982
*
Research Assistant, 1CIMMYT Economics Program, Mexico.
expressed are not necessarily those of CIMMYT.
The views
January, .1982
Training Note
A General Guide to Data Preparation for Computer
Analysis of Farm Survey Data
Edith Hesse de Polanco
1.0
Introduction
If a computer and an appropriate program for survey data
analysis are available, the researcher has to decide whether or not
these computer facilities should be used to analyse the survey_ data or
whether an analysis by hand is sufficient.
In almost all cases a
preliminary analysis by hand is very useful to get a "feel" for the
data.
In our experience a complete manual analysis will be more efficient
if the number of farmers in the sample is less than
SO. If the sample
size is about 50-100 farmers, a computer analysis may be helpful when
the study area
~s
rather complex and farmers'
p~actices
and circum-
stances need to be analised through a relatively large number of crosstabulations.
Surveys with more than 100 farmers can nearly always be
analysed more efficiently by a computer if appropriate computational
facilities are available.
This note provides ·a short overview on presently used computers ("hardware") and computer programs ( 11 softw~re 11 ) assuming that the
researcher has no previous experience with computers.
It also presents
the steps involved in preparing the data for computer analysis.
-2-
2.0
Hardware
There are effectively three types of computers: microcom-
puters, minicomputers and the large "mainframe" computers.
The
dlfferences most noticed between these three computer types lies in
their speed of computation and in the amount of memory.
memory is usually expressed in numbers of K bytesl 1 .
The computer
Any computer has a
main or central part consisting of the power supply and the central
processing unit (CPU).· Additionally there may be devices such as video
displays with keyboards, card readers, disk and tape drives, printers
and other peripheral devices.
Microcomputers often are not larger than a normal typewriter.
They usually have an in-built video display and their memory generally
does not exceed 64 K bytes.
Data are typed in through the keyboard and
may be stored on a floppy disk or on a cassette.
As microcomputers are
a relatively recent phenomenon, a shortage of appropriate software still
exists.
However it is expected that these computers will be increasingly
used in agricultural research in developing countries primarily because
of their relatively low costs~/~
Minicomputers normally have a memory larger than 64 K bytes.
_They may be connected to larger "mainframe" computers and data are
.usually read in through a card reader.
Data can later be stored on
!/All computers use the binary system, i.e. any number, letter o~
special character is expressed by a combination of zeros or ones.
Each 0 or 1 is called a "bit''. The minimum amount of bits necessary
to represent a char~cter is cal led a 11 byte 11 • Finally, 1024 bytes
form one "K bytes".
21 A
K b~te microcomputer system with a floppy disk drive and a
printer presently costs about US $ 3000-4000.
4a
-3tapes or disks.
Minicomputers normally use computer programs similar
to those of large "mainframe" computers, although the prepared statistical
packages (described below), usually are too large for minicomputers.
Large "mainframe" computers such as the IBM 360 and the IBM
370 have a much larger memory-1/ and work at a considerably higher speed.
Apart
f~om
their wide use in developed countries they are now installed
in many research and
go~ernmental
institutions in developing countries.
I
However, in some cases the appropriate software is not available or.has
not been successfully implemented, so that some of these computers are
not being used at their full potential.
- The above comparison between mini and micro, and micro and
mainframe computers can serve as a practical guide.
However, the rapid
changes in computer technology are making the described differences less
recognizable.
3.0
Software
The crucial factor in the usefulness of a given computer for
the researcher is the availability of software.
There are a number of
programs and software packages which may be used for the
farm survey data.
Some are only available on
lar~e
an~lysis
of
computers, others
are designed for minicomputers - but can also be used on large computers and very few are presently available for microcomputers (although this
situation is changing rapidly).
For example, a small ·program for the
analysis of experimental data, including economic analysis,. will soon be
av~ilable
!/
~/
for a
microcomputer~/.
Two other small programs specially
This can range from 256 K bytes up to several Megabytes (1 Megabyte= 1024 K bytes).
Stilwell, T.C., Manual del usuario del ·sistema de estadlstica
agrlcola - Para el ·digital PDP 11/45, Consortium for International
Development, Cochabamba - Bolivia.
-4designed for the analysis of farm survey data are presently available
1I
. .
f or m1n1-computers- .
However, if a large computer with one of the more widely used
statistical packages is available, the researcher should try to get
access to it especially for the analysis of larger surveys.
The Statistical
Analysis System (SAS) allows the al'!alysis of experimental data as well
as of survey data.
The Statistical Package for the Social Sciences
(SPSS) also has many facilities for the analysis of survey data.
Both
packages consist of a large number of statistical procedures and are
highly flexible with respect to data manipulation and. represen_tation. An
inexperienced researcher needs only a day or so to get acquainted with
I
.1
houg h
• •instructions,
•
. • d •1n t he spec1a
• 1 users
th e bas1c
conta1ne
gu1• des-21 a·i:t
some guidance from the local computer staff may be useful!
4~0
Data Preparation
Data preparation begins before the questionnaires arrive in
the office.
The researcher has to check and edit every questionnaire
thoroughly as soon as
possi~le.
At this stage inconsistencies should be
!/
FAO, FARMAP, User's Manual, Farm Management Data Ana.lysis Package,
Rome, 1981.
Hesse de Polanco, E. & P. Walker, A User's Guide to FASAP, A
FORTRAN Program for the Analysis of Farm Survey Data, CIMMYT
Economics Working Paper, Sept. 1980. The latter program has
been developed for a minicomputer but is also readily usable
in larger computers. It has facilities for data transformation and missing values, performs one way frequencies, crosstabulations and tables of means by group, all with the associated
statistics.
!I
SAS Institute, SAS Introductory Guide, 1978, SAS Circ1e Box 8000,
Cary, North Carolina 27511. SAS Institute, SAS User's Guide,
1979 Edition: Post Office Box 10066, Raleigh, North Carolina
27605. Both guides are available at US$ 10.00 at their respective
addresses.
NIE, N.H., et. al., Statistical Package for the Social Scierices,
McGraw. Hill, 1970, 1975.
-5-
cleared up while the enumerators have the interviews still fresh in
mind.
Unlikely values or illegible data may be noted and sometimes a
revisit is required.
In the case of serious problems, certain question-
naires might be discarded.
In cases where the sample size is rather small (less than 50 farmers)
values for the most important variables are written by hand for each
farmer onto a large sheet of paper.
This facilitates the manual
calculation of simple frequency distributions and means. If these
calculations are to be performed for specific groups of farmers, the
task becomes increasingly time
consumi~g
using manual analysis.
Once the decision to use a computer for data analysis has been
made, the data have to be coded.
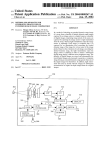
This means that all important infer-
1/
rnation from the questionnaire has to be transferred onto coding sheetsand later onto punch cards according to precise rules. Every variable
has to be identified by a variable name or number and code categories
for each variable have to be determined.
a so ca 11 ed ''code-book' 1 •
in Table 1.
This is usually done by preparing
The beg inn i ng of a typ i ca 1 code book is· shown
It contains three major pieces of information: 1) a number
and/or a shortened name for each variable of the questionnaire; 2) the
code categories for each variable; and 3) the card number and column
range into which codes for these variables have to be punched onto
cards.
!/A typical coding sheet is included in the annex. Each line of a
coding sheet ~s later punched onto one card. The above mentioned
preliminary manual analysis might also be done from the coding
sheets or from a later computer listing of the data.
Table 1.
Variable Names
CODE BOOK
Code
Column
Range
-·
........
VILLAGE
c
1= Tequesquinahuac
2= Huexotla
3= Tlaixpan
0
µ
tO
L.
"--µ
c
(1
2-4
FARM
No. 1-100
CARD
Card Number =1
Vl
Number of plots
6-8
V2
Hectares of .wheat
9-11
V3
Hectares of maize
12-14
V4
1= flat
15-17
"'O
5
2= some slope
3= steep
V25
1= tractor use-yes
O= tractor use-no
VILLAGE
the same as in card number 1
78-80
1
2-4
FARM
CARD
Card Number =2
V26
Tractor Rental $/ha
!/ See paragraph 3.2 ldentif ication Code.
5
6-8
Continuation Table 1 •.
V27
9-11
1= not enough moisture
2= tractor not available
3= didn't have time
4= not enough moisture and
not enough time.
V28
1=
2=
3=
4=
V29
12-14
owned
rented
community
government
18-20
1= fertilizer use-yes
2= fertilizer use-no
V50
r VILLAGE
'
lARH
lt of water per ha used
for herbicide application
r
i.
~he same as in card number
CARD
Card Number
V51
1= manual
2= animal
3::: tractor
etc.
78-80
=
3
1
2-4
5
6-8
-6-
4. 1 Variable Names
In most computer programs, variable names should begin
with a letter, should not be longer than 8 characters and should not
include blank spaces between the characters.
It is normally a good idea
to identify those variables to be coded by consecutive numbers (i.e. Vl,
V2, .•• ).
In certain cases it might be useful to identify certain
variables by partial names instead of numbers, especially for those
variables that are analysed frequently.
For example, if topography is
an important variable for cross-tabulation, the variable V4 in Table
might be better labeled with
11
T0P0GR 11 •
•
In the same way, if a number of
cross-tabulations by village should be done, "VILLAGE" could be used as
a variable name.
However, it is impractical to choose partial names for
the bulk of the variables.
4.2
Code Categories
In general, codes should be numbers although some statistical
packages allow the use of letters or special characters.
Some q_uestions which often arise when appropriate code
categories are to be chosen are discussed below:
1) Quantitative or continuous data (e.g. number of hectares of
a giyen crop) should always be coded as actual numbers.
One should
never categorize numerical data as this can be done much easier afterwards by data transformations in the program.
area· as
= 0-10
ha, 2
=
For example, never code
11-20 ha, etc., if actual area is known •. This
implies a loss in available information and flexibility.
-7-
I
2) Qualitative or discrete data can be coded by assigning a
number to each category.
For example, seed source might be coded as
fo I lows:
= own
2
=
seed
from a neighbor
3 = from the bank
li
= other
It is often sufficient to use a separate code only for the
most commonly occurring categories and to code all residual
o~servations
as "other".
3) Subjective data, e.g. opinions and qualitative data, should
be grouped into similar categories.
Ex.(lmp le:
Why didn't
ye~
plough :n
a) Ground was too hard
b) Not enough moisture
c) Couldn't obtain tractor
d) Tractor has been out of working order
e) Off-farm work
f) Busy in other farm wprk
In such an
11
open 11 question any number of subjective
•
reasons might appear in the questionnaires.
In the pr.ocess of editing
it is usually conven1ent to group togehter some of the answers in
-8-
order to end up with a reasonable number of categories.
However, in
certain cases one farmer might mention two or more categorized reasons
to the same question.
In such a case the researcher has to decide if it
is worthwhile to introduce an additional code which indicates the combination
of two categories (e.g. Code 4
=
not enough moisture and off-farm work).
4) For coding dates, e.g. weeks or month in which a given
practice has been done, it is often best to use the number of days or
weeks from a key reference point.
Example:
0
1
2
12
=
harvest month of the previous crop
month after harvest
two months after havest
= one
=
= etc.
In this case the time range from one reference point to an
other may easily be calculated in the computer program.
5) If the farmer is asked to indicate the quantity of a given
input, it is always important to ask and code first a so called "yes/no"
question.
· Example:
1. Did you use herbicide?
yes/no
2. How much did you apply? lt/ha
-----
If the first question wouldn't have been included, the
temptation to put a zero for a "non-user" into the data field for
question No. 2 becomes evident.
For "non-users" question No. 2 has to
• h a m1ss1ng
. •
va 1ue .1n d'1cator-l/ •
b e co d e d wit
!/
See paragraph 3,5 for the description of missing value indicators.
-9-
The same occuri with the.performance of certain practices
with their related questions:
Example:
1. Did you plough?
2. Date of ploughing?
3. Implement for ploughing?
etc.
If the first question is answered by "no" all follo\ving
related questions should be coded with a missing value indicator.
6) The coding of fertilizer data may cause problems
there often exist a number of N and P products and compounds.
~ince
The best
·way to handle it is to manually calculate nutrients applied and to code
then these nutrient quantities.
A possible exception is when the form
of fertilizer is itself a variable.
7) Code categories themselves may be categorized to facilitate
the analysis and data interpretation.
For example, barley varieties
might be coded as follows:
Example:.
11 = Cerro Prieto
New varieties
12 = Puebla
13 = Centinela
24 = Apizaco
25 = Porvenir
26 = Chevalier
01 d var i et i es
In this example a Code 1 and 2 were chosen to identify the
two variety groups "new" and "old" respectively.
identify each variable in the two groups.
Additional codes
Interpretation of frequency
tables is easier if coding is organized this way.
-10-
8) The researcher always must have in mind what type of
analysis is to be done with each variable in order to determine the
correct form
fo~
coding,· i.e. coding several variables from one question
1
or coding only one variable with several co de categories from the same
question.
Example:
In an irrigated area in northern Mexico
where two crops by season were grown,
researchers were interested in knowing to
what extent the weed problems observed in
the field were related to the preceding crops.
In this case the farmer was asked: "Which
crop did you plant on this field in:
.1980
SunJTier/Winter
i
1979
5ummer;Winter
1978
SummeriWinter
There was an initial temptation to code this question
using six different variables, i.e. one for each crop
cycle.
But as the required analysis was a crosstabula-
tion of "weed problems" by "previous rotation", it was
decided to code it in the following way: Only one
·variable called "previous crop" was coded, using the
following categories:
1 = Cotton 1980
2 = Safflower 1980
3 = Other row crop 1980
4 =·One year continuous wheat
5 =Two years continuous wheat
6 =Three years continuous.wheat
-11-
9) Code categories should be uniform not only within one
survey but also from one survey to the other in order to make the
coding task more straightforward.
0 for
11
no 11 and a
a 3 for
11
for
11
yes 11 ,
'
For example, one should always use a
•
11
or a 1 for manual 11 , a 2 for "animal" and
trac tor 11 , etc.
4.3 Column Range
In our experience we found it useful to assign the same
number of columns to each coded variable!/.
This means that even in the
case of a yes/no question, the data field should be three columns wide,
even though the code for yes (u?ually a 1) and the code for no (usually
a 0) will only· occupy one column.
ju~tified
column of the data field, leaving the left two columns blank.
In very few
d~ta
This code enters into the right
cases~
where certain quantities might occupy a four column
field, e.g. tractor rental: 1800 $/ha the values for every farmer
of this tractor rental variable should be coded by dividing all values
by. 10.
4.4
ldentif ication Code
A complete identification code allows the researcher to
identify each data card in a unique manner.
In cases where a two stage
sampling of farmers is used (e.g. a village sample and then a farmer
sample), the identification normally will consist of two different
codes: one referring to the village and the other referring to the
. 2/ •
farmer-
!/
In most cases the coding o f al 1 important variables
The column range assigned to a certain var i ab 1e is usually ca 11 ed
a "data fie 1d11 •
~/ In- the computer- language you wi 11 later use the expression
"obse~vation",
11
case 11 or "unit" instead of "farmer".
-12-
from one questionnaire will occupy more than one punch card (i.e. more
than 80 columns).
(see Table 1).
In these cases the card number also has to be coded
Some people even use an identification code for the
survey, e.g. they put a special code for survey in the beginning or
final columns of each data card.
4.5 Missing Value Indicators
At the beginning of any computer analysis it is important
to determine how missing data are to be handled.
types of missing data are usually found.
In survey data two
In some cases the farmer uses
a certain input, but does not remember the quantity or the date when he
applied it.
In very few cases the farmer may amply decline to answer a
certain question. For these cases a missing value indicator for "no
-··De coaea.
..
respon$e 1111.
- should
........... second
1111;;
type
of missing value indicator
is used in those cases where a certain question is not appropriate to
the specific situation of the farmer.
For example, it is senseless to
ask the farmer whether he used an owned or rented tractor, if we know
from a previous question that he used no tractor at all.
value indicator for "not appropriate
A missing
question"~/ should then be coded
into the data field of the variable "tractor ownership".
The form and
the handling of missing value indicators depend on the software.
Therefore
it is important to know which program or system package will be used in
order to observe the existing rules with respect to the missing values
before data are coded.
!/
~/
Using SAS for our dat~ analysis we coded this type of missing
values as "R" and using FASAP we coded it as 11 -1 11 •
Using SAS we coded it as "N" and using FASAP as
11
-2 11 •
-13-
4.6 Additional Hints for Data Preparation
In the process of coding the order of questions (i.e.
variables) should not be changed.
That is, each variable should be
coded in the same order as it appears in the questionnaire.
mean that clearly worthless variables should not be omitted.
This doesn't
For
example, the variable tractor use - yes/no should not be coded if all
sampled farmers were using a tractor and in the same way the variable
herbicide use - yes/no should not be coded if no sampled farmer used a
herbicide!/.
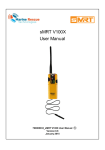
In our experience the best way to transfer the data from
the questionnaires onto the coding sheets is the following: All variables from one questionnaire should be coded in one step, using
different coding sheets if necessary.
For example, if 25 variables can
be coded into the 80 columns of one line of the coding sheet
(i.e. the 80 columns of one punch card) it is best to use one coding
sheet for the first 25 variables and the followir.g set of 25 variables
is coded onto a second coding sheet; the next 25 variables onto a third
co~ing
sheet and so on - repeating the identification code and identi-
fying each coding sheet by a consecutive number (see example below and
also Table 1) •
When all variables of the first questionnaire have been
coded into the first line(s) of the coding sheet(s), then all variables
from the second questionnaire will be coded into the second l ine(s) of
the coding sheet(s) occupying the same data fields for each variable.
!(However this will rare1y occur when the questions in the questionnaire
are based on the information obtained by a good exploratory survey.
-14Examele:
I
(I)
(I)
c:n
ro
E
en
ro
'"O
!....
>
!....
It>'
LL
ro
u
1
2
N
L/'\
N
> >
·>
2
20
. 1
3
35
. ·o
'
E
"'O
ro
co
!....
>
LL
!...
u
\,Q
,......
N
N
>
>
25
.},
2
60 ,
l
E
I~
0
L/'\
>
!....
''>·-
co
LL
I
1 2 300 1 ... 200 '1
·2 2 -2 4 ... -1 '1
.
l
1(1)
I en
I~
l 25
2
"'O
!....
rO
u
N
L/'\
>
L/'\
,......
->I
L/'\
>
1 3
2 3
2
I
25 3
2
0
• -1
2
1 0
• 1.
:IpI:
350 2 ... 200
This type of coding has the following
...
3
advant~ges:
1) Coding a 11 variables from one questionnaire in one step
a 1 lows detection of further inconsistencies in responses.
2) After coding has been finished, each data field may be
easily checked in a vertical manner and valties which do not correspond
.to the category range established for each data field may be detected
and corrected.
5.0
Key-punching
After finishing the task of transferring the data onto coding
1/
2/
sheets- ~·the data usually will be punched onto punch cards- •
l/ It is not always necessary to transfer the data onto coding sheets
since the preparation of a precoded questionnaire allows key-punching
right from the questionnaire. However, such a precoded questionnaire
is less flexible, e.g. does not allow omission of certain irrelevant
variables from coding or does not allow "open questions". Enumerators also may have more difficulties in handling the codes and a precoded
questionnaire usually becomes more voluminous. Inconsistencies which
often are detected in the process of coding and which· can still be
cleared up cannot be dete~ted by a key-p~n~her.
~I In the case of microcomputers data usually are directly typed on
keyboard and stored on a floppy disk or a cassette.
-15-
Key-punching usually is done by a specially trained key-punch operator
and is verified by redoing it on a verification machine.
cases cards may have to be intersper.sed after punching.
In certain
A data printout
should be requested immediately afterwards to allow the researcher
himself a thorough check of his coded data.
Errors will be marked on
the punch-cards and corrections often may be done by the researcher
himself.
After data checking and correction data usually will be put
onto a disk or tape file because punch-cards easily become damaged if
they are put into the card reader many times.
It is also more· expensive
to read the data from the cards·instead of reading them from a tape or
disk file since a unit cost per card read will be charged. However, a
temporarily file on tape or disk might be deleted accidentally so that
cards always should be stored in a safe
pl~=c
considering that
L...~- = ..J
ltUlli I U
conditions may cause deterioration.
ProgrQm instructions are generally written also onto the
coding sheets and later punched onto punch cards.
Some simple rules
should be observed in order to prevent mistakes during key-punching:
. - the letter 0 should be dfstinguished from the number zero by
crossing the letter 0 by a slash (0).
the letter I has to.be distinguished from the number
by
putting two horizontal bars onto the letter I.
- the letter Z should be written with one horizontal bar in order
to distinguish it from the number 2.
- the letter G should be care.fully distinguished from the number
6.
~
.
CENTRO INTERNACIONAL DE MEJORAMlENTO DE MAIZ V TRIGO
Clf:.tl'T
FECi::. _ _ _- - : - - - -
>RO G°i1A:.!;\ - : - - - - - - -
HOJA
.
r
r-··
I
1
5
•
!10
1
IS
•
CH~
rrn-n
·~
'~
1
• 20 •
.
HOJ~
~~~--
p ROGP.t.1.10------
cqo1::1cACIOt4
30
__M
I
............_!
.J [-_--c--T~r~r.~r l,o I
1
•
.
'
..._,.__.,_.~~_,__,__,_~~...............__.__.__._...._J_•_......,__._~_._._)
:
- -
_-
I:;::::.:::-:::::
;
I
~·:~::::::
,
::
:
:
:
:
.
:
:
:
:
:.:
:
:
:
:
:
:
:
:
.
:
:~,
I
I
I,,,
I
I
I
I
I "
I
I
I
I
I!
I
I
I
I
I
'
-
f
I
I
I
I
I.
:
t
.'
,:
.
I
I
- .
I
:
II
I
:::: : : : :: : : : : : : : : : : : : :: : : : : :: : : : :: .. : ::
I
I
I
: :::.::·:
: : : : : _ : :: : : : :: : : : : : : : : : : : : : : : : - : : : : . : . ::
!
...
:::·::::::::::::::
.
. - : : : : : : :: : : : : : : : : : : : : : : : : : : : : : : : : : : :
11
I.~
J
I