1
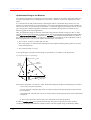
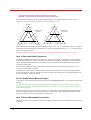
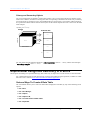
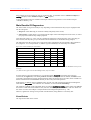
Camo Software AS The Unscrambler User Manual Non-orthogonal Scores and Weights Orthogonality properties of scores and weights are seldom of too much practical concern in PLS regression. Orthogonality is primarily important in the mathematical derivations and in developing algorithms. In some situations, the non-orthogonal nature of scores and weights in tri-PLS may lead to surprising, though correct, models. For example, two weight vectors of two different components may turn out very similar. This can happen if the same variation in one variable mode is related to two different phenomena in the data. For instance, a general increase over time (variable mode one) may occur for two different spectrally detected substances (variable mode two). In such a case, the appearance of two similar weight vectors is merely a useful flagging of the fact that the same time-trend affects different parts of the model. Maximum Number of Components The formula for determining the maximum possible number of components in PLS1 and PLS2 is min (I -1, K) with I the number of samples in the calibration set and K the number of variables. In Three-way PLS there are two variable modes, such that the maximum possible number of components is min(I-1, K*L) with K and L the numbers of primary and secondary variables. If the data is not centered, the maximum number of components is min(I,K*L). Interpretation of a Tri-PLS Model Once a three-way regression model is built, you have to diagnose it, i.e. assess its quality, before you can start interpreting the relationship between X and Y. Finally, your model will be ready for use for prediction once you have thoroughly checked and refined it. Most tri-PLS results are interpreted in much the same way as in ordinary PLS (see Chapter “Main Results of Regression” p. 111 for more details). Exceptions are listed in Chapter “Main Results of Tri-PLS Regression” above. Read more about specific details: Interpretation of variances p. 101 Interpretation of the two sets of weights p. 183 Interpretation of non-orthogonal scores and weights p. 184 How to detect outliers in regression p. 115 Three-way Data Analysis in Practice The sections that follow list menu options, dialogs and plots for three-way data analysis (nPLS). For a more detailed description of each menu option, read The Unscrambler Program Operation, available as a PDF file from Camo’s web site www.camo.com/TheUnscrambler/Appendices . In practice, building and using a tri-PLS regression model consists of several steps: 1. Choose and implement an appropriate pre-processing method. Individual modes of a 3-D data array may be transformed in the same way as a “normal” data vector (see Chapter Re-formatting and Preprocessing); 2. Build the model: calibration fits the model to the available data, while validation checks the model for new data; 3. Choose the number of components to interpret, according to calibration and validation variances; 184 Three-way Data Analysis The Unscrambler Methods