1
T-FLEX ANALYSIS
U SER M ANUAL
«Top Systems»
Moscow, 2008
© Copyright 2008 Top Systems
This Software and Related Documentation are proprietary to Top Systems. Any
copying of this documentation, except as permitted in the applicable license
agreement, is expressly prohibited.
The information contained in this document is subject to change without notice
and should not be construed as a commitment by Top Systems who assume no
responsibility for any errors or omissions that may appear in this documentation.
Trademarks:
T-FLEX Parametric CAD, T-FLEX Parametric Pro, T-FLEX CAD, T-FLEX CAD
3D, T-FLEX CAD Analysis are trademarks of Top Systems.
Parasolid is a trademark of Siemens PLM Software.
All other trademarks are the property of their respective owners.
Edition 4
Table of Contents
TA B L E O F C O N T E N T S
Introduction ...................................................................................................................................................... 5
About Mathematical Background of T-FLEX Analysis ...............................................................................5
Technical Requirements................................................................................................................................8
Computer Requirements.......................................................................................................................................... 8
Recommended computer parameters for efficient (professional) work with T-FLEX Analysis............................. 8
T-FLEX Analysis System Installation ..........................................................................................................8
Structural Organization of T-FLEX Analysis Application ...........................................................................9
Steps of Structural Analysis ..........................................................................................................................9
Quick Start ..................................................................................................................................................10
Step 1. Preparing Spatial Solid Model of a Part.................................................................................................... 10
Step 2. Creating «Study»....................................................................................................................................... 10
Step 3. Assigning Material .................................................................................................................................... 13
Step 4.1 Applying Boundary Conditions. Defining Restraints.............................................................................. 15
Step 4.2 Applying Boundary Conditions. Defining Loads.................................................................................... 17
Step 5. Running Calculations ................................................................................................................................ 18
Step 6. Analyzing Calculation Results .................................................................................................................. 19
Preparing Finite Element Model for Analysis (Preprocessor) ................................................................... 22
Types of finite-element models...................................................................................................................22
Purpose and Role of Meshes .......................................................................................................................25
Types and Role of Boundary Conditions ....................................................................................................27
Managing «Studies», Studies Management Commands .............................................................................28
General Properties of Studies................................................................................................................................ 30
Defining Material........................................................................................................................................31
Constructing Mesh ......................................................................................................................................32
Mesh Parameters ................................................................................................................................................... 34
Defining Restraints .....................................................................................................................................38
Full Restraint......................................................................................................................................................... 38
Partial Restraint..................................................................................................................................................... 38
Contact .................................................................................................................................................................. 40
Defining Loads............................................................................................................................................42
Mechanical Loads ................................................................................................................................................. 42
Force ..................................................................................................................................................................... 42
Pressure ................................................................................................................................................................. 48
Centrifugal Force .................................................................................................................................................. 52
Acceleration .......................................................................................................................................................... 53
Bearing Force........................................................................................................................................................ 55
Torque ................................................................................................................................................................... 56
Thermal Loads ............................................................................................................................................57
Temperature .......................................................................................................................................................... 58
Heat Flux............................................................................................................................................................... 59
Heat Power............................................................................................................................................................ 60
Convection ............................................................................................................................................................ 61
Radiation ............................................................................................................................................................... 62
Loads Compendium Table ..........................................................................................................................63
3
T-FLEX Analysis User Manual
Editing Loads and Restraints.......................................................................................................................64
Customization and Utility Commands ........................................................................................................65
Working with the 3D Window when Preparing Study Elements .......................................................................... 66
Specifics of Working with a Parametric Model .................................................................................................... 67
Export .................................................................................................................................................................... 67
Processing Results (Postprocessor) ...............................................................................................................68
General Principles of Working with Results ...............................................................................................68
Settings and Service Commands of Calculation Results Window ..............................................................70
Customizing Calculation Results Window............................................................................................................ 70
Color Scale Setup .................................................................................................................................................. 72
Use of Sensors for Analysis of Results ................................................................................................................. 75
Generating Reports......................................................................................................................................76
Report Templates .................................................................................................................................................. 78
List of Tags for Generating Reports ...................................................................................................................... 78
Example of Interpreting a Result.................................................................................................................79
Static Analysis.................................................................................................................................................82
Details of Static Analysis Steps...................................................................................................................83
Algorithm for Static Strength Evaluation Based on Modeling.............................................................................. 88
Settings of Linear and Nonlinear Statics Processor ....................................................................................89
Appendix (References)................................................................................................................................93
Properties of Structural Materials.......................................................................................................................... 93
Volume Stress-strain State at a Point .................................................................................................................... 95
Structure's Static Strength Assessment. Strength Theories ................................................................................... 97
Buckling Analysis ...........................................................................................................................................99
Details of Buckling Analysis Steps ...........................................................................................................100
Algorithm for Buckling Analysis Based on Modeling ........................................................................................ 101
Buckling Analysis Processor Settings .......................................................................................................101
Frequency Analysis ......................................................................................................................................103
Details of Frequency Analysis Steps.........................................................................................................104
Frequency Analysis Processor Settings.....................................................................................................105
Thermal Analysis..........................................................................................................................................107
Details of Thermal Analysis Steps ............................................................................................................107
Thermal Analysis Processor Settings ........................................................................................................109
Examples of Thermal Analysis Studies.....................................................................................................111
Thermal Analysis of a Cooling Radiator. Steady State ....................................................................................... 111
Calculating the Time of Heating up the Cooling Radiator. Transient Mode ....................................................... 113
Calculating Time of Cooling Down the Cooling Radiator. Transient Mode....................................................... 114
Verification Examples ..................................................................................................................................116
Examples of Solving Studies in Statics .....................................................................................................116
Bending of a Cantilevered Beam under a Concentrated Load............................................................................. 116
Static Analysis of a Round Plate Clamped Along the Contour ........................................................................... 117
Analysis of a Spherical Pressure Vessel.............................................................................................................. 118
Examples of Solving Buckling Studies .....................................................................................................120
Buckling Analysis of a Compressed Straight Beam............................................................................................ 120
Examples of Frequency Analysis Study....................................................................................................121
Determining Natural Frequencies of Beam Vibration......................................................................................... 121
Determining the First Natural Frequency of a Round Plate ................................................................................ 122
4
Introduction
I N T RO D U C T I O N
T-FLEX Analysis is an environment for finite element calculations integrated with T-FLEX CAD. With the
help of T-FLEX Analysis, a T-FLEX CAD user can perform mathematical modeling of common physical
phenomena and solve important practical problems arising in everyday design practice. All calculations rely
on the finite element method (FEM). At the same time, an associative relationship is maintained between the
three-dimensional model of a part and the finite element model used in calculations. Parametric notifications
of the original solid model are automatically propagated into the meshed finite element model.
• Static analysis allows calculating the state of stresses and strains in a structure under the impact of
constant in time forces applied to the model. It is also possible to account for stresses building up
due to thermal material expansion/contraction, or for structural deformations introduced by known
displacements. By using the «Static analysis» module, the user can evaluate the strength of a
structure developed by him, with respect to admissible stresses, identify the most vulnerable parts of
the structure and introduce the necessary changes, optimize the design.
• Frequency analysis allows calculating natural (resonant) frequencies of a structure and the
respective vibration modes. Based on the calculation results, the product is assessed on the presence
of resonant frequencies in the operating frequency range. The developer can enhance reliability and
performance of a product by optimizing the design in such a way as to exclude resonance
occurrences.
• Buckling analysis is important when designing structures, whose operation implies lasting influence
of loads ranging in intensity. With the help of this module, the user can evaluate safety margin by the
so-called «critical load». Significant nonelastic strains may occur suddenly within compressed parts
of a structure, which could likely cause its rupture or serious damage.
• Thermal analysis is the module providing the capability of evaluating a heated product behavior
under the impact of sources of heat and radiation. Thermal analysis can be used independently for
calculating temperature and heat fields through the volume of a structure, as well as in combination
with static analysis for evaluating thermal deformations building up in the product.
About Mathematical Background of T-FLEX Analysis
Engineering design often requires investigation of the most important physical and mechanical properties of
parts, assemblies, or the entire product. For example, in a design one must evaluate the strength of parts
under specified loads or maximum deformations of a product's body. For a long time, the only means for
evaluating physical and mechanical properties of products was assessment based on approximate analytical
or semiempirical methods, listed in industry guides. The accuracy of such methods is generally not high,
with respect to real-life design objects. Consequently, significant «safety factors» (as with respect to the
strength) are incorporated, in order to lower the risks of an unviable design.
Emergence of computers and development of computer science led to big changes in traditional approaches
to engineering calculations. From the mid-60s of the 20th century, the leading method of numerical solving a
wide variety of physical problems became finite element method (FEM). The special features of the FEM
that put it in the commanding position in the applied computational mathematics are such inherent qualities
as:
5
T-FLEX Analysis User Manual
•
versatility – the method is suitable for solving all kinds of different problems of mathematical physics
(mechanics of deformable solids, heat transfer, electrodynamics);
• good algorithmization – the suitability for developing software suites that cover a wide scope of
applications;
• good numerical stability of FEM algorithms.
Emergence of personal computers and their increasingly wide use for design purposes impacted the
accelerated development and availability of finite element analysis application systems that do not require
the user to be deeply proficient in FEM theory, eliminate labor-intensive operations of manual preparation of
initial data and offer excellent opportunities of processing results of mathematical modeling.
T-FLEX Analysis belongs to modern finite element analysis systems, oriented at a wide range of users, who,
by the nature of their responsibilities, face the requirement of assessing product behavior under conditions of
various physical influences. T-FLEX Analysis is oriented at a nonspecialist in the area of finite element
analysis and does not require the user to have in-depth knowledge in the area of mathematical modeling for
effective use of the system. Nevertheless, correctness of results of a mathematical modeling and their
appropriate assessment are determined to a significant degree by the user's proficient approach to
formulating physical problems, which are to be solved with the help of T-FLEX Analysis.
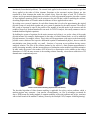
The center point of the finite element method is in replacing the original spatial structure of a complex shape
by a discretized mathematical model that appropriately represents the physical essence and properties of the
original product. The most important element in this model is the product's finite element discretization which implies building a set of elementary volumes of the specified shape (the so-called finite elements,
FE), combined in a united system (the so-called finite element mesh).
T-FLEX Analysis is oriented at solving physical problems in spatial formulation. The product's mathematical
approximation uses its equivalent replacement by a mesh of tetrahedral elements. A tetrahedral finite element
is convenient for automatic generation of the computational mesh, since the use of tetrahedra permits a highaccuracy approximation of a however complicated product shape.
Original structure and its finite element discretization
The structure that itself represents a distributed system of a complex geometrical shape is represented as a
union of finite elements. The finite elements that approximate the original structure are considered connected
to each other at the corner points - the nodes, in each of which the three translational degrees of freedom are
6
Introduction
introduced (for mechanical problems). The external loads applied to the structure are converted to equivalent
forces applied to the nodes of finite elements. Restraints on the structure's motion (fixings) are also
transferred to finite elements that model the original object. Since the shape of each FE is defined in
advance, and its geometrical characteristics are known, as well as the material properties, therefore a system
of linear algebraic equations (SLAE) can be written out for each FE that is used for modeling the structure,
describing displacements of FE nodes under the influence of forces applied at these nodes.
By writing out a system of equations for each finite element that is involved in approximating the original
physical system, we study those together and get a system of equations for the entire structure. The order of
this system of equations is equal to the product of the number of movable nodes in the structure and the
number of degrees of freedom introduced in one node. In T-FLEX Analysis, this usually amounts to tens or
hundreds thousand algebraic equations.
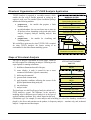
By building the system of equations for the entire structure and solving it, we get the values of the sought
physical measure (for example, displacements) in the nodes of a finite element mesh, as well as additional
physical measures, for example, stresses. Those values will be approximate (with respect to the theoretically
possible «exact» solution of the respective differential equation of mathematical physics), however with the
miscalculation error being possibly very small – fractions of a percent on test problems having «exact»
analytical solution. The error of the solution obtained as the result of a finite element approximation is
usually decreasing smoothly with the increased degree of elaboration on the modeled system discretization.
In other words, the greater is the number of FE involved in a discretization (or the smaller are the relative
dimensions of a FE), the more accurate is the resulting solution. Naturally, a more dense subdivision of FE
demands more computational power.
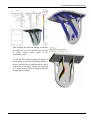
Results of finite element modeling (displacements and stresses)
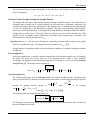
The described algorithm of finite element modeling is applicable for solving various problems, which a
modern engineer may encounter – heat transfer, electrodynamics, etc. Due to advantages accounted for
above, FEM became the leading method of computer modeling of physical problems and, in fact, associates
with a whole branch of the modern IT industry, known by the acronym CAE (Computer Aided Engineering).
7
T-FLEX Analysis User Manual
Technical Requirements
Computer Requirements
Mathematical modeling of physical phenomena belongs to the class of the resource-intensive problems that
require serious computational resources. That is why, for efficient use of the finite element modeling system
it is recommended to use the most powerful computers accessible to the user. Moreover, increase in the
dimensionality of the solved problem can be achieved by using 64-bit operating systems.
T-FLEX Analysis is available in two versions depending on the edition of the Windows operating system:
1) T-FLEX Analysis for Windows 32-bit («standard» Windows, for example, for computers Pentium III
or IV). The distinctive feature of the 32-bit operating systems is the existence of «physical» bound on
the maximum volume of addressed information (about 2 GB), which limits capabilities needed for
analysis of systems with large number of finite elements.
2) T-FLEX Analysis for Windows 64-bit (Windows XP 64-bit, Windows Vista 64-bit). This system
works on the processors that support 64-bit instructions (for example, Intel Pentium D, Intel
Core2Duo, AMD 64 and others). Operating systems with digit capacity 64-bit allow the user to
address significantly larger volumes of information and solve the problems of higher dimensionality.
Recommended computer parameters for efficient (professional) work with T-FLEX Analysis
Processor
Hard drive space (for storing
calculation results)
RAM
Operating system
Software
with support of 64-bit instructions (Intel Core2Duo, AMD 64
and others)
80 GB and higher
8 GB (and larger)
Windows 64-bit (Windows XP x64, Windows Vista x64)
T-FLEX CAD x64,
T-FLEX Analysis x64
T-FLEX Analysis System Installation
In order to use the T-FLEX Analysis application, you need to have installed the T-FLEX CAD geometrical
modeling system. Therefore, before installing T-FLEX Analysis system, first install T-FLEX CAD.
T-FLEX Analysis system is distributed with a protection from non-licensed use. To work with the system,
attach the hardware key to a parallel (LPT) or USB port of your computer (depending on the type of the key
used). Usually, a single key shipped with the Analysis program can serve for access to several different
programs, for example, to T-FLEX CAD and Analysis.
ATTENTION! The hardware key should be connected and disconnected only on a shut down computer and
the peripheral device, in case it is connected to a parallel port. The hardware key driver is automatically
installed together with T-FLEX CAD installation.
8
Introduction
Structural Organization of T-FLEX Analysis Application
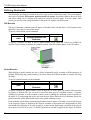
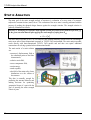
T-FLEX Analysis is organized in a modular structure, which
enables the user with a flexible approach to setting up an
engineer's work seat. The standard system installation package
includes the following modules:
• preprocessor – the module that prepares a finite
element model;
• specialized solver - the user can choose one or more out
of the four solvers, depending on the posed tasks (static
analysis, frequency analysis, buckling analysis, heat
transfer);
• postprocessor – the module for visualizing and
evaluating results.
We would like to point out also, that T-FLEX CAD is required
for using T-FLEX Analysis, the former serving as an
environment for the finite element modeling system.
T-FLEX ANALYSIS FINITE ELEMENT
MODELING SYSTEM
T-FLEX CAD 3D
Inputs product geometry data.
FINITE ELEMENT PREPROCESSOR
Builds finite element model
FINITE ELEMENT SOLVER
Generates and solves SLAE
Static
Buckling
Resonance
Heat transfer
FINITE ELEMENT POSTPROCESSOR
Visualization and evaluation of results
Steps of Structural Analysis
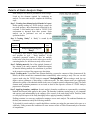
Any type of analysis is performed in several stages. Listed are
STEPS OF FINITE ELEMENT
the steps required for conducting an analysis. Following are the
ANALYSIS
steps required for running calculations:
CREATE THREE-DIMENSIONAL
1) build three-dimensional model of the part;
MODEL
2) create «Study». A study is created for one or more
STUDY
connnected solid bodies («glued» connection);
DEFINE MATERIAL
3) define more the material;
4) generate finite element mesh;
GENERATE FINITE ELEMENT
5) apply boundary conditions reflecting the essence of the
MESH
physical phenomenon being analyzed;
APPLY BOUNDARY CONDITIONS
6) run calculations;
7) analyze results.
RUN CALCULATIONS
The listed steps are valid for all types of analysis realized in «TFLEX Analysis» system. The difference in the respective
ANALYZE RESULTS
modeling steps for different types of analysis is in the types of
applied boundary conditions only, which depend on the study
(calculation) type. For example, in static analysis and in buckling, the role of the boundary conditions is
played by the forces and restraints on the product, in frequency analysis – restraints only, and in thermal
analysis – temperature and heat impact.
9
T-FLEX Analysis User Manual
Quick Start
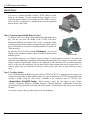
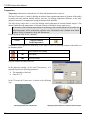
Let's review a general algorithm of using T-FLEX Analysis system,
based on the example of static strength analysis. Suppose, we are
required to perform analysis of the strain state of the "Body" structure,
whose one face is subjected to a distributed load, and the supporting
bottom surface is fully fixed.
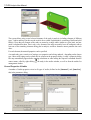
Step 1. Preparing Spatial Solid Model of a Part
For analysis, you need to have a three-dimensional solid model of the
part. The user can create the module in the T-FLEX CAD threedimensional modeling environment. This can be a «working» model,
containing projections and complete working drawings, which could be
part of an assembly or a subject to calculating numerical sequences for
CAM processing.
By using the T-FLEX CAD command «File|Import», one can load
into the system a model for analysis, that was created in another spatial
Original structure
modeling system.
For calculation purposes, it is helpful to create in advance a special optimized version of the model (an
optimized copy maintaining a parametric relationship with the original). For example, one can delete small
features from the original model, which are not significant in the calculation (such as small unimportant
holes). In this case, the calculations will run faster, and the finite element mesh can be created easier. To
correctly apply loads, it is sometimes necessary to create special "spot" faces at some locations on large
faces.
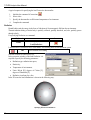
Step 2. Creating «Study»
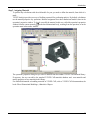
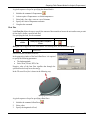
Once a three-dimensional model of the part is built in T-FLEX CAD 3D or imported into the system, you
can proceed to preparing the finite element model. Any type of calculations in T-FLEX Analysis begins with
creating a «Study» using the «New Study» command in the «Analysis» menu of T-FLEX CAD
(«Analysis|New Study|FEA Study»). When creating a study, the user defines its type («Static
Analysis», «Frequency Analysis», «Buckling Analysis», «Thermal Analysis»). Additionally, if more than
one solid body is present in the scene, then you need to specify, for which body in the scene you are creating
the study.
Let's create a study of the type «Static analysis» for our model part.
10
Introduction
Creating finite element analysis problem
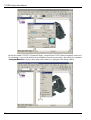
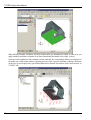
By default, the «Analysis|Mesh» command is started automatically when creating a new study. Thus,
upon the successful study creation, a dialog appears providing controls for finite element mesh generation;
upon the successful completion of the latter, we obtain a meshed model, made of tetrahedra approximating
the solid model of the part.
11
T-FLEX Analysis User Manual
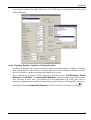
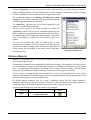
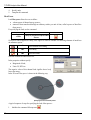
The «Analysis|Show Studies Window» command opens the study window, which displays the studies
present in the current document and their elements in a tree view.
The just created study becomes active. The newly created study elements and the issued Analysis commands
will pertain to the active study.
If there are many different studies in the document, then only one of them can be active. Switching an active
study is done via the context menu accessed by
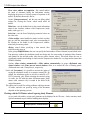
understudy name. The «Activate» command is provided
for inactive studies.
12
Introduction
Step 3. Assigning Material
To perform any calculations with the solid model of a part, you need to define the material, from which it is
made.
T-FLEX Analysis provides two ways of defining a material for performing analysis. By default, calculations
use the material properties «by operation». Material assignment for a three-dimensional model is done in the
operation's properties window. To check or modify the material in this case, called the operation's properties
window from the context menu by
on the three-dimensional body, resulting from the operation, or on the
operation name in the studies window.
The operation's properties dialog lets you select a material from the standard T-FLEX CAD material library.
If necessary, the user can add to the standard T-FLEX CAD materials database one's own materials and
modify properties of any materials in this library.
For detailed information on handling materials in T-FLEX CAD, refer to T-FLEX CAD documentation, the
book «Three-Dimensional Modeling», «Materials» Chapter.
13
T-FLEX Analysis User Manual
Besides the standard T-FLEX CAD material library, a material from T-FLEX Analysis database can be used
for calculations. Access to the Analysis material database from the current study is provided by the command
«Analysis|Material» or by the context menu of the studies tree, displayed in the studies window.
14
Introduction
Let's assign the material «Steel/AISI 1020» from the T-FLEX Analysis materials database for the model
under consideration.
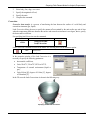
Step 4.1 Applying Boundary Conditions. Defining Restraints
In order to successfully solve a physical problem in a finite element formulation, in addition to creating a
finite element mesh it is also necessary to correctly define the so-called «boundary conditions». In statics,
their role is played by restraints and external loads applied to the system.
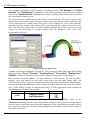
Three commands are provided in T-FLEX Analysis for defining restraints: «Full Restraint», «Partial
Restraint» and «Contact». The «Analysis|Full Restraint» command is used with the model's vertices,
faces and edges. It asserts that a given element of the three-dimensional body is fully fixed, that is, it
maintains its original position and does not change location under the impact of loads applied to the system.
By using the command «Analysis|Full Restraint», specify a fixed face of the model by selecting
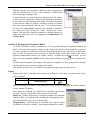
.
15
T-FLEX Analysis User Manual
When defining boundary conditions, the finite element mesh gets automatically hidden in order to let you
apply boundary conditions to elements of the three-dimensional solid model (faces, edges, vertices).
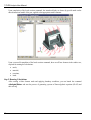
Upon successful completion of the restraints creation command, the corresponding elements are displayed in
the studies tree of the studies window, signifying presence of the respective boundary conditions. Restraints
on the face are also displayed by special three-dimensional elements (decorations) in the model window of
T-FLEX CAD.
16
Introduction
Step 4.2 Applying Boundary Conditions. Defining Loads
A set of special commands are provided in T-FLEX Analysis for defining loads, accessible from the menu
«Analysis|Load».
Using the «Analysis|Load|Force» command, select a face of the «Body», to which the load is applied. In
the command's properties dialog, specify the force value in the «Value» field (550 Newtons). The specified
force will be distributed evenly over the selected face. Originally, the force direction is assumed to be normal
to the selected flat face. If desired, one can specify the direction vector of the force.
17
T-FLEX Analysis User Manual
Upon completion of the loads creation command, the introduced loads are shown by special marks on the
three-dimensional model of the part, applied to the appropriate model elements.
Upon a successful completion of the loads creation command, there are all four elements in the studies tree,
required for running the calculations:
• mesh;
• material;
• restraints;
• loads.
Step 5. Running Calculations
After creating a finite element mesh and applying boundary conditions, you can launch the command
«Analysis|Solve» and start the process of generating systems of linear algebraic equations (SLAE) and
their solving.
18
Introduction
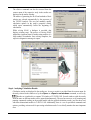
The «Solve» command can also be accessed from the
context menu of the respective study in the studies tree
displayed in the studies window.
The modes of generating the SLAE and methods of their
solution are selected automatically by the processor of
the T-FLEX Analysis. The user can manually modify
calculation options in the study's properties dialog,
which opens automatically before the beginning of
calculations.
While solving SLAE, a dialogue is provided, that
displays solution steps. The process of solving SLAE
might take significant time for studies using meshes of a
large number of tetrahedra. Once solving completes, the
respective diagnostics message is output.
Step 6. Analyzing Calculation Results
Calculation results are displayed in the studies tree. Access to results is provided from the context menu for
the study selected in the studies tree, by the «Open» or «Open in new window» command, as well as by
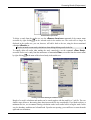
. Results are visualized in a separate 3D window of T-FLEX CAD. Several windows with the results
from the same or different studies can be opened simultaneously. The user has an access to all zooming and
panning commands working on the meshed model with the applied calculation results, just like those used
with three-dimensional models in T-FLEX CAD. Additionally, there is a set of specialized commands and
options, providing various tools for processing calculation results. Let us briefly mention the most important
ones.
19
T-FLEX Analysis User Manual
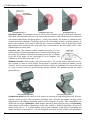
Meshed model display management. The functionality is accessed by double-clicking in the solution
viewer window or by the context menu command «Properties». The user can specify various modes of
displaying calculation results – over the mesh, without mesh, with or without displaying contour of the
original part and other bodies present in the assembly, displaying deformed state, animating the image, etc.
Animation – allows recreating the studied model behavior under a smoothly varying loading, with
simultaneous display of stress or displacement fields corresponding to the varying load.
20
Introduction
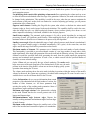
Scale setup. This functionality is accessed by
double-clicking on the scale in the results viewer
or by the «Coloring properties…» command
in the context menu of the calculation results
viewing window. The user has a range of
opportunities for setting up display of numerical
values. One can use several predefined scale
types, and, additionally, a unique capability of
setting up a flexible scale with an arbitrary color
palette. Also, there is a possibility to specify the
minimum and maximum values of the scale,
select the display of the logarithmic scale.
Dynamic result sampling. T-FLEX Analysis
Postprocessor offers a convenient capability for
sampling the result directly under the mouse
pointer. The user needs to simply point the
mouse at the location of interest on the meshed
model, and the exact result value will be
displayed at that spot. Sampling also works in the
mode of displaying the deformed model state. To
sample inner portions of the model, you can use a
T-FLEX CAD tool called «Clip plane».
Creating report – results of a solved study can
be saved as a separate electronic document. The
dialog for generating a report of the active study
is accessible via the «Analysis|Report…»
menu or from the «Report…» context menu
item of the study selected in the studies tree.
21
T-FLEX Analysis User Manual
P R E PA R I N G F I N I T E E L E M E N T M O D E L F O R A NA LYS I S
(P R E P RO C E S S O R )
The main purpose of the T-FLEX Analysis Preprocessor is preparing initial data on the physical problem to
be analyzed in the form of a finite element model, which would adequately reflect on the geometrical and
physical properties of the part being modeled. This finite element model is then processed by the T-FLEX
Analysis Processor, which results in a solution to the posed problem. Preparing a finite element model does
not require specific knowledge on the finite element analysis from a user. It is conducted on the basis of a
geometrical model interactively, using the Preprocessor commands, whose function is described in this
chapter. Use of the Preprocessor results in a finite element model of the part, containing:
• finite element mesh;
• materials data;
• boundary conditions, corresponding to the physical problem being modeled.
The order of building a finite element model in T-FLEX Analysis is arbitrary in most cases, meaning that the
user can first build the finite element mesh, and then apply boundary conditions, or, on the contrary, first
specify loads and restraints, and only afterwards generate a mesh of finite elements. Nevertheless, an
unavoidable condition for a proper finite element model is the presence of all its required components – a
mesh of finite elements (tetrahedra), material properties and external impacts on the system.
The mesh and boundary conditions are visually displayed in the T-FLEX CAD model window directly (as
the mesh) or by using special notations (boundary conditions). With this visual representation, the user can
assess correctness of the data one specified.
Types of finite-element models
Depending on geometric features of the analyzed structure, in the T-FLEX Analysis it is possible to construct
any of three kinds of finite-element models:
• tetrahedral finite element model;
• laminar finite element model;
• hybrid finite element model.
Let us consider the cases of using each type of the finite element meshes in detail.
Tetrahedral finite-element model. In this case, to approximate geometry of the modeled part, its
representation by finite elements of tetrahedral shape is used. Tetrahedral finite element mesh well
approximates the arbitrarily complex shape of parts and provides satisfactory results of modeling physical
problems for objects of arbitrary shape, whose characteristic sizes along three space dimensions (length,
width, height) are comparable with each other. Most parts and joints of the standard mechanical and
instrumental engineering equipment fall into this category.
22
Preparing Finite Element Model for Analysis (Preprocessor)
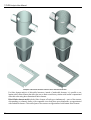
Typical mechanical engineering objects and their tetrahedral finite element models
Laminar finite element model. Substantial class of structures used in people’s life has a special geometric
shape when one of the dimensions (thickness) is considerably smaller than two other dimensions – width and
length. Such structures are usually called thin-walled. For example, in mechanical engineering these
structures can serve as the shells of various machines, spiral of turbines; in instrumental engineering –
flexible elastic elements: accordion boots, membranes, including crimp, plate springs; in civil engineering –
coatings, floors, ramps, sheds and aprons, in shipbuilding – hulls of ships; in aircraft industry – fuselage and
wings of aircrafts; in industry – various tanks: cisterns, reservoirs, etc.
23
T-FLEX Analysis User Manual
Examples of thin-walled structures and their laminar finite element models
For finite element analysis of thin-walled structures, instead of tetrahedral elements, it is possible to use
laminar (shell) finite elements that allow the user to obtain a satisfactory solution with smaller computational
effort than when using three-dimensional finite elements.
Hybrid finite-element model includes finite elements of both types simultaneously – parts of the structure
corresponding to volumetric bodies, with comparable sizes along three space dimensions, are approximated
with tetrahedral elements. Thin-walled parts of the structure are approximated with laminar finite elements.
24
Preparing Finite Element Model for Analysis (Preprocessor)
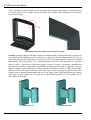
Examples of structures and their hybrid finite element models
Purpose and Role of Meshes
The main purpose of a finite element mesh is to adequately approximate geometry of the body being
modeled, accounting for all features of the part geometry significant to the solution. The T-FLEX Analysis
Preprocessor uses an effective automatic generator of finite element meshes, which lets the user control
various modes of mesh generation in order to obtain meshes of the desired quality on different models. In TFLEX Analysis, volumetric tetrahedral and triangular surface finite elements are used in finite element
meshes, which, in theory, allow approximation with any required accuracy. Nevertheless, there are several
preliminary recommendations regarding adequacy of calculation models using finite elements.
Firstly, quality of a solution may depend on the shape of the involved finite elements. Best results of finite
element modeling are achieved, if the elements (tetrahedrons and triangles) forming the meshed model are
close to equilateral ones. This is especially important for tetrahedral elements. Vise versa, if a meshed model
contains elements, whose element-generating edges vary in their size greatly, then the modeling results could
be of an insufficient accuracy. In such cases, it is desirable to minimize the number of such improper
elements by means of the options provided in the finite element mesh generator.
«Poor» mesh of finite element model
«Good» mesh of finite element model
25
T-FLEX Analysis User Manual
Thus, a user needs to control «quality» of the constructed finite element model based on a visual inspection
or with the help of «Grid settings», aiming at possibly more uniform shape distribution of the elements
involved in the mesh.
More adequate mesh obtained after using mesh parameters settings
Secondly, besides the shapes of the finite elements, the solution quality is directly affected by the degree of
discretization of the original geometrical model, that is «density» of the finite element mesh. The user can
control this mesh generator’s parameter by specifying a relative or absolute mean size of the finite elements
approximating the body geometry, or by varying parameters that affect mesh generation on curvilinear
models. Usually, a finer division yields better results in terms of accuracy. Nevertheless, remember that
approximating a model by a large number of small finite elements inevitably leads to a high-order system of
algebraic equations, which could adversely affect the speed of calculations. Quality of a finite element model
can be assessed by subsequently solving several studies with ever-increasing degree of discretization. If the
solution (such as maximum displacements and stresses) no longer shows significant difference on a denser
mesh, then, to a great certainty, one can regard it as an optimal discretization level, so that a higher rate of
discretization is unjustified.
Relative size of 0.2
26
Relative size of 0.05
Preparing Finite Element Model for Analysis (Preprocessor)
In many cases, consider the estimated minimum level of a body’s division as that delivering two to three
layers of finite elements in the direction of applying loads and anticipated displacements.
Additionally, the mesh generator provides means for creating user-imposed mesh «refinement» in the areas
of the model with sharp variations in the curvature, where one would expect high gradients of the sought
values (stresses, for example).
Thus, one should pay much attention to the meshed model being generated for a finite element model,
watching that the finite element mesh corresponded to the model geometry and had a satisfactory quality
from the viewpoint of insuring a reliable and trustworthy solution to the physical problem being modeled.
Types and Role of Boundary Conditions
Boundary conditions differ, depending on the type of the physical problem being modeled, as follows.
In the case of the «Static Analysis» problem type, the following represent boundary conditions:
• «Full Restraint» restraint;
• «Partial Restraint» restraint;
• «Contact» restraint;
• «Force» load;
• «Pressure» load;
• «Centrifugal Force» load;
• «Acceleration» load;
• «Bearing Force» load;
• «Torque» load;
• «Temperature» thermal load.
In the case of the «Frequency Analysis» problem type, the following represent boundary conditions:
• «Full Restraint» restraint;
• «Partial Restraint» restraint.
In the case of the «Buckling Analysis» problem type, the following represent boundary conditions:
• «Full Restraint» restraint;
• «Partial Restraint» restraint;
• «Force» load;
• «Pressure» load;
• «Centrifugal Force» load;
• «Acceleration» load;
• «Bearing Force» load;
• «Torque» load.
In the case of the «Thermal Analysis» problem type, the following represent boundary conditions:
• «Temperature» thermal load;
• «Initial temperature» thermal load;
• «Heat Flux» thermal load;
27
T-FLEX Analysis User Manual
• «Convection» thermal load;
• «Heat Power» thermal load;
• «Radiation» thermal load.
The essence of a physical problem is determined by the type of boundary conditions applied to the system.
To obtain a correct and trustworthy solution, the user needs to imagine well the physical side of the
phenomenon being analyzed, in order to specify boundary conditions corresponding to real conditions
affecting the product in its life cycle. The result of solving a study will be fully determined by the
composition and parameters of boundary conditions, specified by the user. A solution could be obtained that
does not reflect on the essence of the physical phenomenon being analyzed, if the user fails to interpret
correctly the meaning of a mechanical or thermal load or restraint. Note that the process of designating
boundary conditions cannot be totally automated, therefore the user is charged with the responsibility of
correctly applying loads and restraints on the system, from the prospective of the physically solvable
problem.
Managing «Studies», Studies Management Commands
Study is a special system object uniting data and elements required for running a specific calculation of a
model. A study contains necessary settings of calculation parameters, as well as information on the used
objects (solid bodies and/or shells), on the basis of which the finite
element model is built, loads, restraints and finite element mesh. After
completing calculations, the study also contains solution results. The type
of a calculation to run is specified for a study: static, frequency, thermal,
buckling analysis.
A special «Studies» tool window is provided for handling studies (the
same functions are provided in the “3D Model” window). The studies
window displays in a tree layout complete information about prepared
studies within a given document, and about all elements included in each
study. The window provides a quick access to elements of each study.
Each type of study, as well as every study element, is marked with a
specific icon. Some study elements (loads, restraints, results) are joined
into groups.
Several studies can be created in one document for running different
calculations. The study currently being worked on is called active. The active
study’s icon has a red check in the studies window. To make another study
active, use the context menu command «Activate».
Working in the studies window is done using the context menu that provides all
necessary commands. The contents of a context menu depend on what study
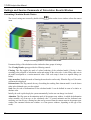
element was right-clicked .
A special command is provided for managing the list of studies:
Keyboard
<3MN>
28
Textual Menu
«Analysis|Studies…»
Icon
Preparing Finite Element Model for Analysis (Preprocessor)
The dialog window of this command displays the list of all studies
existing in the current document. The buttons for calling main
commands are to the right of the list.
To quickly create similar studies of the same type and for the same
model (for example, to compare solution results on different meshes
or with different material), one can use the study copying
functionality.
By default the option «Copy mesh» is turned on, that is, the study is
copied with all elements contained in it, except the results. If this
option is turned off, the finite element mesh will not be copied, i.e.,
for the considered studies the mesh will be common.
To create a new study, use the command:
Keyboard
Textual Menu
Icon
<3MN>
«Analysis|New Study»
After calling the command, you can select the type for the study being created
in the properties window.
At this stage, all you can do is specifying the type of the new study. Once a
study is created, its type can be changed only under the condition of clearing
the study data (including the loss of the calculation results). A study is created
based on one or several solid-creating operations. If the scene contains a single
body, it is selected automatically. If there are more than one suitable objects in
the scene, then the user shall select desired ones.
Selection of objects can be carried out with the help of the option:
/
<E>
Click to select Element (Body, Face)
<S>
Select All Element
The user can cancel selection of all objects with the help of the option:
<R>
Cancel selection
When analyzing thin-walled structures, the user can determine which fragments of the model have to be
discretized with laminar (triangular) finite elements and which fragments – with tetrahedral finite elements.
That is why, for «Elements of Study», which will take part in calculation, it is required to select the faces
and/or bodies. For each selected face, specify the «Thickness».
29
T-FLEX Analysis User Manual
The system allows using several selected elements of the study in analysis, including elements of different
types – bodies and faces (in this case the result is the so-called «hybrid model», consisting of shells and solid
bodies). Given that, all elements of the study are treated as a single whole (similar to a glue joint), and one
mesh is calculated for them. That is why, every element of the study necessarily has to be contiguous with at
least one of the remaining elements taking part in analysis, and these elements cannot penetrate into each
other.
For each element, the material properties can be specified.
A created study gets a certain set of settings, new properties and solving methods – depending on the chosen
type. Other study settings can be edited after its creation in the properties dialog. A study’s properties dialog
box may automatically appear before running calculations or when calling the respective command from the
context menu, called by right-clicking
the study in the studies window, as well as from the studies list
management window.
General Properties of Studies
A number of similar properties exists in all types of studies, defined on the [General] and [Results]
tabs in the parameters dialog.
30
Preparing Finite Element Model for Analysis (Preprocessor)
On the tab [General] the user can specify the study’s name, modify its type (Static Analysis, Frequency
Analysis, Stability Analysis, Thermal Analysis) and enter the comments. Comments are used for recording
necessary explanations, and are output at the time of generating a report.
We recommend turning on the «Display this dialog box before
solving» flag. This allows specifying study properties and adjusting
calculation algorithms before the execution.
The [Results] tab shows the list of results displayable in the
studies tree after finishing calculations.
This list can be set up in the dialog accessible by clicking the
[Options] button. The user can set checkmarks against any item
if one is planning to investigate the corresponding result in the future.
The marked items will be output in the studies window. The desired
results could further be loaded into the calculation results view
window.
The user can customize the results list either before or after
calculations are completed. The total calculation run time does not
depend on the number of output results. The system will calculate all
Dialog for setting up the list of Results
results anyway, but will display in the studies window only those
displayable in the studies tree
selected by the user.
Defining Material
Material – is an element of the T-FLEX CAD. It contains the list of characteristics of a real material which
the user deals with in real life.
Characteristics of material can be conditionally divided into two groups. Characteristics of the first type are
the ones affecting the display of three-dimensional objects in a 3D window. Characteristics of the second
type – are various physical parameters of material such as density, elasticity modulus, strength limit in
tension, etc. The characteristics of the second type are necessary for carrying out calculations.
A part’s response to loading depends on what material it is made of. The program needs to know elastic
properties of the material, from which the part consists. The program supports isotropic materials, that is, the
materials, whose properties are same in all directions.
By default, material properties used for a study’s calculations inherit from the subject operation’s
parameters. Specifying an operation’s material is described in the three-dimensional modeling guidebook.
Additionally, there is an alternative approach to specifying a study’s material properties.
Specifying an individual study’s material is done by the command:
Textual Menu
Keyboard
Icon
<3MJ>
«Analysis|Material»
31
T-FLEX Analysis User Manual
After calling the command, the dialog window appears.
By default, the switch is set in the «From Operation» position. This means
that material properties are inherited from the operation’s material. If the
switch is moved to the «Other» position, then the input fields for the study’s
material properties become accessible. One can use the [...] button, which
calls the window with a set of predefined materials. After selecting a material,
its properties are read and appear in the main dialog.
Located in the lower part of the dialog window are the fields for selecting
units for main physical measures.
Constructing Mesh
For mesh manipulations, use the command:
Keyboard
Textual Menu
<3MM>
«Analysis|Mesh»
Icon
The mesh creation command can be automatically called after completing creation of the new study. The
command launches the mesh management procedure for the active study. Depending on the existence of a
mesh in the active study, the system will either create a new or edit the existing mesh. A mesh is created
based on the operation selected at creation of the current active study. Only one mesh can be created for one
study.
32
Preparing Finite Element Model for Analysis (Preprocessor)
When creating a mesh, one can select model elements to obtain local zones of refined mesh. This is done
with the purpose of getting more accurate calculation results at the critical spots of the model.
The user can select the elements for improving mesh with the help of the following automenu options:
<L>
Select Elements to refine Mesh
Можно выбирать 3D узлы, вершины, рёбра и грани:
<A>
Select Faces, Edges, Vertices
<P>
Select 3D Node
<V>
Select Vertex
<E>
Select Edge
<F>
Select Face
Within the reach of the Refinement radius (see below) around the selected element, the size of mesh
elements will be equal to the size specified in the mesh parameters for the selected refinement element.
At the mesh calculation time, the system displays a tool window that tracks the progress of the generation
process. The window has a [Cancel] button that allows terminating the mesh calculation process.
As the parametric model changes, the mesh may require an update. The system can automatically update the
mesh, if the respective setting is made in the mesh parameters. Start the mesh update command manually
from the context menu by right-clicking
the mesh in the studies window.
33
T-FLEX Analysis User Manual
Mesh Parameters
Settings for the mesh being generated can be made either in the properties window or in the identical
parameters dialog.
There are two versions of finite elements used in the T-FLEX Analysis – straight-edged and curvilinear. The
straight-edged finite element has nodes only at vertices, while the curvilinear element has intermediate nodes
at the middle points of the edges (see the picture). Thus, tetrahedrons contain 4 or 10 nodes, and triangles – 3
or 6 nodes.
3-node straight-edged triangular finite element
4-node straight-edged tetrahedral finite element
34
6-node curvilinear triangular finite element
10-node curvilinear tetrahedral finite element
Preparing Finite Element Model for Analysis (Preprocessor)
The use of curvilinear finite elements allows the user to more accurately approximate a complex geometry
and obtain higher accuracy of the solution with the smaller number of elements.
Thus, for more accurate description of the complex geometry of the boundaries, it is necessary to use either a
large number of the elements with the straight sides (edges), i.e., straight-edged finite elements, at the
boundary, or use curvilinear finite elements.
It is worth noting that with the same step of discretization, creating the mesh with curvilinear elements
requires more time than generation of the mesh with straight-edged elements, especially for the models with
large number of radii and fillets. In certain cases, the mesh with curvilinear elements cannot be generated at
all, or its generation may take an unacceptably long time.
At the same time, difference between the results obtained on the meshes curvilinear and straight-edged finite
elements (as, for example, extreme displacements and stresses) vanishes to zero, when using a sufficiently
fine discretization.
Consequently, if constructing a mesh with curvilinear finite elements fails on a particular model of
a complex geometrical shape or generating such a mesh takes too long time, then we recommend
building a mesh of straight-edged finite elements with a sufficiently small discretization step, and
use the latter for calculations instead.
The diagram below shows examples of dividing a model into finite elements of each type. The size of mesh
elements is somewhat exaggerated for better visual effect, as compared to what is required for calculations.
Original model
Mesh of straight-edged elements
Mesh of curvilinear elements
Setting up mesh updating parameters is done by selecting a choice in the dropdown list. Two choices are
provided – on request (“ask”) and automatically (at model regeneration).
Mesh size. The finite element edge size in the mesh being generated can be specified as relative or absolute.
In the first case, the size of edge is defined as a fraction of the model-outlining box’s longest side. For the
absolute size, a finite element edge is defined in the model units. The specified size is adjusted by the system
to eventually get all mesh elements with edges of approximately the same size nearing the value set in the
parameters. The model elements selected for mesh refinement allow setting only the absolute size.
Global size propagation factor. Controls the speed of mesh variation from reduced-size mesh cells to large
cells of the general size. If the factor equals 1 (default), then the mesh size nearly doubles with each
following element up until its size reaches the large mesh size. With the reduction of the factor value, the
transition of sizes occurs in a lesser number of steps (large leaps in the element size). If the factor is equal 0,
then a cell’s size jumps to coarse without transition. Normally, the values near one are used most in practice.
35
T-FLEX Analysis User Manual
Propagation factor = 1
Propagation factor = 0.5
Propagation factor = 0
Refinement radius. This parameter can be set only for model elements selected for local mesh refinement.
Refinement radius determines the size of the zone around the element, within which the mesh is constructed
with enhanced individually specified properties – usually, finer meshing. The distance is counted from the
element selected for refinement. The absolute mesh size for each auxiliary element is specified separately. In
practice, this capability can be used for achieving more accurate calculation results by the processor within
approximately same calculation time, using more coarse overall mesh for the entire model, while a more
elaborated mesh at critical points.
Curvature ratio. This parameter enables automatic processing of curved
surfaces and sets a limit on the minimum size of a mesh element during such
processing. The limitation is defined by the bending factor, that is evaluated
as the ratio of the depth d to the chord length h (see the diagram). The
limitation can be specified in the range 0 ÷ 0.5.
Minimum curvature. Works together with «Curvature ratio». This sets the ultimate minimum size of a
curve segment, to which it can be divided. This parameter is introduced for limiting the number of mesh
elements – this is because automatic subdivision of surfaces could go on indefinitely on some models, such
as a cone, in order to meet the specified bending amount condition. This parameter permits any values
greater than zero.
Curve processing disabled
Curve processing enabled
Optimization options provide control over the process of generating an improved-quality mesh. When the
generator creates the mesh, it first calculates a preliminary mesh. After that, the program can apply certain
manipulations to the obtained preliminary mesh in order to improve its quality. Those manipulations are
divided into two stages: optimization, which changes connectivity between mesh vertices, and Smoothing,
which replaces mesh vertices. Optimization can be either enabled or disabled. Smoothing is driven by a
number in the range 0 ÷ 5. A greater number yields greater smoothing. A high degree of smoothing will
temper transitions in the mesh size. One can distinguish the surface and the volume mesh optimization
36
Preparing Finite Element Model for Analysis (Preprocessor)
processes. In most cases, when those are unnecessary, you can disable these options. This will speed up the
mesh generation process.
Not modifying surface mesh while optimizing volume mesh allows optimizing the volume mesh so as not
to affect the surface mesh obtained at the first stage of the generation. Otherwise, the mesh on the surface can
be changed in the optimization. This capability is useful in the cases, when the user wants to maintain the
mesh structure of the part's surface, that was obtained as a result of adjusting grid settings, yet still pursues
optimization of the volume mesh.
Suppress small elements. Enabling this flag tells the system, what relative or absolute-size minor model
elements (edges or faces) can be ignored in the mesh calculation. This capability shall be used in the cases,
when the model has such very small topological elements, whose presence greatly slows down or even
makes impossible calculating a valid mesh, suitable for the Analysis purposes.
Small feature meshing. The automatic mesh generator is fit with a special algorithm for an improved
processing of small, yet significant, model features. When enabling this mode, you should also specify the
maximum relative or absolute size of elements to be processed by this algorithm.
Smallest corner angle defines the admissible range of angle values between a mesh element's (tetrahedron's)
edges. The greatest triangle's angle is calculated automatically (180°-a_min). At the same time, note that
angles outside this range could still be present due to other factors.
Maximum number of elements. This parameter sets a limitation on the total number of mesh elements.
This functionality is provided to prevent accidental creation of a too large number of mesh nodes, which
might significantly slow down both generation of the mesh itself and the following solving. If the number of
elements exceeds the specified limit while generating the mesh, then the system outputs the appropriate
message and terminates mesh generation. In such a case, to obtain a mesh with the specified number of
elements, use more relaxed settings.
On the «View» tab, one can specify the type of mesh rendering. The surface mesh
helps assess most of the main properties of the obtained mesh. In this way, the mesh
portions in the interior of the model's volume are not shown, helping speedy system
operation when rotating the 3D scene.
The volume mesh rendering shows the entire mesh, including its portions within the interior of the model's
volume. In this mode, the system may experience a slowdown when rotating the 3D scene. In such a case, it
would be best to use the wireframe mode for the 3D scene.
On the «Information» tab you can get information about certain
properties of the obtained mesh: the total number of vertices, the
number of finite elements, etc. All those parameters help
assisting the quality of the resulting mesh generation. Some of
the parameters require additional explanation:
Maximum edge length relations is the characteristic referring
to the mesh element that has the overall greatest ratio of its
longest and shortest edges.
Maximum/minimum angle between edges. Reports the
actually resulting maximum and minimum angles between edges
of mesh elements.
Maximum radius relations. Reports the smallest ratio of the
radii of the inscribed and circumscribed spheres of a tetrahedron.
37
T-FLEX Analysis User Manual
Defining Restraints
The location for specifying a restraint can be a face, edge or vertex of the subject body. The system supports
three types of restraints: full restraint, partial restraint and contact. A restraint is added to the active study
and can be related only to elements of the body that is used in the active study. To avoid a failure when
solving, you need to create enough restraints for the model, for example, one full restraint.
Full Restraint
This type of boundary conditions locks all degrees of freedom for the selected object. A full restraint can be
applied to a face, edge or vertex of the model.
To specify a full restraint, use the command:
Keyboard
<3MC>
Textual Menu
Icon
«Analysis|Restraint| Full
Restraint»
To specify a restraint, you need to select a model element. Faces, edges and vertices are available for
selection. Upon selecting an element, the symbolic notation of the full restraint appears in the 3D window.
Partial Restraint
When defining a partial restraint, the user is offered to manually specify restraints on different degrees of
freedom. When using only partial restraints, you need to ensure the sufficient number of restraints for fixing
the model.
To specify a partial restraint, use the command:
eyboard
<3ML>
Textual Menu
Icon
«Analysis|Restraint|Partial
Restraint»
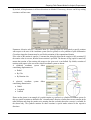
To specify locations of a partial restraint, select an edge, face or vertex. Next, you need to define restraints
by degrees of freedom. The user can work in one of the three types of coordinate systems – Cartesian,
cylindrical or spherical. A local coordinate system is used for binding the coordinate system in question to
the model. It is worth noting that in the case when the user did not define the local coordinate system, the
partial constraints will be defined with respect to the global coordinate system.
Each coordinate system allows restraining displacements in three degrees of freedom. An activated box item
of the respective degree of freedom in the selected coordinate system means that displacements are fully
constrained in this direction (if the value is equal 0), or that a known displacement is specified (if the value in
the respective text field is not zero). A cleared flag means no restraint is applied in this degree of freedom.
38
Preparing Finite Element Model for Analysis (Preprocessor)
By default, all displacements in all three directions are blocked. If necessary, the user can lift up existing
restraints or add new ones.
Parameters «Rotation about X», «Rotation about Y», «Rotation about Z» are required to specify rotations
with respect to the axes of the coordinate system (local or global) to solve problems of plate deformation.
Given that, triangular elements must be used for discretization of the computational domain.
If the value of the rotation is equal to 0, it means that, along this direction the rotation is fully restrained. If
the rotation value is not zero, then the known rotation is specified. The absence of flag (option is turned off)
means that restraint of the rotation with respect to the given axis is not defined. By default, restraints of
rotations with respect to the axes of the selected coordinate system are absent.
A cylindrical coordinate system allows
constraining displacements in:
• Radial
• By Cirle
• By Rotation Axis
A spherical coordinate
constraining dimensions in:
• Radial
• Longitude
• Latitude
system
allows
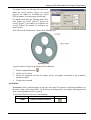
Shown on the picture is an example of a partial restraint on a surface in a cylindrical coordinate system. In
this case, partial restraints are defined in the "circumferential" direction, whereas there are no restraints in the
radial direction and along the rotation axis, meaning that the revolution about the own axis is excluded for
the shown body. The symbolic notation for those restraints is special marks oriented in the respective
directions.
39
T-FLEX Analysis User Manual
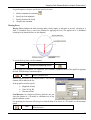
The "Partial Restraint" command also provides
another useful functionality. The user can specify
known displacements for the structure, such as a
known in advance strain in the structure. For this,
specify the value of fixed displacement of a model
element along some of the coordinate axes in the
"Partial Restraint" command's properties window.
Static analisys will be performed with this condition.
Full Restraint
Partial Restraint
Note that a static solution is possible in this case without applying additional (force) loads. In this way, one
can evaluate the stress developing in a strained structure when the quantitative values of the strain
(displacements) are known.
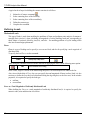
A typical order of steps for defining partial restraints is as follows:
1.
2.
3.
4.
5.
.
Initiate the "Partial Restraint" command
Select element to fix.
Select LCS.
Mark the necessary limits for displacements by the axes and define their values.
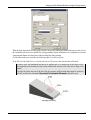
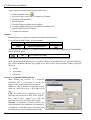
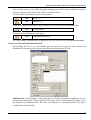
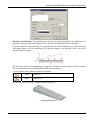
Complete the command.
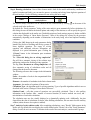
Contact
Contact restraints are needed in studies of contacting bodies. To define a contact, use the command:
Keyboard
<3MI>
Textual Menu
«Analysis|Restraint|Contact»
To define a contact, you need to select the contacting
faces of two bodies.
Next, select one of four contact types:
• Rigid Contact;
• No Contact;
• Touch;
• Hard Wall.
The contact type “Rigid Contact” is used in the case
when it is necessary to bond the contacting surfaces
of the bodies. The bodies are considered as bonded
in this case, so that relocations of a face in one body
40
Icon
Preparing Finite Element Model for Analysis (Preprocessor)
result in relocations of the other body faces without any restrictions. If the bodies are made of materials with
different physical characteristics, then the finite element model correctly accounts for the different material
properties of different faces of contacting bodies.
If the contact area is not subjected to any restraints, then use the “No Contact” type. In this case, the
contacting surfaces can freely move with respect to each other. Therefore, when using this contact, one
should be on guard against mutual penetration of contacting faces when a load is applied.
The “Touch” contact differs from “No Contact” in that it bans mutual penetration of the contacting faces.
This contact type allows modeling such physical phenomena as sliding of one body along another one,
occurrence of gaps at the part connection locations due to deformation, etc. We would like to also note that
using the “Touch” contact implies existence of a physical contact between body faces in the initial state of
the structure being analyzed.
“Hard Wall” is used to model a contact of a body with a rigid surface, whose deformation can be neglected
for the modeling purposes. In this case, all that is necessary is to define the faces of the first body that contact
the “Hard Wall”.
It is possible to set default contacts.
Keyboard
Textual Menu
Icon
«Analysis|Restraints|Default
Contact Parameters»
This command defines the contact type to use by default. This serves to define global contact parameters for
all bodies in contact. For example, if a combined structure is being calculated, that consists of several rigidly
connected parts, then defining the default contact as «Rigid Contact» helps avoid manual definition of the
contact type for all surfaces in contact. Default contact parameters can be redefined with the help of the
«Contact» command.
The dependency of a model behavior on various contact types can
be illustrated with the following example. Two beams are kept
together using a contact restraint, with one end fixed, and a
distributed force acting normal on the top and side surfaces of the
Initial Model
first beam.
If the «Rigid Contact» type is used, then the combined beam is
deformed as a single solid.
Contact type «rigid contact»
In the case when the “Touch” contact is used, one can see that the
top beam makes the lower one deformed and at the same time slides
along it.
Contact type «touch»
When using «No Contact», one can observe penetration of the top
beam into the lower one, which shall be avoided when designing
assembly models.
Contact type «no contact»
41
T-FLEX Analysis User Manual
A typical order of steps for defining the contact restraints is as follows:
1.
2.
3.
4.
5.
Initiate the «Contact» command
.
Select contacting faces of the first body.
Select contacting faces of the second body.
Define the contact type.
Complete the command.
Defining Loads
Mechanical Loads
This type of loads is used when modeling the problems of linear and nonlinear static analysis of structures’
strength (Static Analysis), when calculating the magnitude of critical buckling loads and, corresponding to
them, shapes of structures (Buckling Analysis), and also – for modeling problems of cyclic loading which
take into account fatigue phenomena.
Force
Force is a type of loading used to specify a concentrated load, and also for specifying a total magnitude of
distributed load.
To specify the load Force, use the command:
Keyboard
Textual Menu
<3MF>
Icon
«Analysis|Load|Force»
After calling the command, select the model elements for applying the load. Use the following menu option:
<E>
Select Element for loading
select a faces, edges or vertices of the model being analyzed. The selected objects are added to the list.
Also, since with the help of Force, the user can specify the total magnitude of linear (surface) load, it is also
necessary to define the way this load is distributed along the edge length (over the face area). In the window
properties, it is required to specify the load type:
• uniform;
• non-uniform.
Force as a Total Magnitude of Uniformly Distributed Load
When defining the Force as a total magnitude of uniformly distributed load, it is required to specify the
numeric value, units and direction of its action.
42
Preparing Finite Element Model for Analysis (Preprocessor)
Numeric value. The numeric value is defined as a total equivalent magnitude of uniformly distributed along
the edge length (over the face area) load.
When the Force is uniformly distributed, the load per unit length of the edge (per unit area of the face) is
equal to the ratio of the specified load magnitude to the edge length (face area).
It is worth noting that if the load magnitude is specified simultaneously for several elements (it is allowed to
select the elements of a single type only: vertices, edges or faces), its total value will be distributed between
them in the following way:
• The load magnitude equal to the ratio of the specified load to the total area of the faces will be acting
on a unit area of each face;
• The magnitude equal to the ratio of the specified load to the total length of edges will be acting on a
unit length of each edge;
• Each vertex will be subjected to the part of the force equal to 1/n, where n- is the number of vertices.
Units. For the load Force the following units can be used: N, lbf, kgf.
Load direction. As a direction of the Force, the user can select the normal to the loaded face, the element of
a 3D model or a certain radius-vector, specified in the selected by the user local coordinate system (if the
local coordinate system is not specified, the global coordinate system will be used by default).
To work with the local coordinate system, use the following options:
<C>
Select LCS
<K>
Unselect LCS
For specifying the load direction with the help of a 3D model, use the following automenu option:
<D>
Select direction
To cancel selection of direction, use the option:
<U>
Cancel direction selection
For a quick change of Force direction to reverse, the user can turn on the flag “Reverse Direction”.
43
T-FLEX Analysis User Manual
Force as a Total Magnitude of Non-uniformly Distributed Load
When defining the Force as a total magnitude of non-uniformly distributed load, in addition to the numeric
value, units and direction of its action, it is required to specify a qualitative distribution law, according to
which the load will be distributed over the face area.
Value. We will define the numeric value of the force as a total magnitude of load non-uniformly distributed
over the face area.
Units. For the Force, the following units can be used: N, lbf, kgf.
Distribution Law. On the rectangle, circumscribing the face selected as the domain of application of nonuniform load, a uniform grid of nodes is generated. The density of grid is determined by the number of rows
and columns in the distribution table. The value of the function at a corresponding node of the grid is
specified in the cells of the table.
44
Preparing Finite Element Model for Analysis (Preprocessor)
Example of specifying distribution law for non-uniform load
Interpolation. Since the values of the distribution function are known only at the grid points (i.e, specified
by the table), it is necessary to extend definition of this function to an arbitrary point on the face. In the TFLEX Analysis there are two ways of defining the function from the known values: linear interpolation
(linear dependence is constructed between the values at the grid points) and spline construction.
Figures show examples of non-uniform load distributions obtained with the help of linear interpolation and
spline construction.
Example of non-uniform load distribution function obtained by spline construction
45
T-FLEX Analysis User Manual
Example of non-uniform load distribution function obtained by using linear interpolation
Direction of Load. For a direction of the Force, the user can select the normal to the loaded face, the
element of a 3D model or a radius-vector, specified in the selected by the user local coordinate system (if the
local coordinate system is not specified, the global coordinate system will be used by default).
To work with the local coordinate system, use the following options:
<C>
Select LCS
<K>
Unselect LCS
For specifying direction of the force with the help of an object of a 3D model, use the following automenu
option:
<D>
Select direction
To cancel selection of direction, use the option:
<U>
Cancel direction selection
For a quick change of Force direction to reverse, the user can turn on the flag «Reverse direction».
Bending Moments
In the dialog «Force parameters», in addition to parameters defining the load type, numeric value, units, load
direction, etc., there is a group of parameters called «Moment».
46
Preparing Finite Element Model for Analysis (Preprocessor)
With the help of parameters of this group, the user can specify bending moments with respect to the axes of
the coordinate system (local or global) for solving problems of plate deformation. It is important to note that
computational domain was discretized with the triangular finite elements.
For the Moment the user can utilize the following units: N-m, lbf-in, kgf-cm.
In the 3D scene the load «Force» is shown with arrows. The arrows show the direction of the load.
In many cases, the distributed load has to be applied only to a certain part of the edge or face,
corresponding to the domain of action of the external load, and not to the entire face or edge of the
model.
To apply the load to the part of the face, first the geometry of the desired shape must be created on
the face, and then the command «Operation|Faces|Imprint Elements» should be used.
Specifying load «Force»
47
T-FLEX Analysis User Manual
Typical sequence of steps for specifying the load «Force»:
1.
2.
3.
4.
5.
6.
7.
8.
Initiate command «Force»
.
Select face, edge, vertex, node or a sequence of elements.
Specify the load magnitude.
Specify the units.
Select the load type: uniform or non-uniform
For a non-uniform load, specify the qualitative distribution law
Specify the direction of load action
Complete the command.
Pressure
Pressure represents a loading type used for specifying a distributed load.
For specifying the load Pressure, use the command:
Keyboard
Textual Menu
<3MC>
Icon
«Analysis|Load|Pressure»
After invoking this command, it is required to select the model’s elements for application of load. With the
help of automenu option:
<E>
Select Element for loarding
select the face or the edge of the analyzed model. Selected elements will be added to the list.
Since with the help of option Pressure it is possible to define only distributed load, it is required to define the
type of this distribution along the edge length or over the face area. In the properties window, specify the
load type:
• uniform;
• non-uniform;
• hydrostatic.
Pressure as a Uniformly Distributed Load
When defining the Pressure as a uniformly
distributed load, it is necessary to specify the
numeric value, units, and direction of its action.
Value. The value is defined as a magnitude of load
acting on a unit area of face or unit length of an
edge.
Units. For a load Pressure, applied to a face, the
following units can be used: N/m2, lbf/in2, kgf/cm2.
For a load Pressure, applied to an edge, the
following units can be used: N/m, lbf/in, kgf/cm.
Direction. As a direction of Pressure, the user can
select the normal to the loaded face, the element of a
3D model or a certain radius-vector, specified in the
selected by the user local coordinate system (if the
48
Preparing Finite Element Model for Analysis (Preprocessor)
local coordinate system is not specified, the global coordinate system will be used by default). By default, in
the local coordinate system, the direction of load is set along the X-axis.
To work with the local coordinate system, use the options:
<C>
Select LCS
<K>
Unselect LCS
To specify the direction of the load Pressure with the help of a 3D model, use the automenu option:
<D>
Select direction
To cancel selection of direction, use the option:
<U>
Cancel direction selection
For a quick change of load direction to an opposite one, the user can activate the flag «Reverse direction».
Pressure as a Non-Uniformly Distributed Load
When defining the Pressure as a non-uniform load, it is necessary to specify the units, direction and
distribution law according to which a given load will be defined at each point of a face.
Distribution law. On the rectangle, circumscribing the face selected as the domain of application of a nonuniform load, a uniform grid of nodes is generated. The density of grid is determined by the number of rows
and columns in the distribution table. The value of the function at a corresponding node of the grid is
specified in the cells of the table.
49
T-FLEX Analysis User Manual
Interpolation. Since the values of the distribution function are known only at the grid points (i.e, specified
by the table), it is necessary to extend definition of this function to any point on the face. In the T-FLEX
Analysis there are two ways of defining the function from the known values: bilinear interpolation (linear
dependence is constructed between the values at the grid points) and spline construction.
Units. For load Pressure, applied to a face, the following units are used: N/m2, lbf/in2, kgf/in2.
Load direction. As a direction of Pressure, the user can select the normal to the loaded face, the element of
a 3D model or a certain radius-vector, specified in the selected by the user local coordinate system (if the
local coordinate system is not specified, the global coordinate system will be used by default). By default, in
the local coordinate system, the direction of load is set along the X-axis.
To work with the local coordinate system, use options:
<C>
Select LCS
<K>
Unselect LCS
To specify the direction of the load Pressure with the help of a 3D model, use the automenu option:
<D>
Select direction
To cancel selection of direction, use the option:
<U>
Cancel direction selection
For a quick change of load direction to an opposite one, the user can activate the flag «Reverse direction».
Hydrostatic Pressure
Hydrostatic pressure (or pressure of liquid) is a special case of a non-uniformly distributed load Pressure. An
example of such load is the liquid pressure exerted on walls of a vessel which changes with height as
p = ρ ⋅ h , where h – is the height of a liquid column of density ρ.
When defining Pressure as a hydrostatic load, it is necessary to specify the liquid density, units, and define
the direction of load.
50
Preparing Finite Element Model for Analysis (Preprocessor)
Direction of Load Change. The load Hydrostatic Pressure acts along the normal to the loaded face. It is
required to specify direction of load change, that is, the direction along which the load is increased.
To specify direction of the load change, it is required to select the local coordinate system. The direction of
load change (increase) will be determined by the direction opposite to the direction of the Z-axis of the
selected coordinate system:
The zero value of the load corresponding to an upper level of liquid coincides in space with the coordinate
Z=0 of local coordinate system determining direction of the load change.
To work with the local coordinate system use the options:
<C>
Select LCS
<K>
Unselect LCS
In a 3D scene, the load Pressure is shown in the following way:
Specifying load «Pressure»
51
T-FLEX Analysis User Manual
Typical sequence of steps for defining the load Pressure:
1.
2.
3.
4.
5.
6.
7.
8.
9.
Initiate command «Pressure»
.
Select face, edge or a sequence of elements.
Select load type: uniform, non-uniform or hydrostatic.
For uniformly distributed load, specify a numeric value.
For non-uniformly distributed load, specify the distribution law.
For hydrostatic pressure specify density of liquid.
Specify units.
Specify direction.
Complete the command.
Centrifugal Force
Rotation represents a loading type used for simulating a centrifugal force which arises upon uniform, or
uniformly accelerated, rotation of an object.
For specifying the load Rotation, use the command:
Keyboard
Textual Menu
<3MR>
Icon
«Analysis|Load|Rotation»
After invoking this command, select one or several solid bodies for applying the load. With the help of
automenu option:
<B>
Select Body
<M>
Select All Solids
select bodies of an analyzed model. They will be added to the list.
Rotation always takes place about a certain axis, thus, it must be specified. As an axis of rotation, you can
use an element of a 3D model (edge, axis of a cylindrical face, etc.), or a specially constructed line (for
example, a 3D path constructed by two 3D nodes), or one of the axes of the local coordinate system.
Direction of an axis of rotation defines the direction of load (according to a right-hand screw rule).
For selecting a rotation axis, use the automenu option:
<A>
Select axis of rotation
To cancel selection of axis of rotation, use the option:
<C>
Cancel axis selection
In the load’s properties window, it is necessary to specify the magnitude of angular velocity and angular
acceleration.
52
Preparing Finite Element Model for Analysis (Preprocessor)
For angular velocity, the following units can be used:
radian per second [rad/sec], degrees per second
[deg/sec], the number of revolutions per second
[Hz], the number of revolutions per minute [rpm].
For angular acceleration, the following units can be
used: radian per second2 [rad/sec2], degrees per
second2 [deg/sec2], the number of revolutions per
second2 [Hz/sec], the number of revolutions per
minute2 [rpm2].
In the 3D scene the load Rotation is shown in the following way:
Specifying rotation
A typical sequence of steps for specifying the load «Rotation»:
1.
2.
3.
4.
Initiate command «Rotation»
.
Specify axis of rotation.
Specify the magnitude and units for angular velocity and angular acceleration in the command’s
properties window.
Complete the command.
Acceleration
Acceleration creates a uniform impact on any body with a mass. This impact is uniformly distributed over
the entire volume of the selected body. Use of this type of loading allows, for example, simulating the load
of the own weight under the force of gravity.
To specify the load Acceleration, use the command:
Keyboard
<3MA>
Textual Menu
Icon
«Analysis|Load|Acceleration»
53
T-FLEX Analysis User Manual
After invoking this command, it is necessary to select the body (or several bodies) for applying the load.
With the help of automenu option:
<B>
Select Body
<M>
Select All Solids
select the bodies of an analyzed model. They will be added to the list.
In the properties window specify:
• Magnitude of load;
• Units: m/sec2, cm/sec2, in/sec2;
• Direction of load.
Direction of load. As a direction of acceleration, the
user can select the element of a 3D model or a
certain radius-vector, specified in the selected by the
user local coordinate system (if the local coordinate
system is not specified, the global coordinate system
will be used by default).
By default, in the local coordinate system the direction of load is set along the X-axis.
To work with the local coordinate system, use the options:
<C>
Select LCS
<K>
Unselect LCS
For specifying direction of load Acceleration with the help of an object of a 3D model, use the following
automenu option:
<D>
Select direction
To cancel direction selection, use the option:
<U>
Cancel direction selection
For a change of load direction to an opposite one, the user can activate the flag «Reverse direction».
For a quick specification of the gravity force, in the properties window there is a button [Gravity
force], which sets the value of acceleration equal to ~9.81 м/с2 and sets the direction of load along the Zaxis of the global coordinate system equal to -1.
In the 3D scene, the load «Acceleration» is shown in the following way:
Specifying load «Acceleration»
54
Preparing Finite Element Model for Analysis (Preprocessor)
A typical sequence of steps to specify the load Acceleration:
1.
2.
3.
4.
Initiate command «Acceleration»
Specify the load magnitude.
Specify the direction of load
Complete the command.
.
Bearing Force
Bearing Force simulates the load occurring under a direct impact of such parts as an axle, a bearing or a
shaft. A cylindrical face is used as the location for applying the load. The applied force is distributed
according to the sinusoidal law (see the diagram).
To specify Bearing load, use the command:
Keyboard
Textual Menu
<3MB>
Icon
«Analysis|Load|Bearing Force»
After invoking this command, it is required to select elements (cylindrical faces) of the model for applying
the load. With the help of automenu option:
<F>
Select cylindrical face
select a cylindrical face of an analyzed model. The selected
element will be added to the list.
In the properties window specify:
• Magnitude of load;
• Units: N; kgf, lbf;
• Direction of load.
Load direction. As a direction of Bearing load, the user can
select the element of a 3D model or coordinate axes of the
global coordinate system.
For specifying the direction of Bearing load with the help of an object of a 3D model, use the automenu
option:
<D>
Select direction
55
T-FLEX Analysis User Manual
To cancel selection of direction, use the option:
<U>
Cancel direction selection
To change a direction of load to an opposite one, the user can activate the flag «Reverse direction».
In the 3D scene «Bearing load» is shown in the following way:
Specifying «Bearing force»
A typical sequence of step for specifying Bearing load:
1.
2.
3.
4.
5.
Initialize the command «Bearing force»
Select a cylindrical face or a set of faces.
Specify the magnitude of load.
Specify the load direction
Complete the command.
.
Torque
Torque is the impact of a force moment of the specified magnitude distributed over the selected face.
To specify Torque, use the command:
Keyboard
Textual Menu
<3MQ>
«Analysis|Load|Torque»
Icon
You can use faces as the location of the load application. To select faces, use the automenu option:
<F>
56
Select Face
Preparing Finite Element Model for Analysis (Preprocessor)
Selected faces are entered in the list.
In the properties window specify:
• The magnitude of load;
• Units: N-m, kgf-cm, lbf-in;
• The axis of torque.
The direction of the torque axis (or axis of rotation) defines
the direction of load (according to a right hand rule). As a
direction of axis of rotation, the user can select an element of
a 3D model (edge, axis of a cylindrical face, etc.), or a
specially constructed line (for example, a 3D path,
constructed by two 3D nodes), or one of the axes of the local
coordinate system.
To select the axis of rotation, use the automenu option:
<A>
Select axis of rotation
To cancel selection of axis rotation, use the option:
<C>
Cancel axis selection
In the 3D scene the load «Torque» is shown in the following way:
Specifying load «Torque»
A typical sequence of steps for specifying the load «Torque»:
1.
2.
3.
4.
5.
Initialize the command «Torque»
Select loaded faces of body
Specify magnitude of load
Specify the axis of moment
Complete the command.
.
Thermal Loads
This type of loading is used in the heat transfer problems.
Heat transfer is the process of transferring the heat from one region with higher temperature to the region
with lower temperature.
57
T-FLEX Analysis User Manual
Temperature
Temperature characterizes a thermal state of a body and determines how warm it is.
The load «Temperature» is used for defining invariant in time constant temperature of elements of the model
in steady state and transient thermal analysis, and also for defining temperature difference in the static
analysis of structure’s strength when solving the thermo-elastic problems.
The load «Initial temperature» is used for defining initial temperature in transient thermal analysis. This
thermal load defines the temperatures of selected elements of the model at time equal to zero.
In the nodes of finite element mesh which do not belong to the selected elements of the model, the
initial temperature will be assigned the «default» value. The default value is defined in the dialog
window «Study’s parameters» on the tab «Parameters».
For specifying the load, use the command:
Keyboard
Textual Menu
<3TT>
«Analysis|Thermal
Load|Temperature»
Icon
Temperature can be applied to a model body, a face, edge or vertex. For selecting elements of the model, use
the automenu option:
<E>
Select Element for loarding
<B>
Select Body
<M>
Select All Solids
Selected elements are added to the list.
In the properties window of the load «Temperature», it is
required to specify the following parameters:
• The magnitude of the load;
• Units: K, C, F.
In the 3D scene the Temperature is shown in the following
way:
Specifying thermal load «Temperature»
58
Specifying initial temperature in transient thermal analysis
Preparing Finite Element Model for Analysis (Preprocessor)
A typical sequence of steps for specifying the thermal load is:
1.
2.
3.
4.
5.
Initialize the command «Temperature»
.
Activate option «Temperature» or «Initial temperature».
Select body, face, edge, vertex or a set of elements
Specify the value of temperature and units.
Complete the command.
Heat Flux
Load Heat flow allows the user to specify the amount of heat transferred across the unit surface area per unit
of time, that is, define a specific heat flow.
For specifying the load, use the command:
Keyboard
Textual Menu
Icon
«Analysis|Thermal Load|Heat
Flow»
<3TF>
Heat flow can be applied to faces of the model. For selecting faces, use the automenu option:
<F>
Select Face
Selected elements are added to the list.
In the properties window of the load «Heat flow» it is required
to specify the following parameters:
• The load magnitude;
• Units: W/m2, W/cm2, BTU/s*in2.
Negative value of the heat flow signifies that through the
specified face the body looses the energy.
In the 3D scene Heat flow is shown in the following way:
Specifying thermal load «Heat flow»
A typical sequence of steps for specifying «Heat flow»:
1.
2.
3.
Initialize the command «Heat flow»
Select a face;
Specify the magnitude of load;
;
59
T-FLEX Analysis User Manual
4.
5.
Specify units;
Complete the command.
Heat Power
Load Heat power allows the user to define:
• volume power of thermal energy sources;
• amount of heat transferred through an arbitrary surface per unit of time, called a power of heat flow
(heat power).
For specifying the load, use the command:
Keyboard
Textual Menu
Icon
«Analysis|Thermal Load|Thermal
Power»
<3TP>
Heat power can be applied to a body, face, edge or a vertex of a model. For selecting elements of model use
the automenu option:
<E>
Select Element for loarding
<B>
Select Body
<M>
Select All Solids
Selected elements are added to the list.
In the properties window specify:
• Magnitude of load;
• Units: W, BTU/sec.
The negative value of this thermal load signifies that a body
looses the energy.
In the 3D scene Heat power is shown in the following way:
Specifying thermal load «Heat power»
A typical sequence of steps for specifying the load «Heat power»:
1.
60
Initialize the command «Heat power»
Preparing Finite Element Model for Analysis (Preprocessor)
2.
3.
4.
5.
Select body, face, edge, or a vertex.
Specify the magnitude of load;
Specify the units
Complete the command.
Convection
Convective heat transfer is a process of transferring the heat between the surface of a solid body and
external environment (gas, liquid).
Load Convection allows the user to specify the amount of heat emitted by the unit surface per unit of time
when the temperature difference between the surface and external environment is one degree, that is, specify
the heat transfer coefficient.
For specifying load Convection use the command:
Keyboard
Textual Menu
Icon
«Analysis|Thermal
Load|Convection»
<3TC>
Load Convection is defined for faces of the model. For selecting faces use the automenu option:
<F>
Select Face
Selected elements are added to the list.
In the properties window of the load Convection it is
necessary to specify the following parameters:
• heat transfer coefficient;
• Units: W/m2*C, W/cm2*C, BTU/sec*in2*F;
• Temperature of external environment (liquid or
gas);
• Units: Kelvin [K], degrees of Celsius [C], degrees
of Fahrenheit [F].
In the 3D scene the load «Convection» is shown in the following way:
Specifying thermal load «Convection»
61
T-FLEX Analysis User Manual
A typical sequence for specifying the load Convective heat transfer:
1.
2.
3.
4.
Initialize the command «Convection»
.
Select a face.
Specify the heat transfer coefficient and temperature of environment.
Complete the command.
Radiation
Heated bodies emit the energy in the form of vibrations of electromagnetic field into the environment.
Thermal radiation hitting a certain body is partially reflected, partially absorbed, and, also, partially passes
through a body.
For specifying Radiation use command:
Textual Menu
Keyboard
Icon
«Analysis|Thermal
Load|Radiation»
<3TR>
Load Radiation is defined for faces of the model. For selecting faces use the automenu option:
<E>
Select Element for loarding
Selected elements are added to the list.
In the properties window of the load Radiation it is
required to specify the following parameters:
• Radiation type: radiation into space;
• Emissivity;
• Temperature of environment;
• Units: Kelvin [K], degrees of Celsius [C],
degrees of Fahrenheit [F].
• Radiation viewfactor for a face.
In the 3D scene the load «Radiation» is shown in the following way:
Specifying thermal load «Radiation»
62
Preparing Finite Element Model for Analysis (Preprocessor)
A typical sequence for specifying the load Radiation:
1.
2.
3.
4.
5.
6.
.
Initialize the command «Radiation»
Specify radiation type.
Specify emissivity.
Specify temperature of environment and units.
Specify radiation viewfactor of a face.
Complete the command.
Loads Compendium Table
Load type
Application
location
Concentrated
force
Vertex
Uniformly
distributed
Force
Non-uniformly
distributed force
Face, edge
Bending
moments
Vertex, face, edge
Uniform
pressure
Face, edge
Non-uniform
pressure
Face
Hydrostatic
pressure
Face
Centrifugal
Force
Acceleration
Body
Bearing force
Cylindrical face
Torque
Face
Face
Body
Related objects
Input parameters
Objects selected for defining
direction,
local
coordinate
system.
Objects selected for defining
direction,
local
coordinate
system, normal to selected face
Objects selected for defining
direction,
local
coordinate
system, normal to selected face
Local coordinate system
Unit system, force amount
Objects selected for defining
direction,
local
coordinate
system; normal to selected face
Objects selected for defining
direction,
local
coordinate
system; normal to selected face
Local coordinate system
Unit system, pressure amount
Objects selected for defining
axis, local coordinate system
Objects selected for defining
direction,
local
coordinate
system.
Objects selected for defining
direction,
local
coordinate
system
Objects selected for defining
axis, local coordinate system
Angular velocity and angular
acceleration values, unit system
Unit system, acceleration amount
Unit system, force amount
Unit
system,
distribution law
force
amount,
Unit system, magnitude of bending
moments
Unit system; pressure distribution
law
Fluid density; unit system
Unit system, force amount
Unit system, moment amount
63
T-FLEX Analysis User Manual
Convection
Body, face, edge, vertex
Face
Body, face, edge, vertex
Face
-
Radiation
Face
Temperature
Heat Flux
Heat Power
Editing Loads and Restraints
To modify specified loads and restraints, use the «Edit» command,
a study element in
available in the context menu on right clicking
the studies window or in the “3D Model” window.
Further user actions of modifying loads or restraints are little
different from the process of their creation. In the properties
window, you can modify numerical parameters, while the
appropriate automenu options (see above) let you cancel selection
and then specify new defining model elements.
Upon finishing entering changes, confirm your actions by clicking
.
64
Magnitude of load, units
Magnitude of load, units
Unit system, Heat Power
Heat
transfer
coefficient,
temperature of environment, units
Radiation
type,
emissivity,
temperature of environment, units,
radiation viewfactor of a face
Preparing Finite Element Model for Analysis (Preprocessor)
Customization and Utility Commands
The user can define global settings of the T-FLEX Analysis system by the «Analysis|Settings…»
command.
The following parameters are defined on the [Processor] tab:
Temporary directory – sets the path to the folder storing
intermediate working data when solving systems of
equations. By default, working files are stored in the folder
defined by the Windows system variable “TEMP” (or
“TMP”) If necessary, the user can redefine this path.
«System Resource» group defines the following
parameters:
Solver thread priority – allows the user to define the
system priority of the modules responsible for solving
systems of equations. The Windows operating system will
distribute system resources in accordance to the specified
priority, giving preference to a higher priority. For
example, if planning on prolonged solving of a large study
using hard drive memory, the user can specify in advance a
priority below Normal, which would allow the user to
simultaneously work in other Windows applications
without much restriction.
RAM limit – allows the user to specify the size of RAM, upon exceeding which the system would start
using hard drive memory for solving equations that usually takes considerably more time.
Display study properties dialog box before solving – when enabled, this control turns on automatic
launching of the study properties dialog box at initializing the “Analysis|Solve” command for all studies
(the default setting).
65
T-FLEX Analysis User Manual
Close solver window on completion - this control enables
the mode of automatic hiding the information window
displaying the process of solving systems of equations in all
studies. By default, this mode is not set.
On the [Postprocessor] tab, the user can define global
settings for viewing the results, which would affect all
studies.
Main font – sets the default font for the textual information
output in the visualizer window of the Postprocessor (study
name, result type, etc.).
Scale font – sets the font of displaying numerical values on
the color scale.
«Value tooltip» control enables the mode, in which a tooltip
pops up with the interpolated result value corresponding to
the location on the model in the Postprocessor window,
aimed at by the mouse pointer.
«Delay» control allows specifying a time interval, after
which the tooltip pops up.
In the group «Simplifications» the user can specify the limit number of finite elements beyond which in the
Post-processor window the calculation results are shown only for corner nodes of quadratic finite elements
and omitted for the mid-side nodes (this does not affect extreme values). This mode allows the user to
significantly expedite dowloading of results into the Postprocessor window for very large meshes (more than
1000000 elements).
Options «Show window automatically», «Hide window automatically» in groups «Deformed state
control window» and «Time process control window» allow us to control the view of floating panels
«Deformed state» and «Time process», respectively.
On the tab [Document] it is possible to activate the option of
saving the calculation results in a separate external file. By
default, the calculation results are saved in a main file of TFLEX (extension .grb). When activating the external saving
of results, the file with the name «Document name_Study
name» (with extension .tfa) is created in the folder of the
original document.
This option can be useful for solving problems with large amount
of results, and also can speed up saving of the document
(depends on the operating system).
Working with the 3D Window when Preparing Study Elements
As you work with studies, various study elements can be displayed in the 3D scene – loads, restraints, mesh.
Special commands are provided for handling those displays.
Keyboard
Textual Menu
«Analysis|Show Loads/Restraints»
66
Icon
Preparing Finite Element Model for Analysis (Preprocessor)
With this command, you can enable or disable the mode of displaying all
loads and restraints in the 3D scene. This command is available in the
context menu upon selecting a study.
A generated surface or volume mesh can be displayed in the 3D window.
A surface mesh is automatically displayed after finishing the generation
process. When the mesh is displayed, the model is not shown. If you need
to work with the model (for example, to define a restraint on a model's
face), the system automatically hides the mesh. To view the mesh again,
one can use the «Show Mesh» command. This command is available in
the context menu upon selecting the “Mesh” element in the studies
window. This menu also contains commands for switching between the
surface and volume mesh views. The commands are «Volume Mesh» and
«Surface Mesh».
Specifics of Working with a Parametric Model
A T-FLEX CAD model is usually a parametric one. You can get full advantage of a parametric model in an
analysis. All study elements (loads, restraints, mesh) related to the model can be automatically recalculated
as a result of parametric modifications of the three-dimensional model, and you will not have to define them
anew. It could be sometimes more convenient to manually update certain study elements that require
significant computational resources (for example, meshes). To update any element of the study, you will
need to select the command «Update» in the context menu invoked by pressing
on an element of the
study.
If a parent element disappears (for example, a face with a force applied to it), then you may need to manually
edit this study element to account for changes in the model.
After updating this study data, you will have to run calculations again to get up-to-date results.
Export
Prepared initial data of each study can be exported in the Nastran (*.dat) format. To export an active study,
use the command:
Keyboard
Textual Menu
Icon
«Analysis|Export»
Also, this command is accessible via the context menu upon selecting the study
or in the window «3D model».
in the window «Studies»
After calling the command, the standard file-saving dialog appears.Next,
you need to specify a combination of two properties of the format:
Short/Long − defines the precision of the output parameters (the maximum
number of digits in decimal positions, including the decimal point): short up to 8 decimal digits, long - up to 16 decimal digits.
Fixing/Arbitrary − defines the type of export data: fixed - data are output
by columns of a fixed size, arbitrary - data are output separated by commas.
67
T-FLEX Analysis User Manual
P RO CE S S IN G R E S U LT S (P O S T P RO C E S S O R )
T-FLEX Analysis Postprocessor serves for comprehensive examination of finite element modeling results. A
special feature of the T-FLEX Analysis postprocessor is its deep integration with T-FLEX CAD. Calculation
results are displayed in a separate window, which is in many aspects of view management is similar to a TFLEX CAD 3D modeling window. Color-coding of the calculated model can show all results. There is also a
tool for sampling exact values at any specific location on the model. When displaying results, the model can
be shown in a scalable deformed state. When a special «animation» feature is enabled, one can dynamically
view the pattern of changes in deformations from zero to the specified values.
General Principles of Working with Results
The list of finite element calculation results available for viewing is displayed in the studies tree, in the
«Results» folder. The list of results to be displayed in the studies tree is set up using the «Results...»
on the name of the selected study. This command calls the dialog for
command of the context menu by
setting up the results to be displayed in the tree.
Invoking command «Customize results…»
Dialog for customizing the results list
There are several ways to access results for viewing:
68
1.
Double-clicking
selected result.
2.
Accessing the context menu by the right clicking
on the result selected in the studies tree and using
the command «Open» or «Open in new window». T-FLEX Analysis Postprocessor supports use of
multiple windows. Several windows with different results can be opened simultaneously, as well as
several windows with the same result.
on the result's name in the studies tree opens the Postprocessor window with the
Processing Results (Postprocessor)
Context menu to open result
To delete a result from the studies tree, use the «Remove from tree» command of the context menu
on the selected result in the studies tree. The result will no longer be
accessible by right clicking
displayed in the studies tree; you can, however, still add it back to the tree, using the above-mentioned
command «Results...».
You do not need to rerun study calculations when adding/deleting results in the list.
To actually delete all results (thus making the study «unsolved»), use the command «Clear Study»,
accessible for the active study from the main menu or command «Clear», accessible from the context menu
on the name of the selected study in the studies tree.
by right clicking
Invoking command for deleting all calculation results
Results of a study's calculation and meshes can be stored together with the model in a *.grb file. The user
shall be aware, however, that storing those data increases the file size considerably. If you need to achieve a
minimum file size, we recommend clearing calculation results in all studies before saving the mesh. In this
way, the boundary conditions are left unaffected. Upon the next opening, you would have to create the mesh
again and run calculations.
69
T-FLEX Analysis User Manual
Settings and Service Commands of Calculation Results Window
Customizing Calculation Results Window
The viewer's settings are accessed by double-clicking
menu.
in the results viewer window or from the context
Dialog for customizing parameters of calculation results window
Parameters dialog of the calculation results window has three groups of settings.
The «Viewing Results» group provides the following controls:
Coloring. This flag toggles the mode of colored rendering of the calculated model. Coloring is done
according to the properties of calculation results and settings of the color scale. A color filling some area in
the model corresponds to a certain numerical value. Color scale setup is done in a separate dialog (see
below).
Only on surface. Enables the mode of showing the mesh on the surface only. When the flag is off, the entire
volume mesh is displayed.
Deformed state. This flag controls the way of rendering the resulting finite element model: it can be shown
either in the deformed state, or as the original.
Scale. Sets the scale of deformations for the calculated model. It can be defined in terms of a relative or
absolute value.
Initially, the scale is picked up by the system automatically, but the user can change it as desired.
Animation. This flag turns on the animation mode of the postprocessor window, in which the deformation
values smoothly vary from zero to the calculated value. To control animation and the deformed state
rendering, one can also use a floating bar, that can be accessed from the context menu in the postprocessor
window (the command «Strain state window» or «Time process window», depending on the type of the
result).
70
Processing Results (Postprocessor)
Use of the floating bar for controlling deformed state display and animation
Frequency. This parameter sets the rate, at which the full animation cycle completes. The number stands for
the fraction of a minute, in which the full animation cycle completes.
Variable coloring. Controls color variance during animation. Changes in colors can be synchronized with
changes of the deformed state – from zero to final values. When showing negative deformations, the colors
are not inverted.
Negative values. This option enables the mode, in which the results displayed during animation first reach
zero, and then go to the values equal to the calculated ones, but with the opposite sign. This creates the
«vibration» effect of the calculated model, as if the load were periodically changing its sign to the opposite.
«Solids» lets you manage the bodies in the Postprocessor window, which are part of the assembly model,
when evaluating assemblies. The user can tune of the flags corresponding to one or many parts of the
assembly, after which those will no longer be displayed in the postprocessor window. By using the Opacity
control, you can also manage transparency of the assembly parts displayed in the calculation results window.
These tools help visualize the result fields inside the assembly model, by temporarily hiding obstructing
objects.
«Display» group of parameters provides control elements, which define the visibility of auxiliary images
around the calculated model for better results interpretation.
Mesh. Controls visibility of the mesh facets in the calculation results window.
Loads/Restraints. Controls visibility of all boundary conditions employed in the current study. The list of
boundary condition types is displayed in a separate window. Visibility of each element in this list can be
controlled individually. At the right of the window, there are buttons for managing the list elements. Using
those buttons, you can enable (+), disable (-) or invert (+/-) visibility of all boundary conditions.
Model Contour. By enabling this flag, you make the contours of the original body subjected to the
calculation appear as dotted lines in the calculation results window. This capability can be helpful for
comparing the deformed state of the model with the original.
71
T-FLEX Analysis User Manual
Contours of all bodies. Upon enabling this flag, the rest of the bodies in the 3D scene, that were not subject
to the calculations, are also displayed in dotted lines in the calculation results window.
«Information Bar» group of parameters contains controls for adjusting the amount of displayed textual and
graphic information:
Coloring Scale. This flag enables visibility of the color scale for more intuitive interpretation of the
calculation results. The scale range and colors can be customized (see «Color scale setup» below). The scale
is displayed in the left of the calculation results window.
Study Name. This flag enables the display of the current study name in the calculation results window.
Result Type. This flag enables the display of calculation type name.
The "Number Format" group provides the following controls:
Units. Serves to define the measurement units (meter, inch, millimeter) to be used for displaying the result.
Format of values parameter sets the format of the scale
numbers for the viewing convenience - it can be decimal,
exponential or general (mixed). The general format
represents values up to the 1000 in the decimal format,
those greater than 1000 - in the exponential format. The
number of significant digits for the exponential format and
the number of decimal digits for the decimal format are set
in the provided field at the right. "Extra" zeros can be
automatically discarded by disabling the flag "show
trailing zeros".
Color Scale Setup
The color scale settings dialog can be accessed from the parameters window of the calculation results (the
button [Settings]), or from the context menu, accessible in the calculation results window by
clicking .
Perform color scale settings in order to associate the desired colors with the obtained values. The system
does the initial setup automatically. It evenly distributes the standard palette (spectrum) of five colors
between the maximum and the minimum values obtained in the current calculation.
«Range» group of parameters sets parameters of distributing numerical values over the color scale.
Linear/Logarithmic. The logarithmic scale is used by default for displaying the "Factor of safety" result.
This is done in order to get a more detailed color picture in the most important subrange – where the factor's
values are near 1. The user can also switch the display mode to the linear scale for this result. For other
results, the linear scale is always used.
72
Processing Results (Postprocessor)
Scale options setup dialog
Maximum. This interface item serves to set the correspondence between the maximum value and the
topmost color on the scale. By default, the maximum value is set, but the user can enter one's own value of
interest in the respective field.
Minimum. This allows defining the correspondence between the minimum value and the bottommost color
on the scale. Otherwise, this interface item is analogous to the previous one.
Absolute value. Enables the viewing mode of rendering absolute values in the nodes (disregarding the sign).
This is an auxiliary mode. It can be used for analyzing results in the case when you are interested in the
magnitudes of values of displacement components or other measures.
Input of the maximum and minimum values can be used for a custom setup of results rendering. For
example, to display the «Factor of safety» result, you can limit the maximum value of the safety factor, in
order to achieve a more intuitive result picture in the postprocessor window.
«Color spectrum» group of parameters allows adjusting the number of colors in the color scale.
Scheme. There are seven predefined settings and one custom.
Standard. This option displays the scale of five main colors.
Gray-scale. This option enables a grayscale display.
Full spectrum. When using this option, the scale appears as a rainbow of seven main colors.
Besides that, there are the following color schemes: Maximum, Minimum, Threshold, Range.
73
T-FLEX Analysis User Manual
Custom. You can manually set up the color scale, and then save your choice into a
special file for future quick loading (a file with the extension *.col). The setup is
performed in the right hand side part of the dialog, where the color image of the scale is
displayed. On the right of the scale, there are several triangular tags marking places for
fixed colors on the scale. Using those tags, you can set a new place for a color on the
scale. To move a tag, depress the
on it and while holding down the button, drag. To
create a new tag with a new color, perform
at the right of the scale. A standard
Windows dialog for defining color will appear. To delete a tag, drag it beyond the color
scale. To change the color assigned to the respective tag, double-click
. To access
on
this scale settings, you can also use the context menu accessible by right-clicking
the color scale image.
Gradient. This flag (enabled by default) serves to set smooth transition from one color to another in the
color scale.
Invert. Serves to invert the color scale.
The "Legend" group provides the following controls:
Reverse. This flag reverses the values scale. This mode is used by default when displaying the "Factor of
safety" result in the static analysis. This is convenient for displaying critical values that are close to 1, in Red.
Show Marks. When this flag is enabled, the marks with numerical values will be displayed on the color
scale in the results window.
Number of Marks. Sets the number of displayed marks.
Display Zero Mark. Serves to enable the display of the zero value mark on the color scale.
Always Show Maximum Value. When this flag is enabled, the maximum value string is displayed in the
calculation results window.
Always Show Minimum Value. When this flag is enabled, the minimum value string is displayed in the
calculation results window.
74
Processing Results (Postprocessor)
Setting the range of scale values for displaying results
Use of Sensors for Analysis of Results
In the T-FLEX Analysis there is a possibility to probe the results of finite element analysis in a certain point
specified by the user with the help of sensors.
Sensors can be created only for active problem of the finite element or dynamic analysis with the help of the
command:
Keyboard
Textual menu
<3MD>
Icon
«Analysis|Sensor»
In the properties window the sensor type is defined as a FEA point since the sensor is used for the problem of
the finite element analysis.
For specifying a point, where the sensor will be created, use the automenu option:
<V>
Select point
This point can be a vertex on a profile/path, vertex on a body, center of a curve/edge, middle point of an
edge, center of a sphere/torus or a 3D node.
In the parameters dialog of the sensor there is a set of entry fields («Operation», «Element», «Second
operation», «Second element»), into which the names of the objects selected by the user are put.
75
T-FLEX Analysis User Manual
Steps of sensor creation
Sensor is designed for extracting results of calculation of a finite element analysis problem in a specified by
the user point. To do that, first, the user has to solve the finite element analysis problem (even if the problem
has already been solved), and then from the context menu, invoked on selecting «Sensor» with a right mouse
button in the window «Studies», call the command «Measure».
From the appeared properties dialog, in the Table «Property», the user can select the desired type of result
and view its value. Clarification for the keywords located in the first column of the table is given in the field
«Definition» below the table.
Selected value can be saved with the help of the option «Variable». To do that, select the option «Create» in
the group «Variable», specify the name of the variable and press the button [Apply].
Sensors are also used for extracting control data when solving optimization problems using the results of the
finite element calculations.
Generating Reports
The user can create electronic documents containing basic information about a calculated study, which are
independent of T-FLEX Analysis. Reports are generated in the html format, so that viewing them is possible
in any browser, for example, MS Internet Explorer or MS Word. To create a report of the active study, use
the command «Analysis|Report…».
The report settings dialog can also be accessed from the context menu by right clicking
the selected study, via the command «Report…».
76
on the name of
Processing Results (Postprocessor)
A report contains basic information about the model,
materials, and the computational finite element mesh, as
well as colored result diagrams, which are displayed in the
studies tree or opened in the calculation results view
windows at the moment.
Let's review the main controls of the report generation
dialog.
«General» group contains information on the name of the
study, for which the report is being generated («Title»),
information about the report creator («Author» - by default,
the information is accessed from the document properties),
and company information, which is also accessed from the
document properties by default.
«Diagram list» control lets the user check-mark the result
types, whose graphical images will be added to the
generated report.
A button [Parameters] is provided next to the list of
diagrams, which you can use for calling the dialog for
defining diagram display parameters. Here you can specify
the picture size in pixels, and the background color. You can
also enable creation of preview and set up its image. In this
way, the main report document would include reduced-size
images of result diagrams, with the full-size images being
accessible by clicking
on the small image, when viewing
the report file, for example, in the Internet Explorer.
The flag “Save 3D Model” will also create, in addition to
the pictures, three-dimensional models of results in the
format vrml with color rendering and boundary conditions.
In the report, next to the picture, there will be available the
link to the vrml model of the corresponding result. Note that
for viewing vrml-model via the Internet Explorer, it is necessary to use independent plugin, displaying vrmlmodel (for example, Cortona Vrml Client, http://www.cortona3d.com or another analog).
«Use image from opened results» allows adding to the report the currently opened diagrams in their current
orientation, the way they appear in the calculation results window. If there are no open result windows, or the
control is not active, then the diagrams are added to the report in the default orientation («axonometric
front»).
Report template – specifies the path to the html document with the report template. Clicking the button
allows selecting another report template.
Clicking the button [Create] brings up the dialog for saving the report file. By default, the report is saved
in the current folder of the model file and uses the name in the format «model file name-study name».html.
When generating a report, a folder with the same name is created to store the files of graphic result images in
the .bmp format. Keep in mind this fact when porting a report to another work seat or when passing to a third
party.
77
T-FLEX Analysis User Manual
Report Templates
As we mentioned, study reports are generated using templates. A template is a common html document. The
template that is installed with the system has the name TFA_common.html and is located by default in the
program folder of the T-FLEX CAD installation. The contents of a template can be edited in a textual or
html editor. A user familiar with html programming can make changes to the standard template, or create
one's own template based on it, and then use the new template for generating reports on studies. The idea of
generating a report by template is simple. The reports generator looks through the template text and analyzes
its contents. The template contains special fields using reserved notations (so-called «tags»); such tags are
replaced by the respective values of properties of a study, for which the report is being generated. Table 1
lists the tags and their values used in the report template.
List of Tags for Generating Reports
Table 1
Tag
78
Tag value
$(TaskName)
Study title
$(TaskComment)
Comments to the study defined in the study properties dialog
$(TaskType)
Study type
$(TaskAuthor)
Author
$(TaskCompany)
Organization
$(Date)
Date and time of generating the report
$(File)
The name and path to the model file
$(SolidName)
The name of the operation, for which the study was created
$(MaterialNumber)
Material ID number
$(MaterialElasticity)
Elasticity (Young's) Modulus
$(MaterialPuasson)
Poisson's Ratio
$(MaterialDensity)
Density
$(MaterialThermalCond)
Thermal Conductivity
$(MaterialExpansion)
Thermal Expansion Modulus
$(MaterialStress)
Allowable Stress
$(MaterialSpecificHeat)
Specific Heat
$(MeshName)
Mesh ID
$(MeshType)
Element type
$(MeshNodesNum)
Number of nodes
$(MeshElementsNum)
Number of elements
$(ConditionName)
Name (ID) of the boundary condition
$(ConditionParent)
The model element, for which the boundary condition was created
Processing Results (Postprocessor)
$(ConditionParameters)
The boundary condition value (load, temperature, etc.)
$(HTML_TR.Result)
Results
$(ResultName)
Name of the result
../../../$(ResultBitmap)
Link to the result image
Example of Interpreting a Result
In this paragraph, we will provide an example of detailed result interpretation for a specific structural study,
and then take all necessary measures to fix the model's flaws.
The original model is a mounting part, whose drawing is shown below. The mounting is loaded with the
force of 3500 kilograms, evenly distributed over the horizontal plate. The model material is steel. There are
two restraints: a full restraint at the bottom hole, and a partial restraint with the ban on longitudinal axial
displacements – for the vertical plate.
The main criterion for assessing the structural strength is the Factor of safety (FS), as we mentioned earlier.
The minimum FS value for this part should be no less than 1.5. After getting first results, one can see the
general picture of the factor distribution, shown on the color diagram at the right.
In this case, we are interested in the zones, in which the FS approaches critical values. We can scan the
model using the mouse and pointing it at the places of interest, getting the result in the pop-up tooltip.
However, for better visual representation of such zones, let's set up the color scheme as shown on the next
figure.
79
T-FLEX Analysis User Manual
We specify the range of values of interest from 1.5 to 3. For convenience, we will correct color assignments.
Anything greater than 3 will be displayed White – we are not interested in those zones for the time being.
The critical zones with the value below 1.5 will be Red. The rest of the values in the range will be assigned a
color according to the color scale settings.
In this way of displaying the result, one can instantly notice the places of the model that require fortification.
We also see from the scale, that the minimum FS value is 0.6, which is not admissible.
We then proceed with fixing model flaws. First of all, let's strengthen the pillars by increasing the crosssection area, and the area of the vertical and horizontal plates connection. Also, when analyzing the general
picture of factor of safety distribution, one can discover zones of excessive strength. This allows saving
material. Thus, it is possible to reduce the thickness of the vertical plate and eliminate rigidity ribs on it. The
new mounting drawing is shown below.
80
Processing Results (Postprocessor)
After updating the mesh and running calculations
the second time, we can see that the factor of safety
no longer reaches critical values in the
«problematic» zones.
To state the final conclusion about the strength of
the mounting, we must run the buckling analysis of
the part. Such an analysis indicates that the critical
safety factor for the mode 1 and this type of loading
is 79, which means a sufficient margin of structural
strength against buckling.
81
T-FLEX Analysis User Manual
S TAT IC A NALYS I S
The main goal of the static strength analysis of structures is evaluation of a stress state of a structure
subjected to constant in time (static) forces. This evaluation of the stress state is usually performed with the
purpose of probing the adopted design features against the strength criterion. The strength criterion is
generally formulated as follows:
The stress σ developing in a structure under applied external forces must be less than the safe stress [σ ]
for the given structural material after applying the strain margin of safety factor Ksafe.
σ ⋅ K safe ≤ [σ ]
The static analysis module of the T-FLEX Analysis Finite Element modeling system serves for calculating a
static stress state of three-dimensional structures in T-FLEX CAD environment. The static analysis module
works directly with three-dimensional T-FLEX CAD models and and does not require additional
constructions for solving a particular three-dimensional model.
The main results of a static solution
are:
• structure's displacements field at
the calculation points of the finite
element mesh;
• relative strain field;
• stress components field;
• strain energy;
• node response;
• the field of the strain safety factor
distribution over the volume of
the structure.
This data is normally enough for
predicting the structure behavior and
making decisions for optimizing
geometrical shape of a part with the
goal of insuring the main strength
criteria of parts.
82
Static Analysis
Details of Static Analysis Steps
Static Analysis of a model is performed in several stages.
Listed are the elements required for conducting an
analysis. To run a static analysis, complete the following
steps:
Step 1. Creating three-dimensional solid model of a part.
Before starting working in T-FLEX Analysis system, the
user shall prepare a three-dimensional solid model to be
evaluated. A solid model can be built in T-FLEX CAD
environment or imported from other systems. Static
analysis can be performed over one or multiple
operations-bodies.
Step 2. Creating “Study”. A “Study” is created by the
command:
Textual Menu
Keyboard
<3MN>
Icon
"Analysis|New Study|FEA
Study"
To perform a static analysis, when creating a study, the
user specifies its type - "Static Analysis" in the
command's properties window. If there are multiple
bodies in the scene, then you need to select one or several
contacting bodies, for which a new study will be created.
Step 3. Defining material. One of the required elements of
any solution is the study's material. Detailed description
of material defining methods for calculations is provided
in the respective section of the preprocessor description.
Step 4. Creating mesh. To perform Finite Element modeling, you need to construct a finite element mesh. By
default, the mesh construction command initiates automatically when creating a study. The user can also
create a mesh using the T-FLEX Analysis command "Analysis|Mesh". When creating a mesh, the user
defines various parameters of discretizing a solid-state model. The finite element mesh can significantly
influence the quality of the obtained solution in the cases of complex spatial configuration of parts. The finite
element mesh generation parameters are reviewed in detail in the respective section of T-FLEX Analysis
preprocessor description.
Step 5. Applying boundary conditions. In static analysis, boundary conditions are represented by restraining
methods and external loads applied to the system. The boundary conditions creating stage is very important
and requires good understanding by the engineer of the essence of the study being solved. Therefore, think
over the physical aspects of the study thoroughly before applying boundary conditions.
Defining restraints is a necessary condition for running a correct static analysis. The combined limitation on
the body movement must satisfy the following condition:
To be suited for a static analysis, a model should have restraints preventing free movement in the space as a
solid body. Failing to meet this condition will cause incorrect results of Finite Element analysis or abortion
of computations.
83
T-FLEX Analysis User Manual
Two commands are provided in T-FLEX Analysis for defining restraints: "Full Restraint" and "Partial
Restraint". The "Full Restraint" command sets a fully fixed (immovable) state for the selected model
element. The "Partial Restraint" command allows selectively limiting model element motion along the
axes of the chosen coordinate system.
The “Partial Restraint” command also provides another useful functionality. The user can specify known
displacements for the structure, such as a known in advance strain in the structure. For this, specify the value
of fixed displacement of a model element along some of the coordinate axes in the “Partial Restraint”
command's properties window. Static Analysis will be performed with this condition accounted for. Note
that a static solution is possible in this case without applying additional (force) loads. In this way, one can
evaluate the stress developing in a strained structure when the quantitative values of the strain
(displacements) are known.
Example of using known displacements
A number of specialized commands is provided in T-FLEX Analysis to define loads; those allow defining
main types of loads ("Force", "Pressure", "Centrifugal Force", "Acceleration", "Bearing Force",
"Moment"). Detailed description of all types of loads is provided in the preprocessor description.
Note yet another functional capability of a static solution in T-FLEX Analysis. The user can define a
structure's stress state analysis not only under various forces, but also under thermal loads - the
“Thermoelasticity” Study. As known, structural materials develop linear strain under the thermal impact expand under heating and shrink under cooling. Changes in a body's dimensions cause strain and a stressed
state. T-FLEX Analysis accounts for changing temperatures. To define temperatures when accounting for
transient temperature fields, use the command:
Keyboard
<3TT>
Textual Menu
Icon
«Analysis|Thermal
Load|Temperature»
At the same time, you need to enable the “Consider Thermoeffects” option on the
[Thermoelasticity] tab of the static study parameters dialog in order to account for thermal loads in
the static solution. You will also need to define the temperature of "zero" strain, which corresponds to the nostress state of the model, and to define the working temperature field (details are in the section "Settings of
Linear Statics Processor").
84
Static Analysis
Step 6. Running calculations. Once a finite element mesh is built for the model and boundary conditions are
applied (restraints and loads), you can start the process or creating and solving linear algebraic equations of
the static analysis. Use the following command to start solving the active study:
Keyboard
<3MY>
Textual Menu
Icon
«Analysis|Solve»
The selected study's calculation can be started from the context menu by clicking
on the name of the
selected study in the studies tree.
By default, the “Study parameters” dialog of the static analysis opens automatically before calculations. In
this dialog, the user can define the desired options and settings of the solution, as well as specify the types of
solution data displayable in the studies tree. Detailed description of study settings purpose is further available
in the section “Settings of Linear Statics Processor”. Most of the settings are selected by the processor
automatically depending on the number of dimensions in the study being solved and imposed boundary
conditions.
Clicking the [OK] button in the study parameters dialog
launches the process of building and solving systems of
linear algebraic equations. The stages of solving
equations and additional reference information are
displayed in a special information pane. Clicking the
[Close] button in the information pane terminates
calculations.
The “Close this dialog box on solving complection”
flag will force automatic closing of the solution steps
monitoring window after finishing solving equations.
The flag «Save Document on solving completion» will
force automatic saving of calculation results and all
changed data in the active document.
The following reference data is output in the information
window:
Nodes - the number of nodes in the computational finite
element mesh.
Elements - the number of tetrahedras in the finite element mesh.
Arguments - the number of equations of linear statics.
Calculation Type - the algorithm used for solving equations. Types of possible algorithms and their use are
described in the section “Settings of Linear Statics Processor”.
Solution Found – tells that system of equations was successfully calculated. There is also auxiliary
information in the brackets: iter – number of executed iteration (if iterative method was used), tol –
miscalculation of result after calculation.
The calculation steps are also visually displayed as a dynamically updating scale. Additionally, the time
elapsed from the start of calculations is shown. After finishing calculations, the user must close the auxiliary
window (unless the auto close option is enabled).
Step 7. Analysis of static solution results. After completing calculations, a new "Results" folder appears in the
studies tree. By default, this one displays the results defined on the "Results" tab of the "Study parameters"
dialog. Overall, the user can access 38 solutions in the result of the static analysis, sorted out into 6 groups.
85
T-FLEX Analysis User Manual
"Displacements" group. Includes the following results:
Δ x - Component of displacement vector for a node of the finite element mesh along the OX-axis of the
global coordinate system;
Δ y - Component of displacement vector for a node of the finite element mesh along the OY-axis of the
global coordinate system;
Δ z - Component of displacement vector for a node of the finite element mesh along the OY-axis of the
global coordinate system.
Displacements, absolute value – the absolute value of the nodal displacements of the model, defined for each
node according to the formula: Δ =
xi2 + y i2 + z i2 , where x, y, z - displacement vector components for
the i -th node of the finite element mesh.
Group «Stresses» includes the following results:
σ eq - relative equivalent stresses evaluated from components of the stress tensor according to the
formula: σ eq =
1
2
(σ
− σ y ) + (σ y − σ z ) + (σ z − σ x ) + 6(τ xy2 + τ yz2 + τ xz2 ) ;
2
x
2
2
σ x - normal stress in the direction of the OX-axis of the global coordinate system;
σ y - normal stress in the direction of the OY-axis of the global coordinate system;
σ z - normal stress in the direction of the OZ-axis of the global coordinate system;
τ xy - shear stress acting in the direction of the OY-axis of the global coordinate system on a plane with the
normal vector parallel to the OX-axis;
τ xz
τ yz
shear stress acting in the direction of the OZ-axis of the global coordinate system on a plane with the
normal vector parallel to the OX-axis;
shear stress acting in the direction of the OZ-axis of the global coordinate system on a plane with the
normal vector parallel to the OY-axis;
σ 1 , σ 2 , σ 3 - principal stresses ( σ 1 ≥ σ 2 ≥ σ 3 ).
Stress intensity is defined in the following way:
σ I = max(σ 1 − σ 2 , σ 2 − σ 3 , σ 3 − σ 1 )
86
Static Analysis
Group «Safety factor by stresses» includes the following results:
Safety factor by equivalent stresses represents the ratio of admissible for a given structural material
stresses [σ ] to the equivalent stresses:
K=
[σ ]
σ eq
Safety factor by shear stresses is evaluated as:
Kτ =
σ − σ3
[σ ]
, τ max = 1
2 ⋅ τ max
2
Safety factor by normal stresses is evaluated as:
Kn =
[σ ]
σ1
A material's safe stress is defined in the material properties in the standard T-FLEX CAD library or in the
appropriate field of the study's materials library. The yield limit is accepted as the safe stress for plastic
materials.
Group «Deformation» includes the following results:
ε eq - relative equivalent strains expressed in terms of components of the strain tensor by the formula:
ε eq =
2
2
2
2
2
2
2 3(ε x + ε y + ε z ) 3(γ xy + γ yz + γ xz )
+
3
2
4
ε x - relative normal strain in the direction of the OX-axis of the global coordinate system
ε y - relative normal strain in the direction of the OY-axis of the global coordinate system
εz
relative normal strain in the direction of the OZ-axis of the global coordinate system
γ xy - shear strain in the OXY plane
γ xz
shear strain in the OXZ plane
γ yz
shear strain in the OYZ plane
ε1 , ε 2 , ε 3 - principal strains ( ε1 ≥ ε 2 ≥ ε 3 ).
Strain Energy Density. The result reflects volume distribution of strain energy over the model.
87
T-FLEX Analysis User Manual
Group «Reactions». The result reflects forces building up in the supporting (fixed) nodes of the finite
element model.
F x - reaction force in the direction of the OX-axis of the global coordinate system
F y - reaction force in the direction of the OY-axis of the global coordinate system
F z - reaction force in the direction of the OZ-axis of the global coordinate system
Reaction force (absolute value) – the magnitude of the absolute value of the nodal reaction forces of the
model defined for a node as Fm i =
Fx2i + Fy2i + Fz2i where F xi - x -component, F y i - y -component,
F z i – z -component of the reaction force for the i -th node of the finite element mesh.
“Total Load” group displays the loads applied to a finite-element model as the effective node responses.
This type of data represents reference information.
Temperature. This result shows distribution of temperature field over the volume of the model.
Algorithm for Static Strength Evaluation Based on Modeling
Once the study calculation is completed successfully, you should analyze obtained results in order to make
conclusions on probabilistic static strength of the structure. In most cases, three types of solution suffice displacements, stresses and the strain safety factor. A typical sequence of steps for validating the results of
Finite Element modeling is as follows:
1.
Displacement Analysis. In the studies tree, use the context menu command "Open" or "Open in
new window" to open the "Displacement, magnitude" solution. We can visually estimate the pattern
and the ranges of the stress-strain state of a structure. It is necessary to analyze displacements in order
to verify correctnes of applied loads and to assert correctness of the found solution as a result of solving
systems of equations. If the results of displacements analysis indicate that a solution to the study is
found and the pattern of the structure's strain state matching the expected, then you can proceed to the
next step.
The diagram of absolute displacements and equivalent stresses
2.
88
Stress Analysis. Open the "Equivalent Stress" result. One can visually assess the pattern of the
calculated equivalent stress. The stress gradients are illustrated by color transitions. The color code
scale displayed in the calculation results view window helps reading the approximate value of the
displayed result. If you point the mouse to the area of interest on the model, then a tooltip will pop up,
Static Analysis
3.
displaying the value of the evaluated measure, interpolated by the nearest nodes around the pointer
location. The "Equivalent stress" result lets the user make the following conclusions:
a) Determine, at what locations and in which elements of the structure the largest stress develops;
b) By comparing the maxima of the calculated stresses with the allowable stress for the model
material, one can assess the degree of the structural strength.
Safety factor estimate. Open the "Factor of safety by equivalent stress" result. This result allows
estimating the quantitative ratio of the safe stress to the calculated equivalent stresses specified in the
material properties. By default, the result is shown on the logarithmic scale in order to reduce the range
of color gradients. If the ratio of the safe and calculated stresses approaches one or becomes less than
that, then the strength criterion no longer holds and, therefore, the design must be altered.
Settings of Linear and Nonlinear Statics Processor
The user-defined study properties are saved together with the document and are inherited upon copying a
study. The main purpose of the study properties is defining options required for the processor, the result
listings to be displayed after completing calculations in the studies tree, as well as keeping the descriptive
attributes of the study, as the name or a comment. The static analysis solution parameters dialog has five
tabs.
The [General] tab serves for defining descriptive
properties of the current study.
In the "Name" field, the user can edit the study name
assigned the system default at creation. This name will
be further on displayed in the studies tree, in the results
window and in the report.
The "Type" control serves for defining the study type.
Note that T-FLEX Analysis allows changing an existing
study type to another one from the list of study types
available to the user. For example, the user can create a
study of the "Static Analysis" type, and then change the
type, for example, to "Stability" or "Frequency
analysis".
The "Comment" edit box lets the user entering
arbitrary text information pertaining to the current study.
This information will be used in the future for
generating a report based on the study solution results.
The [Solve] tab serves for defining processor properties for solving linear statics equations.
89
T-FLEX Analysis User Manual
The control elements in the "Calculation method" group lets the user define the methods of solving
systems of algebraic equations of linear statics:
Direct method. The system of equations is solved by
Gauss method via LU decomposition of the stiffness
matrix. This method is effective for solving the system
of equations constructed on the basis of the linear finite
elements. In certain cases, the use of direct method can
be also justified for analysis of the system with the help
of quadratic finite elements. It can be used instead of
iterative method, if the iterative algorithm does not
converge to the stable solution, or if the convergence
speed is very small (the number of iterations is several
thousands). This situation can be observed for «thin»
problems (the model is flat or stretched), and also, for a
large number of finite elements which are considerably
different from equilateral elements (when the ratio of the
lengths of the finite element edges are on the order of
hundreds or thousands).
Iterated. The systems of equations are solved by iterative methods. This method is used by default for
solving systems of equations, built based on a quadratic finite element. The following two options can be set
for the iterative method: relative tolerance and the maximum number of iterations.
Relative miscalculation - the accuracy of the achieved iterative solution. The smaller is the specified
miscalculation error, the greater number of steps (iterations) will be required.
Maximum number of iterations - the critical number of iterations, after reaching which the iterative
solving of the system of equations terminates, even if the required solution precision was not achieved.
The user can also manage interaction with external (disk) memory of the computer system when solving
SLAE by a direct or iterative method ([Options]). There are three options for using additional disk
memory: automatic, not available, mandatory. The use of additional disk memory allows you to save the
stiffness matrix decomposition. Using additional disk memory for solving systems of equations is necessary
only when the memory requirement for keeping intermediate matrixes exceeds the computer's RAM. Note
also that the running time for studies with a large number of dimensions using external storage could be
significant due to a large number of operations on sequential data read-write.
High volumes of disk storage may be needed for keeping intemediate matrixes (up to several Gigabytes).
Make sure there is enough disk space before solving studies in large dimensions using external storage.
If the user disabled the the possibility of using the disk space while solving a high order system of equations,
an abnormal termination of the process may abort calculations in the event of the memory consumption for
keeping the matrix decomposition approaching 2 Gigabyte (for Windows 32-bit).
Finite-Element Method. By default, all calculations use quadratic approximation for displacements,
regardless of what kind of finite element mesh was constructed for the model. If the user is only interested in
qualitative results, that is, he is only interested in relative distribution of stress fields, using a rather fine
mesh, then one can use the linear element solution, which runs much faster than the quadratic counterpart.
The hybrid element is used for static strength analysis of the models containing both linear plate-like and 3D
volume elements (so called «hybrid» models).
90
Static Analysis
The tetrahedral linear element analysis provides INSUFFICIENT accuracy of quantitative results.
Maximum displacement and stress results are much smaller via the calculation by linear tetrahedral finite
elements, rather than those achieved by more accurate methods. It is strongly recommended to use quadratic
element calculations for quantitative evaluation (the default mode).
The [Thermoelasticity] tab allows defining the
methods for calculating thermal loads.
Consider Thermoeffects. Includes the mode of
calculating loads building up in a structure due to the
linear expansion forces under the condition of heat
applied to the body.
Temperature of zero deformations: - the initial body
temperature, at which there is no thermal strain and there
is no stress caused by difference in temperatures. The user
can specify temperature values in one of the existing
scales: K - Kelvins; C - Celsius; F- Farenheit.
Define the method of specifying thermal loads in the
"Temperature fields" group.
Uniform temperature - the value of a uniform temperature
field is specified in the chosen units, which affects all
studied bodies.
Use preset temperature - thermal loads are included in
the static analysis, that were defined by the command
"Analysis|Thermal Load|Temperature".
Use heat-task results - available solution of the thermal analysis study is used for defining the thermal
loading. In the drop-down list select the name of the solved thermal analysis study and (if necessary) the time
instant, to which the solution pertains. Please note that certain conditions are to be met for using thermal
analysis results as the initial temperature conditions:
1. Identity condition of finite element meshes in static and thermal analyses. The simplest way of
achieving such identity is the use of the "Copy" command available in the context menu. The sequence
of steps can be, for example, as follows:
a) Create a study of the type "Thermal Analysis", generate a mesh, define boundary conditions, and
run;
b) Create a study copy using the "Copy" command;
c) On the tab "General" in the study properties dialog, changed the study type to "Static Analysis".
As a result, we have two studies of different types, but with identical finite element meshes.
2. The "Calculate using linear element" property on the "Solve" tab of the study parameters dialog should
use the same settings in both studies. For example, if the thermal analysis is done by linear elements,
then the static analysis based on thermal analysis results can also be run only by linear elements.
The [Results] tab allows defining the result types displayable in the studies tree after finishing
calculations.
Save solving results in file - enables the mode, in which all analysis results are saved in the file together
with the model. This allows analyzing results of an earlier calculated and saved study without the need for a
91
T-FLEX Analysis User Manual
new calculation. Please note that saving calculation results in a document increases the size of the document
file by approximately 4.5 to 5 Mbyte per a hundred thousand Degrees of Freedom.
The tab [Nonlinear] allows the user to carry out
statical analysis taking into consideration large
displacements.
In practice, there are situations in which displacements of
certain points of the structure reach significant values
under the action of external loads. These problems are
especially important in aircraft and space industry, when
designing radio-telescopes, cooling towers and other thinwalled structures. In these cases the nonlinear effects
should be taken into consideration, since the assumptions
on which the linear analysis is built are not valid.
The option «Account for stiffness change at large
deflections» should be activated in cases when at least
one of the following assumptions of the linear analysis is
violated:
1. Resulting deformations are sufficiently small, so the stiffness changes caused by the load can be ignored;
2. In the process of applying the load, boundary conditions do not change amplitude, direction and
distribution.
For example, the linear analysis of the spiral-like part subject to the load applied at the end edge gives an
error of approximately 30% compared to the nonlinear analysis. This difference in results arises due to small
displacement assumption adopted in linear analysis.
Linear analysis
92
Nonlinear analysis
Static Analysis
Controls in the group «Geometric nonlinearity» allow the user to customize the process of solution of
geometrically nonlinear problems.
For solving such problems, a time stepping nonlinear solver organizes the process of incremental loading of
structure and gives the solution of the linearized system of equations at each step for the current increment of
the load vector, formed for a specific loading.
Number of load steps. This option allows the user to set the number of steps during which the load will be
changing from zero to a specified value. Theoretically, all solutions can be found within one step for total
value of acting load. However, there arises the possibility of non-uniqueness of solution, and, moreover, the
found solution may not have physical meaning. In such cases, it is reasonable to specify the load
incrementally and obtain nonlinear solution for each increment. From the computational point of view, it is
often efficient because the nonlinear effects will be getting smaller at each step. If the increments of load are
sufficiently small in magnitude, each incremental solution can be found within one step with a high degree of
accuracy. By default, the number of steps is set to 10.
Update load direction allows the user to account for change in the load vector, while applying the loading,
according to the deformed geometry of the model.
Solution method. By default, the Newton-Raphson method of solving the system of nonlinear equations is
used. At each step of load application, the system of the linear algebraic equations is being solved until the
relative error between two consecutive solutions does not become smaller than the prescribed tolerance.
If the number of iterations reaches the value larger than the specified one, the calculations are terminated.
Appendix (References)
Properties of Structural Materials
A proper assignment of material properties used in the structure is an important prerequisite for correctness
of finite element analysis. The main properties of structural materials used for strength analysis in T-FLEX
Analysis are:
A material's Elastic Modulus E, [N/m2] - is the ratio of stress with respect to relative strain σ = Eε
developing in a prism-shape specimen subjected to an axial force in a tensile test. In this case, a uniform
stress state exists in the mid-part of the specimen in the longitudinal direction. The value of the Elastic
Modulus Е on the strain graph σ = f (ε ) is numerically equal to the tangent of the tilt angle of the linear
segment: E = tgβ on the stress graph when testing a specimen. The physical sense of the Е modulus is
described as the stress required for doubling the specimen length. However, the value of elastic elongation
seldom reaches even 1% for most of solid bodies.
The stress graph of the tested specimen has several special points corresponding to changes in physical
properties of the material and is used for evaluating the degree of material reliability under load.
Elasticity limit σп - the stress that is the upper bound in effect of purely elastic strain.
93
T-FLEX Analysis User Manual
σ (P)
σт
σB
σк
σп
ε (ΔL)
The stress (dilation) diagram for plastic materials
(for example, low-carbon steel)
Yield limit σТ. Further elongation of the specimen (for example, for low-carbon steels) occurs practically with
no increase in the load. This phenomenon is called "plastic flow", and the horizontal part of the diagram
immediately to the right from the bend point is called the plastic flow range. In many structural materials the
plastic flow range is not so prominently visible, as in low-carbon steels. The notion of the conditional yield
limit σ s is introduced for such materials; this is the stress corresponding to the residual (plastic) strain equal
to s %. Usually, s = 0.2%. The Yield Limit for plastic materials is selected as the strength criterion - the
maximum safe stress [σ]. Reaching stresses corresponding to the yield limit causes irreversible plastic strains
in the structure, thus breaking its viability and is thus an inadmissible behavior from the safety viewpoint.
The ultimate strength σr (rheological resistance) is the stress, upon exceeding which the material rupture occurs.
Upon an increase in the loads, there is a moment, after which more strain builds up in the specimen without
an increase, or even under a reduction in, the load, up to the rupture.
The Poisson's ratio µ characterizes transverse strain developing in a stretching specimen. In the elastic zone, the
strain in the transverse direction is ε ' = − με , where ε - the strain in the longitudinal direction, µ— the
Poisson's ratio. For isotropic materials, the Poisson's ratio lies in the range 0 < μ < 0,5 .
For various steel grades, Е = 195-206 GPa, µ = 0.23-0.31; for aluminum alloys, Е = 69-71 GPa, µ = 0.300.33.
Elastic properties of some materials are given in the table (the denominator indicates the respective
compression property).
Property
Material
94
Е, GPa
σТ,MPa
σЕ,,MPa
δ, %
ψ, %
Steel ST.3
200
240/240
450/-
26
50
Steel 15
200
210/210
350/-
28
55
Steel 45
200
340/340
610/-
24
45
Static Analysis
Steel 30HGSA
200
950/950
1200/-
13
-
Cast iron S-Ch15-32
150
-
150/640
0,6
45
Copper wire
110
250/250
320/-
15
-
Duralumin D16
75
240/240
420/-
18
-
Delta wood
(plywood)
20
-
250/160
-
-
Textolite
30
75/115
127/168
1,5
-
A material's plasticity properties are the relative elongation and relative contraction at rupture:
δ=
l k − l0
F − Fk
100% , ψ = 0
100%
l0
F0
where l0, F0 -the length of the working part of the specimen and the area of the cross-section before strain; lk
- the length of the working part of the specimen after the rupture; Fk - the final area of the cross-section at the
specimen's neck after the rupture.
The plastic and brittle material states are distinguished by the amount of relative elongation at rupture.
Materials developing sufficiently high values δ (δ > 10%) at the point of rupture are referred to as plastic
materials; those referred as brittle are the materials with relative elongation of δ < 3% . For plastic
materials, upon compressing to nearly the yield condition, the σ = f (ε ) graph pattern is the same as in the
case of tension. Under a compression strain, the specimen shortens; meanwhile, its cross-section dimensions
grow. For certain plastic materials, it is impossible to find the stress analogous to the tensile rheological
resistance due to the specimen's flattening.
Brittle materials exhibit much better ability to resist compression strain, rather then dilatational strain; for
those, the compression rupture strain exceeds the ultimate tensile strength multifold. Rupture of brittle
materials under compression occurs due to cracking.
Volume Stress-strain State at a Point
The deformed state at a point of a deformable body is described by the symmetrical strain tensor:
⎡
⎢ εx
⎢1
ε = ⎢ γ yx
⎢2
⎢1 γ
⎢⎣ 2 xz
1
γ xy
2
εy
1 ⎤
γ zx
2 ⎥
1 ⎥
γ zy ⎥ ,
2 ⎥
εz ⎥
⎥⎦
1
γ yz
2
where ε x , ε y , ε z - the longitudinal relative strain, γ xz = γ zx , γ xy = γ yx , γ zy = γ yz - the angular strain.
You can always specify the three orthogonal directions, so that the sheer angles are all zeros, while
95
T-FLEX Analysis User Manual
elongations are ε1 ≥ ε 2 ≥ ε 3 . The strains ε1 , ε 2 , ε 3 in the directions, for which sheer angles are absent,
are called principal strains at a point.
Together, the nine stress components (by three per each of the mutually perpendicular facets) make up a
physical entity called, stress tensor at a point. The tensor is represented by a symmetrical matrix:
⎡ σ x τ xy τ xz ⎤
⎢
⎥
σ = ⎢τ yx σ y τ yz ⎥ ,
⎢τ zx τ zy σ z ⎥
⎣
⎦
where σ x ,σ y , σ z - the compression-tension stress, τ xz = τ zx , τ xy = τ yx , τ zy = τ yz , - the sheer stress.
Z
σz
τyz
τxz
τxz
τzx
τyx
σx
σy
τxy
Y
X
The stress state tensor components in an infinitesimal block
The following rule of signs is commonly used for stress tensor components: a component is positive, if it
points in the positive direction of the respective coordinate axis of a facet with the positive external normal
aligned with one of the coordinates.
Both
the
stress
tensor
and
the
strain
tensor
possess
the
symmetry
property.
τ xz = τ zx ,
τ xy = τ yx , τ zy = τ yz . The symmetry conditions of the stress tensor are also referred to as paired sheer
stresses condition: the sheer stresses acting on two mutually perpendicular facets in the directions orthogonal
to the edge in the intersection of those facets are equal in magnitude. Due to these properties, out of nine
components of the stress tensor there are six independent ones.
Just like in the case of the strain, the concept of principal stresses is introduced in a stress state,
σ 1 ≥ σ 2 ≥ σ 3 , corresponding to principal strains, related with the stress tensor components by the equation:
σ 3 − J1σ 2 + J 2σ − J 3 = 0 , where
J1 = σ x + σ y + σ z ,
σ x τ xy σ x τ xz σ y τ yz
J2 =
+
+
,
τ yx σ y τ zx σ z τ zy σ z
⎡ σ x τ xy τ xz ⎤
⎢
⎥
J 3 = ⎢τ yx σ y τ yz ⎥
⎢τ zx τ zy σ z ⎥
⎣
⎦
A cubic equation solution has three real roots σ 1, σ 2 , σ 3 , which are commonly ordered as follows:
σ 1 ≥ σ 2 ≥ σ 3 . The principal stresses possess an important property: the normal stresses on the principal
96
Static Analysis
direction-oriented facets are highest among those on any other facets. Also introduced is the concept of mean
stress by the formula
σ 0 = (σ x + σ y + σ z ) / 3 = (σ 1 + σ 2 + σ 3 ) / 3
Structure's Static Strength Assessment. Strength Theories
The ultimate safe stress state is when material properties undergo a qualitative change - a transition from one
mechanical state to another one. For plastic materials, the safe strain state is commonly considered as the
condition of developing noticeable residual strain, while for brittle ones - a condition when a material begins
to crack. The ultimate state is not admissible for materials. Therefore, when performing strength analysis,
pursue the so-called admissible state. It corresponds to the load obtained by dividing the load of the ultimatestrength state by a safety factor. If the safety factors are equal in two stressed states, than those are called
equally fail-safe. To compare various strained states, the simple tension (compression) is accepted as the
universal measure, with the principal stress σ equiv .
Equivalent stress σ equiv - the stress to be developed in a stretched specimen in order to make its state equally
unsafe as a specified stress state. The strength criterion is written out as σ equiv ≤ [σ ] .
Strength theories are hypotheses about criteria describing the conditions of a material reaching the ultimate
strength state.
First strength theory
In the first strength theory, a material's ultimate strength refers to the maximum normal stress. According to
this theory, the unsafe state occurs when one of the principal stresses reaches a safety threshold.
Accordingly, the magnitude of the maximum principal stresses is limited so as not to exceed the maximum
principal stress [σ ] . The strength criterion appears as:
I
σ equiv
≤ [σ ] ,
I
I
where σ equiv
= σ 1 , if σ 1 ≥ σ 3 and σ equiv = σ 3 , if σ 1 ≤ σ 3 .
Second strength theory
The second strength theory uses the maximum strain as the ultimate strength criterion. According to this
theory, the unsafe state of a material occurs when linear strain reaches a certain safety threshold. For a plastic
max ε ≤ [ε ]
material, the strength criterion appears as
max ε = ε 1 =
[ε ] = [σ ]
E . If, for example,
, where
1
[σ 1 − ν (σ 2 + σ 3 )]
E
, then
.
For brittle materials, the strength criterion appears as:
ε max ≤ [ε р ] =
[σ ]
р
E ,
ε min ≤ [ε с ] =
[σ с ]
E
The first theory yields good agreement with experimental data only for brittle materials. The second one is
practically abandoned nowadays.
97
T-FLEX Analysis User Manual
Third strength theory
In the third strength theory, the ultimate strength refers to the maximum sheer stress. According to this
theory, the unsafe state occurs when the maximum sheer stress reaches a safety threshold.
The strength criterion appears as: τ max =
σ1 − σ 3
2
, where [τ ] =
[σ ] . Consequently:
2
Fourth (energy) strength theory
The fourth strength theory is based on the energy approach, based on the hypothesis that the cause of an
unsafe state is the magnitude of the potential energy density of deformation ud, therefore the criterion refers
to the density of the potential energy of deformation.
We will derive the formula for the potential energy density due to distortion from the formula for the full
potential energy density due to strain, by using the specific Poisson's ratio of µ =0.5.
That yields:
1+ μ 2
σ 1 + σ 22 + σ 32 − σ 1σ 2 − σ 2σ 3 − σ 1σ 3 )
(
3Е
1+ μ
The strength criterion appears as ud ud ≤ [ud ] , where [ud ] =
[σ ] .
3Е
[ ud ] =
Consequently:
or
IV
σ equiv
=
1
2
(σ
− σ y ) + (σ y − σ z ) + (σ z − σ x ) + 6(τ xy2 + τ yz2 + τ xz2 ) ≤ [σ ]
2
x
2
2
The third and fourth strength theories produce satisfactory agreement of theoretical calculation results with
laboratory test data for plastic materials and are widely used in strength analysis. These theories are not
applicable for brittle materials.
98
Buckling Analysis
B U C K L I N G A NA LYS I S
Equilibrium of a statically loaded structure is called stable, if small disturbances cause small deformations. In
certain cases of loading structures, situations are possible that are called buckling – when small disturbances
from the forces applied to the system cause large structural deformations, which exceed those defined within
the framework of the linear theory of elasticity. Loads that cause buckling are called critical, and the
respective states – critical states. Under compressing forces, which even insignificantly exceed the critical
value, additional bending stresses reach quite large values and directly threaten structural integrity.
Therefore, the critical state which immediately precedes rupture, is considered inadmissible in real-life
conditions. The threat of buckling is especially great in compressed zones for light thin-wall structures, such
as slender rods, plates and shells. The buckling phenomenon exhibits various forms: completely new forms
of equilibrium appear; known stable configurations deteriorate, etc.
The buckling analysis module serves for conducting the so-called initial buckling structural study. The result
of the study is a coefficient of the critical load, under which the structure may spring into a new equilibrium
state, and the shape of the new equilibrium state corresponding to that load. In such a case, a situation is
possible, when the critical load, under which buckling occurs, could be much less than the load, under which
the maximum strength of the structure will be exceeded based on the linear static stressed state of the
structure. In other words, the stresses in the structural material may not reach the ultimate values, but
deformations due to buckling may cause structural rupture. Therefore, the buckling condition can be
formulated based on the critical load criterion as follows:
Actual loads applied to a structure, must be less than the estimated critical load, subject to an asserted
safety factor:
F factual ⋅ K safety < Fcritical
Having estimated the value of the critical load, under which the structure may buckle, you can optimize the
part in order to achieve the safe condition. For example, for a slender object, you can increase resistance to
buckling by reducing the length or increasing the thickness of your object, or create additional ribs for
rigidity.
99
T-FLEX Analysis User Manual
Details of Buckling Analysis Steps
Buckling Analysis is performed in several stages. The order of steps for the user to put together a study and
run calculations of the structural buckling analysis is mostly similar to the algorithm described for the Static
Analysis. Therefore, in this chapter we will just mention what is special for the buckling analysis:
1. Creating Study. When creating a study, specify its type – «Buckling Analysis»
2. Applying boundary conditions. Just like in the static analysis, the buckling analysis uses restraints and
loads as boundary conditions. All types of restraints and all types of forces can be used in the buckling
analysis. The thermal impact is defined in the same way as in the static analysis. Defining restraints and
forces is a necessary condition for running a correct analysis. The combined limitation on the model
must satisfy the following condition:
To be suited for a buckling analysis, a model should have restraints preventing free movement in the space as
a solid body. Failing to meet this condition will cause incorrect results of Finite Element analysis or abortion
of computations.
Note also that defining loads properly is important for the initial buckling study to be correctly
formulated. In particular, in certain loading cases, the solution to the study may not have physical sense
(for example, in the case of a rod being stretched with a tensile longitudinal force). Correctly defined
boundary conditions are signified by a positive value of the critical load coefficient, resulting from the
study.
3. Running calculations. Before running calculations, the
user specifies computational algorithms and the number
of buckling modes to be analyzed, in the study
properties.
The following data is output into the information
window when running calculations:
Nodes - the number of nodes in the computational finite
element mesh.
Elements - the number of tetrahedra in the finite
element mesh.
Arguments – the number of equations used in the
calculation.
Calculation complete – this message signifies that the
solution process is completed successfully.
4. Results. The following are analysis results:
Load Factor – the calculated value of the coefficient, the product of which and the loads applied to the
system makes the factual value of the critical load, which brings the system into a new equilibrium state.
For example, a distributed force of 1000 Н is applied over the model. The Load Factor, as calculated, is
equal to 109.18 . That means, that the first mode of an equilibrium state for the given model has the
critical load equal to 109180 Н.
Load Factor must be positive. If calculations have resulted in a negative Load Factor, that means, no
buckling can be produced by the loads applied to the structure.
Relative displacements, corresponding to a given critical load. This type of result reflects on a buckling
mode of the structure corresponding to a certain critical load. The buckling modes displayed in the
postprocessor window after completing calculations are relative displacements. By analyzing those
100
Buckling Analysis
modes, you can make a conclusion about the pattern of displacements in a buckling condition. By
knowing the expected buckling mode under a certain critical load, one could, for example, introduce an
additional restraint or a support in the part of the structure corresponding to the maximum of buckling in
this mode, which would effectively alter mechanical properties of the product.
As an additional (reference) result, you can also output displacements of the structure under the applied
static loads, whose calculations preceded the evaluation of the critical load factors.
Buckling modes, corresponding to the first and second critical loads on the part
Algorithm for Buckling Analysis Based on Modeling
Once the study calculation completes successfully, you should analyze solution results in order to make
conclusions on probabilistic buckling of the structure based on results of Finite Element modeling. A typical
sequence of steps for validating the results of Finite Element modeling of initial buckling is as follows:
1. Solution evaluation. As was mentioned earlier, the Load Factor must be positive. If the factor came out
negative, that means the loads applied to the structure do not produce system buckling.
2. Load factor evaluation. If the Load Factor is positive and is less than 1, that means system buckling will
occur under the specified loads, and that the design of the structure needs enhancement. If the Load
Factor is positive and is greater than 1, that means there is no buckling threat for the structure under the
specified loading conditions.
3. Buckling modes analysis. In the studies tree, use the context menu command "Open" or "Open in new
window" to open the "Buckling mode 01" solution, corresponding to the smallest critical loading. We can
visually estimate the pattern of the strained state of the structure. The buckling analysis allows making a
conclusion about directions and locations of maximum displacements, corresponding to a critical load.
This information can be used for optimizing the product's design with the purpose of increasing its
resistance to buckling.
Buckling Analysis Processor Settings
Upon initializing the «Analysis|Solve» command, the dialog of defining study properties appears by
default, with several tabs to switch between. The user can change the default study properties. To access a
study's properties, one can also double-click
a study's name in the studies tree, or in the context menu
right-click
on the name of the selected study in the studies tree. The user-defined study properties are
101
T-FLEX Analysis User Manual
saved together with the document and are inherited upon copying a study. The main purpose of this study
properties is defining the modes of the Processor's operation, as well as the lists of results and the number of
buckling modes displayable in the studies three after calculations.
On the [General] tab, you can define or modify the descriptive properties of the current study: the name,
the study type, the comment.
On the [Solve] tab, you can define processor properties for solving the equations.
Number of buckling modes. The user can specify the
number of critical loads and respective buckling modes
to be identified. For practical purposes, the most
important is the first mode, corresponding to the
minimum critical load. Nevertheless, the user may also
find the critical loads of other buckling modes.
In the group «Finding State Forms» for parameter
«Solving System», it is required to indicate possibility
of using additional disk memory ([Customize]):
automatic, not available, mandatory. The use of
additional disk memory allows the user to save
decomposition of the stiffness matrix on the disk.
Relative miscalculation – the accuracy of determining
critical loads; upon reaching this accuracy, the iterative
process stops.
Maximum number of iterations - the critical number of iterations, after reaching which the iterative
solving of the system of equations terminates, even if the required solution accuracy was not achieved.
In the group “Finite-Element Method” the user can set the mode «Calculate using linear element». This
facilitates much faster calculation for an approximate estimate of the buckling mode amplitudes relative
distribution on a sufficiently fine mesh.
The linear element analysis provides insufficient accuracy of calculating critical loads. Critical load
results are much greater (by a factor of tens or hundreds of times) via the calculation by linear finite
elements, rather than those achieved by more accurate methods. It is strongly recommended to use
only quadratic element calculations for quantitative evaluation of the critical loads (the default
mode).
The [Results] tab sets the displayable result types in the studies tree after finishing calculations.
102
Frequency Analysis
F R E Q U E N C Y A NALYS I S
The frequency analysis module serves for calculating natural frequencies (resonant frequencies) of a
structure’s vibrations and the respective vibration patterns. The task of calculating natural frequencies and
the respective vibration patterns arises in many practical cases of analyzing a structure’s dynamical response
under varying loads. A most widespread situation is when it is necessary to assure at the design stage a low
possibility of the mechanical phenomenon of the resonance under operating conditions. As known, the
essence of the resonance is a significant increase in the magnitude of induced vibrations (by dozens of times
and even more) at certain frequencies of an external disturbance – the so-called resonant frequencies. In most
cases, the occurrence of resonance is an unwanted phenomenon from a product’s safety viewpoint. Probing a
structure’s natural properties against the possibility of a resonance in the operating range of external exciting
frequencies at the design stage helps introducing changes in the structure that can alter the natural
frequencies spectrum. This could help avoid or significantly lower the possibility of resonance during
operation. Thus, the vibro-stability condition with respect to the natural frequencies criterion can be
formulated as follows:
A structure’s natural frequencies must fall outside the external exciting frequency range:
[
ex
ex
f i ∉ 0.7 f min
;1.3 f max
]
where fi - the i-th natural frequency of the structure. Usually, the greatest danger is presented by resonance
at lower natural frequencies ( i ≤ ~ 5 ), since that is where the most mechanical energy is concentrated;
ex
ex
f min
; f max
– the lowest and the highest frequencies of the known range of external exciting vibration.
Variation in the amplitude magnification factor with respect to the natural frequency to the external exciting frequency ratio in
a system with an insufficient damping
By having evaluated natural frequencies of a structure’s vibrations at the design stage, you can optimize the
structure with the goal of meeting the frequency vibro-stability condition. To increase natural frequencies,
you would need to add rigidity to the structure and (or) reduce its weight. For example, in the case of a
slender object, the rigidity can be increased by reducing the length and increasing the thickness of the object.
To reduce a part’s natural frequency, you should, on the contrary, increase the weight or reduce the object’s
rigidity.
103
T-FLEX Analysis User Manual
Thus, by calculating resonant frequencies at the design stage using the frequency analysis module and
optimizing the part’s mass-rigidity properties, the user can raise reliability of the structure being developed
from the viewpoint of its vibro-stability and vibrational strength.
Details of Frequency Analysis Steps
Frequency analysis is performed in several stages. The sequence of the user’s steps for putting together a
study and running a structure’s frequency calculation is in many parts similar to the algorithm described for
the Static Analysis. Therefore, we will point out in this chapter only certain details specific to stability
calculations:
1. Creating “Study”. When creating a study, specify the study type - “Frequency analysis” in the
command’s properties window.
2. Applying boundary conditions. In a frequency analysis study, the boundary conditions are solely
defined by restraints. Defining restraints is a necessary prerequisite for performing a correct frequency
calculation. The combined restraints on a body’s motion must satisfy the following condition:
To be subjected to frequency analysis, a model must be restrained so as to exclude its free motion in the
space as a solid body. Failing to meet this condition will cause incorrect results of Finite Element modeling
or abortion of computations.
3. Solving. Before running calculations, the user should specify the number of natural frequencies and, if
necessary, elaborate on the solution algorithm.
4. Analysis of frequency calculation results. The results of a frequency analysis are:
Natural vibration frequency (Hz) – corresponds to the expected resonant frequency of the structure. In
theory, the number of natural frequencies is unlimited for any body. The results reflect only the
frequencies for selected modes of natural vibration.
Natural vibration mode with respect to a given frequency. Let us illustrate the physical meaning of the
“vibration mode” term. A vibration mode shows what will be the relative deformations (displacements)
in a structure in the case of resonance at the respective natural frequency. Please take a special notice on
that the vibration modes displayed in the Postprocessor window after completing calculations are relative
amplitudes of vibration. By analysing those modes, one can make conclusions about the pattern of
resonant displacements, but not about their factual amplitude. By knowing the expected vibration mode
104
Frequency Analysis
at a certain natural frequency, you can introduce an additional restraint or support at the part of the
structure corresponding to the maximum vibration in this mode, which would effectively manage the
part’s natural properties.
By default, the vibration modes are displayed in the Postprocessor window without color-coding; the
latter can be enabled in the visualization properties.
Consider also the convenience of animation for analyzing the pattern of the structure’s motion at a
certain frequency. Remember to enable the “Animation” option in the properties of the calculation
results window (accessible by
in the Postprocessor window) in order to have an animation, and
specify the desired animation parameters.
Frequency Analysis Processor Settings
On the [General] tab, you can define or edit the descriptive attributes of the current study, as the name or
a comment.
The [Calculation] tab serves for defining
processor properties for solving equations.
In the group «Number of frequencies» it is required to:
• specify parameter «Number of frequencies», that
is, the user can define the number of lower natural
frequencies of the structure to be evaluated;
• turn on the option «Non Stationary System» in
case if the restraints applied to the model are not
sufficient to eliminate the model’s rigid body
motion in space.
In the group «Solving Equations» for parameter
«Solving System», it is required to indicate possibility
of using additional disk memory ([Customize]):
automatic, not available, mandatory. The use of
additional memory allows the user to save
decomposition of the stiffness matrix.
Relative miscalculation – the error of evaluating the natural frequencies, after reaching which the iterative
process terminates.
Maximum number of iterations – the critical number of iterations, after reaching which the iterative
solving of the system of equations terminates, even if the required solution precision was not achieved.
105
T-FLEX Analysis User Manual
In the group «Finite-Element Method» the user can set the «Calculate using linear element» option, if
interested in qualitative results only, that is, when the one is only interested in relative assessment of
vibration amplitude patterns.
Please note that a linear element solution provides insufficient accuracy of determining the
numerical values of natural frequencies. The frequency values achieved in a linear finite element
calculation could be much greater than the values achieved by using more accurate methods. You
are recommended to use quadratic element calculations (the default mode) for quantitative
evaluation of natural frequencies.
Diagonalization of mass matrix. This mode enables the user to decrease the amount of memory required to
solve the system of linear algebraic equations. At the same time, the accuracy of obtained results becomes
slightly worse.
The [Results] tab defines the result types displayable in the studies tree after finishing calculations. In
the frequency analysis, the user can assess only relative displacements, either their absolute value or a value
in the direction of the respective axes of the global coordinate system.
106
Thermal Analysis
T H E RM A L A NA LYSI S
The thermal analysis module serves for solving heat transfer and thermal conduction problems. A typical
goal of performing thermal analysis is finding temperature fields and heat (thermal) flux within a product's
volume. T-FLEX Analysis supports two ways of formulating a thermal analysis problem:
• Steady state – calculating temperature fields and heat flux distribution under the assumption of an
infinitely long time passing after applying thermal loads. A body's temperature does not change with
time in the steady state, so that an elementary body volume loses as much energy to the environment
per the time unit as it gains from outside or from internal heat sources.
• Transient process – temperature fields calculation occurs as a function of time. The temperature field
distribution pattern changes with time in the analyzed physical system, so that the study results in
obtaining temperature fields at each time instant of a certain time period set forth by the user.
Examples of a steady-state (left) and transient (right) thermo-dynamical processes
Details of Thermal Analysis Steps
Thermal analysis is performed in several stages. The sequence of the user's steps for putting together a study
and running a thermal study of a structure is in many parts similar to algorithms of working with other study
modules of T-FLEX Analysis. Therefore, we will point out in this chapter only certain details specific to
thermal studies.
1. Creating Study. When creating a study, specify its type – «Termal Analysis». As in other study types,
building a finite element mesh is required, for approximating the structure's geometry.
2. Applying boundary conditions. In the thermal analysis, the boundary conditions are represented by the
boundary and initial temperatures, heat power sources, heat flux, and conditions of heat exchange
between the model and environment – convection and radiation applied to the model.
107
T-FLEX Analysis User Manual
Commands for defining boundary conditions of thermal analysis
When defining thermal loads, you need to distinguish and appropriately use the two options of defining
the «Temperature» load (see «Preprocessor») – «Initial Temperature» and «Temperature». The initial
temperature is used for defining thermal loads at the initial (zero) moment of time for the transient
thermal analysis only. All thermal loads defined without the «initial» flag are considered constant
(invariable) in both the steady state and transient thermal analysis.
3. Solving. Before running calculations, the user can specify the type of a thermal analysis study being
solved (the [Parameters] tab, steady-state or transient heat transfer), and, if necessary, adjust
algorithms for solving systems of equations on the [Solve] tab.
4. Analysis of thermal solution results. The results of a thermal analysis are:
Temperature fields – temperature distribution over the model's volume.
Thermal gradients by the X, Y, Z axes, and the magnitude of the thermal gradient – reflect on the
degree of temperature changes by the respective axes of the coordinate system.
Resulting thermal flux by the X, Y, Z axes, and the magnitude of the resulting thermal flux –show
the rate of thermal energy transfer, determined from the solution to the thermal analysis study.
Magnitudes of the thermal (temperature) gradient and the resulting heat flux are determined as the square
root of the sum of the squares of the respective coordinate-projected components.
Besides the mentioned results, the following reference data can be displayed in the postprocessor
window:
• Prescribed thermal flux corresponds to the specified initial parameters of thermal loads.
• Prescribed temperature – constant thermal loads applied to the model.
• Initial temperature – the initial temperature field applied to the model (for the transient thermal
analysis).
The methods for analyzing results of thermal analysis accepted in the T-FLEX Analysis Postprocessor,
are in general similar to the methods of examining results in other analysis modules. Let us mention
some specific Postprocessor tools, which can be used for analyzing results of transient heat transfer.
Solving a transient heat transfer study results in a large set of data, whose total number is equal to the
number of time steps specified by the user. T-FLEX Analysis provides the user with a convenient visual
interface for managing the entire array of data resulting from calculations. For this purpose, a «Time
process» dialog panel can be called from the results viewing window's context menu, that can be used by
the user to quickly switch to the desired result on the time scale.
108
Thermal Analysis
Use of the «Time process» window for managing access to the results of a transient thermal study
Thermal Analysis Processor Settings
On the [General] tab, you can define or edit the descriptive attributes of the current study, as the name or
a comment.
The [Solve] tab contains settings for solving systems of algebraic equations, with their meanings similar
to the settings of the «Static analysis» study (see the respective section). Note that the «Calculate using
linear element» mode can be used in most cases of thermal analysis, facilitating much faster calculations.
Unlike studies in Statics, Frequency analysis and Buckling, results of temperature distribution over the
model's volume achieved under the linear interpolation assumption are not much different from the
respective results obtained from using a quadratic interpolation.
Before starting calculations, on the tab [Parameters] the user can indicate the type of solved thermal
analysis problem: stationary (steady state mode) or non-stationary thermal conduction (transient process).
For non-stationary thermal conduction, it is necessary to specify a process duration («Total process time»),
time step and initial temperature.
109
T-FLEX Analysis User Manual
In the thermal analysis, controls «Initial temperature|Use
preset temperature» allow the user to define as an initial
temperature:
• initial temperature prescribed with the help of the
command «Analysis|Thermal Load|Temperature»;
• the default value of temperature at those finite
element nodes where the initial temperature was not
defined by the user.
The «Use heat-task results» control allows defining the
initial temperature by the results of an earlier conducted
thermal analysis. This dialog item becomes accessible to
the user, if there are earlier conducted thermal studies
present in the model. In the drop-down list select the name
of a solved thermal analysis study and, if necessary, the
time instant, to which the solution pertains. Please note
«Parameters» tab of the thermal analysis study
that certain conditions are to be met for using thermal
parameters window
analysis results as the initial temperature conditions:
1. Identity condition of finite element meshes in both thermal analyses. The simplest way of achieving such
identity is the use of the "Copy" command available in the context menu. The sequence of steps can be,
for example, as follows:
a) create a study of the "Thermal Analysis" type, generate a mesh, define boundary conditions, and run.
We assume that the solved temperatures will be used for defining initial temperatures in another
study of the transient thermal analysis;
b) create a study's copy using the «Copy» command;
c) define boundary conditions of a transient study in thermal analysis. On the «Parameters» tab of the
study's properties, select the name of the first study and, if that's a transient analysis, the desired time
step.
As a result, we have two studies of different types, but with identical finite element meshes.
2. The "Calculate using linear element" property on the "Solve" tab of the study parameters dialog should
use the same settings in both studies. For example, if the first thermal analysis is done by linear
elements, then the second thermal analysis based on the former thermal analysis results can also be run
only by linear elements.
Note also that solving a transient heat transfer study requires more CPU time as compared to the steady state
heat transfer, since in the former case the systems of algebraic equations are solved at each time step defined
by the user.
The [Results] tab allows defining the result types displayable in the studies tree after finishing
calculations.
110
Thermal Analysis
«Results» tab (left) and dialog for setting results displayable by default in the studies tree (right)
Examples of Thermal Analysis Studies
Thermal Analysis of a Cooling Radiator. Steady State
Required is an evaluation of a passive cooling radiator efficiency for the semiconductor electronic device
with the maximum dissipating power of 15 Watt. The permissible temperature of the microchip's body is
75°С in the operating range of ambient temperatures from 25°С to 55°С. An aluminum alloy radiator is used
for cooling the device and is mounted at the top of the microchip's body. To improve heat dissipation, the
body of the microchip is also made of aluminum.
Step 1. Creating «Study», meshing, and assigning material. Create a study of the «Termal Analysis» type
using the command «Analysis|New Study» based on two bodies – the microchip and the radiator.
Generate a finite element mesh. You also need to define parameters of the part's material. By default,
calculations use material properties «From Operation», that is, the material properties are automatically
obtained from the product part's solid model. This is especially convenient when a study includes bodies
from different materials representing parts of assembly models. In our case, the «Aluminum» material was
defined at creation of the 3D model of the radiator and the microchip, with its physical and chemical
properties contained in the T-FLEX CAD 3D database.
Three-dimensional model of the microchip with a passive
cooling radiator
Resulting finite element mesh
111
T-FLEX Analysis User Manual
Step 2. Applying boundary conditions. Let us specify thermal loads for the model. We will apply the
«Heat power» load of 15 Watt to the volume of the microchip, and define the «Convection» boundary
condition on the external heat-sinking radiator surfaces with the convection parameter of 25 Watt/(m2 ⋅°C)
and ambient temperature of (25°С). We can disregard in this study the heat exchange factor of mutual and
ambient radiation, since their radiation contribution is vanishingly small at the expected temperatures (tens of
degrees Celsius). Upon completing the commands of building the finite element mesh and defining thermal
loads, we get a calculations-ready finite element model.
Defining "Heat Power" load
Defining "Convection" load
Step 3. Running calculations and analyzing results. We will
start the thermal analysis by running the command
«Analysis|Solve». In the appearing dialog of the study's
properties, set the «Steady state» option on the [Parameters]
tab. Use the «Calculate using linear element» mode on the
[Solve] tab to speed up the calculations.
The list of calculation results is displayed in the «Studies»
window, and can be accessed by the context menu in the
calculation results window. The maximum temperature
according to the heat and analysis results is 41,9 °С at the
convection temperature equal to 25 °С. We will then edit the
convection temperature using the «Edit» command of the studies
tree context menu, setting the operational ambient temperature to
its upper limit (55°С), and then rerun calculations. We will
obtain the maximum temperature of the microchip equal to 71.9
°С. The conclusion is the radiator does fulfill the required
temperature condition for the device in the entire specified range
of the device's operational temperatures. The study is complete.
112
Temperature fields in the radiator under the
convection temperature of 25°С
Thermal Analysis
Calculating the Time of Heating up the Cooling Radiator. Transient Mode
Let us estimate the time required for the device to reach a steady thermal state. To do this, let's run a transient
thermal analysis of the «microchip+radiator» system.
Step 1. Creating study's copy. We will create a copy of the original study in a steady-state thermal analysis
using the «Copy» command of the studies tree context menu. On the [General] tab of the study's
properties, change the study name to «Heating».
Step 2. Defining parameters of transient analysis. On the [Parameters] tab of the thermal analysis
properties, set the «Transient» mode. Define the time analysis parameters – the modeling time of 30 minutes
and the modeling step of 0.5 minutes. We will use the uniform ambient temperature (25°С) as the initial
model temperature.
Defining calculation parameters of transient heat analysis – time and initial temperature
113
T-FLEX Analysis User Manual
Step 3. Running calculations and analyzing results. After the completion of calculations, you can examine
results at each time step. To view such results, we use a floating «Time process» bar that allows the user to
quickly switch to the time instant of interest using a slider. With the help of these tools we determine that a
nearly complete heating of the radiator will occur after approximately 26 minutes.
Result of thermal analysis at time 1590 sec (26 min.)
Calculating Time of Cooling Down the Cooling Radiator. Transient Mode
Now, let's evaluate the time required for the device-cooling radiator to cool down after an extended work.
Step 1. Creating study's copy. Adjusting boundary conditions. Let's create a copy of the original study of
the steady-state thermal analysis. A «Study Copy» dialog appears when creating a copy of the study. By
clearing the flag «Create Copy of Mesh», the different studies will be made to use the same mesh. This
copying mode provides identity of finite element meshes two or more studies. Let's call the new study
«Cooling».
Adjust the boundary conditions of the «Cooling» study. For this, delete the «Heat power» load from the
«Cooling» study by the studies tree context menu command «Delete». Now, the «Cooling» study is ready
for defining calculation parameters.
Step 2. Defining parameters of transient analysis. Set the «Transient» mode on the tab of the thermal
analysis properties. Define time analysis parameters – the modeling time of 30 minutes, the modeling step of
0.5 minutes. Let's use the result from the previous steady-state radiator evaluation as the initial model
temperature.
114
Thermal Analysis
Setting up study parameters for calculating cooling process
(transient heat transfer)
Step 3. Analyzing calculation results. Let's run calculations and analyze the results. Using the «Time
process» bar, we can determine that nearly complete cooling of the radiator will occur in approximately 26
minutes after turning the device off.
Device cooling calculation.
Temperatures distribution at 1590 seconds of the calculation time
115
Руководство пользователя T-FLEX Анализ
V E R I F I C AT I O N E X A M P L E S
In this chapter we review the results of solving several model studies that have an analytical solution, in
order to assess the accuracy of the finite element analysis system output. All examples brought up here it can
be found in the "Verification examples" library of files.
Examples of Solving Studies in Statics
Bending of a Cantilevered Beam under a Concentrated Load
Consider a cantilevered beam of length L, loaded with the
P
force P at the right-hand end. The beam cross-section is a
h
rectangle of width b and height h.
b
L
Sought is the maximum beam deflection.
Assume P=2000 N, L=0.5 m, b=0.05 m, h=0.02 m.
After building the model, we set up a study of the "Static Analysis" type, and apply a finite element mesh to
the model. The beam material is left by default (the Young's modulus E = 2.1 ⋅ 1011 Pa, Poisson's ratio
ν = 0.28 ).
The left-hand end of the beam is fixed, and the right-hand end subjected to the load amount P, directed
vertically downward.
Finite-element model of the beam with loads and restraints
Using the "Analysis|Solve" command, we will calculate the static solution of the beam.
Displacements of beam points
The maximum displacement came out equal to 11.83 mm.
The analytical solution appears as [1, p.215]:
w=
116
P ⋅l3
= 11.9 mm ,
3E ⋅ J
Verification Examples
where P – is the force, l – the beam length, E – the material Young's modulus, J =
b ⋅ h3
– the section's
12
moment of inertia.
The solution accuracy is 0.5%.
Static Analysis of a Round Plate Clamped Along the Contour
We need to find the maximum deflection of a round plate of radius R
and thickness h, which is clamped (fixed) along the contour and is
loaded with a uniform pressure q distributed on the top face of the
plate.
R
q
h
Because of the symmetry in this study, we will work with one quarter of the plate. Assume the plate radius
R=0.2 m, thickness h=0.01 m, and the pressure q=1000 kN/m^2.
After building the model, we will create a study of the "Static Analysis" type using the command
"Analysis|New Study", and construct a finite element mesh. We will leave the default plate material (the
Young's modulus E = 2.1 ⋅ 1011 Pa, the Poisson's ratio ν = 0.28 ).
Next, we need to apply boundary conditions. The side surface of the plate will be fully restrained, whereas
the free faces introduced after discarding ¾ of the plate are subjected to partial restraints in the normal to the
faces direction, because the points in the sections cannot have extra displacements in the normal direction
due to the symmetry. Pressure in the amount of 1000 kN/m^2 is applied to the top face of the plate.
Finite element model of the plate with loads and restraints
We then run the plate static analysis using the command "Analysis|Solve".
Displacements of plate points
117
Руководство пользователя T-FLEX Анализ
The maximum deflection (at the center of the plate) comes out equal to 1.3244 mm.
There is an analytical solution to this study. The deflection at the plate center is calculated by the formula [1,
p.566]:
q ⋅ R4
w=
= 1.3166 mm ,
64 ⋅ D
E ⋅ h3
– flexural rigidity.
where q – is the pressure amount, R – the plate radius, D =
12 ⋅ (1 − ν 2 )
Thus, the solution error in displacements is 0.6%.
2
⎛R⎞
The stress on the plate contour is calculated by the formula: σ = 0.75q ⎜ ⎟ = 3 ⋅108 Pa .
⎝h⎠
The stress magnitude obtained in T-Flex Analysis: σ = 3.19 ⋅108 N
m2
.
This solution error in stresses is 6%.
Analysis of a Spherical Pressure Vessel
Given is a spherical vessel with the inner radius r and outer radius
R. The vessel is subjected to the internal pressure p0 and external
pressure p1. Sought are the displacements of the inner vessel wall.
Due to the symmetry of this study, we will consider the 1/8 of the
sphere. Assume the following source data:
Inner radius r=0.4 m,
Outer radius R=0.415 m,
Inner pressure p0=200 MPa,
Outer pressure p1=120 MPa.
у
p1
r
х
p0
R
Assume the material properties as E = 2.1 ⋅ 1011 Pa,ν = 0.28 .
As in the previous study, we need to apply the boundary conditions to account for the discarded portion of
the sphere. In this case, we need to restrain normal displacements of all flat face points. The pressure in the
amount of 200 MPa and 120 MPa is applied at the inner and outer faces, respectively.
118
Verification Examples
Finite element model of 1/8 of a sphere with loads and restraints
By completing the calculations, we obtained the sphere inner surface displacement of 1.4070 mm.
The analytical solution appears as [1, p.737]:
U = A⋅ r +
B
= 1.4063 mm,
r2
P1 P0
− 3
3
P1 − P0
E
E ⋅ν
r
R
, B=
, μ=
, λ=
.
where A =
1⎞
1⎞
2 ⋅ (1 + ν )
(1 + ν ) ⋅ (1 − 2ν )
⎛ 1
⎛ 1
(2 μ + 3λ ) ⋅ ⎜ 3 − 3 ⎟
4μ ⋅ ⎜ 3 − 3 ⎟
⎝R r ⎠
⎝R r ⎠
The solution error in displacements amounts to 0.05%.
Besides that, it is possible to estimate the error in the stress solution.
The stressed state problem of a spherical vessel is formulated in spherical coordinates. The stress expressions
are as follows:
r −3P − R −3P
(P − P )
r −3P − R −3P
(P − P )
−
3
1
0
1
0
1
0+
1 0
σ (ρ ) =
−
ρ , σ (ρ ) =
ρ −3 .
ρ
t
−
−
−
−
−
−
−
−
3
3
3
3
3
3
3
3
(R − r )
(R − r )
(R − r )
2 ⋅ (R − r )
The equivalent stresses are found by the formula:
σ экв ( ρ ) = (σ ρ ( ρ )) 2 + (σ t ( ρ )) 2 − 2 ⋅ σ ρ ( ρ ) ⋅ σ t ( ρ ) .
The equivalent stresses on the inner surface of the sphere are σ equiv (r ) = 1148 MPa .
In T-Flex Analysis the magnitude of such stresses is σ equiv ( r ) = 1.14976 ⋅109 N
The solution error in stresses amounts to 0.18%.
119
m2
.
Руководство пользователя T-FLEX Анализ
Examples of Solving Buckling Studies
Buckling Analysis of a Compressed Straight Beam
Let's review the buckling analysis of a straight beam compressed with an axial
symmetrical load (the Euler's problem). A straight beam of the length l, width
and height of the crosssection – b and h respectively, is cantilevered at one end,
and a compressing load P acting on the other end. Sought is the load factor
corresponding to the start of the beam buckling.
Assume the beam length equal to 0.5 m, and the crosssection dimensions
b=0.05 m, h=0.02 m.
P
h
L
b
After building the model, let's create the "Buckling Analysis" study using the
command "Analysis|New Study", and generate a finite element mesh. The
beam material will be the default ( E = 2.1 ⋅ 1011 Pa,ν = 0.28 ).
Let's define the boundary conditions as follows. The bottom face is fully restrained, and the upper one is
subjected to the distributed load in the amount of 1 N.
Finite element model of the beam for buckling analysis
Using the command "Analysis|Solve", we will evaluate the beam buckling.
First buckling mode of the beam
The load ratio value came out equal to 69310.
The analytical solution to determine the critical load appears as [2, p.14]:
Pcrit =
π 2 ⋅ EJ
= 6.9087 ⋅104 N ,
2
(μ ⋅ l )
where Е – the Young's modulus, J – the moment of inertia, l – the beam length, μ – the length factor that
depends on the support arrangements and the beam loading method. In this case, μ=2.
Therefore, the solution accuracy is 0.3%.
120
Verification Examples
Examples of Frequency Analysis Study
Determining Natural Frequencies of Beam Vibration
Given is a cantilevered beam of length L with a
rectangular cross-section of width b and height h.
h
L
b
Sought are the three natural frequencies of the beam.
Assume L=0.5 m, b=0.05 m, h=0.02 m.
The material properties are: the Young's modulus E = 2.1 ⋅ 1011 Pa, the Poisson's ratio ν = 0.28 , the density
ρ = 7800 kg
m3
.
Upon completing the model, let's create a study of the "Frequency Analysis" type.
Finite element model of the beam with restraints
The analytical solution appears as [3, p.382]:
2
fi =
E ⋅ J 1 ⎛ ki ⎞
,
ρ ⋅ F 2π ⎜⎝ l ⎟⎠
where fi - natural frequencies, E – the material Young's modulus, J – the moment of inertia, ρ – the material
density, F – the area of the cross section, l – the beam length, ki - the factor that depends on the vibration
mode ( k1 = 1.875, k2 = 4.694, k3 = 7.855 ).
The results are as follows:
Vibration mode
121
T-Flex
solution, Hz
Analytical
solution, Hz
Error, %
67.3
67.0
0.4
419.1
420.2
0.3
1161.4
1176.7
1.3
Руководство пользователя T-FLEX Анализ
Determining the First Natural Frequency of a Round Plate
Sought is the natural frequency of the first vibration mode of a round
plate of radius R and thickness h, clamped along the contour.
R
h
Assume the plate radius equal to R=0.2 m, the plate thickness h=0.01 m. The material properties are: the
Young's modulus E = 2.1 ⋅ 1011 Pa, the Poisson's ratioν = 0.225 , the density ρ = 7800 кг
м3
. Due to the
symmetry, we will consider the quarter of the plate and apply the appropriate boundary conditions.
Finite element model of the plate with restraints
The value of the first natural frequency came out equal to 622.1 Hz.
First vibration mode
The analytical solution appears as [3, p.452]:
f =
10.21
R 2 ⋅ 2π
D
= 624.5 Hz ,
ρ ⋅h
where R – the plate radius, ρ – the material density, h – the plate thickness, D =
rigidity.
Therefore, the solution accuracy is 0.4%.
122
E ⋅ h3
– flexural
12 ⋅ (1 − ν 2 )