1
previous data point and the top end represents the highest sample. The GMM clears
the minimum and maximum data registers after each data point plot and uses a new
set of MIN MAX data for the next data point. This selection captures any large
changes that occur during the time interval.
Using the GMM
Displaying a TrendGraph
In TrendGraph mode, the GMM plots 120 points of measurement data on a graph in
the window display area of the GMM. When a measurement is added, the plot points
already on the graph shift one plot point to the left, and the GMM places the new
measurement at the right end of the graph. This action makes the graph appear to
"walk" toward the left, just like chart paper coming out of a strip chart recorder. The
data point shifted off the end of the graph is gone from the GMM’s memory.
The value measured by the GMM is represented by the placement of the plot point
on the graph’s vertical axis. The relative time of the measurement is represented on
the horizontal axis. The time an event occurred can only be related to other plot
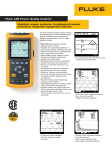
points on the graph. Figure 1 shows a typical TrendGraph display.
Figure 1. Typical TrendGraph Plot
Figure 2 is an actual example of a High/Low trend plot of current drawn from a load
center supplying power to a building’s AC outlets.