1
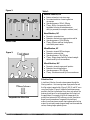
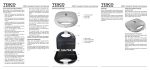
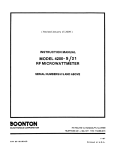
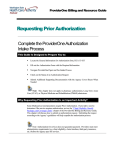
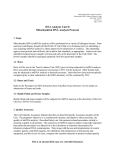
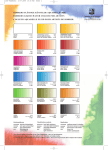
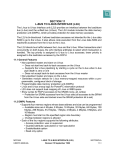
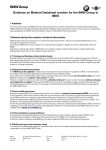
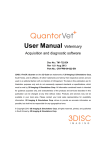
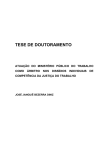
Wisconsin Center for Dairy Research
Dairy Pipeline
A Technical Resource for Dairy Manufacturers
Fall 1999, Volume 11 Number 4
Mechanics of Membrane Processes,
Part 1
By Karen Smith, Ph.D., CDR’s Whey Applications Program
Membrane technology is used throughout the food industry,
particularly in the dairy segment. According to the “Ultrafiltration and Microfiltration Handbook,” dairy applications
account for the majority of installed membrane capacity in
the food industry. Although membrane technology continues
to evolve and improve, the basic concepts emerged in
the1700’s. Abbe Nollet was to first to observe osmosis—when
water diffuses from a dilute solution to a more concentrated
one through a semi-permeable membrane. Back in those
days natural substances like pig bladders and onion skins
were used as semi-permeable membranes, or membranes
that let solvents through while holding solids back. In the
1800’s, the earliest artificial membranes were developed—
from nitrocellulose. Then, leading into the early 1900’s, the
field of physics expanded with thermodynamic theories that
influenced membrane development. By the 1940’s and 50’s
membranes were commonly used to remove microorganisms, for example by filtering drinking water. At the same
time, scientists began to try reverse osmosis, to remove salt
from seawater. By the 80’s, ceramic membranes were used
commercially in everything from nuclear power reactors to
dairy plants in France.
Type of filter
In the past, filtration processes have relied on depth
filters, a type of filter made with fibers or beads in a
mesh-like structure, Figure 1. Particles in the feed solution become trapped or adsorbed within the filter network, eventually clogging the filter and requiring replacement. In contrast, membranes are screen filters with
pores—the pores are more rigid and uniform, Figure 2.
Pore size and shape determines the passage of particles,
allowing a more narrowly defined size than the mesh
openings in a depth filter. Components that don’t fit
through the pores in a screen filter remain on the membrane surface. Since they don’t become trapped within the
membrane structure internal fouling is less and you can
reuse the membrane.
Figure 1
What's Inside:
Mechanics of Membrane Processes .................................... 1
Evaluating Sensory Quality of Cheese: —Beyond Good
Versus Bad ........................................................................... 5
News from CDR ................................................................... 8
Curd Clinic ......................................................................... 10
Calendar ................................................................ Back page
Depth Filter
continued on page 2
University of Wisconsin—Extension
College of Agricultural and Life Sciences
Figure 2.
Table 1.
Reverse osmosis, RO
♦ Retains molecules in ionic size range
♦ Pore size at resolution of scanning electron
microscope
♦ Operating pressure: 200 to 1,200 psig
♦ Theory: ability of compound to mimic
tetrahedral structure of water determines
ability to permeate (for example: methanol, urea)
Nanofiltration, NF
Screen Filter
♦
♦
♦
♦
Permeate: monovalent ions
Retentate: divalents ions, sugars, proteins and fat
Operating pressure: 150 to 300 psig
Theory: diffusion and flow through pores,
controlled by mass transfer.
Ultrafiltration, UF
Figure 3.
♦
♦
♦
♦
Permeate: minerals, NPN and sugars
Retentate: protein and fats
Operating pressure: 30 to 150 psig
Theory: shape, charge, flexibility, molecular weight
determine ability to cross membrane
Microfiltration, MF
♦
♦
♦
♦
Permeate: minerals, sugars, small proteins
Retentate: fat and large proteins
Operating pressure: 20 to 100 psig
Theory: size determines ability to cross membrane
Filtration flow
Perpendicular filter flow
2
In traditional filtration, the entire stream passes through the
filtering medium—the incoming stream is perpendicular and
the filter retains trapped solids. (Figure 3.) RO, UF, and MF use a
cross-flow filtration, (Figure 4.) where the feed stream passes
parallel to the filter or membrane. At any time, only some of the
water and particles will cross the membrane, which does limit
the applications. For example, it’s difficult to separate all the
protein from lactose with 100% efficiency since all the solution
doesn’t cross the membrane. Compared to the traditional
method, cross flow streams are self cleaning because the fouling
material is continually swept along and away from the membrane
surface, allowing longer operating times.
Figure 4.
Cross flow filtration
Type of process
Membrane structures
These days, the types of pressure driven separation processes are defined by the pore size of the semi-permeable
membrane and the amount of pressure, although the
classifications are still somewhat subjective and you’ll find
some overlap. Table 1. describes the most common classes
of the separation process. In general, RO, or reverse osmosis, uses the highest pressures and membranes that only
allow the smallest particles through, while MF, or
microfiltration, is associated with lower pressure and larger
pore sizes.
What can we make membranes out of? It really varies, you
can make membranes out of inorganic materials, like
ceramics or stainless steel, and a range of organic materials
like nylon, polypropylene, cellulose, etc. Of course, different
materials are useful for different applications. In the dairy
industry it is important to use membrane materials that
aren’t toxic, that are heat and pH resistant, and that are
stable through chemical cleaning, You might also prefer a
low cost, high flux model.
The actual pores aren’t visible in RO membranes, instead
it’s the structure of the water within the membrane that is
important. Think of the membrane as a water swollen gel,
and it is water itself that moves through the membrane,
based on the ability of several water molecules to form a
tetrahedral, or ice-like, structure via hydrogen bonding.
Only molecules that fit into this tetrahedral structure can
cross the RO membrane. One molecule that does cross is
lactic acid, because it is a small molecule that binds to
hydrogen.
Both UF and MF separate compounds based on size,
fundamentally acting as a sieve that rejects molecules too
large to fit through the pores while allowing smaller
molecules to enter the permeate stream. The pressure is the
driving force.
Speaking of flux, it’s another term you need to know when
discussing filtration. Flux is a measurement that describes
the amount of permeate produced in a given time unit, for a
given membrane area in a specific time period. It’s important because flux affects the economics of the system and is
an indication of membrane fouling and cleaning possibilities. The lower the flux, the greater the membrane area
required to process the same amount of product in a given
time. Pressure, feed velocity, temperature, viscosity (or
thickness) and turbulence all influence flux.
Now that you have mastered the basics, in the next Dairy
Pipeline I’ll be covering membrane configurations and the
role of membrane processing in the dairy industry.
Of course, system parameters like membrane composition
and operating conditions will have a major influence on
operation. For example, temperature, pressure, and concentration all affect permeability.
3
Annual Wisconsin Dairy Field Reps Conference
February 1-2, 2000
Crown Plaza Hotel - Madison East
Tuesday, Feb. 1
Morning
Quality Milk Production in Wisconsin
Moderator – Larry Tuschen
UW Milk Quality Systems
Pamela Ruegg, DVM
Research Update on Milk Quality
Bill Wendorff
Bulk Tank Culture Interpretations
Nigel Cook, DVSC
UF/RO of Raw Milk
Robert Fassbender
Afternoon
Panel Discussion
“Working Together for Milk Quality”
Moderator – Jim Glaeser
Jim Wickert, Rating officer
Phil Carley, Inspector
David Rhoda, DVM, Veterinarian
Jeff Montsma, Field Rep
Ken Bolton, County Dairy Agent
Milk Pricing Issues
Moderator – Denny Zimmer
True Protein Impact on Milk Pricing
Bob Cropp
Dairy Industry’s Investment with Check-off Programs
Will Dahl
Business Meeting
Social Conference
4
Wednesday, Feb. 2
Morning
Critical Regulatory Issues for Quality Milk
Moderator – Bob Bradley
Environmental Issues on Dairy Farms
Jim Arts
Johne’s Disease, Current Issues
Libby Balzer, DVM
Update on Milk Surveys
Randy Daggs
Current Concerns from WDATCP
Tom Leitzke
Interested?
Contact Bill Wendorff at (608) 263-2015
Evaluating Sensory Quality of Cheese:
Beyond Good Versus Bad
by MaryAnne Drake, asst. professor, Mississippi State University and the Southeast Dairy Foods Research Center
Sensory quality is a critical issue in cheese production and marketing
because it encompasses all aspects of cheese—from flavor and aroma
to functionality and texture. Whether your cheese tops a pizza, fills an
enchilada, or graces a table in a five star restaurant, sensory quality is
evaluated at some level. Yes, we do have mechanical tests that mimic or
predict various sensory measurements, but sensory testing remains a
fundamental and irreplaceable tool for three reasons.
No equipment required
Sensory testing does not require the up-front purchase of an expensive
piece of machinery. Sound sensory testing can be conducted by outside
suppliers or contractors or by a few individuals who also perform other
jobs at the plant.
Versatility
There are numerous sensory tests, depending on the specific objectives
you need. Sensory tests can be simple or complex—you can design
them to measure aroma, texture, or flavor.
Perception by human subjects
Ultimately, the consumer judges sensory quality. Thus, human evaluation of sensory properties is perhaps the best predictor of fellow human
perceptions. When used appropriately, sensory analysis is an extremely
powerful tool.
Traditional tools
The dairy industry has developed two traditional tools for evaluating
flavor and texture quality—cheese grading and ADSA scorecard
judging. Both techniques involve one or more expert evaluators who
generate an overall quality score or grade for a cheese, while also noting
specific defects. These tools have been used for more than 50 years and
both industry and academia continue to use them widely to provide a
rapid, relatively simple way to assess overall sensory quality.
While sound and useful tools, these techniques provide an expert
opinion of quality. However, consumer opinion and expert opinion of
cheese quality may not match. Further, these techniques only list the
defects present. Individual defect intensities are not quantified and
positive attributes are neither identified nor quantified. It isn’t possible
to use statistical analysis with grading. Also, it isn’t appropriate to use
statistical analysis for quality scores from scorecard judging because
the scales are not linear. However, you can use additional analytical
sensory tests to augment these traditional tools and add a new dimension to sensory testing.
Analytical sensory tools
Mainstream sensory analysis involves a versatile set of tools that fall into two categories:
discriminative tests and analytical tests.
Discriminative tests are difference tests. They
measure general differences in products and
include the following: triangle tests, duo-trio
tests, paired preference and ranking tests. These
tests are simple to set-up, require little or no
training of personnel and are easy to interpret.
Qualifiable information is provided, essentially
you are asking: Does a difference exist? Quantifiable information regarding the degree of
difference is not provided—you haven’t
answered how much?
Analytical sensory tests, also called descriptive
analysis, provide qualifiable and quantifiable
information. No judgement of “good” or “bad” is
made. Attributes present are identified and the
intensity quantified. You can analyze the data by
statistical methods, directly correlating them to
instrumental measurements. It is this qualifiable (what’s there) and quantifiable (how much
is there) information that makes descriptive
analysis an invaluable tool in product development, research, quality control, and consumer
studies.
Evaluating Flavor
Both aroma and taste make up flavor—a
critical component in cheese application and
marketing. Extensive research has been conducted with instrumental analysis of flavor
components, but, for now, sensory evaluation
remains the best way to assess cheese flavor.
Developing a standard Cheddar flavor language
Although descriptive sensory analysis is an
extremely useful tool in product development
and research, it can be even more useful. Right
now, standard descriptive language for evaluating cheese doesn’t exist. Instead, researchers in
continued on page 6
5
Difference Tests
These are brief descriptions of some
simple sensory difference tests, often
used to determine product differences, or to select and train panelists
to discern differences.
Triangle test
Each participant has three coded
samples. One is different and two are
identical. Ask them to pick out the
different sample.
industry and academia have used their own descriptors. Terms used by sensory
panels at different sites generally do not have published definitions or references,
making communication difficult and replication of test results very difficult, if not
impossible.
Recently, Dairy Management Inc. funded a project to develop a standard descriptive language for Cheddar cheese, with definitions and references for individual
terms. In the past, researchers have proposed a universal language for describing
Cheddar cheese or cheese in general. However, these studies used very small
sample sets (20 to 30 cheeses) and the language was not developed by cheese
experts. In the present study, a collection of 250 Cheddar cheeses was screened to
generate 70 representative Cheddar cheeses. The cheeses varied by age, and they
came from different geographical regions. A group of cheese experts (n=15) from
industry, government, and academia tasted the cheeses and generated a basic
language of 23 words to describe cheese flavor.
Duo-trio tests
Then, a descriptive panel began to “fine tune” the language and identify standard
Each participant receives a reference references for the terms. These references will allow anyone to easily train a
sample, and two coded samples. Ask
descriptive panel—a panel that evaluates cheeses using the same language as
them to choose the coded sample that other panels.
matches the reference sample.
Using descriptive analysis
The following tests are examples of
attribute difference tests, you can use Two 3-month-old Cheddar blocks
Cheese grade results
were graded by a USDA cheese
them to determine if two or more
grader and evaluated by descriptive
samples differ with respect to a
Cheese 1
A
sl bitter, sl flat
analysis with the Cheddar language. Cheese 2
defined attribute. For example,
A
sl bitter, sl flat
“Which one is sweeter?”
Notice that the cheeses received the
same grade. However, the
Paired preference
graph of the descriptive
A common attribute difference test,
analysis illustrates
used to show which sample has more that these two
of the attribute you are testing.
cheeses have vastly
different flavor
Ranking
profiles. The
differences in
This is one method which you can
flavor profile
use to rank samples according to
between these
intensity of one attribute.
two cheeses
could be very
References
important for
Sensory Evaluation Techniques, M.
product developMeilgaard, D. Sc., G. Civille,B. S., B.T.
ment or end
Carr, M.S.
product applicaCDR Press, Inc. 1991
tion. Using descriptive analysis with the
Cheddar language
Descriptive analysis with Cheddar language
(not all terms are listed)
6
allows us to “profile” the flavor of the cheeses, illustrating
the differences in flavor profiles.
We all know that Americans are consuming more cheese
and a more types of cheese than ever before. To develop new
cheese types, or sell the right cheese to the right market, it’s
essential to determine consumer preference. In 1997, Dairy
Management Inc. conducted a market segmentation study
of cheese consumption. From this study, we know the
market segments of cheese consumption and how the
different segments consume cheese. Using this information,
we could go to any region in the U.S. and characterize the
cheese consumers in that area. We know that regional flavor
preferences exist, but we don’t have reliable valid substantial
information on the flavors that particular market segments
prefer in cheese. By combining market segmentation data
with descriptive sensory analysis with a universal cheese
language, we could determine those preferred flavors.
Applying this information would then allow more specific
“niche” marketing. On the same note, flavor profiling by
descriptive analysis can also help to match the right cheese
with the right consumer or the right buyer for the right
application.
Sensory analysis is an extremely powerful tool with multiple
dimensions and many applications in the cheese industry.
Using analytical descriptive sensory tools to identify and
quantitate all flavors in cheese can provide critical information for product development, research, quality control, and
marketing.
Acknowledgements
This is a condensed version of a talk presented at the 1999
Marschall Cheese Seminar in Santa Clara, California,
reprinted with permission.
Thanks is extended to Dairy Management, Inc. for funding
parts of the research presented. Thanks to Mark Smith,
Steve Wright and Rhodia, Inc. for their support of the
Cheddar flavor language.
Sensory language—FAQ’s
Q. Is sensory language proprietary?
A. NO! This is a common question among people new to
sensory analysis and a question that has been previously
posed—and debated in arbitration—in other commodity
areas. You can use a different word for a particular term or
create a foreign language to evaluate your product, but
anyone who knows descriptive analysis would be able to
taste your product and identify the flavors. The flavor of
your cheese is not a secret to your competitors—how you
created or developed that flavor is.
Q.
Can a standard language be developed for cheese
texture or for other types of cheese?
A.
Yes! Once we finish Cheddar flavor language, we will
begin to apply it to other cheese types. We are also developing standard descriptive language for texture.
Q. Does descriptive sensory analysis with the standard
Cheddar language take the place of cheese grading or ADSA
judging?
A.
No! Descriptive analysis with the standard Cheddar
language will give the industry another analytical tool for
research, product development, and marketing. As discussed earlier, grading and judging are useful and have
unique applications. Descriptive analysis with the Cheddar
language provides an additional sensory tool to identify and
quantify specific flavors in cheese without reference to
“good” or “bad”.
Q. What can the Cheddar language do that grading or
ADSA judging does not do?
A. The Cheddar language is a descriptive analysis tool for
flavor profiling. You can use it to identify and quantify all
the flavors in your cheese. You can also apply statistical
analysis to results, which allow you to analyze the data and
identify how sensory descriptors relate to chemical compounds, instrumental analyses, and consumer preference.
With grading and judging, only defects are identified and
statistical analysis cannot be conducted.
7
News from CDR
All the folks who work at CDR have been getting a head start on
seasonal indulgences—we’ve been tasting shortbread, brownies, cakes
and cookies made in the Applications Lab. It’s all due to Kathy Nelson,
recently hired Research Specialist, who has been testing milkfat
fraction formulations. When she is done with her analysis, the products
are ours to sample, and they have been worth sampling!
Kathy earned a Masters degree in Food Science at UW-Madison in 1989
and moved to Minneapolis to work at Pillsbury as a product scientist in
the Baked Goods section. She left the corporate world take classes at the
Culinary Institute in New York before opening her own catering business.
Kathy notes that she really enjoyed the cooking but her business skills
didn’t match up to her cooking prowess. She enjoys working at CDR, a
setting that provides an ideal combination of science and culinary skill.
Aren’t you glad you listened to your Mom when she said, “Drink your
milk”? Mom was right. Dairy ingredients provide essential nutrients
and offer unique functional attributes to foods. The article “Dairy
Ingredients for Health” written by Kimberlee J. Burrington appears as the
cover story in Food Product Design, October 1999 issue. The article explores
the components and derivatives of milk and tells why it does a body good. To
read the article in it’s entirety, check out the editorial library at
www.foodproductdesign.com
Wisconsin Process Cheese Seminar
February 22-23, 2000
Babcock Hall
Madison, Wisconsin
The Wisconsin Process Cheese Short Course is a two-day hands-on short
course designed to cover the basics of formulation and manufacture of
pasteurized process and cold-pack cheese products. This course will begin
with the basic theories and chemistry of process cheese manufacture and will
include the practical aspects of process cheese making. The
hands-on laboratory sessions will cover the manufacture of
various process cheese products. For more information
contact Jim Path at (608)262-2253 or Bill Wendorff
(608) 263-2015.
Sponsored by:
University of Wisconsin-Madison Center for
Dairy Research, Department of Food Science and
Cooperative Extension Service, College of
Agricultural & Life Sciences
8
Economic Analysis of Cheese Yield
In 1992 researchers at the Wisconsin Center for Dairy Research developed a
computer program, CHYIELD© that cheese makers could use to analyze
alternative milk standardization procedures. CHYIELD© worked well, but
after a few years, it was clear that we needed to improve it. For
example, there was no internal check of the protein or solids
contents of standardized cheese milk. This is particularly
important when you add high protein dry products, such as
NFDM, as your standardizing agent. Also, CHYIELD©
paid little attention to obtaining a detailed mass balance
of supply versus utilization of the components of the
cheese milk. In addition, the ability to produce alternative
types of by-products was limited. A major limitation of
CHYIELD© was that it was a DOS-based program and
unable to use many features of Windows© programs.
In 1998, we decided to revamp CHYIELD© to overcome the
shortcomings listed above. We call our new program EACY©
(Economic Analysis of Cheese Yield). All the features in the
original program are incorporated within EACY© which is a
native Windows program that runs under Windows 95, Windows
98 and Windows NT. We have also added many new features. For
example, EACY© allows the user to limit the maximum solids content of
the standardized cheese milk. If this limit is reached, the program automatically
adds water to the standardization agent to reduce the solids content. The user
can also specify the total solids percentage of the standard agent when the total
solids limit is in effect. Again, water is added so the standardization agent does
not have excessive solids. The profile of the modified standardization agent is
displayed automatically by the program.
Current status of EACY©
We are developing an on-line help system for EACY© as
well as a user’s manual. We are also beta testing the
software with the help of volunteer Wisconsin cheese
manufacturers. We need more volunteer firms to
improve the quality of EACY©. If your firm would like to
obtain a beta version of EACY© in exchange for providing feedback, please contact Brian Gould using the
email address below. After participating in this beta
testing, your firm will receive a free copy of the final
version of EACY© as well as free upgrades for a year. If
you are interested contact:
Dr. Brian W. Gould
Wisconsin Center for Dairy Research
(608) 263-3212
[email protected]
9
Curd Clinic
Curd clinic doctor for this
issue is John Lucey,
assistant professor of
Food Science, UW-Madison
Questions for the Curd Clinic?
Write to:
CDR, UW Dairy Pipeline
1605 Linden Dr.
Madison, WI 53706
FAX: 608/262-1578
e-mail: [email protected]
Factors that
affect “watering off’
Structure:
low pH
excessive proteolysis
high MNFS, high fat
Temperature:
high storage temperatures
Time:
salt gradients after brining
proteolysis
Q. I’ve noticed that some packaged cheeses seem to “leak” fluid into
the package. What causes this problem and how can I prevent it?
A. Although little information has been published about this problem,
some cheeses do indeed exude whey (“watering-off ”) after manufacture. In general, watering-off is more commonly observed in low pH, or
high acid cheeses such as Cheshire, Feta and young Blue. This a
physico-chemical problem, generally related to the inability of the
cheese structure to retain all moisture.
Structure, temperature and time all contribute to the problem of “free
water” (technically it’s “free serum”). Cheese is a casein-based matrix
made from aggregated casein particles which fuse to form a firm
network structure. This matrix is responsible for the texture and water
holding ability of cheese. Mineral and salt content, pH, moisture and
levels of proteolysis all influence the structural matrix.
Cheese needs an appropriate structure to retain all the moisture during
storage since much of that moisture is physically retained within the
cheese matrix. If the pH is too low, or there is excessive proteolysis, then
the cheese can become crumbly. Now it is physically less able to retain
moisture. In cheese with a high fat content or a high moisture content,
(high moisture in the nonfat solids, or MNFS) there is more “stress” on
the cheese which influences its ability to retain moisture and, possibly,
proteolysis.
Storage temperature also influences watering off. At high temperatures,
cheese becomes softer and curd strands/junctions may decrease in size
and strength. This is caused by strengthening of internal hydrophobic
interactions within the casein particles. You can easily see this effect in
some yogurts, which can water off when left out at room temperature—return it to the refrigerator to chill and the water can be absorbed.
Time is another factor. Long storage times affect susceptible cheeses
because they allow the opportunity for breakdown of the structure,
once again impairing the ability to retain moisture. Additionally, the
larger the cheese block, the more time that is required for salt and
moisture equilibrium. The cheese may continue to lose moisture (to the
surface) after manufacture. If the cheese is already wrapped, then this
moisture accumulates inside the package. Late acid development (in
the block) might also be involved in this defect.
Many traditional brine salted cheeses lose moisture by evaporation
during storage. If wax or plasticoat is used, it is applied after the cheese
surface has (partially) dried out. However, rindless cheeses are increasing in popularity. Replacing the rind with packaging material means
that surface moisture might accumulate inside the packaging material.
10
You may need to make these cheeses with a lower moisture content than
rindless cheese, or you may need to allow enough time to lose any “free”
moisture before you package the cheese.
Parmesan provides a good example. If it is dry salted and shelf-dried
properly, then you won’t see any watering off. However, vacuum packed
Parmesan can cause some trouble. Try letting it dry longer before you
package it, check the humidity in your ripening room, and consider
better whey drainage during manufacture.
Blue cheese, a high salt, high moisture
cheese, begins with a high acid curd that
may have more moisture than the
cheese can absorb. The cheese
surface usually dries out in the
storage room. However, when
you package the cheese you
may see some watering off,
especially if the moisture is
too high and you haven’t
allowed enough time for
drying.
Panela is a high acid, salty
Hispanic cheese that easily
waters off at room temperature. However, panela is most often used as a
cooking cheese. The slightly sweet flavor of lactose on the cheese surface
is an expected flavor that also browns when the cheese is fried—all part
of the panela experience!
Watering off can be problem anytime packaged cheese is stored inappropriately at a temperature that is too high. If you can rule that out as
the cause, then you need to look at moisture retention in your cheese.
For an indepth discussion of the role of casein, review the Spring 99
issue of the Dairy Pipeline.
11
Calendar
Feb. 1-2 Wisconsin Dairy Field Reps Conference. Madison, WI. Call Bill
Wendorff at (608) 263-2015.
Feb. 22-23 Wisconsin Process Cheese Short Course. Madison, WI. Call Jim
Path at (608) 262-2253 or Bill Wendorff at (608) 263-2015 for more details.
Mar. 14 Wisconsin CIP Workshop, Madison, WI. Call Bill Wendorff at (608)
263-2015.
Mar. 15 Dairy HACCP Workshop, Madison, WI. Call Marianne Smukowski at
(608) 265-6346.
Mar. 27-31 Wisconsin Cheese Technology Short Course, Madison, WI Call
Bill Wendorff at (608) 263-2015.
Apr. 5 WDPA Butter & Cheese Evaluation Clinic, Wis. Dells, WI. For
information, call Brad Legreid at (608) 836-3334.
Apr. 11-12 Master Starter Culture Seminar, Madison, WI. Call Jim Path at
(608) 262-2253.
Apr. 11-14 Basic Cheesemaker’s License Short Course, River Falls, WI. Call
Ranee May for further info at (715) 425-3150.
Apr. 26-27 International Cheese Technology Expo, Madison, WI. For
information, call Judy Keller at (608) 255-2027.
May 2-3 Whey and Whey Utilization Short Course, Madison, WI. Call Bill
Wendorff at (608) 263-2015.
May 17-18 Applied Dairy Chemistry Short Course, Madison, WI. Call Bill
Wendorff at (608) 263-2015.
June 6-7 Wisconsin Cheese Grading Short Course, Madison, WI. Call Bill
Wendorff at (608) 263-2015.
Wisconsin Center for Dairy Research
CDR
University of Wisconsin-Madison
1605 Linden Drive
Madison, Wisconsin 53706-1565
ADDRESS SERVICE REQUESTED
CDR
Dairy
Pipeline
The Dairy Pipeline
Center for Dairy Research
1605 Linden Dr.
Madison, WI 53706
phone: 608/262-5970
fax: 608/262-1578
Karen Paulus, Editor
Technical Reviewers:
Mark Johnson, CDR
Norm Olson, Dept. of Food Science
Jim Path, CDR
Marianne Smukowski, CDR
Tom Szalkucki, CDR
Karen Smith, CDR
Bill Wendorff, Dept. of Food Science
The Dairy Pipeline is published by the
Center for Dairy Research and funded by
the Wisconsin Milk Marketing Board.
To subscribe to the Pipeline simply
phone, fax, or e-mail your request to
CDR. (Form on page 11) We welcome
your questions and comments. Send
them to:
Karen Paulus, Editor
e-mail: [email protected]
phone: 608/262-8015
You can also find the Dairy Pipeline on
our website: www.cdr.wisc.edu
Nonprofit Org.
U.S. Postage
PAID
Madison, WI
Permit No. 658