1
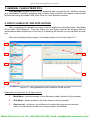
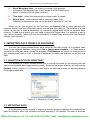
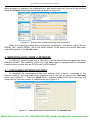
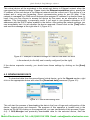
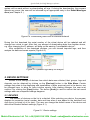
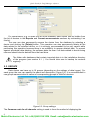
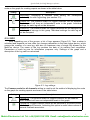
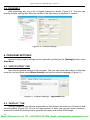
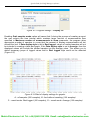
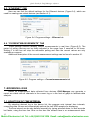
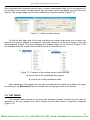
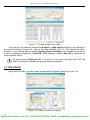
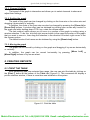
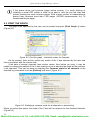
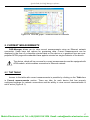
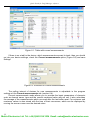
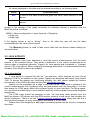
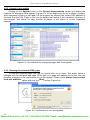
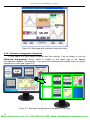
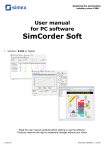
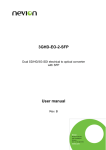
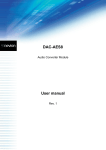
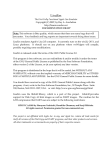
Assisting the automation
industry since 1986
Quick Guide for
DAQ Manager
software
•
Version:1.2.4 or higher
Read the user manual carefully before starting to use the software.
Producer reserves the right to implement changes without prior notice.
16.06.2011
DAQ Manager_QGUSEN_v.1.03.000
Quick Guide for DAQ Manager software
CONTENTS
1. GENERAL CHARACTERISTICS................................................................................................................3
2. FIRST LAUNCH OF THE APPLICATION...................................................................................................3
3. IMPORTING DATA FROM A FLASH DRIVE.............................................................................................4
3.1. SELECTION OF DATA DIRECTORY................................................................................................4
3.2. IMPORTING DATA.............................................................................................................................4
4. IMPORTING DATA FROM A NETWORK...................................................................................................5
4.1. CONFIGURING NETWORK SETTINGS...........................................................................................5
4.2. DOWNLOADING DATA.....................................................................................................................6
5. DEVICE SETTINGS.....................................................................................................................................7
5.1. DEVICES............................................................................................................................................7
5.2. GROUPS............................................................................................................................................8
5.3. LOGS..................................................................................................................................................9
5.4. CHANNELS......................................................................................................................................10
6. PROGRAM SETTINGS.............................................................................................................................10
6.1. “APPLICATION” TAB.......................................................................................................................10
6.2. “DISPLAY” TAB................................................................................................................................10
6.3. “ETHERNET” TAB............................................................................................................................12
6.4. “CURRENT MEASUREMENTS” TAB..............................................................................................12
7. BROWSING LOGS....................................................................................................................................12
7.1. SELECTION OF TIME INTERVAL...................................................................................................12
7.2. THE TABLE......................................................................................................................................13
7.3. THE GRAPH.....................................................................................................................................14
7.3.1. Channel Visibility.....................................................................................................................15
7.3.2. Scaling the graph....................................................................................................................15
7.3.3. Moving the graph.....................................................................................................................15
8. CREATING REPORTS..............................................................................................................................15
8.1. PRINT THE TABLE..........................................................................................................................15
8.2. PRINT THE GRAPH.........................................................................................................................16
9. CURRENT MEASUREMENTS..................................................................................................................17
9.1. THE TABLE......................................................................................................................................17
9.2. JAVA APPLETS...............................................................................................................................19
9.2.1. Introduction..............................................................................................................................19
9.2.2. Access to the applets..............................................................................................................20
9.2.3. Running the selected HTML page..........................................................................................20
9.2.4. Window with a HTML page.....................................................................................................21
9.2.5. Automatic arrangement of windows........................................................................................22
Explanation of symbols used in the manual:
!
i
This symbol denotes especially important characteristics of the software operation.
Read any information regarding this symbol carefully.
This symbol indicates additional information that may help operate the program.
2
Metrix Electronics Ltd Tel: +44 (0)845 034 3234 Email: [email protected]
Quick Guide for DAQ Manager software
1. GENERAL CHARACTERISTICS
DAQ Manager software allows you to download data recorded by the MultiCon devices
(e.g. temperature, humidity, pressure) and visualize them as tables and graphs. Data transfer
is performed using a portable USB Flash Drive or via an Ethernet network.
2. FIRST LAUNCH OF THE APPLICATION
After completing the installation process, start the application from the system Start Menu
in the folder “DAQ Manager”. From this folder you can safely uninstall the program and the
measurement data archived up to the time of uninstalling will remain on your hard disk for later
use.
After first launching of the program, the window shown will look like Figure 2.1.
1
5
2
3
6
4
Figure 2.1. The appearance of the interface on the first run
Explanation of elements in the figure above:
1 - Main Menu - provides access to less frequently used functions of the program;
2 - Side Menu - allows access to the main functions of the program;
3 - Devices List - contains a list of devices for which the program has archived
data or virtual devices created for communication via Ethernet;
3
Metrix Electronics Ltd Tel: +44 (0)845 034 3234 Email: [email protected]
Quick Guide for DAQ Manager software
4 - Event Messages Area – list events occurring in the program;
Information that appears here is also saved to a file ”EventLog.txt”,
which is located in the program directory.
5 - Time Area – select the time period to create a table or graph;
6 - Report Area – view selected data in table and graph form;
Displayed measurement data can be printed or exported to *.csv file.
When you run the program for the first time, the Devices List is empty because the
program doesn't have any information about devices and their data yet. The creation of a new
device on the list is done automatically by importing logged data saved on portable flash
memory. To add a new device you only need to import its logged data. It is possible to add a
new device manually, which will give the possibility to import data directly from the Ethernet
network (see section 4. ).
3. IMPORTING DATA FROM A FLASH DRIVE
The user can import measurement data, saved by the data logger on a portable flash
drive, to the software database using menu File > Import measurements.... If a flash drive is
inserted into USB port while running the program, DAQ Manager will check its contents and if
any measurement data is find, a window is displayed to select the directory to get the new
data.
3.1. SELECTION OF DATA DIRECTORY
The “Browse for Folder” window allows you to choose the folder of one device (with the
name of the specific data logger serial number). Selecting the proper directory will activate the
[Import] button (Figure 3.1). Clicking on this button will start the process of importing data to
the program database.
Figure 3.1. “Browse for Folder” window
3.2. IMPORTING DATA
At the beginning of the process of importing data the program analyses the measurement
data for changes. After that, software performs importing if it's needed. The user is informed
4
Metrix Electronics Ltd Tel: +44 (0)845 034 3234 Email: [email protected]
Quick Guide for DAQ Manager software
about progress of operation via a dialogue box, and should wait until the end of the process
(when the [Close] button becomes active) as shown in Figure 3.2.
Figure 3.2. The process of data importing was completed
When the importing process was successfully completed a new device called “Device
SERIAL_NO” (where SERIAL_NO is the serial number of the device from which data were
collected) appears in the Devices List.
4. IMPORTING DATA FROM A NETWORK
In addition to importing data from a flash drive, you can also download logged files via an
Ethernet network. This possibility exists only if the data logger is equipped with an advanced
communication module with an RJ-45 socket (ACM module).
4.1. CONFIGURING NETWORK SETTINGS
To download the measurement data and settings from a device, connected to the
Ethernet network, you must add a new undefined one to the list, by going to the [Devices]
button (see section 5. ). Then click [Add] button. A device added to the list in this way is a
virtual device; its serial number is undetermined yet (Figure 4.1).
Figure 4.1. Adding the new virtual device to the Devices List
5
Metrix Electronics Ltd Tel: +44 (0)845 034 3234 Email: [email protected]
Quick Guide for DAQ Manager software
This virtual device will be equivalent to the actual real device in Ethernet network when the
user specifies its network settings. Please check the Ethernet capabilities option, specify the
IP address of the real device in the Ethernet network and the correct port if the device is in a
subnet and is using port forwarding. Direct communication works on port 80 (http). If the
network is managed by a DNS server that specifies assigned IP address to a domain name (or
host), then you can choose to access the device by this name, as an alternative to an IP
address. This functionality is especially useful if you want to use dynamic allocation of IP
addresses with the DHCP option enabled in the device. After setting the network settings, you
can immediately test it to see whether the device responds. Please click on the [Test] button
and read the message at the right side of it (Figure 4.2).
Figure 4.2. Example of network settings for a device that does not exist
in the network (on the left) and correctly configured (on the right)
If the device responds correctly, you should save these settings by clicking on the [Save]
button.
4.2. DOWNLOADING DATA
To download data from the preconfigured virtual device, go to the Reports section, right
click on the appropriate device and select the [Download data] command (Figure 4.3).
Figure 4.3. Start downloading data
This will start the process of downloading the data in the form of logs and configuration of the
device, logged groups and channels. The progress of this operation is located next to the
device on the list. By clicking on the progress bar, you can view details of this process (Figure
4.4). If DAQ Manager has previously downloaded data for the selected device, then the
6
Metrix Electronics Ltd Tel: +44 (0)845 034 3234 Email: [email protected]
Quick Guide for DAQ Manager software
update will be made without re-downloading all logs. If during the downloading, the program
detects any errors, the user will be informed by an appropriate entry in the Event Messages
Area (see Chapter 2. ).
Figure 4.4. Downloading data from an Ethernet network
During the first download the serial number of the virtual device will be updated and will
change from virtual to real. After that, any attempt of downloading data from another device,
e.g. after changing the IP address, will bring up the warning “Incompatible device!”.
After completion of the download process, you can choose imported logs, and then
analyse the data and create reports (Figure 4.5).
Figure 4.5. Updated logs ready for analysis
5. DEVICE SETTINGS
Access to the settings of devices from which data was collected, their groups, logs and
channels can be obtained by clicking on the [Devices] button in the Side Menu. Certain
settings that relate to the displaying and visualization of data, previously set in the device, can
be changed here, to allow for more intuitive reports. After making changes, the user must
confirm it by clicking the [Save] button. The button [Undo] is used to restore the last saved
settings when an unexpected change happens.
5.1. DEVICES
The number of devices on the list is unlimited. After selecting one device, the program
displays its properties (serial number, date and time when it was added to the database and
disk space occupied by all its data). The user can change the default name of the device and
define the Ethernet Network settings (Figure 5.1).
Figure 5.1. Device settings
7
Metrix Electronics Ltd Tel: +44 (0)845 034 3234 Email: [email protected]
Quick Guide for DAQ Manager software
For convenience (e.g. to make the list more readable) each device can be hidden from
the list of devices in the Reports and Current measurements sections by unchecking it on
this list.
The user can also permanently remove the device from the database by selecting a
device and clicking the [Delete] button. This operation can also permanently delete all the
data related to the selected device, so It is strongly recommended to be very careful while
performing this operation because there is no possibility to recover deleted data. To prevent
against accidental data deleting, the software asks the user if all data related to device being
removed should also be deleted from the hard drive.
!
The folder with databases that contain imported data is in the installation directory
of the program (see section 6.1. ). You should take care to backup its contents
regularly.
5.2. GROUPS
Each device can have up to 10 groups (depending on the settings of data logger). For
each group the user can specify the name and description (Figure 5.2). It is recommended to
use groups names similar to names of corresponding groups in MultiCon devices.
Figure 5.2. Group settings
The Common scale for all channels setting is used to force the method of displaying the
8
Metrix Electronics Ltd Tel: +44 (0)845 034 3234 Email: [email protected]
Quick Guide for DAQ Manager software
scale on the graph for creating reports as shown in the table below.
Setting
(default)
Description
Individually: Displaying a common scale setting will correspond
individually for each log setting (see section 5.3).
Turned Off: The common scale for logged channels will be disabled.
Each channel will have an independent scale in the graph. Individual
settings for each log will not be accepted.
Turned On: The common scale for logged channels will be displayed for
each log that belongs to this group. Individual settings for each log will
not be accepted.
5.3. LOGS
After expanding one of the groups, a list of logs appears (Figure 5.3). Their number is
unlimited and depends on how often you change parameters in the data logger device, which
causes the creation of a new log, and also on maximum size of single log allowed by the
MultiCon device. The name of the log contains the date of its creation and completion.
Parameters of each log are for information purposes only. Settings of the graph and a
description of the log can be customized.
Figure 5.3. Log settings
The Common scale for all channels setting is used to set the method of displaying the scale
on the graph for creating reports as shown in the table below.
Setting
(default)
Description
Turned Off: The common scale for logged channels will be disabled.
Each channel will have an independent scale in the graph.
Turned On: Logged channel values will be rescaled to a common scale
of all displayed channels. Activating this option is useful when values of
several channels are similar.
9
Metrix Electronics Ltd Tel: +44 (0)845 034 3234 Email: [email protected]
Quick Guide for DAQ Manager software
5.4. CHANNELS
After expanding any log, a list of logged channels is shown (Figure 5.4). The user can
specify multiple settings that affect the format of the data which is displayed in reports.
Figure 5.4. Channel settings
6. PROGRAM SETTINGS
Access to the program settings can be reached by clicking on the [Settings] button in the
Side Menu.
6.1. “APPLICATION” TAB
Here are the general settings of the program. The user can check the location of the data
stored on his hard drive under Bases directory and set the interface language (Figure 6.1).
Figure 6.1. Program settings – Application tab
6.2. “DISPLAY” TAB
Settings located on this tab are responsible for how data is retrieved from the archive and
its presentation (Figure 6.2). Due to the large amount of data, user can set some limitations,
which will shorten the waiting time to generate the report and reduce RAM usage.
10
Metrix Electronics Ltd Tel: +44 (0)845 034 3234 Email: [email protected]
Quick Guide for DAQ Manager software
Figure 6.2. Program settings – Display tab
Enabling Omit samples mode option will cause that if during the process of creating a report
the user selects the time interval which contains larger amount of measurements than
specified in Maximum number of measurements to show parameter, the program skips
appropriate number of samples in a way that the amount of display measurements will not
exceed the limit. If Data display style is set to Real logged, values of omitted samples will not
be included in creating a table and graph. If the Data display style is set to Average, then the
displayed values will include the omitted samples as the average value. This allows you to
detect temporary jumps of logged values that in Real logged style could not be detected
(Figure 6.3).
Figure 6.3. Effect of display settings for graphs:
A - all samples (200 samples), B - limit without ommiting (100 samples)
C – ommit mode: Real logged (100 samples), D – ommit mode: Average (100 samples)
11
Metrix Electronics Ltd Tel: +44 (0)845 034 3234 Email: [email protected]
Quick Guide for DAQ Manager software
6.3. “ETHERNET” TAB
Here we can find the default settings for the Ethernet devices (Figure 6.4), which are
used for creating new virtual devices (see section 4.1).
Figure 6.4. Program settings – Ethernet tab
6.4. “CURRENT MEASUREMENTS” TAB
These settings concern reading current measurements in real time (Figure 6.5). The
period of polling devices can be freely adjusted in the range from 3 seconds to 24 hours.
Setting 0 in this box will stop the automatic polling and then the current values are only
available on request.
Additional description of the current measurement settings can be found in section 9.1.
Figure 6.5. Program settings – Current measurements tab
7. BROWSING LOGS
Based on measurement data collected from devices, DAQ Manager can generate a
report as a table with all channels in the current log or in the form of graph to facilitate data
analysis.
7.1. SELECTION OF TIME INTERVAL
By selecting desired log in the device list, the program sets internal time intervals,
computing data volume and automatically selects the last 3000 samples for displaying.
The time interval can be also defined manually by typing selected dates, or less accurate
but faster, using the time line. Blue on the time line means there is no measurement data.
12
Metrix Electronics Ltd Tel: +44 (0)845 034 3234 Email: [email protected]
Quick Guide for DAQ Manager software
Gray indicates that during this period there is some measurement data, but is not selected to
be included in the report. Orange means that the report will be generated just from this time
interval. The orange range can be freely modified by using the mouse (Figure 7.1).
Figure 7.1. Choice of time interval
On the left and right side of the time line there are buttons that allows you to move the
specific time period forward or backward. Automatic selection of the time range of the last
measurements (Figure 7.2.a) and changing the viewable region of the time line (Figure 7.2.b)
are available from the context menu of the time line or down-arrow icon.
a)
b)
Figure 7.2. Contents of the context menu of the time line:
a) choice one of the predefined time ranges
b) choice one of the predefined views
After selecting a time range, the user can now generate the report as a table or a graph
by clicking on the [Generate] button or double-click on any log on the list of devices.
7.2. THE TABLE
The created table consists of columns with measure number counted from the time of
activation of the log, sample time (time stamp) and the data values of particular channels
(Figure 7.3).
13
Metrix Electronics Ltd Tel: +44 (0)845 034 3234 Email: [email protected]
Quick Guide for DAQ Manager software
Figure 7.3. Create a report as a table
If the value in the channel exceeds Low Value or High Value specified in the settings of
the selected channel (Figure 5.4), then in the table displays “[LO]” or “[HI]” beside the value.
However, if the channel has the setting Display Format as Binary, then instead of real value,
a label is displayed (defined by Label ON / OFF settings), where Label ON is accepted for
values greater than 0.
i
By pressing the [Export to file …] button You can save the table as a CSV file
which can then be opened with any spreadsheet program.
7.3. THE GRAPH
Along with the table, you can create a graph with all logged channels (Figure 7.4).
Figure 7.4. Create a report as a graph
14
Metrix Electronics Ltd Tel: +44 (0)845 034 3234 Email: [email protected]
Quick Guide for DAQ Manager software
7.3.1. Channel Visibility
The legend of the graph is interactive and allows you to select channels to show and
adjust their settings.
7.3.2. Scaling the graph
The scale of the graph can be changed by clicking on the time axis or the value axis and
dragging it horizontally or vertically.
In addition, the scale of the time axis can also be changed by pressing the [Zoom In] or
[Zoom Out] buttons. A similar effect can be obtained by pointing your mouse any location in
the graph and while holding down CTRL key, rotate the mouse wheel.
The last method, which allows you to zoom in a portion of the graph is scaling using a
window selection. To do this, click the right mouse button in the upper left portion of the graph,
that you want to zoom in, then drag the selection in the direction of bottom right corner of the
the chosen portion.
The default scale of both axes can be obtained by using the [Reset view] button.
7.3.3. Moving the graph
The graph can be moved by clicking on the graph and dragging it by mouse horizontally
or vertically.
In addition, the graph can be moved horizontally by pressing [Move Left] or
[Move Right] buttons or by mouse wheel.
8. CREATING REPORTS
8.1. PRINT THE TABLE
After generating data from selected time range, the user can print the table by clicking on
the [Print...] button at the bottom of the Table tab (Figure 8.1). This command will display a
printer selection window, if there is more than one installed on the system.
Figure 8.1. Print the table
15
Metrix Electronics Ltd Tel: +44 (0)845 034 3234 Email: [email protected]
Quick Guide for DAQ Manager software
i
If the printer driver can't preview pages before printing, it is worth thinking of
installing a virtual PDF printer in order to be able to view the prin ted copy and
prevent printing too many incorrect pages. With a large number of measurements
printout may consume more than 1300 pages (100,000 measurements, A4, 76
measurements per page).
8.2. PRINT THE GRAPH
The graph view specified by the user can be printed using the [Print Graph...] button
(Figure 8.2).
Figure 8.2. Print the graph - individual scales for channels
On the printout, there will be visible only scales of the Y-axis selected by the user and
this is consistent with the current view.
If the data of several channels have similar values, then before you print, it may be
helpful to change the method of the Y-axis scaling in such a way that the scale will be common
to all channels. This can be done by selecting the Common scale for all channels in the
selected log, accessible from the [Devices] side menu (Figure 8.3)
Figure 8.3. Enabling a common scale for all channels in selected log
When you select this option, the scale of the Y-axis will be common for the checked channels
(Figure 8.4).
16
Metrix Electronics Ltd Tel: +44 (0)845 034 3234 Email: [email protected]
Quick Guide for DAQ Manager software
Figure 8.4. Print the graph - common scale for channels
9. CURRENT MEASUREMENTS
DAQ Manager allows you to view current measurements using an Ethernet network
connection. Users have two options for previewing data. Current measurements can be
displayed in the form of a channels oriented table on the device or in graphical form as a preprepared HTML page with embedded Java applets oriented on single channels of the device.
!
The device, which will be a source for current measurements must be equipped with
ACM module, which enables connection to Ethernet network.
9.1. THE TABLE
Access to the table with current measurements is possible by clicking on the Table item
in Current measurements section. There are tabs for each device that has properly
configured settings for network connections and the ability to view current measurements is
set to active (Figure 9.1).
17
Metrix Electronics Ltd Tel: +44 (0)845 034 3234 Email: [email protected]
Quick Guide for DAQ Manager software
Figure 9.1. Table with current measurements
If there is no a tab for the device, which measurements we want to track, then you should
go into your device settings, check the Current measurements option (Figure 9.2) and save
settings.
Figure 9.2. Activation of current measurements
The polling interval of devices for new measurements is adjustable in the program
settings on the Current measurements tab (section 6.4).
Current measurements mode allows you to preview the basic parameters of channels
such as channel name, type and the current measured value with set unit. It also calculates
the average of the measurements which occurred after the last buffer reset. For minimum and
maximum values is also stored with the time of their occurrence, which can be displayed by
moving the mouse cursor over the desired value.
18
Metrix Electronics Ltd Tel: +44 (0)845 034 3234 Email: [email protected]
Quick Guide for DAQ Manager software
All values displayed in the table may be marked according to the following table:
Colour
Event Description
blue
A value in the table is below the graph low value, which was set in the
device.
red
A value in the table is above the graph high value, which was set in the
device.
Access to the settings of the graph thresholds for selected channel is possible from the
MultiCon device as follows:
MENU > Device configuration > Input channels > Displaying
> Graph low
> Graph high
If the display format is set to “binary”, then in the table the user will see the label
corresponding to the value of the channel.
The [Measure] button is used to take recent data from the device without waiting for
automatic read.
9.2. JAVA APPLETS
Java applets have been designed to read the current measurements from the each
channel of the selected device. They allows visualization of the current measurements as
various types of graphical indicators. Support for Java applets was introduced in firmware
version 2.30 of the device. Before reading the following description it is recommended that the
firmware of the MultiCon device be updated.
9.2.1. Introduction
A Java applet is a special file with the *.jar extension, which requires the Java Virtual
Machine (JVM) to be installed on the system. Applets are designed and tested using Oracle
JVM. To ensure the applets are functioning properly, the user should update the runtime
environment of the JVM to the latest version from http://www.java.com.
Applets can be embedded on a page of any Web server. This allows a preview of the
current measurements from anywhere using any web browser with the Java plug-in. You can
also design an HTML page, which will be placed locally on your hard disk. For this purpose,
you can create a subdirectory in the installation directory of the program and put the designed
pages there.
The HTML page should be designed so that *.jar files were taken directly from the
MultiCon devices. All devices with the ACM module contains a web server that provides the
device information. There is the link “Logical channels graphical view” where you can find a
fully functional example of using Java applets embedded in HTML page.
Details about the designing of web pages containing applets can be found in a separate
document.
19
Metrix Electronics Ltd Tel: +44 (0)845 034 3234 Email: [email protected]
Quick Guide for DAQ Manager software
9.2.2. Access to the applets
Clicking on the Applets button in the Current measurements section will display the
interface for managing Java applets (Figure 9.3). At the beginning, the list of pages is empty.
After designing a page you can add it to the program by entering the correct URL address or
the path to a local file. Paths to files can be defined as relative to the installation directory of
the program. This allows for easy transfer all pages, in the future, to a new installation
directory.
Figure 9.3. The interface for managing pages with Java applets
9.2.3. Running the selected HTML page
To view the selected page from the list, double-click on its name. This action opens a
dialogue with the designed web page. When you run a page with applets for the first time, the
program prompts you for confirmation to run the applets. Please check Always trust content
from this publisher option and click the [Run] button (Figure 9.4).
Figure 9.4. Confirmation to run Java applets
20
Metrix Electronics Ltd Tel: +44 (0)845 034 3234 Email: [email protected]
Quick Guide for DAQ Manager software
9.2.4. Window with a HTML page
When the page with the applets is fully loaded and the applets connected to the devices,
the user will have the ability to view measurements in real time. The right side of the window
contains the most commonly used operations to help manage the preview window (Figure
9.5). You can scale the page, automatically adjust the size of the window and bring to front the
main window. Additional commands can be found in the context menu of the page.
Figure 9.5. A window with a sample HTML page
The default appearance of the indicators is defined on the design level of the HTML
page. The context menu for each indicator allows temporary changes of its appearance and
provides additional commands for its handling.
If the user does not have a web page designed to his needs, he may use the universal
view of all channels taking a page directly from the MultiCon device, which is mentioned in
section 9.2.1. Examples of URLs for this case could be found on Figure 9.3 under the name
”MultiCon Direct”. A web page with indicators taken directly from the device makes it possible
to view all of its channels and allows easy change the display mode (Figure 9.6).
21
Metrix Electronics Ltd Tel: +44 (0)845 034 3234 Email: [email protected]
Quick Guide for DAQ Manager software
Figure 9.6. Web page with indicators from the device
9.2.5. Automatic arrangement of windows
If user opens too many applet windows and they overlap, it will be helpful to use the
[Windows arrangement] button, which is located in the upper part of the applets
management interface. For example, if you open seven windows that overlap, they can quickly
spread out in a 4x2 grid (Figure 9.7).
Figure 9.7. Automatic arrangement of windows in a 4x2 grid
22
Metrix Electronics Ltd Tel: +44 (0)845 034 3234 Email: [email protected]
Quick Guide for DAQ Manager software
System requirements:
Operating System: Windows XP (32-bit) or later
Processor Pentium / AMD 600 MHz or faster
128 MB of RAM or more
2 GB or more free disk space
Monitor with min. resolution SVGA (800x600)
CD-ROM or DVD-ROM
Keyboard and pointing device (e.g. mouse)
23
Metrix Electronics Ltd Tel: +44 (0)845 034 3234 Email: [email protected]
SIMEX Sp. z o.o. , ul. Wielopole 7
PL - 80-556 Gdańsk, Poland
tel. : (+48 58) 762-07-77, fax: (+48 58) 762-07-70
http://www.simex.com.pl, e-mail: [email protected]