1
Draft
INTRODUCTION
X-1
PUMP APPLICATIONS
X-1
PUMP TANKS
X-4
PUMP TYPES
X-8
PUMP CONTROLS
X-8
PUMP PRESSURE AND FLOW
X-11
PUMP DISCHARGE CURVE
X-12
SELECT THE PUMP FOR THE APPLICATION
X-15
ENERGY REQUIREMENTS
X-16
PRESSURE DISTRIBUTION NETWORK
X-17
PRESSURE DISTRIBUTION NETWORK DESIGN
X-18
Draft
Pipe Network Design Steps
X-18
Sizing the Pump or Siphon
X-21
DESIGN EXAMPLE
X-22
Distribution Network Design Steps
X-22
Force Main, Pressurization Unit, Dose Tank and Controls Design Steps
X-24
Draft
LOW PRESSURE PIPE SYSTEM
Components
X-27
X-27
Performance Testing
X-29
Maintenance
X-32
Low Pressure Pipe Design Example
X-32
SUMMARY
X-34
REFERENCES AND ADDITIONAL READING MATERIALS
X-35
TABLES
X-1. Schedule 40 Plastic Pipe Friction Loss, Diameters, and Volume
X-14
X-2. Orifice Discharge Rates in Gallons per Minute
X-19
Draft
X-3. Friction Loss in PVC Plastic Pipe
X-20
X-4. Head and Calculations for Various Operating Flow and Pressure
X-25
X-5. Void Volume for Various Diameters of Schedule 40 Pipe
X-27
X-6. Orifice Flow Rate (gpm) for Different Sizes and Operating Pressure
X-33
FIGURES
X-1. Pump Used to Lift Wastewater to a Higher Elevation that the Source
X-1
X-2. Pump Discharge Delivery to a Gravity Distribution, Lateral Drop Box
X-3
X-3. Gravity Distribution, Lateral Drop Box
X-4
X-4. Gravity Serves Ground Floor and a Pump Lifts Sewage from Basement
X-5
X-5. Pump Lifts Tank Effluent to a Shallow Absorption Field
X-5
X-6. Pump Lifts Sewage to Shallow Septic Tank for Easy Access
Draft
X-6
X-7. Section of Pump Tank Showing Pump, Wiring, and Float Locations
X-9
X-8. Section of Pump Tank Showing Wiring and Electricity away from House X-10
X-9. Duplex Pump Station has Two Alternating Pumps
X-11
X-10. Example Pump Curves for Four Pumps
X-13
X-11 (11A). Example Problem – Pump Placement
X-15
X-12. Section of Low Pressure Pipe Lateral Indicating Holes for Drainage
X-17
X-13. Graph of Lateral Length, Orifice Spacing, and Pipe Size
X-23
X-14. Plotted System Operating Curve and Pump Curves to Select Pump
X-26
X-15. Typical Pump Tank, Controls, and Pipe Network Components
X-28
X-16. Supply Manifold and Connection to Low Pressure Lateral
X-30
X-17. Detail of Turn-up and Cleanout for Pressure Distribution
X-31
Draft
12/02
PUMPS AND HYDRAULICS
X-1
INTRODUCTION
Pumps are often utilized in onsite wastewater systems to:
$ lift wastewater for improved system location options on a site
$ distribute effluent uniformly
$ time dose an enhanced treatment or soil absorption system component
$ inject air in an aerobic treatment unit (ATU)
$ lift drainage water to lower a water tables
Figure X-1 shows the use of a pump to lift effluent to a soil absorption area at higher
elevation than the wastewater source. This use allows much greater flexability in selection of the
wastewater systems and its location. Whenever a pump is required, the maintenance and
accessibility of the system are critical factors in the continued operation of the system. Pump
stations require careful design, installation, and maintenance by qualified technicians. The pump
equipment and controls should be located in an accessible area and be protected from weather
and vandalism. All components of the pumping station should be watertight and resistant to
corrosion.
Figure X-1. Pump Used to Lift Wastewater to a Higher Elevation than the Source
PUMP APPLICATIONS
Pumping raw sewage requires that the pump be designed to handle the solids found in raw
wastewater. This type of pump has a non-clog impeller and many also have a grinder designed
12/02
PUMPS AND HYDRAULICS
X-2
to grind up tough and stringy solids, such as a rag or wet strength towels to avoid clogging the
pump. Common applications for pumping raw sewage are when a lagoon is at a higher elevation
or plumbing fixtures in a basement must be lifted up to the septic tank placed at the preferred
shallow depth. A grinder pump might typically be chosen to handle all of the household sewage
to pressurize or lift to a higher level. A non-clog sewage pump might be selected to serve fixtures
in the basement such as a bath and laundry. These types of pumps are expensive and require
frequent maintenance to meet service requirements. In addition, these pumps are typically low
head so are designed for a limited lift or head of the wastewater. The vertical distance from the
lowest water level at the pump to the highest point of the discharge is called lift or head (usually
measured in feet). The cost to pump wastewater against high heads can become quite expensive.
However, lifts of 10 to 20 feet with an efficient pump will be a modest price. Most onsite
wastewater systems are designed to minimize the head required for the pump in order to keep the
cost for the pump and its operation reasonable.
The most common type of pumping situation for onsite wastewater systems involves
pumping the septic tank effluent after the solids have been removed and the effluent screened.
For this application the capacity to handle solids is not nearly as important as when pumping raw
sewage. These pumps are classified as effluent pumps and usually use a turbine type impeller.
They are less expensive than non clog or grinder pumps, not subject to clogging because of low
solids, and some models are available to pump against a higher head.
An effluent pump may be used for a low pressure pipe system, to reach an absorption area at
a higher elevation, for drip distribution system, sand or media filter, or simply to provide even
distribution and/or dosing of the effluent. Effluent pumps usually have a screen that covers the
pump intake, and are located following some type of septic tank effluent filter. These filters must
be kept clean to allow the effluent to enter the pump intake. Most of these pumps are designed to
use water as a lubricant and coolant so the pump must not be operated under dry conditions. If
the screens are plugged and water cannot enter the intake, the pump may be damaged.
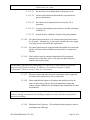
When an effluent pump is used to deliver to a conventional absorption field, flow may
discharge to a drop box as shown in Figure X-2. On a sloping as shown in Figure X-1 water that
upper laterals can not absorb overflows via drop boxes shown in Figure X-3 to lower laterals. In
designing the drop box system the invert (bottom) of the discharge pipe from the pump must be
at least 2 inches higher than the elevation of the supply line to the next drop box. This
arrangement will allow water in the discharge pipe to drain back to the pump tank but will not
allow water from the rest of the absorption field to drain back into the pump. The distribution
box should be arranged so that effluent from the discharge pipe from the pump is directed to the
wall of the drop box, opposite from the inlet pipe. The outlet lines to the absorption field are then
located on the sides of the box at a 90 degree angle from the inlet pipe. If this arrangement is not
carefully designed, flow from the distribution box will not be evenly distributed. If additional
trenches need to be supplied in a pumped system, then a series of drop boxes (see Figure X-3) as
shown in Figure X-1 may be used to direct the flow through the absorption field.
12/02
PUMPS AND HYDRAULICS
X-3
Figure X-2. Pump Discharge Delivery to a Gravity Distribution, Lateral Drop Box
12/02
PUMPS AND HYDRAULICS
X-4
Figure X-3. Gravity Distribution Lateral Drop Box
PUMP TANKS
The pump tank must be watertight and corrosion resistant. Most pump tanks available today
are concrete, fiberglass, or polyethylene. All openings to the tank must be sealed and watertight
to prevent the flow of groundwater or surface water into the tank and also to prevent the flow of
wastewater out of the tank, except through the pump discharge. The pump tank must contain a
minimum volume of water at all times in order to prevent the tank from “floating” when the
ground is saturated. The pump inside the tank should be elevated above the bottom of the tank to
allow for unobstructed flow into the pump intake and to prevent solids from clogging the intake
or plugging orifices. The pump manufacturer will provide information on how high the pump
intake should be from the bottom of the tank. Examples of pump tank configuration are shown in
Figures X-4, X-5, and X-6.
12/02
PUMPS AND HYDRAULICS
X-5
Figure X-4. Gravity Serves Ground Floor and a Pump Lifts Sewage from Basement
Figure X-5. Pump Lifts Tank Effluent to a Shallow Absorption Field
12/02
PUMPS AND HYDRAULICS
X-6
Figure X-6. Pump Lifts Sewage to Shallow Septic Tank Placement for Easier
and Much Less Costly Maintenance
The pump tank must be accessible for maintenance. A manhole with a minimum diameter
of 24 inches must be provided into the pump tank. The access opening into the tank itself must
be a minimum of 20 inches. A larger manhole is preferred and may be required, depending on
the type of pump used. The manhole cover must have a lock mechanism to prevent unauthorized
persons from opening the tank. An unsecured manhole cover is a serious safety hazard and may
become a target for vandalism. The pumping station is a confined space and may contain
12/02
PUMPS AND HYDRAULICS
X-7
dangerous gases. The manhole must provide access for maintenance and servicing the pump but
in no case should the pump tank be entered unless all OSHA safety regulations regarding a
confined space entry are observed. The pump should be installed with a quick release discharge
which is accessible at the top of the manhole. This will allow the pump to be serviced or
replaced as needed. All electrical connections should be made outside the pump tank in
approved waterproof connection boxes. The pump station must have an electrical disconnect
which is located outside the house and is accessible for any service technician to cut the power to
the system before any maintenance work is begun.
The pump tank should have a volume adequate to provide the minimum volume needed to
keep the pump intake submerged, the pump down volume of one pump cycle, and a reserve
capacity of 75% of the daily flow, in case the pump fails. Most pump stations are equipped with
an alarm to indicate that the water level is rising above the normal volume. Once the alarm is
activated, the pump tank should have enough reserve to handle 75% of the daily flow. However,
in many situations even this reserve volume may not allow enough time to get the pump
operational. Some pump stations are now equipped with an additional power outlet to allow the
pump tank to be pumped using a portable pump. This will provide additional capacity until the
pump can be repaired.
Most pump stations are designed so that the discharge line from the pump will drain back
into the pump tank, by gravity, when the pump shuts off. The pump used in this application
must be designed to allow this drain back feature which will make the impeller turn backwards.
This feature will help to prevent freezing of the lines in the absorption field. In addition, the
pump discharge line should be fitted with a quick disconnect or union so that the pump can be
easily removed for repair. Easy access to the pump tank for maintenance and repair is a critical
factor in the design of a pump station. The pump station may need to have some type of built-in
rail or guide to allow the pump to be easily installed or removed.
If the pump tank is not concrete, then the tank may need to be bedded in concrete or
anchored, to prevent floatation when the tank is nearly empty. Fiberglass and polyethylene tanks
will need to have some type of anti-floatation design incorporated into the installation of the
tank. Usually, the manufacturer will include installation specifications designed to prevent
floatation. If the tank has two or more compartments, at least one of the compartments should be
full enough to prevent the possibility of floatation.
Depending upon the application, the pump station may require a filter. If the pumped
effluent is being discharged into a soil absorption field, then the pump station will usually have
some type of effluent filter to keep solids out of the absorption field. Filters should also be used
in pump stations which are used to dose a media filter, such as sand or textile filters. If the pump
station is using any type of high head effluent pump, then a filter and pump screen are
mandatory. A variety of different sizes and configurations are available for these effluent filters.
The type of filter used will depend upon the application, the tank, and the type of pump being
used. The filter will need to be accessible for cleaning and should be designed for easy removal.
12/02
PUMPS AND HYDRAULICS
X-8
PUMP TYPES
Recently, the grinder pump has become more common for use in individual homes. The
grinder pump is equipped with blades mounted on the impeller which literally grind up and shred
solids before they enter the impeller. The grinder pump must grind up the solids to a size that
will not clog the impeller. Two types of grinder pumps are currently available; a centrifugal
grinder pump and a positive displacement grinder pump. The centrifugal grinder pump is more
common, but this pump usually is not capable of pumping against a high head. However, the
positive displacement grinder pump can handle a high head application. Regardless of the type
of grinder pump used, the blades will need to be replaced and the pump will require
maintenance. Some grinder pumps require a great deal of maintenance and repairs can be very
expensive. The grinder pump is most commonly used to convey wastewater into a small
diameter sewer which serves some type of central wastewater treatment facility.
A pump handling solids, or ejector pump is commonly used to deliver wastewater from a
basement into a septic tank. This type of pump system must be designed to deliver the required
volume during each pump cycle, without any drain back from the line into the septic tank.
Ejector pumps are usually equipped with a check valve to prevent this from happening. When
sewage is pumped into a septic tank, turbulence is created in the septic tank. For this reason, the
septic tank should have at least two compartments, or have two tanks installed in series, in order
to minimize the turbulence and allow the septic tank to function properly in removing solids and
scum. The volume of wastewater delivered in one pump cycle should be no greater than 1% of
the volume of the first compartment. If two septic tanks are used in series, the volume of the
pump cycle may be increased to 5% of the volume of the first tank.
PUMP CONTROLS
The pump is usually controlled by floats which are suspended in the pump tank. The floats
may be mechanical or mercury floats and may be rated as Anormally on@ or Anormally off.@ In
any case, the float is designed to hang vertically, so that as the water level in the tank rises, the
float gradually becomes suspended until the water completely covers the float and it is inverted
in the water. When the float is inverted, it will throw an electrical circuit either open or shut,
depending upon the wiring configuration. Many pump stations have three floats; a low water
alarm, the on/off float, and a high water alarm. In the three float system the low water alarm
float is always submerged, unless the water level falls below the low water alarm level.
Remember that the pump intake and body of the pump must be kept submerged to provide
lubrication and cooling of the pump. The low water alarm will indicate abnormal conditions and
alert the homeowner to a problem in the pump tank. The on/off float is designed to turn the
pump on when the water level gets high and then to turn the pump off when the water level
returns to the normal operating level. The high water alarm is activated when the water level
gets high and should be set to provide additional reserve capacity in the event of pump failure.
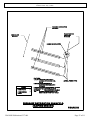
Examples of the float configuration for a pump station are shown in Figure X-7 where the
control box is attached to the house exterior and Figure X-8 where the control box is remote.
12/02
PUMPS AND HYDRAULICS
X-9
Please note that the floats should be tethered to a rigid Afloat tree@ which is mounted in the tank.
The floats should be on a short tether and must be carefully set so that they do not become
tangled up with each other or come to rest on the top of any surface (especially the pump casing)
inside the tank. The most common problem encountered with these systems is that the floats are
hung up and not able to work properly. Also, the vertical location of the pumps must be
carefully set up to provide the proper dose volume per cycle, to protect the pump with the low
water alarm, and to notify the homeowner when high water conditions exist. Setting the floats at
the proper height and configuration should be done by a qualified installer.
Some pumping stations may be equipped with a timer to operate the on/off cycle of the
pump. These pump stations are designed to provide a specific dose at a given time interval. This
type of configuration is commonly used for dosing media in a fixed film treatment system or for
a media filter such as sand or textile filter. These systems also have low and high water alarms
but the on/off cycle is controlled by the timer. The timer is located in the control box and may
have to be adjusted to provide the proper dose. Adjusting the timer on these systems must be
done by a qualified technician who understands how the timer is set. The control box for the
pump station must be waterproof and corrosion resistant. The control box should be mounted in
a protected area near the pump tank. The control panel should be within sight of the pump tank
to facilitate service on the unit. All electrical connections must be watertight and in accordance
with local electrical codes. The control box should contain a wiring diagram mounted
Figure X-7. Section of Pump Tank Showing Pump, Wiring, and Float Locations
12/02
PUMPS AND HYDRAULICS
X-10
permanently in the box. The control box should contain an electrical shut-off to allow the
service provider to cut the power to the system. The control box should also be equipped with an
audible and visual alarm to notify the homeowner when alarm conditions exist. The alarm circuit
should be separate from the pump circuit so that if the pump trips the circuit breaker, the alarm
circuit will continue to operate. Most of the control boxes have a silencer to shut-off the audible
alarm after the homeowner is aware of the conditions. The wiring from the control box to the
pump tank is usually buried and must be protected from traffic.
Whenever two or more residences have a common soil treatment system, or if an
establishment deals with the public (such as a restaurant, motel, or school), dual pumps should be
installed as shown in Figure X-9. The dual pumps provide a back-up to keep the system in
operation during mechanical problems with one pump. The dual pump, or duplex system, is
similar to the single, or simplex pump, except that the control box must contain an alternator
which alternates which pump is being used.
The duplex system is set up so that if one pumps fails, the alarm will be activated, while the
other pump will be operated to keep the system working. In addition, if the flow increases and
one pump cannot keep the water level down, then the other pump will also operate. This
Figure X-8. Section of Pump Tank Showing Wiring and Electricity Away from House
12/02
PUMPS AND HYDRAULICS
X-11
configuration is called the lead pump and the lag pump. All duplex control panels should be
wired to operate in this way.
PUMP PRESSURE AND FLOW
For dosing the absorption field, the pump station should be designed to provide a pump out
volume of 25% of the daily design flow. The daily sewage flow from a four bedroom home is
600 gpd. Thus, the start and stop levels should be set to pump 0.25 x 600 gpd = 150 gallons.
The setting of the pump control depends on the surface area of the tank. For example, if a
pumping tank is rectangular, with inside dimensions of 4 by 5 feet, the surface area is 20 square
feet. Since each cubic foot of water contains 7.5 gallons, a l foot depth of liquid in this tank
would contain 7.5 gal. x 20 sq.ft. = 150 gallons. Thus, to pump 150 gallons would require that
the pump start level be 1 foot above the pump stop level.
In most domestic applications, the pipe from the pumping station is buried only deep
enough to prevent physical damage and on enough of a slope to drain back to the tank after each
pump operation. If exactly 150 gallons is pumped, then with the drain back, less than 150
Figure X-9. Duplex Pump Station has Two Alternating Pumps
12/02
PUMPS AND HYDRAULICS
X-12
gallons will be pumped to the absorption field. The volume of drain back must be calculated
based on the capacity and length of the pipe to the distribution box. This volume must be added
to the volume to be pumped to provide a total pump dose of 150 gallons.
For a circular tank, which is four feet in diameter, the surface area is calculated as pi(3.14)
times the radius squared. In this case the surface area would be 3.14 x 2 2 = 12.57 square feet.
For a l foot depth in the tank, there are 12.5 cubic feet = 94 gallons. If 150 gallons are to be
pumped and the tank contains 94 gallons per foot of depth, then 150 gal/ 94 gal/ft = 1.6 feet or 19
inches. The start control must be 19 inches higher than the stop control in order to pump out the
150 gallons per cycle. Again, the drain back must also be added into the flow to provide the
proper dose.
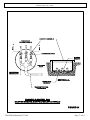
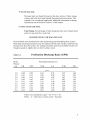
PUMP DISCHARGE CURVE
The common submersible sump pump operates under conditions described by the
characteristic pump curve. The pump curve is unique for each pump at a specific operating
speed and describes the head-discharge relationship for the pump. Four pump curves are shown
in Figure X-10 as examples. The total dynamic head is given on the vertical axis and the pump
discharge in gallons per minute is shown on the horizontal axis.
As the discharge rate increases, the total dynamic head a centrifugal pump can delivers will
decline. The point at which the characteristic curve intersects the vertical axis is the maximum
head that the pump develops and is often called the shut-off head. The maximum head for pump
C with a 1/3 horsepower as shown in Figure X-10 is 30 feet. This can be visualized by thinking
of a standpipe just over 30 feet tall. The pump can raise the liquid level to a height of 30 feet but
the flow at or above that head is zero. At any head less than 30 feet, some flow will occur. For
example, at 25 feet of total head, the discharge will be approximately 25 gallons per minute.
This information can be read from the graph or the table in Figure X-10.
Referring to Figure X-10, the shutoff head of the 2 horsepower pump is 80 feet
(intersection of the pump curve with the vertical axis). At 40 feet of head, the pump can
discharge 43 gallons per minute. The pump supplier can provide a pump curve to be used to
select the right pump for each application. Note that even though pumps A, B, and C ½ all are
half horsepower each has a very different pump curve.
If the requirements for a system are a pump which will deliver 20 gallons per minute at 20
feet of total dynamic head, none of the pumps presented in Figure X-10 will deliver precisely
this specification. A gate valve will need to be installed to dissipate a small amount of head so
that the actual head delivered by the pump will be approximately 21 feet. If the 2 horsepower
high head pump A is used, and exactly 20 gallons per minute are desired, then the pump will
actually deliver about 65 feet of total head, 45 feet of which will be dissipated in the gate valve.
If the pump application is to deliver flow to a pressure distribution system in a mound, for
example, this is a self-balancing system. As the flow tends to increase, the pressure at the
perforations also increases and the pump simply operates at a particular point on its own
particular characteristic curve. A gate valve is not needed with a pressure distribution system.
PUMPS AND HYDRAULICS
12/02
X-13
A
B
C⅓
C2
Figure X-10. Example Pump Curves for Four Pumps: Two Low Head with Different Size
Motors, a Medium Head, and a Higher Head Pump
12/02
PUMPS AND HYDRAULICS
X-14
Table X-1. Schedule 40 Plastic Pipe Friction Loss, Diameter, and Volume
Pipe Diameter
1"
1.25"
1.5"
2"
2.5"
3"
Inside dia.
1.05"
1.38"
1.61"
2.067"
Gals/100ft
4.4
7.8
10.6
17.4
Flow,gal/min
1
0.08
2
0.28
3
0.59
0.16
4
1.01
0.27
5
1.53
0.40
0.19
6
2.14
0.56
0.27
7
2.85
0.75
0.35
0.11
8
3.65
0.96
0.45
0.13
9
4.53
1.19
0.56
0.17
10
5.51
1.45
0.69
0.20
12
7.72
2.03
0.96
0.28
14
10.27
2.70
1.28
0.38
16
13.14
3.46
1.63
0.48
18
4.30
2.03
0.60
20
5.23
2.47
0.73
25
7.90
3.73
1.11
30
11.07
5.23
1.55
35
14.73
6.96
2.06
40
8.91
2.64
45
11.07
3.28
50
13.46
3.99
55
4.76
60
5.60
65
6.48
70
7.44
80
9.52
90
11.84
100
14.38
125
150
175
200
Friction Loss in ft/100ft = 1042 x [_Q_]1.85 / c x d2.63
where Q = Flow (gpm)
d = Internal Pipe Diameter (inches)
c = Pipe Constant (150)
2.47"
24.9
0.09
0.12
0.16
0.20
0.25
0.31
0.47
0.65
0.87
1.11
1.38
1.68
2.00
2.35
2.73
3.13
4.01
4.98
6.06
9.15
12.83
17.06
4"
3.07"
38.4
4.03"
66.1
0.11
0.16
0.23
0.30
0.39
0.48
0.58
0.70
0.82
0.95
1.09
1.39
1.73
2.11
3.18
4.46
5.93
7.59
0.10
0.13
0.13
0.19
0.22
0.25
0.29
0.37
0.46
0.56
0.85
1.19
1.58
2.02
12/02
PUMPS AND HYDRAULICS
X-15
SELECT THE PUMP FOR THE APPLICATION
The pumps must be selected for the specific flow and head (or pressure) requirements; not
just on the basis of horsepower, voltage, or other factor. Just because a pump worked well in one
application does not mean it will work well in a different one. With wastewater the presence of
solids must be considered. The three factors that determine the total dynamic head of a pump are:
! elevation difference between the pump and point of discharge,
! the pressure requirements of the operating system, and
! the friction loss in the piping.
For the example in Figure X-11 (11A), assume that there is an elevation difference of 17
feet between the top of the pump and the manifold in the pressure distribution system. When
pumping to a pressure distribution system, as in this example, add five feet for pressure required
at the manifold. If pumping to a drop box gravity system, then zero would be put in section B,
item 2. Table X-1 shows the friction loss for Schedule 40 PVC plastic pipe. Friction loss
calculations are based on the Hazen-Williams equation. The table also includes the amount of
water contained in 100 feet of the various pipe diameters.
Friction loss depends on the flow rate, type of pipe, pipe diameter, and pipe length and
fittings. The friction loss for 40 gallons per minute in 2 inch pipe is 2.64 feet per 100 feet. Note
from the table that friction loss increases very rapidly as the pipe diameter decreases. For
example, the friction loss for a 40 gpm in 12 inch diameter pipe is 8.91 feet per 100 feet.
Another factor is the length of the pipe and the fittings through which the effluent flows
from the pump to the point of discharge. The friction loss within the pressure distribution
laterals is included in that design. But the friction loss from the pump to the manifold must be
calculated and added to the pump head requirements.
12/02
PUMPS AND HYDRAULICS
X-16
In addition to straight pipe, the piping system has valves, elbows, tees, and other fittings.
Each of these fittings can be expressed in equivalent lengths of straight pipe. A simplified way
to account for these fittings is to multiply the length of the straight pipe by a factor of 1.25.
Assume that the distance from the pump to the manifold of the mound is 140 feet. Multiply
the delivery line length by 1.25, the factor to allow for fitting losses, results in a total equivalent
length of 175 feet. The total friction loss is 175 x 2.64 feet per 100 feet or 4.6 feet of friction
loss. The total head requirement for this system is 17 + 5 + 4.6 or 26.6 feet of head.
The pump must be selected to deliver at least 40 gallons per minute at a total dynamic head
of 26.6 feet. This point located on the curves in Figure X-10 falls above the characteristic curves
of the 1/3 horsepower and the 2 horsepower low head pumps. Thus, these pumps are not
suitable for these pumping requirements. If these pumps were the only ones available, the flow
would need to be reduced by using fewer or smaller perforations, or in some cases the friction
loss could be reduced by using a larger diameter pipe.
Since a requirement is to have slightly excess capacity to deliver flow at the specified head,
select the pump curve just above the plotted head-flow point (26.6-40) on Figure X-10. This
point is above the low-head curves, but below the 2 horsepower medium head (B). Because
discharge into a pressure distribution system is self-balancing, no valve is needed to reduce
pressure.
While it can be exactly calculated by a trial and error solution, the pump will likely deliver
somewhat in excess of 45 gallons per minute at a total dynamic head of slightly more than 30
feet. Again, it is necessary to point out that the B 2 horsepower pump operates exactly on its
own characteristic curve.
ENERGY REQUIREMENTS
The amount of energy required for pumping sewage is relatively small. If the pump delivers
40 gallons per minute and 174 gallons are to be pumped per dose, then pump operating time is
4.35 minutes per cycle with 4 cycles per day for a total time of 17.4 minutes per day. The 2
horsepower pump will likely be equivalent to about 600 watts of power consumption. The
nameplate amperage on a motor is typically the maximum current draw during startup which
occurs very rapidly. Continuous running current is often ½ to ⅓ of the startup amperage. An
estimate of the pump energy use can be calculated by multiplying the current in amperage by the
voltage to obtain the wattage. If the running amperage is not known use ½ of the startup
amperage. In this example the pump will use 600 watts x 0.29 hours = 174 watt-hours or 0.18
kilowatt hours per day. Knowing the kilowatt hours, the energy costs may be calculated using
the current price per kilowatt hour.
Although freezing of lines has not been identified as a problem for continuous use systems,
Figure X-12 shows how to frost-proof the lateral line in the soil absorption system. The
discharge piping should be sloped to drain back into the pump station, as described earlier.
12/02
PUMPS AND HYDRAULICS
X-17
Figure X-12. Section of Low Pressure Pipe Lateral Indicating Holes for Drainage
to Minimize Chances of Freezing
PRESSURE DISTRIBUTION NETWORK
Designing a pressure distribution network is a detailed procedure which involving flow
rates, pipe diameters, number and size orifices, lateral pressure, and pressure or head delivered
by the pump. Interrelationships are involved such as pipe size versus friction head loss. The
process may require trying various combinations to come up with a design which produces an
efficient system. However, tables and charts have been developed to help determine appropriate
combinations for common designs. If the first design combination isn=t satisfactory for some
reason, such as requiring an unusually expensive pump, other combinations can be tried to see if
improvements can be made.
A pressure distribution network must be designed to ensure uniform distribution of the
wastewater. The pressure distribution system consists of:
1) lateral pipes with equally spaced holes drilled into the invert of the pipe,
2) manifold and main connected to the laterals,
3) dosing or pump tank to collect septic tank effluent to be pumped to the mound,
4) pump to pressurize the system, and
5) controls, alarm and power supply to operate the pump.
To avoid requiring a very large pump, small-diameter pipes usually 1 to 1½ inch but
12/02
PUMPS AND HYDRAULICS
X-18
occasionally larger are used to distribute the wastewater. The 4-inch lateral pipe used for gravityfed soil absorption systems is not suitable because it is too large and the holes are not
appropriately sized or spaced to provide even effluent distribution.
Schedule 40 PVC pipe and fittings are typically used in low pressure onsite distribution
systems. Orifices (holes) are drilled perpendicular to the pipe and are placed on the pipe invert
(underside) or top. Any burrs or rough edges must be removed from the holes so they do not
collect debris and clog. Holes should be drilled carefully. If the holes are not very close to the
size specified in the design, the discharge will be different and will alter the performance of the
system.
PRESSURE DISTRIBUTION NETWORK DESIGN
The following design is for the mound system described in Chapter VI pages VI-8 to VI-26.
However, a very similar design procedure is used for any pressure distribution network including
sand filter, media filter, low pressure laterals, or drip dispersal.
Pipe Network Design Steps
1. Refer to the mound design to determine the absorption bed area (A x B). The network
configuration and length of the laterals will be based on the absorption bed area. The
absorption area width will determine how many parallel lines will be used for the
distribution network. The lateral length is measured from the distribution manifold to the
end of the lateral. A center manifold is preferred because it minimizes pipe sizes.
Remember: all lateral lines are to be on the same elevation or the operating head must be
adjusted so they are equal.
2. The spacing between lateral lines should always be less than 5 feet. Spacing can also be
based on 6 sq ft per orifice as is used in sand filter systems.
3. Determine the perforation spacing and size. The size of the perforations or orifices,
spacing of the orifices, and the number of orifices must be matched with the flow rate to
the network. Typical orifice sizes are 1/4@ and 3/16@ with spacing of 30-36 inches. See
Table X-2 for orifice discharge rates for a typical range of heads.
4. Determine the lateral pipe diameter. Select a diameter that is large enough to keep
pressure losses low (less than 15 percent of the operating pressure), but small enough to
keep costs low. The lateral diameter selection is based on the hole size, hole spacing, and
lateral length. Charts have been developed to help in selecting suitable minimum lateral
diameters. See Table X-1 or X-3 for friction loss of Schedule 40 PVC pipe
5. Determine the number of perforations per lateral.
6. Determine the lateral discharge rate, discharge per orifice times number of orifices. Select
the pressure head to be maintained at the end of each lateral. Typical distal pressure is 2.5
ft for 1/4@ orifices, 3.5 ft for 3/16@ orifices and if smaller holes, such as 1/8@ is used,
consider using 5 ft of head. The lower the operating head the more critical the friction
head loss becomes to keep discharge uniform along lateral.
PUMPS AND HYDRAULICS
12/02
X-19
7. Determine the number of laterals and the spacing between laterals. If the 6 sq ft per
orifice guideline is used, the orifice spacing and lateral spacing are interrelated. For
absorption area widths of 3 feet, one distribution pipe along the length requires an orifice
spacing of 2 feet. For a 6-ft wide absorption area with the same configuration, it would
require orifice spacing of 1 foot along the pipe.
8. Calculate the manifold size and length. Determine the main connection to the manifold,
center or end. The point of the main/manifold connection determines the length of the
manifold. The manifold length is measured from the main/manifold connection to the end
of the manifold. The minimum manifold diameter can be determined from a chart and is
based on the lateral flow rate, lateral spacing, and manifold length.
Table X-2. Orifice Discharge Rates in Gallons per Minute (gpm)
Orifice Diameter (in)
Pressure head
Feet
1/8
3/16
1/4
5/16
3/8
2.5
0.29
0.66
1.17
1.82
2.62
3.0
0.32
0.72
1.28
1.00
2.87
3.5
0.34
0.78
1.38
2.15
3.10
4.0
0.37
0.83
1.47
2.30
3.32
4.5
0.39
0.88
1.56
2.44
3.52
5.0
0.41
0.93
1.65
2.57
3.71
5.5
0.43
0.97
1.73
2.70
3.89
6.0
0.45
1.02
1.80
2.82
4.06
6.5
0.47
1.06
1.88
2.94
4.23
7.0
0.49
1.10
1.95
3.05
4.39
7.5
0.50
1.14
2.02
3.15
4.54
8.0
0.52
1.17
2.08
3.26
4.83
8.5
0.54
1.21
2.15
3.36
4.97
9.0
0.55
1.24
2.21
3.45
4.97
9.5
0.57
1.28
2.27
3.55
5.11
10.0
0.58
1.31
2.33
3.64
5.24
12/02
PUMPS AND HYDRAULICS
X-20
Table X-3. Friction Loss in PVC Plastic Pipe, feet/100 ft of pipe
Nominal Pipe Size, inch
1-1/4
1-1/2
2
Flow, gpm
3/4
1
3
4
1
2
3
3.24
4
5.52
5
8.34
6
11.68
2.88
7
15.53
3.83
8
19.89
4.91
9
24.73
6.10
10
30.05
7.41
2.50
11
35.84
8.84
2.99
12
42.10
10.39
3.51
13
48.82
12.04
4.07
14
56.00
13.81
4.66
1.92
15
63.63
15.69
5.30
2.18
16
71.69
17.68
5.97
2.46
17
80.20
19.78
6.68
2.75
18
21.99
7.42
3.06
19
24.30
8.21
3.38
20
26.72
9.02
3.72
25
40.38
13.63
5.62
1.39
30
56.57
19.10
7.87
1.94
35
25.41
10.46
2.58
40
32.35
13.40
3.30
45
40.45
16.66
4.11
50
49.15
20.24
4.99
60
28.36
7.00
0.97
70
37.72
9.31
1.29
80
11.91
1.66
90
14.81
2.06
100
18.00
2.50
0.62
125
27.20
3.78
0.93
150
5.30
1.31
175
7.05
1.74
Note: This is confusing, these values do not agree with those in Table X-1. Which is correct?
12/02
PUMPS AND HYDRAULICS
X-21
Determine the network discharge rate. This value is used to size the pump or siphon. Take the
lateral discharge rate and multiply it by the number of laterals, or take the perforation discharge
rate and multiply it by the number of perforations.
9. Develop a system performance curve. This performance curve is a way to predict how
the distribution system performs under various flow rates and heads. The flow rate is a
function of the total head that the pump works against. As the head becomes larger, the
flow rate decreases, but the flow rate determines the network pressure and thus the
relative uniformity of discharge throughout the distribution network. The easiest way to
select the correctly sized pump is to evaluate the system performance curve and the pump
performance curve. Where the two curves cross is where the system operates relative to
flow rate and head. The total dynamic head that the pump must operate at is the sum of:
a. System network head (1.3 x distal pressure with minimum 2.5 feet),
b. Elevation difference, and
c. Friction loss in the pipe network.
Sizing the Pump or Siphon
The effluent pumps used for pressurizing the distribution networks are either centrifugal
effluent pumps or turbine effluent pumps. The turbine effluent pump, which is a slightly
modified well pump, is relatively new to the onsite industry. In comparison, the centrifugal
pump is a higher capacity/lower head pump with a relatively flat performance curve. The turbine
pump is a lower capacity/higher head pump with a relatively steep performance curve. Turbine
pumps probably have a longer life and may be the preferred choice for timed dosing because of
their longevity relative to stop/starts.
Using pump performance curves, select the pump that best matches the required flow rate
at the operating head. Plot the pump performance curve on the system curve. Then determine if
the pump will produce the flow rate at the required head. Do not undersize the pump.
Care must be taken in sizing siphons. The head that the network operates against has to be
developed in the force main by backing up effluent in the pipe. If the discharge rate out of the
perforations is greater than the siphon flow rate, the distal pressure in the network will not be
sufficient. Some manufacturers recommend that the force main be one size larger than the
siphon diameter to allow the air in the force main to escape. However, this will reduce the distal
pressure in the network, and it may drop below the design distal pressure.
1. Determine the dose volume required. The lateral pipe volume determines the minimum
dose volume. The recommended dose volume has been 5-10 times the lateral volume. It
has also been recommended that the system be dosed 4 times daily, based on the design
flow. The residents do not always use the design flow and so some mounds are only
dosed once a day. When timed dosing is used, effluent is applied a number of times per
day, with smaller doses. However, sufficient volume needs to be applied to distribute the
effluent uniformly across the network. Thus, net dose volume is 5 times the lateral pipe
volume.
PUMPS AND HYDRAULICS
12/02
X-22
2. Size the dose chamber. The dose chamber must be large enough to provide the
following:
o The dead space resulting from positioning the pump above the tank bottom
o The dose volume
o A few inches of head space for the alarm warning float
o Reserve capacity based on 100 gallons per bedroom. (recommended)
If timed dosing is selected, the pump chamber or septic tank/pump chamber must have
sufficient surge capacity. If a turbine pump is used and must be submerged, there may
not be enough surge capacity provided by the reserve capacity because turbine pumps are
relatively tall.
3. Select quality controls and alarms. Follow electrical code for electrical connections.
Some may have to be made outside the dose tank. There are excellent user-friendly
control panels for times dosed systems.
DESIGN EXAMPLE
Design a pressure distribution network for a mound whose absorption area is 113 ft long
by 4 feet wide. The force main is 125 feet long and the elevation difference is 9 ft from the
lowest wastewater level in the dosing tank to the highest point in the main or manifold.
Distribution Network Design Steps
1.
Configuration of the network. This is a narrow absorption unit on a sloping site, so
use 1 or 2 lines with a center feed creating two laterals.
2.
Determine the lateral length Using a center feed, the lateral length is:
Lateral Length = (B / 2) - 0.5 ft Where: B = absorption length
= (150 / 2) – 1 ft (The 1 ft = the distance from the end of the lateral pipe
to the end of the gravel bed.)
= 74 ft
3.
Determine the perforation spacing and size - Two examples A and B are included.
Perforation spacing - Each Perforation covers a maximum area of 6 ft2. The
absorption area is 3 ft wide.
a. With one lateral down the center on each side of the center feed.
Spacing = area per orifice / width of absorption area
= 6 ft2/ 3 ft = 2.0 ft.
b. With two laterals down the center on each side of the center feed
Spacing = (area/orifice x no. of laterals / (absorption area width)
= (6ft2 X 2) / (3 ft) = 3 ft.
The designer may stagger orifice spacings with laterals 1.5 ft apart.
Perforation size - Select from 1/8, 3/16 or 3 inch. Use 3/16 inch as per earlier
discussion.
PUMPS AND HYDRAULICS
12/02
X-23
4.
Determine the lateral diameter.
Using Figure X-13 (3/16 inch) with a perforation spacing of 2 ft. Use one lateral
on each side of the center feed with lateral length of 74 ft and 2 ft orifice
spacing requies a lateral diameter of 2 in (see Figure X-13).
For 2 laterals on each side of the center feed and lateral length of 74 ft with a
3.5 ft orifice spacing allows the lateral diameters to be reduced to 1.5 in.
5.
Determine number of perforations per lateral.
Using 2 ft spacing in 74 ft yields:
Number of perforations = (p/x) + 1 = (74 / 2) + 1 = 38 perforations/lateral
For two laterals (one on each side), the total number of perforations = 76
Check - maximum of 6 ft2 / perforation = 150 ft x 3 ft / 6 sq ft = 75 so ok
Figure X-13. Graph of Lateral Length, Orifice Spacing, and Pipe Size
for 3/16 inch Orifices.
PUMPS AND HYDRAULICS
12/02
X-24
6.
Determine lateral discharge rate (LDR).
Using network pressure (distal) pressure of 3.5 ft and 3/16@ diameter
perforations. Table X-2 gives a discharge rate of 0.78 gpm.
LDR = 0.78 gpm/ perforation times 38 perforations = 29.6 gpm
7.
Determine the number of laterals.
This was determined in Steps 3 and 4. Use one lateral on each side of center
feed so 2 laterals are required. (If two laterals were used on each side of center
feed, they would be spaced 1.5 ft apart.)
8.
Calculate the manifold size.
Since there is only one lateral per each side of center feed, there is no manifold.
(Had two laterals been used, the manifold could be the same size as the force
main as it is an extension of the force main.)
9.
Determine the network discharge rate (NDR).
NDR = Number of laterals X lateral discharge rate (LDR)
= 2 laterals x 29.6 gpm
= 59.2 or 60 gpm
Pump has to discharge a minimum of 60 gpm against a total dynamic head yet
to be determined.
10.
Total dynamic head is the sum of the following:
System head = 1.3 x distal head (ft)
= 1.3 x 3.5 ft
= 4.5 ft
Elevation head = 9.0 ft
Friction Loss = Table A-2 for 60 gallons and 125 ft.
= 8.75 ft for 2@ diameter Use 3@ diameter unless pump can handle
= 1.21 ft for 3@ diameter added friction loss of 2 in. diameter pipe.
Total Dynamic Head = 14.7 ft (3@force main) or 22.3 ft (2@ force main)
Pump must discharge 60 gpm against a head of 14.7 ft with 3@ force main. These are
the calculated flow and head values. The actual flow and head will be determined
by the pump selected. A system performance curve plotted against the pump
performance curve will give a better estimate of the flow rate and total dynamic head
the system will operate under. The next section gives an example.
Force Main, Pressurization Unit, Dose Tank and Controls Design Steps
1.
Calculate the system performance curve. Use Table X-4 to develop a system
performance curve. Follow the procedures:
a. Select 5 flow rates with 2 points above and below the network discharge rate of 60
gpm.
b. Calculate the orifice (perforation) flow rate for each of the flows. This is done by
dividing the flow rate by the number of orifices in the network. For the 30 gpm and
76 orifices, the orifice flow rate is 0.395 gpm.
PUMPS AND HYDRAULICS
12/02
c.
d.
X-25
The elevation head is the height that the effluent is lifted.
The force main head is the head loss in the force main for the given flow rate. Need
to select a force main diameter. For this example, use 3@ force main. The first three
flow rates are not on the chart and heads were calculated. Normally, the system is
not operated in this range because velocities are less than 2 ft/sec. For the 60 gpm,
the friction loss is (0.97 ft) x 1.25 for distance = 1.21 ft.
Table X-4. Head and Calculations for Various Operating Flow and Pressure
Total
Flow, gpm
Orifice
Flow, gpm
Operating
Head, ft
Elevation
Difference, ft
Force
Main Loss, ft
Total
Head, ft
30
0.395
1.18
9
0.33
10.51
40
0.526
2.09
9
0.46
11.55
50
0.658
3.27
9
0.86
13.13
60
0.789
4.71
9
1.21
14.92
70
0.921
6.42
9
1.61
17.03
80
1.053
8.39
9
2.07
19.46
The network head is calculated by H = 1.3 x (Q/(11.79x d2))2. H is head in ft, Q is
orifice flow rate in gpm, and D is orifice diameter in inches. The 1.3 is an
adjustment factor for friction loss in laterals. For 3/16@ diameter orifice the
equation is H = 1.3 x (Q/0.4145)2. The total head is the sum of the elevation, force
main and network heads.
f. The total head is the sum of the elevation, force main and network heads.
Note: Orifice is synonymous with perforation.
e.
2. Determine the force main diameter.
Force main diameter = 3@ (determined in Step 10 of Distribution Network Design).
3. Select the pressurization unit.
Plot the performance curves of several effluent pumps and the system performance curve.
For the system curve, plot the flow rates versus the total head. On the system curve,
Figure X-14, place an X on the curve at the desired flow rate (in this case 60 gpm).
Select the pump, represented by the pump performance curve, located next along the
system performance curve just after 60 gpm (Pump B) as that is where the pump will
operate. Pump C could be used but it is over sized for the conditions.
12/02
PUMPS AND HYDRAULICS
X-26
Figure X-14. Plotted System Operating Curve and Pump Curves to Select Pump
4. Determine the dose volume.
More recent thinking is that the dose volume should be reduced from the larger doses
recommended earlier. Use 5 times the total pipe void volume. Calculate void volume
from the length of pipe and the volume per foot from Table X-5 for the pipe sizes.
Lateral diameter = 2@
Force main diameter = 3@
Lateral length = 56 ft
Force main length = 125 ft
Void volume = 0.163 gal/ft
Void volume = 0.367 gal/ft
Net dose volume = 5 x 56 ft x 0.163 gal/ft = 46 gallons per dose
Flow Back from force main = 125 ft x 0.367 gal/ft = 46 gallons.
Set the floats so that a total of 92 gallons will be dosed with 46 gallons flowing back into
pump chamber to drain the pipe when the pump stops.
5. Size the dose chamber.
Based on the dose volume, storage volume and room for a block beneath the pump and
control space, a 500 to 750 gallon chamber will suffice. If timed dosing is implemented,
then a larger tank will be required to provide surge storage. Use 2/3 daily design flow for
reserve capacity.
6. Select controls and alarm from products available from suppliers.
PUMPS AND HYDRAULICS
12/02
X-27
Table X-5. Void Volume for Various Diameters of Schedule 40 Pipe
Normal Pipe Size (inches)
Void Volume (gal/ft)
3/4
0.023
1
0.041
1-1/4
0.064
1-1/2
0.092
2
0.163
3
0.367
4
0.650
6
1.469
LOW PRESSURE PIPE SYSTEM
Some sites may have severe limiting factors which must be addressed by using a system
such as the low pressure pipe system. Common applications for low pressure pipe systems
include: small lot sizes, shallow soils, soils with a slow permeability rate, or steep slopes. The
low pressure pipe system can overcome these limitations by providing: uniform flow
distribution, alternating dosing and resting cycles, and shallow trenches. The effluent is
distributed into the absorption with a low pressure pump system which can distribute the flow
more evenly over the soil infiltrative surface. The low pressure pipe system functions to dose the
soil with wastewater, then allow a resting period, and then dose the soil again, repeating this
process throughout the day on a timed basis. Dosing helps maintain aerobic conditions in the
soil, which improves treatment of the wastewater and maintains soil permeability. The shallow
placement of the trenches increases the vertical distance between the trench and any restrictive
layer. In addition, the shallow depth keeps the wastewater effluent in the active soil layers where
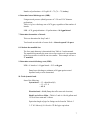
microbiological and plant activity is maximized. A typical application for a low pressure pipe
system is shown in Figure X-15 with a detail of the trench cross-section.
Components
The low pressure pipe system includes pretreatment with a septic tank or alternative
system, a septic tank effluent filter, a pump tank, (including controls and pump), transport line to
connect the pump to the absorption field manifold, and small diameter lateral pipes. The
pretreatment system must include an effluent filter to prevent clogging of the small diameter pipe
and small holes used to distribute the flow in the absorption field. The effluent filter must be
cleaned every three months to assure that the system remains operational. A low pressure pipe
system is dependant upon the operation of several mechanical devices, including the pump and
12/02
PUMPS AND HYDRAULICS
Figure X-15. Typical Pump Tank, Controls, and Pipe Network Components
X-28
12/02
PUMPS AND HYDRAULICS
X-29
must be supplied with a reliable power source. The pump tank configuration is shown in Figure
VII-14. The system should have a visual and audible alarm to notify the homeowner if the
system is malfunctioning.
The laterals are usually 1-2 inch diameter schedule 40 PVC with 3/16 inch holes drilled at
specified intervals. The wastewater effluent travels in the transport line to the manifold, which is
used to feed into the laterals. The best configuration for the system is shown in Figure X-16
which shows the pump tank located at the lowest elevation in the system. This configuration
will allow the transport pipe and the manifold to drain back into the pump tank during the rest
cycle. Using this configuration the discharge line from the pump should have a small weep hole
which empties into the pump tank to allow the lines to drain back into the pump tank. With this
configuration a check valve is not needed on the transport line, however, the supply manifold
should have a ball valve between the manifold and the lateral, which is located 6 inches above
the lateral line as shown in Figure X-15. The 6 inch elevation and holes drilled below the 12
o=clock position will help the laterals drain out into the drainfield and will prevent the laterals
from draining back into the pump tank. This configuration is commonly used on steep slopes
and when freezing conditions may develop if the lines are not self-draining. The ball valve is
used to adjust the flow so that all lines operate at the same head pressure which is needed to keep
the even flow distribution. Other configurations which use a check valve with a header manifold
pipe or a tee to tee connection will trap the wastewater in the lateral lines, which may create a
problem during freezing conditions.
The ends of the laterals opposite from the supply end should be turned up and be equipped
with a cleanout as shown in Figure X-17. The cleanouts should have a threaded or removable
cap to allow for flushing the lateral lines and to monitor the head pressure in the laterals. The
yard box covering the cleanout should be at least 6 inches in diameter and must be readily
accessible for maintenance. If the orifices are placed in the 12 o=clock position, then orifice
shields must be used to distribute the flow and keep small particles out of the orifice.
The design and construction of a low pressure pipe system includes determining the orifice
size and spacing, the dosing volume, the lateral pipe size, and sizing the pump. All of these
factors must be incorporated into the design and included in the calculations of the friction loss
in the pipe, the drain back volume, the dosing cycles, and the operating pressure for the system.
A sample calculation for a low pressure pipe system is included to demonstrate how the tables
shown are used to determine the various system components.
Performance Testing
Since the low pressure pipe system is dependent upon equal flow distribution, the system
should be tested prior to covering the trenches to be sure that the system is properly functioning.
The most common way to test the system is commonly called the squirt test. The difference in
orifice discharge rate must not exceed 10% within in one lateral, and may not exceed 15% over
the whole system. Once the pressure is adjusted so that the minimum residual pressure is equal
in all the lines, then the system should be tested to see that the actual volume of discharge does
not vary over 15%. This is especially important in systems on a steep slope where the system is
designed to drain back between dosing cycles. In this type of system, the lower elevation lateral
12/02
PUMPS AND HYDRAULICS
Figure X-16. Supply Manifold and Connection to Low Pressure Lateral
X-30
12/02
PUMPS AND HYDRAULICS
X-31
Figure X-17. Detail of Turn-up and Cleanout for Low Pressure Distribution
for Sand Filter, Mound or Low-Pressure Pipe Lateral
will pressurize first and receive effluent for a longer period of time. In addition, the lower lateral
may receive additional flow from the manifold or from the upper laterals.
The system should also be tested to determine the pump drawdown, the pump run time, the
timer function, and the squirt height or residual head. The pump drawdown is calculated by
determining the number of inches that the liquid level drops in the pump tank during one cycle.
From this information and the dimensions of the tank, the total volume pumped during each
cycle can be determined and recorded. The pump run time should be determined with a stop
watch. The stop watch should also be used to measure the time interval between pump cycles.
This data should be recorded at the time that the system is placed into service and should be kept
available at the site to aid in long-term monitoring and maintenance. The last test of the system
is to determine the squirt height or residual head. The minimum residual head should be
between 2-5 feet. The easiest method for measuring the residual head is to attach a clear pipe
onto the end of the lateral and measure the static head, which is the vertical distance between the
lateral and the top of the liquid standing in the clear pipe.
PUMPS AND HYDRAULICS
12/02
X-32
Maintenance
As discussed earlier, these systems will require maintenance. The equipment must be
checked on a regular schedule to be sure that screens in the tank or around the pump intake and
the effluent filter are not clogged. In addition, the lateral lines should be flushed to dislodge any
solids and remove the biological slime which develops in the pipes. The laterals should be tested
for residual pressure and for equal flow. The pump run time and the number of cycles should be
checked against the original design of the system. The pump drawdown volume should also be
checked periodically and may need to be adjusted with the timer in the control box. Additional
items to be checked in the septic tank or pump tank include: checking for sludge accumulation;
checking the operation of floats; checking for signs of leaking in tank or the risers; and checking
the operation of alarms present in the system.
Low Pressure Pipe Design Example
Single Family Residence: Design Flow = 360 gallons per day, (gpd); Tables used in this
section are from the EPA Design Manual for Onsite Wastewater Treatment and Disposal.
Septic Tank:
a.) Two compartment septic tank with a minimum liquid volume of 1000
gallons and equipped with an effluent filter having a maximum particle
size of 1/8 inch.
b.) Dosing tank with minimum of 500 gallon volume above pump intake.
Absorption Field: a.)
b.)
c.)
d.)
Dosing Rate:
a.)
b.)
c.)
d.)
e.)
f.)
g.)
Elevation Head = 15 ft from tank to highest line
Application Rate = 0.2 gpd/ft2
Minimum Area = 360 gpd / 0.2 gpd/ft2 = 1800 ft2
Pipe 1 inch lines, 5 ft on center with 3/16 inch holes drilled 6 ft on
center
Based on 3/16 inch holes at 4 ft of head
Number of holes per line = 60ft (length) - 2 holes (3 ft from each end)
Spacing - 6 ft on center
= 10 holes per line
For 6 lines = 60 holes total
Lateral lines are 1 inch schedule 40 PVC
Flow rate per hole (according to Table VII-5) = 0.83 gpm/hole
4 ft head
= 1.73 psi
2.31 psi/ft head
Total dose rate = 0.83 gpm/hole x 60 holes) + 0.83 gpm for air vent hole
= 50.6 gpm
Elevation head = 5 ft (out of tank) + 15 ft (to top of absorption field)
= 20 ft
Fitting Adjustment: a.) Supply line (from pump to last lateral) = 35 ft length, for a 2 inch
diameter manifold at 50 gpm. See Table X-2 to find the friction loss
per 100 ft of the supply line.
b.) Friction head = 35 ft (supply line length) x 3.98 ft head x 1.25 fitting adj.
100 ft
PUMPS AND HYDRAULICS
12/02
X-33
= 1.68 ft head
c.) Total head = 20 ft (elevation head) + 1.68 ft (friction head) + 4 ft (pressure)
= 25.68 ft
Dosing Volume: a.) 2-4 doses per day based upon use
b.) Volume in lateral lines = 4.1 gal/100 ft of 1 inch pipe (Table VII-7) x
360 ft of lateral pipe/100 ft of pipe
= 14.76 gallons
c.) Volume in supply line = 16.2 gal/100 ft of 2 inch pipe x 35 ft supply
line/100 ft of pipe
= 5.67 gallons
d.) Total volume in system = (volume of laterals) 14.67 gal + (volume of
supply line) 5.67 gal
= 20.43 gallons
e.) Volume of void space in trench = (cross sectional area) (0.5 ft x 0.5 ft)
x 360 ft (length) x 7.48 gal/ft3
= 90 ft3 x 7.48 gal/ft3
= 673.2 gal
Trench should have approximately 30% void space
= 673.2 gal x 30% = 201 gal
As long as the void space in trench is smaller than the gallons per dose, the system
will function.
Based upon these calculations the pump must be sized to supply 50.6 gpm at 26 ft
TDH (Total Dynamic Head).
Table X-6. Orifice Flow Rate in gallons per minute (gpm) for Different Sizes and
Operating Pressure Head
Pressure, psi
Head, ft
5/32 inch
3/16 inch
7/32 inch
1/4 inch
0.43
0.87
1.30
1.73
2.16
1.0
0.29
1.5
0.35
2.0
0.41
2.5
0.45
3.0
0.50
3.5
0.54
4.0
0.58
4.5
0.61
5.0
0.64
5.5
0.66
2.58
6.0
0.69
Combine with Table X-2 to Make One Table
0.42
0.56
0.74
0.59
0.80
1.04
0.72
0.98
1.28
0.83
1.13
1.48
0.94
1.26
1.65
1.04
1.37
1.81
12/02
PUMPS AND HYDRAULICS
X-34
SUMMARY
Pumping stations may be required to overcome site obstacles. When pumping stations are
needed, they must be carefully selected and designed to create a good working system. The
pumping stations must be watertight and not subject to corrosion. The selection of the right
pump based on the pump type and the pump characteristics can be time consuming, but is critical
to the proper operation of the system. Pumping stations must be accessible to allow for service
and maintenance on the pumps.
12/02
PUMPS AND HYDRAULICS
X-35
REFERENCES AND READING MATERIALS
Iowa DNR. Onsite Sewage Design and Reference Manual, Section E: Pressure Distribution and
Pumping Systems, Iowa Department of Natural Resources, 2003.
www.iowadnr.com/water/septic/manual.html www.iowadnr.com/water/septic/manual.html
Jones, D.D., J.E. Yahner, and E.R. Miller. Steps in Constructing a Mound (Bed-Type) Septic
System, ID-163, Purdue University, Cooperative Extension Service, April 1990.
www.ces.purdue.edu/extmedia/ID/ID-163.html
Kang, Y.W. K. Mancl and R. Gustafson. Pressure Distribution of Wastewater Design and
Construction in Ohio, Bulletin 829, The Ohio State University, Cooperative Extension
http://ohioline.osu.edu/b829/index.html
Miller, E.R. D.D.Jones, and J.E. Yahner,. Steps in Constructing a Pressure Distribution Septic
System, ID-163, Purdue University, Cooperative Extension Service, January 1985.
Missouri Farm$A$Syst. Reducing the Risk of Groundwater Contamination by Improving
Household Wastewater Treatment, WQ680, University of Missouri, Farmstead Assessment
System Fact Sheet #6, October 1995.
http://extension.missouri.edu/explore/envqual/wq0680.htm#system
Mote, C.R. Pressurized Distribution for On-Site Domestic Wastewater-Renovation Systems,
Bulletin 870, University of Arkansas, Agricultural Experiment Station, April 1984.
Sievers, D.M. Design and Construction of On-Site Systems, Special Report 477, University of
Missouri, Department of Agricultural Engineering, Spring 1995.
Solomon, Clement, Peter Casey, Colleen Mackne, and Andrew Lake. Low-Pressure Pipe
Systems, WWFSOM29, National Small Flows Clearinghouse.
US EPA. Decentralized Systems Technology Fact Sheet: Low Pressure Pipe Systems, EPA 832F-99-076, EPA, Office of Water, September 1999.
www.epa.gov/owm/septic/pubs/finallpp.pdf
Washington. Recommended Standards and Guidance for Performance, Application, Design, and
Operation & Maintenance: Pressure Distribution Systems, WA DOH Publication #337-022,
Department of Health, Division of Environmental Health, Office of Shellfish and Water
Protection, July 2007. http://www.doh.wa.gov/ehp/ts/ww/pres-dist-rsg-7-1-2007.pdf
Wisconsin, DOC. Pressure Distribution Component Manual for Private Onsite Wastewater
Treatment Systems, SBD-10706-P (N 01/01), Department of Commerce, Division of Safety and
Buildings, January 2001.
http://commerce.wi.gov/SBdocs/SB-PowtsManualPressureDistributionShowEdits.pdf
WSU. Properly Managing Your Pressure Distribution System, EB1673, Washington State
University, Cooperative Extension, June 1992.
Recommended Standards and Guidance for Performance,
Application, Design, and Operation & Maintenance
Pressure Distribution
Systems
July 2009
Pressure Distribution Systems - Recommended Standards and Guidance
Effective Date: July 1, 2009
Contents
Page
Preface.............................................................................................................................................6
Introduction....................................................................................................................................8
1.
Performance Standards........................................................................................................11
1.1.
1.2.
2.
Application Standards..........................................................................................................13
2.1.
2.2.
2.3.
2.4.
2.5.
2.6.
2.7.
2.8.
2.9.
2.10.
2.11.
3.
Intent ..........................................................................................................................11
Measure of Performance ............................................................................................11
Listing ........................................................................................................................13
Permitting...................................................................................................................13
Pretreatment ...............................................................................................................13
Pump Chamber...........................................................................................................15
Pumps, Fittings and Controls.....................................................................................18
Piping Materials.........................................................................................................23
Manifold.....................................................................................................................23
Laterals.......................................................................................................................25
Minimum Design Submittal.......................................................................................28
Construction Record Information ..............................................................................29
User’s Manual............................................................................................................29
Operation and Maintenance ................................................................................................30
3.1.
3.2.
3.3.
3.4.
3.5.
3.6.
Evaluate Drainfield ....................................................................................................30
Evaluate Laterals........................................................................................................30
Measure Pump Run Time per Cycle and Drawdown ................................................30
Test Alarms................................................................................................................30
Evaluate Septic Tank and Pump Chamber.................................................................31
Findings and Repairs .................................................................................................31
Figures...........................................................................................................................................32
Appendix A – Useful Tables for Pressure Distribution............................................................43
Appendix B – Volume of Pipe .....................................................................................................57
Appendix C - Advantages / Disadvantages of Dosing Systems ................................................58
Appendix D - Advantages / Disadvantages of Siphon Dosed Systems ....................................60
Appendix E - References .............................................................................................................61
Glossary of Terms .................... http://www.doh.wa.gov/ehp/ts/WW/RSG_Glossary_8-29-07.pdf
WA DOH Publication #337-009
Page 5 of 61
Pressure Distribution Systems - Recommended Standards and Guidance
Effective Date: July 1, 2009
Preface
The recommended standards contained in this document have been developed for statewide
application. Regional differences may, however, result in application of this technology in a
manner different than it is presented here. In some localities, greater allowances than those
described here may reasonably be granted. In other localities, allowances that are provided for
in this document may be restricted. In either setting, the local health officer has full authority in
the application of this technology, consistent with Chapter 246-272A WAC and local
jurisdictional rules. If any provision of these recommended standards is inconsistent with local
jurisdictional rules, regulations, ordinances, policies, procedures, or practices, the local standards
take precedence. Application of the recommended standards presented here is at the full
discretion of the local health officer.
Local jurisdictional application of these recommended standards may be:
1) Adopted as part of local rules, regulations or ordinances - When the recommended
standards, either as they are written or modified to more accurately reflect local conditions,
are adopted as part of the local rules, their application is governed by local rule authority.
2) Referred to as technical guidance in the application of the technology - The
recommended standards, either as they are written or modified to more accurately reflect
local conditions, may be used locally as technical guidance.
Application of these recommended standards may occur in a manner that combines these two
approaches. How these recommended standards are applied at the local jurisdictional level
remains at the discretion of the local health officer and the local board of health.
The recommended standards presented here are provided in typical rule language to assist those
local jurisdictions where adoption in local rules is the preferred option. Other information and
guidance is presented in text boxes with a modified font style to easily distinguish it from the
recommended standards.
Glossary of Terms: A glossary of common terms for all RS&Gs can be found on the DOH Web
site at http://www.doh.wa.gov/ehp/ts/WW/RSG_Glossary_8-29-07.pdf.
WA DOH Publication #337-009
Page 6 of 61
Pressure Distribution Systems - Recommended Standards and Guidance
Effective Date: July 1, 2009
Typical RS&G Organization:
Standards Section
Explanation
Performance
How this technology is expected to perform
(treatment level and function)
Application
How this technology is to be applied. This
section includes conditions that must be met
prior to proceeding with design. Topics in this
section describe the “approved” status of the
technology, component listing requirements,
permitting, installation, testing and inspection
requirements, etc.
Design
How this technology is to be designed and
constructed (includes minimum standards that
must be met to obtain a permit).
Operation and Maintenance
How this technology is to be operated and
maintained (includes responsibilities of various
parties, recommended maintenance tasks and
frequency, assurance measures, etc)
Appendices
Design examples, figures and tables, specific
applications, and design and installation issues.
WA DOH Publication #337-009
Page 7 of 61
Pressure Distribution Systems - Recommended Standards and Guidance
Effective Date: July 1, 2009
Introduction
Pressure distribution applies effluent uniformly over the entire absorption area such that each
square foot of bottom area receives approximately the same amount per dose at a rate less than
the saturated hydraulic conductivity of the soil. This process promotes soil treatment
performance by maintaining vertical unsaturated flow and also reduces the degree of clogging in
finer textured soils. Pressure distribution closely approaches uniform distribution. (See guidance
section below)
A pressure distribution system consists of a pretreatment component to separate the major solid
materials from the liquid, a screening device to protect the pump and distribution lateral orifices
from solids, and a means to deliver specified doses of effluent, under pressure, to the distribution
system (Converse, 1974; Converse, et al., 1975; Otis, et al., 1978). The distribution system
consists of small 1 to 2 inch diameter laterals with small discharge orifices. A pressure head is
created within the laterals, usually by means of a pump or siphon.
Pressure distribution is applicable to any system which uses soil as a treatment medium and may
improve long term performance of those systems. It is required by WAC 246-272A for certain
site and soil conditions, and for high daily design flows. Pressure distribution is also a required
component for mounds, sand filters and sand lined trenches and beds.
Research evidence indicates that wastewater traveling vertically through 2-4 feet of suitable,
unsaturated soil provides adequate treatment of wastewater. Research also indicates that the
method of distribution of septic tank effluent within the soil absorption field can affect the
system's treatment performance.
A frequently used, and the simplest method for distributing effluent is gravity flow. Gravity flow
allows wastewater to flow by gravity through large diameter pipes into the subsurface soil
absorption system. Distribution is usually localized in a few areas within the field, which results
in overloading of the infiltrative surface in those areas until a mature biomat develops. This
overloading can lead to groundwater contamination in coarse granular soils due to insufficient
treatment, or more rapid clogging in finer textured soils.
A second method of distribution, dosing, can overcome some of these problems. It is dealt with
in a separate publication entitled, Dosing Gravity Drainfield Systems, revised .July 2007.
Because effluent is distributed over a larger portion of the absorption area and the period
between doses is maximized, the degree of soil clogging is reduced. However, localized
overloading may still occur.
A third method is pressure distribution, which comes closest in achieving uniform distribution.
WA DOH Publication #337-009
Page 8 of 61
Pressure Distribution Systems - Recommended Standards and Guidance
Effective Date: July 1, 2009
Pressure distribution is usually used in locations where it is either desirable or required to:
1)
2)
3)
4)
achieve uniform application of wastewater throughout the drainfield area;
treat and dispose of effluent higher in the soil profile;
avoid potential contamination of ground water beneath excessively permeable soils;
improve the treatment performance and extend the life expectancy of a drainfield or other
component;
5) reduce the potential for breakout or seepage on slopes;
6) distribute effluent to all sand filters, mounds, all Type 1 soils, and all other soils with less
than 24 inches of vertical separation.
Pressure distribution is also appropriate for sites in aquifer sensitive areas and for larger
drainfield systems. Finally, in certain conditions where pumping is necessary due to elevation
problems, pressure distribution can be incorporated with only a little additional effort.
WA DOH Publication #337-009
Page 9 of 61
Pressure Distribution Systems - Recommended Standards and Guidance
Effective Date: July 1, 2009
System Components / Process Summary
Pressure distribution systems require the following basic components: septic tank (or other
pretreatment to the same quality as domestic septic tank effluent), pump or siphon chamber or
equivalent, transport line, manifold, laterals, and drainfield.
Figure 1 illustrates the major components of a typical pressure distribution system that are
described below:
Component
Primary Function
Septic tank (or other pretreatment device)
Solids separation and storage
Screen
Protect pump and distribution network orifices from solids
Pump chamber (surge tank)
Transport a specific volume of effluent from the Surge tank
pump chamber to the distribution network. Accumulate
effluent between pump cycles and during malfunction.
Transport line
Pipeline that connects the pump to the Manifold.
Manifold
Piping network connecting the transport line to the various
laterals.
Control Panel
NEMA-rated box containing all the controls for the
pumping system, dose cycle counter, pump run time meter,
and alarm controls.
Laterals
Small diameter pipes with orifices which distribute effluent
within a trench or bed.
Drainfield
Allows the septic tank effluent to pass into the native soil or
other receiving media where various biological and
physical processes provide additional treatment.
WA DOH Publication #337-009
Page 10 of 61
Pressure Distribution Systems - Recommended Standards and Guidance
Effective Date: July 1, 2009
1. Performance Standards
1.1. Intent
The intent of pressure distribution is uniform distribution of effluent throughout the
receiving component.
1.2. Measure of Performance
The variation in orifice discharge rates within any one lateral must not be more than
10%,
The variation in orifice discharge rates over the entire distribution system must not be
more than 15%,
The squirt height difference must not exceed 21% (10% flow difference) between orifices on any
one lateral. The squirt height difference over the entire system must not exceed 32% (15% flow
difference). Remember to use a new drill bit during construction. The following table gives the
actual distances.
Maximum Flow Difference Allowed (Inches)
10% Flow Difference
15% Flow Difference
Nominal Residual Squirt Height
2 Feet
5 Inches
7.5 Inches
5 Feet
12.5 Inches
19 Inches
1.2.1. A minimum residual pressure of 0.87 psi (2 feet of head) is required for systems
with 3/16 inch diameter orifices and larger, and 2.18 psi (5 feet of head) is
required for systems with orifices smaller than 3/16 inch.
Generally, the testing should verify that distribution is uniform with the required minimum
residual pressure, that the system is dosed at the proper volume and frequency, and that the
alarms are functioning properly. Suggested methods are provided below. If problems are
encountered during testing, the installer should notify the designer or engineer. Wiring
problems should be referred to the electrician. Described below are the steps for conducting a
pressure test.
Measure squirt height.
Minimum squirt height for orifice size:
3/16" orifice size = 2' or 24" squirt height
1/8" orifice size = 5' or 60" squirt height
5/32" orifice size = 5' or 60" squirt height
Check uniformity of squirt height.
WA DOH Publication #337-009
Page 11 of 61
Pressure Distribution Systems - Recommended Standards and Guidance
Effective Date: July 1, 2009
An alternate method to the squirt height is to attach a clear PVC stand pipe to the end of the
lateral. The true residual head is measured from the top of the lateral pipe to the top of the
water column.
Check float placement. High water alarm, “on” level, “off” level, and “redundant off”
alarm must activate or deactivate at the elevation called out on the plan. It is recommended
that, for simplicity and accuracy, these adjustments be made with the float tree out of the
water.
Ensure that the pump delivers the correct dose to the drainfield.
Demand dose systems: Verify that "dry" float settings (completed above) send the correct
dose to the drainfield when floats are in water. This may require minor adjustments of float
placement.*
Timed dose systems:
(1) Determine the time required to send a full dose to the drainfield. This can be done by
running the system in manual. Be sure there is plenty of water in the pump chamber. Timer
run times provided by designers or engineers must be field tested.
(2) Using the time obtained above, verify that when the system runs automatically it runs the
time required to send the proper dose to the drainfield. This is important because timers are
difficult to set, i.e., setting a timer to 2.2 minutes may not ensure a run time of 2.2 minutes.
Two steps to speed this process are to start testing with the pump chamber mostly full and to
set “off” time temporarily to minutes or seconds.*
(3) Verify that the timer off time is the same as that specified in the plan or will dose the system
the correct number of times a day. Check this number in minutes and note the off time. One
can verify activation levels by use of lights on timer. For instance, if the drainfield is to
receive 4 doses per day, the off time should be approximately 6 hours.
(4) Verify that high water alarm does not turn the pump on. If high water alarm turns the pump
on, the system will not be approved.
Timed dose systems only: Verify that the system will dose the correct number of times per day
and that no float in the system turns the pump on independent of the timer. A system with a timer
override float will not be approved.
If problems are discovered during the functional testing, first contact the designer or engineer.
If the wiring needs adjustment, the electrician should be contacted.
In preparation for Health District final inspection, fill the pump chamber.
An additional test for equal distribution, which takes into consideration draindown after the
pressure cycle, is described here. However, it is somewhat tedious. For systems with laterals
WA DOH Publication #337-009
Page 12 of 61
Pressure Distribution Systems - Recommended Standards and Guidance
Effective Date: July 1, 2009
having more than 18 inches difference in elevation, the volume of liquid from an orifice (same
size as the others in the laterals) placed in a plug or cap in the end of each lateral can be
collected from a complete cycle and measured. The variation between the largest volume and
the least volume collected must not be more than 15%. Use of manifold designs shown in
Figures 6A and 6B will eliminate significant drainback.
* Determination of float activation level in water may take several tries. For both system types,
note pump run time that delivers proper dose. Record the results.
2. Application Standards
2.1. Listing
Pressure distribution is a public domain distribution technology, but it does not appear
on the department’s List of Registered On-site Treatment and Distribution Products. It
may be permitted by local health officers as a public domain pressure distribution
system (WAC 246-272A-0010) as long as there is departmental RS&G for this
technology.
2.2. Permitting
Installation permits, and if required, operational permits must be obtained from the
appropriate local health officer prior to installation and use.
2.3. Pretreatment
2.3.1. A pressure distribution system must be preceded by a properly sized twocompartment septic tank with effluent baffle screen (see 2.3.3). Exception, see
2.4.2.
2.3.2. Septic Tank - The septic tank must be designed in compliance with Washington
State On-Site Sewage System Regulations (WAC 246-272A-0232) and with the
Washington State Recommended Standards and Guidance for On-site Sewage
System Tanks. Until sewage tank rules are available, all septic tanks must also:
2.3.2.1. be watertight to a level above any possible seasonal ground water. The
local health officer may require leak testing.
2.3.2.2. include screening of the effluent, unless the screening is around the pump.
2.3.2.3. have service access manholes and monitoring ports for the inlet and outlet.
WA DOH Publication #337-009
Page 13 of 61
Pressure Distribution Systems - Recommended Standards and Guidance
Effective Date: July 1, 2009
Septic Tank - (See Figure 2)
Watertightness - Some or all of the following materials can be used to aid in achieving water
tightness of the tanks:
-
-
Use caste-in-place flexible rubber gaskets in the inlet and outlet openings, using stainless
steel clamps to seal the rubber to the pipes.
Use of flexible rubber gaskets sealed to the inlet and outlet openings with a ratcheted
expansion seal and using stainless steel clamps to seal the rubber to the pipes.
Use of expanding grout material as a means of sealing tanks and risers. Some grouts will
shrink and crack over time, and thus allow tanks to leak well after the tank is backfilled.
Bentonite backfill around the tank seams and pipe entrances may help provide a water tight
tank.
Epoxy is another effective method of sealing some kinds of joints, but the weather conditions
must be ideal and there is no capacity for flex.
Rubber grommets around smaller inlet and discharge pipes, conduit and junction box
penetrations can also be effective in controlling leaks.
Risers – A 24-inch riser is practical when installing it over a 20-inch hatch of the septic tank
because a solid foundation is needed to attach the riser to the tank. If a riser is integral to
the top of the tank, a 20-inch riser will suffice.
2.3.3. Outlet Baffle Screen / Filter - An outlet baffle screen or filter must meet the
following performance criteria:
2.3.3.1. protect the pressure distribution drainfield discharge orifices from plugging
by particles larger than the orifices.
2.3.3.2. protect the effluent pump from damage due to particles which exceed the
pump’s capacity to pass (may be an issue with some types of pumps).
2.3.3.3. perform these functions without loss of performance between routine
service events.
2.3.3.4. perform these functions with routine service no more frequent than that
required for other system components or the system as a whole.
2.3.3.5. is constructed of durable, non-corroding materials.
2.3.3.6. draws liquid from the “clear zone” of the septic tank.
2.3.3.7. be designed, constructed and installed for easy and thorough cleaning.
WA DOH Publication #337-009
Page 14 of 61
Pressure Distribution Systems - Recommended Standards and Guidance
Effective Date: July 1, 2009
Outlet Baffle Screen / Filter -- Effluent flowing through a screen at the outlet of the septic tank is
at very low head and therefore particles cannot be forced through the openings. In addition,
servicing the screen does not involve pump, control floats, wiring and discharge pipes. Below
are listed some specific criteria for baffle screens that meet the standards.
Maximum mesh opening of 1/8 inch (protects discharge orifices of 3/16 inches or larger, and
pumps with the capacity to pass up to a 1/8 inch sphere. For orifices smaller than 3/16 inches
diameter, the screen should have a mesh size of 1/16 inch smaller than the orifice it is designed
to protect.)
Non-corrosive material (durability leads to improved product life-span and performance).
Provide an open area flow capacity at least equal to the flow capacity provided by a 4 inch
diameter PVC pipe. The minimum area will very likely require a high frequency of cleaning and
therefore not meet the standard of performance between service intervals. In standard practice
a much larger flow area is used. The larger flow areas will result in longer intervals between
services for the same hydraulic and organic strength loadings.
The screen must be securely fastened to prevent dislodging or misalignment (this relates to longterm performance and servicing).
Be easily removable and/or designed, constructed and installed for easy and thorough cleaning
(this relates to long-term performance and servicing).
Draw liquid from the “clear zone” of the septic tank, the zone between 40% down from the top
of the liquid and 40% up from the bottom of the tank (this relates to performance and service
interval, as well as general septic tank performance).
Be capped, covered or otherwise constructed to prevent scum or other floatable solids from
discharging from the tank by bypassing the screen or filter (this relates to product performance).
Other specifications may be used to meet the outlet baffle screen / filter performance.
2.4. Pump Chamber
2.4.1. Pump Chamber Requirements - All pump chambers must be structurally sound
and conform to Washington State On-Site Sewage System Regulations (WAC
246-272A) and with the Washington State Recommended Standards and
Guidance for On-site Sewage System Tanks. Until sewage tank rules are
available, all pump chambers must also:
2.4.1.1. be water tight to a level above any possible seasonal ground water. Leak
testing may be required.
WA DOH Publication #337-009
Page 15 of 61
Pressure Distribution Systems - Recommended Standards and Guidance
Effective Date: July 1, 2009
2.4.1.2. all pump chambers must be equipped with a twenty-four (24) inch
minimum diameter, water tight riser with a secured lid that extends to the
ground surface. Lids must be equipped with an airtight gasket to eliminate
nuisance odors and be secured from accidental or intention removal by
unauthorized persons, especially children.
2.4.1.3. the internal volume of the pump chamber must be sufficient to provide the
daily design flow volume, dead space below the pump inlet for sludge
accumulation, and sufficient depth to provide full time pump submergence,
when required. An additional emergency storage volume of at least 75% of
the daily design flow is also required (may include volume to flood capacity
in both the pump tank and the septic tank).
Pump Chamber Volume - For most applications, an 18 inch minimum space for sludge
accumulation in the pump chamber is prudent. Pump chambers receiving septic tank effluent
will accumulate sludge and scum, and in some new systems it will form quite rapidly. The
sludge level will never be above the intake of the pump. Emergency storage is required for
periods of power outages or equipment malfunctions.
For systems where continuous operation and maintenance are provided by a management entity
acceptable to the local health department, a reduction in the volume required for reserve storage
may be considered.
Reductions in pump chamber volume may also be considered when "Duplex" or redundant
pumps are used.
2.4.1.4. include a screen if one is not provided at the outlet of the septic tank. (See
2.3.3 for performance criteria of the screen.) The local health officer may
allow this option only if O&M is assured through contract with third party
entity.
Screening at the septic tank outlet may result in a higher quality effluent than screening around
the pump, as the flow rate through a septic tank baffle screen is much lower than through a
screen around the pump. However, large pump chambers can continue to accumulate
screenable solids, as it is still a biologically active fluid. Therefore, it should be assumed that
septic tank effluent, once screened, can still produce sludge and scum in the pump chamber. A
pump screen designed to fulfill the performance requirements and to prevent collapsing between
service intervals may be a wise choice either by itself or in conjunction with a septic tank
effluent filter. However, some pumpers insist that screens in pump chambers are a bad idea and
cause many maintenance problems.
WA DOH Publication #337-009
Page 16 of 61
Pressure Distribution Systems - Recommended Standards and Guidance
Effective Date: July 1, 2009
2.4.2. Pump Vault System in a Single Compartment Septic Tank - Septic tanks in
Washington must have two compartments. However, an exception to this is
where a pump vault is used in a single compartment septic tank. In addition to
meeting all the requirements for pressure distribution systems with a separate
pump chamber, there are additional criteria and limitations when using this
combination of septic tank and pump vault. They are listed below:
2.4.2.1. The minimum storage and pump working volumes in the septic tank must
be equivalent to a septic tank with a separate pump chamber. The
minimums are a) sufficient volume to handle the functions of a septic tank,
and to keep the pump submerged, when required, b) surge volume to hold
one day’s design flow, and c) additional storage for emergency situations
equal to 75% of the surge volume.
2.4.2.2. The pump vault must:
2.4.2.2.1. extract liquid from the middle of the clear zone of the septic tank,
2.4.2.2.2. have integral screening or other methods to prevent solids greater than
1/8” to pass into the pump,
2.4.2.2.3. have screening with a minimum wetted open area of 12 ft2,
2.4.2.2.4. be able to supply liquid to the pump as rapidly as it is discharged from
the vault while keeping the pump submerged,
2.4.2.2.5. perform to these specifications between normal service intervals
established for the rest of the system (minimum time – 6 months).
2.4.2.3. The pump vault must be designed and constructed to facilitate removal and
maintenance of the vault screen, pumps, and floats.
2.4.2.4. The flow rate from the pump must not exceed 30 gpm. The fluctuation of
the liquid level in the tank must not exceed 10 inches. Larger fluctuations
are allowed for emergency storage to accommodate power outages or pump
failure.
2.4.2.5. The minimum hydraulic detention time in the tank must be 24 hours. The
clarified zone must be at least 10 1/2 inches, with a minimum clearance of 3
inches between the bottom of the scum layer and the entrance to the
screening device. The minimum distance between the top of the sludge and
the entrance to the screening device must be 6 inches.
2.4.2.6. The effluent quality discharged from a pump vault in a single compartment
tank must be equal to the expectation for a separate pump chamber that
WA DOH Publication #337-009
Page 17 of 61
Pressure Distribution Systems - Recommended Standards and Guidance
Effective Date: July 1, 2009
receives screened effluent from a two-compartment septic tank.
2.4.2.7. Materials and construction must assure a watertight vessel, which is
resistant to corrosive attack by chemicals and conditions typical for a
sewage environment.
2.4.2.8. The minimum size of septic tank must be 1500 gallons as measured at the
invert of the outlet. In addition, the lowest liquid level (pump off) must
have a minimum of 1000 gallons, and thereafter coincide with the
requirements of WAC 246-272A-0232.
2.5. Pumps, Fittings and Controls
2.5.1. Pumps must be selected to pump effluent and be capable of meeting the minimum
hydraulic flow and head requirements of the proposed on-site system. Additional
requirements that pumps and pump installations must meet are:
2.5.1.1. Pumps
2.5.1.1.1. All pumps must be installed so that they can be easily removed and/or
replaced from the ground surface. (Under no circumstances shall
pump replacement and/or repair require service personnel to enter the
pump tank).
2.5.1.1.2. All pumps must be fitted with unions, valves and electrical
connections necessary for easy pump removal and repair. All pumps
must be protected by approved outlet baffle screens in the chamber
preceding the pump chamber or by pump screens, as described in
previous sections.
In addition, pumps and controls should have gas-tight junction boxes or splices and have
electrical disconnects (as per National Electric Code) appropriate for the installation. The
boxes should be placed so that they do not interfere with the servicing of other components.
2.5.1.1.3. Pumps and electrical hook-ups must conform to all state and local
electrical codes.
2.5.1.1.4. If any portion of the pump fittings or transport line is at a higher
elevation than the drainfield, the system must be equipped with an air
vacuum release valve or other suitable device to avoid siphoning.
WA DOH Publication #337-009
Page 18 of 61
Pressure Distribution Systems - Recommended Standards and Guidance
Effective Date: July 1, 2009
If a check valve is used in the system, a vent hole should be installed upstream from the check
valve so the pump volute (impeller chamber) is kept filled with effluent. Some pumps may
cavitate if the impeller is not kept submerged. Under most circumstances this hole will be
needed only when the chamber is first filled with liquid or after it has been cleaned.
2.5.1.2. Pump Controls
2.5.1.2.1. Timed dosing is recommended whenever pressure distribution is used.
WAC 246-272A requires timed dosing in the soil dispersal
component for all sites where technologies meeting Treatment Levels
A or B are mandated, soil dispersal components having daily design
flows between 1000 and 3500 gallons of sewage per day, and in the
soil dispersal component following all repairs using the allowances of
Table IX in WAC 246-272A-0280. Technologies, such as sand filters,
recirculating gravel filters, sand lined trenches, mounds, and other
treatment components also require timed dosing in order to assure
those technologies meet treatment requirements or expectations. For
systems requiring time-dosed pressure distribution, accessible controls
and warning devices are required, and must:
2.5.1.2.1.1. meet the functional requirements for pressure distribution,
2.5.1.2.1.2. deliver prescribed dose sizes uniformly to the orifices in the
distribution network,
2.5.1.2.1.3. deliver the effluent to the distribution network in evenly
spaced doses over a 24 hour period,
2.5.1.2.1.4. provide prescribed resting periods between doses,
2.5.1.2.1.5. assures no more than the design volume for each 24 hour
period is delivered to the receiving component,
2.5.1.2.1.6. record and store the pump run time and number of dose
cycles,
2.5.1.2.1.7. have controls and components listed by Underwriter’s
Laboratory or equivalent, and
2.5.1.2.1.8. alarm circuit independent of the pump circuit.
WA DOH Publication #337-009
Page 19 of 61
Pressure Distribution Systems - Recommended Standards and Guidance
Effective Date: July 1, 2009
Timed dosing is not required for pressure distribution soil dispersal components following
treatment components that are timed dosed. The flow is already time-dosed to the treatment
component, and therefore the pump chamber out of the treatment component may be demanddosed. To detect extraneous flows, an elapsed time meter can be used to monitor the integrity of
the liner of a packed bed filter, such a sand filter, by comparing the volume of liquid pumped
from the sand filter with the volume pumped into it.
Timed dosing is strongly recommended on all pressure distribution systems. This type of system
enhances performance, reliability, and protection from abuse. The requirements in WAC 246272A and the recommendations in this document are based on the need to control the size of
doses to the coarser and single grained soils and treatment media. Timed dosing also prevents
hydraulic overload of the receiving component. Usual sources of hydraulic overload are
excessive water use in the facility or groundwater infiltration into the septic tank or pump
chamber.
Timed dosing means that both the length of each dose (produces gallons per dose) and the
interval between doses (which determines the number of doses per day) is controlled by a timing
device whenever a dose volume is in the pump chamber. The number of pump cycles should be
adjustable and in sufficient number to meet the design needs of the system.
As the number of dose cycles increases, the amount of effluent delivered per dose must decrease
(in order to prevent more than daily design dose from being delivered to the drainfield).
Delivering more than 6 or 8 doses per 24 hours will require one or more of the following
features to be designed into the system:
• orifices at 12:00 o’clock to keep the piping network full or mostly full of effluent between
doses (to reduce the volume per dose)
• transport, manifold and lateral pipe diameters are reduced (to reduce the volume per dose)
• orifice size is reduced (to help reduce the volume per dose)
• fluid velocity in pipes is increased (to help scour the pipe and as a consequence of the
reduced pipe size)
• residual hydraulic head at the orifices is increased (to help clear the smaller orifices)
• check valves are placed into the system to prevent flowback (to reduce the volume per dose)
• a performance test of the check valves, as many do not perform as intended.
2.5.1.2.2. When the treatment component is timed dosed prior to a soil dispersal
component, the soil dispersal component does not need separate timed
dosing. In this case, only a demand dosing system with a dose cycle
counter and hour meter (or a water meter on the water supply or
sewage stream) is required for the soil dispersal component.
2.5.1.2.3. Demand controlled pressure distribution systems must include an
electrical control system that:
WA DOH Publication #337-009
Page 20 of 61
Pressure Distribution Systems - Recommended Standards and Guidance
Effective Date: July 1, 2009
2.5.1.2.3.1. has the alarm circuit independent of the pump circuit.
2.5.1.2.3.2. will meet the functional and reliability requirements for
pressure distribution.
2.5.1.2.3.3. has controls and components that are listed by UL or
equivalent.
2.5.1.2.3.4. is secure from tampering and resistant to weather (minimum
of NEMA 4).
2.5.1.2.3.5. located outside, within line of sight of the pump chamber.
2.5.1.2.4. All control panels must have cycle counters and elapsed time meters
for all pumps. Alternatively, a water meter on either the water supply
or sewage streams will satisfy this requirement.
2.5.1.2.5. All control panels must be equipped with both audible and visual high
liquid level alarms and the alarms must be placed in a conspicuous
location.
2.5.1.2.6. Float switches must be mounted independent of the pump and
transport line so that they can be easily replaced and/or adjusted
without removing the pump.
The minimum requirements for timed pump cycle controls are a timer actuator float for the
pump and a high liquid level alarm. In addition, a low liquid level off float is highly
recommended. [See next section, Floats, for a discussion.]
2.5.1.2.7. Electrical control and other electrical components must be approved
by Underwriters Laboratories (UL) or equivalent.
2.5.1.2.8. Other standards that engineers, designers and installers need to be
aware of and comply with are electrical standards for pump and
control systems established by Washington State Department of Labor
and Industries.
A control box or panel installed on a treated 4” X 4” post is acceptable practice and does not
produce irritating resonations for the building occupants as occurs when the control panel is
mounted on buildings.
2.5.1.2.9. Minimum Dose Frequency - The minimum dosing frequency must be
according to the following:
WA DOH Publication #337-009
Page 21 of 61
Pressure Distribution Systems - Recommended Standards and Guidance
Effective Date: July 1, 2009
Soil Type 1 and 2
Soil Type 3
Soil Types 4-6
4 times per day
4 times per day
1 to 2 times per day
Dose Frequency - Although this standard lists the minimum frequency for various soil types,
more frequent doses than the minimum recommendation may be desirable in some designs.
Dosing of drainfields provides intermittent aeration to the infiltrative surface. With this method,
periods of loading are followed by periods of resting, with cycle intervals ranging from hours, to
a day or more. The resting phase should be sufficiently long to allow the system to drain and
expose the infiltrative surface to air, which encourages degradation of the clogging materials by
aerobic bacteria. In sands, however, the rapid infiltration rates can lead to bacterial and viral
contamination of shallow ground water, especially when first put into use. Therefore, systems
constructed in these soils should be dosed with small volumes of wastewater four or more times
a day to prevent saturated conditions from occurring and hence, inadequate treatment. In finer
textured soils, saturated flow is much less likely, so frequent doses do not add to the
performance. Large, less frequent doses are more suitable in these soils to provide longer
aeration times between doses (EPA, et al).
2.5.2. Floats (or other types of liquid level sensors)
2.5.2.1. For pump chambers serving single family residences, the necessary floats or
liquid level sensors are to actuate and turn off the pump control system, and
a high water alarm float. “Redundant off” controls are optional, but highly
recommended, and may be required by the local health officer.
2.5.2.2. Commercial and multi-family applications are required to meet Washington
State Department of Labor and Industries requirements for Class I, Division
I locations. These locations include redundant off and special ratings on
installed motors and equipment.
2.5.3. Siphons - Siphons may be used for charging a pressure distribution system.
However, they are flow-dependent and cannot provide evenly spaced doses, nor
limit the daily volume (See Appendix D). Therefore, siphons cannot be used
where standard 2.5.2.1. is required unless specific design elements cause the
siphon to produce the performance of 2.5.2.1. Where siphons are used the
following requirements apply:
2.5.3.1. The area to be dosed must be downhill from the siphon chamber and
according to manufacturer’s instructions for minimum elevation
differential.
2.5.3.2. The effluent must be screened before entering the siphon chamber.
2.5.3.3. The siphon must be installed to allow access for maintenance and cleaning.
WA DOH Publication #337-009
Page 22 of 61
Pressure Distribution Systems - Recommended Standards and Guidance
Effective Date: July 1, 2009
2.5.3.4. The dose counter(s) must be incorporated into the design and installation.
2.5.3.5. Siphons can only be used where timed dosing is not required, or where
some system or arrangement delivers effluent to the siphon chamber evenly
over a 24 hour period and no more than the maximum design flow for the
system.
These criteria can be met by the use of a small electric pump, which delivers effluent to the
siphon chamber evenly over a 24-hour period. This pump is sized to deliver no more than the
daily design flow to the siphon chamber in a 24 hour period. The siphon then doses a sand
filter, mound or sand-lined drainfield.
2.5.3.6. Siphons may only be used where they will be monitored and managed to the
satisfaction of the local health officer.
Other important considerations:
• Proper siphon size must be selected, as they are available in many sizes.
• Air leaks in the siphon or fittings will prevent the siphon from functioning.
• If the siphon chamber fills too rapidly, the bell and siphon will not receive a full dose of air
and will enter a trickling mode.
• Adjustment to the "trip" level of the liquid in the siphon chamber is limited; dose volume is
better handled by careful sizing of the siphon chamber.
• Blockage of the snifter tube, even momentarily, at the end of the discharge cycle, will cause
the siphon to enter a trickling mode.
• Transport pipe must be vented just outside the siphon chamber and other venting must be
placed in the system as needed.
• It is advisable not to bury the transport pipe until the system is tested and proper operation is
verified; additional venting may be needed for unanticipated air locks (see Figures 9 and 10).
2.6. Piping Materials
The pipe materials must meet the following minimum specifications:
2.6.1. At a minimum, the material must meet ASTM D2241 Class 160 or equivalent.
2.6.2. For schedule 40 and schedule 80 PVC, use ASTM D1785.
2.7. Manifold
(See Appendix A-4)
WA DOH Publication #337-009
Page 23 of 61
Pressure Distribution Systems - Recommended Standards and Guidance
Effective Date: July 1, 2009
The primary function of the manifold is to deliver equal flow to all lateral orifices while
minimizing system friction losses. While manifold patterns may take many forms, the most
common are the center and the end manifolds. End manifolds suffice for short laterals but
center manifolds allow for use of smaller lateral pipe sizes.
Manifold / Lateral Connection:
The laterals can be connected to the manifold in several ways. The manifold to lateral
connection must be appropriate for the site conditions and the specific use. Several types are
described below:
•
•
•
•
•
A header manifold is positioned at an elevation below the laterals (Figure 3A), with
check valves, flow control valves and feeder lines to each lateral. This configuration will
maintain the manifold, feeder lines and laterals full between doses, will not allow drain back,
and can be adjusted at one location to equalize residual head in all laterals. This
arrangement can deliver small volumes per dose, allowing many doses per day, if desired.
Caution should be taken to minimize the potential for effluent freezing in the laterals and
manifold.
A header manifold is placed at an elevation above the laterals (Figure 3B) without check
valves, with flow control valves and feeder lines to each lateral. The measured flows from an
orifice in each lateral are nearly equal without the use of check valves and without
maintaining the system full between doses.
Tee-to-Tee with manifold below (See Figure 4) - When freezing and sloping site
conditions are not a concern, this method of construction can be used to allow a very rapid
pressurization of the system, especially if the transport line remains full between doses. When
check valves are used in the manifold just downstream of each lateral, the manifold (and
laterals too, when orifices are in the 12 o'clock position) stays full of effluent between doses.
With this style, (1) there is no drainback from the upper laterals and manifold into the lower
lateral, (2) the system is completely charged within just a second or two after the pump is
turned on, and (3) the system can be dosed with very small volumes per dose.
[Note caution about check valves in section 2.7.1. of this section.]
Cross construction (See Figure 5) - If the lateral orifices are drilled in the 6 o'clock
position, this design will allow the laterals and a portion of the manifold to drain between
doses, assuming the transport line remains full between doses.
Tee-to-Tee with the manifold above - If the lateral orifices are drilled in the 6 o'clock
position, the entire distribution network will drain after each dose. This may be desirable on
a sloping site (where check valves are not installed in the manifold), to prevent upper laterals
from draining back through the manifold to the lowermost laterals, thereby overloading them.
If the orifices are drilled in the 12 o'clock position, the laterals will remain full between
doses. This may be desirable when the objective is to pressurize the distribution network
quickly without the use of check valves. Caution should be taken to minimize the potential for
effluent freezing in the laterals.
Sloping Sites: Manifold designs for sloping sites are particularly critical. Laterals at different
WA DOH Publication #337-009
Page 24 of 61
Pressure Distribution Systems - Recommended Standards and Guidance
Effective Date: July 1, 2009
elevations will have different residual pressures, with the lowest lateral having the highest
residual. In addition, if the manifold is not designed correctly the lowest lateral will receive
pressure before the top lateral and system backflow will continue to the lower laterals after the
pumping cycle has ended. In this instance, the lowest trench will receive more flow than the
others, with the potential for overload. While there may be several solutions to these problems,
Figures 3A & 3B illustrate two methods for resolving them. The check valves and flow control
valves shown in Figure 6A and 6B are assumed to be an integral part of the manifold.
2.7.1. Check Valves
2.7.1.1. When check valves are used, they must be installed so that they can be
removed for servicing or replacement. This means that unions or some
other fitting need to be included in the installation of check valves.
2.7.1.2. The location of check valves must be well documented and marked.
Preferably they are located in a structure that is accessible from the surface.
Check valves occasionally require maintenance, and therefore should be installed so that they
can be removed for servicing or replacement. Unions placed at the check valve are a common
means to allow servicing of the check valves while avoiding destruction or severe excavation of
the manifold. Some brass check valves can be disassembled without removing them from the
line.
2.8. Laterals
(See Appendix A-1, A-2, A-3)
The laterals in a pressure distribution system are perhaps the most important design aspect. All
design considerations to this point are essentially to serve the delivery of equal flows to each
square foot of drainfield bottom area.
Orifice Design:
The actual flow rate from each orifice is best represented by the equation:
Qo = 11.79 d2 h0.5
where:
Qo
d
h
is the orifice flow in gallons per minute
is the orifice diameter in inches
is the discharge head in feet (also called residual head)
(see Appendix A-2 for a derivation of this equation)
There are other factors complicating accurate calculation of the orifice flow rate such as
accurate drilling of holes, class of pipe, size of pipe, and slight variations in the friction
coefficients used for fittings. Proper technique and practice in drilling holes includes use of
WA DOH Publication #337-009
Page 25 of 61
Pressure Distribution Systems - Recommended Standards and Guidance
Effective Date: July 1, 2009
proper drill size and a sharp bit. Accurate holes also may require jigs or other drill stabilizing
tools to prevent wobble and to drill the hole perpendicular to the pipe. Proper layout and
control will ensure that the design number of orifices are actually placed in each lateral.
The above formula for calculating orifice discharge rates is recommended. However, the choice
of coefficient to use in a design can vary from 11.79 to 16, depending on the experience of the
designer in being able to predict accurately and control for the friction losses and other
variables of construction and manufacture. For many designers, experience has shown that use
of a slightly higher coefficient in the equation more accurately predicts the actual flow. For
whichever coefficient is selected, it is critically important that the same coefficient be used
throughout the design. Other ways to handle the inaccuracies are to add 10% to the total flow
after the calculations, or to design to more than minimum residual head. All of these are
acceptable.
2.8.1. Residual Pressure Requirements - For systems with orifice diameters of 3/16 inch
or larger, the minimum residual head at the orifice is 2 feet (.87 psi). For systems
with orifices less than 3/16 inch diameter, the minimum residual head is 5 feet
(2.18 psi).
2.8.2. Orifice Size and Orientation
2.8.2.1. Orifices must be no smaller than 1/8 inches in diameter.
2.8.2.2. When using gravelless chambers with pressure distribution, the orifices
must be oriented in the 12 o’clock position. If one or two orifices are
placed in the 6 o’clock position to facilitate draining after each pump cycle
(to prevent freezing in areas of the state where that may occur or to prevent
build-up of microbial growth inside the laterals), they must have some
mechanism to break the flow (an orifice shield that drains, a pad of gravel,
etc.).
See sections on orifice size, orientation and shields, and Figure 7.
2.8.3. Orifice Spacing
To prevent excessive variations in discharge rates and possible subsequent localized hydraulic
overload, the maximum acceptable flow deviations stated in the Performance Testing section
(Section 1.2.) of this document must be heeded.
2.8.3.1. Sand filters (including sand lined trenches), mounds and pressure
distribution in soil types 1, and 2 and in medium sands, must have a
minimum of one orifice per 6 ft2 of infiltrative surface area, evenly
distributed.
WA DOH Publication #337-009
Page 26 of 61
Pressure Distribution Systems - Recommended Standards and Guidance
Effective Date: July 1, 2009
2.8.3.2. In other soil types, there must be a minimum of one orifice every six feet on
center along the lateral.
While these are minimum requirements, orifices spaced at closer intervals may be prudent.
Closer orifice spacing should be considered when small doses are specified and where the
infiltrative surface is in highly structured soils or has large macropores.
2.8.3.3. The maximum spacing between the outside laterals and the edge of the
trench or bed must be 1/2 of the selected orifice spacing, ±0.5 feet.
2.8.4. Orifice Shields
Orifice shields may be the half pipe design, the local cap type, or another design which
accomplishes the same end result. See Figure 7.
2.8.4.1. When orifices are oriented in the 12 o'clock position, orifice shields or
gravelless chambers must be provided.
2.8.4.2. The shields must be strong enough to withstand the weight of the backfill
and large enough to protect the orifice from being plugged by pieces of
gravel.
2.8.5. Cleanouts and Monitoring Ports
2.8.5.1. All pressure distribution laterals must be equipped with cleanouts and
monitoring ports at the distal ends (see Figures 8A and 8B). These
cleanouts and monitoring ports must:
2.8.5.1.1. have threaded removable caps or plugs on the ends of the laterals to
allow for cleaning the laterals and for monitoring the lateral pressure,
2.8.5.1.2. be large enough to allow access to caps or plugs with hands, tools, etc.
2.8.5.1.3. be accessible from the ground surface,
2.8.5.1.4. be open and slotted at the bottom, and
2.8.5.1.5. be void of gravel to the infiltrative surface to allow visual monitoring
of standing water in the trench or bed.
2.8.5.2. All designs must show them in detail and explain how they accomplish the
respective tasks.
The functions of monitoring and cleanout can be separated and also be accomplished in other ways.
WA DOH Publication #337-009
Page 27 of 61
Pressure Distribution Systems - Recommended Standards and Guidance
Effective Date: July 1, 2009
2.8.6. Trenches
2.8.6.1. In a pressure drainfield, as in any drainfield, the bottom of the trench must
be level, ± 0.5 inches.
2.8.6.2. The bottom and sides of the trench must not be smeared.
2.8.6.3. In gravel-filled trenches and beds, an acceptable geotextile must be used on
top of the gravel before backfilling.
2.8.6.4. On sloping sites, the trenches and laterals must run parallel to the natural
ground contours.
2.9. Minimum Design Submittal
A completed design must include the following as a minimum:
2.9.1. meeting all requirements of WAC 246-272A-0200,
2.9.2. daily design flow,
2.9.3. septic tank size, location and outlet invert elevation,
2.9.4. pump pickup elevation and location, or siphon invert elevation and location,
2.9.5. size of pump or siphon chamber,
2.9.6. transport line length, location, highest elevation, and diameter,
2.9.7. all valves or other such components in the system,
2.9.8. manifold diameter, location, length, and orientation,
2.9.9. lateral diameter, location, length, orientation, and elevations,
2.9.10. orifice diameter, spacing, and orientation,
2.9.11. dose volume, pumping rate (gpm), dose frequency, and design residual pressure,
2.9.12. location and detail of access ports on the laterals,
2.9.13. detail of pump controls, floats, and the position of the floats,
2.9.14. an electrical wiring diagram specific to the project,
WA DOH Publication #337-009
Page 28 of 61
Pressure Distribution Systems - Recommended Standards and Guidance
Effective Date: July 1, 2009
2.9.15. system parameters and calculations used by the designer to arrive at the
component sizing and flow distribution shown in the design, and
2.9.16. a user's manual for the pressure distribution system must be developed and
provided to the homeowner and the local health department. This document may
be developed in conjunction with the installer and submitted with the as-built
information, but will be the responsibility of the designer.
2.10. Construction Record Information
A completed construction record submission must contain, at a minimum, the following
items:
2.10.1. all the items contained in the design submittal listed above, as installed,
identifying any changes from the approved plan,
2.10.2. the measured drawdown per dose cycle,
2.10.3. timer functions,
2.10.4. residual pressure and/or squirt height at the end of each lateral, as inspected, and
2.10.5. pump run time and pump time off.
2.11. User’s Manual
The user’s manual that is a part of the design submittal must contain, at a minimum, the
following:
2.11.1. diagrams of the system components,
2.11.2. explanation of general system function, operational expectations, owner
responsibility, etc.,
2.11.3. specifications of all electrical and mechanical components installed (occasionally
components other than those specified on the plans are used),
2.11.4. names and telephone numbers of the system designer, local health jurisdiction,
component manufacturers, supplier/installer, and/or the management entity to be
contacted in the event of a failure,
2.11.5. information on the periodic maintenance requirements of the various components
of the sewage system, and
2.11.6. information on "trouble-shooting" common operational problems that might
occur. This information should be as detailed and complete as needed to assist
WA DOH Publication #337-009
Page 29 of 61
Pressure Distribution Systems - Recommended Standards and Guidance
Effective Date: July 1, 2009
the system owner to make accurate decisions about when and how to attempt
corrections of operational problems, and when to call for professional assistance.
3. Operation and Maintenance
The systems must be monitored and maintained at a frequency commensurate with the site,
soil, system complexity and use patterns. As a minimum, it is strongly recommended that
the items in 3.1 - 3.5 be inspected at six months and then yearly, after the system is put into
use. The local health department permit should clearly delineate who must perform the
inspections. Refer to the system construction record for initial readings and settings. The
owners of pressure distribution systems should be notified that their systems should be
inspected and / or serviced on a yearly basis.
3.1. Evaluate Drainfield
3.1.1. for indications of surfacing effluent.
3.1.2. for appropriate vegetation, landscaping impacts, ponds, etc.
3.1.3. for absence of heavy traffic.
3.1.4. for inappropriate building.
3.1.5. for impervious materials or surfaces.
3.1.6. for abnormal settling or erosion.
3.2. Evaluate Laterals
3.2.1. for residual pressure at the distal ends. Confirm that it is the same as those
recorded on the construction record. If not the same, laterals and orifices need to
be cleaned.
3.2.2. for equal flows in each lateral.
3.2.3. for need for cleaning. Clean laterals and orifices as necessary.
3.3. Measure Pump Run Time per Cycle and Drawdown
Compare these values with those recorded in the construction record. If not the same,
evaluate the system for improperly set timer control, float switches, clogged laterals,
plugged orifices.
3.4. Test Alarms
Test alarms for proper functioning (high and low liquid level).
WA DOH Publication #337-009
Page 30 of 61
Pressure Distribution Systems - Recommended Standards and Guidance
Effective Date: July 1, 2009
3.5. Evaluate Septic Tank and Pump Chamber
3.5.1. for sludge and scum accumulations; pump when the sludge and scum thickness
total 1/3 of the depth of the tank.
3.5.2. for clogging, damage, and proper placement of outlet baffle screen. Clean each
time it is inspected or as needed to avoid clogging.
3.5.3. for signs of leaking in tanks and risers. Repair or replace if necessary.
3.5.4. for risers and lids being above grade and having lids that are secure.
3.5.5. for properly functioning of floats. Movement should not be restricted. Floats
should be positioned correctly and provide positive instrumentation signals.
Adjust and repair as necessary.
3.6. Findings and Repairs
All findings and repairs are to be recorded, records filed for ready access, and reports
sent to local health department.
WA DOH Publication #337-009
Page 31 of 61
Pressure Distribution Systems - Recommended Standards and Guidance
Effective Date: July 1, 2009
Figures
SEPTIC TANK
ACCESS RISER
PUMP CHAMBER
CONTROL PANEL
PRESSURE DISTRIBUTION LATERALS
TRANSPORT PIPE
MANIFOLD PIPE
CLEANOUT / MONTIORING PORTS
PRESSURE DISTRIBUTION
DRAINFIELD
FIGURE 1
WA DOH Publication #337-009
Page 32 of 61
Pressure Distribution Systems - Recommended Standards and Guidance
Effective Date: July 1, 2009
SECURED LID WITH GAS TIGHT SEAL
24” DIAMETER
ACCESS RISER
FINISH GRADE
TO PUMP
CHAMBER
FROM SEWAGE
SOURCE
FLOATING MAT
APPROVED
EFFLUENT
FILTER
SEDIMENTS
SEPTIC TANK
(TYPICAL)
SECURED LID WITH GAS TIGHT SEAL
THREADED UNION
24” DIAMETER
ACCESS RISER
SERVICE
VALVE *
FINISH GRADE
FROM SEPTIC
TANK
TO DRAINFIELD
EMERGENCY STORAGE
ANTI SIPHON
VALVE *
HIGH WATER ALARM LEVEL
INDEPENDENT
FLOAT STEM
FOR FLOAT
MOUNTING
WORKING VOLUME
NORMAL TIMER OFF LEVEL
ENCLOSED PUMP
SEDIMENT SHROUD *
CHECK VALVE *
18”
SEDIMENTS
SUBMERSIBLE
CENTRIFUGAL
PUMP
PUMP CHAMBER
(TYPICAL)
* AS NEEDED
FIGURE 2
WA DOH Publication #337-009
Page 33 of 61
Pressure Distribution Systems - Recommended Standards and Guidance
Effective Date: July 1, 2009
PRESSURE DISTRIBUTION
LATERALS
DOWN SLOPE
GRADIENT
FEATURES:
1. FLOW IS CONTROLLED TO EACH
LATERAL BY FLOW CONTROL
VALVE
2. BACKFLOW IS PREVENTED BY
CHECK VALVE ON EACH
LATERAL FEEDER PIPE
3.PIPING ABOVE CHECK VALVES IS
ALWAYS FLOODED. LENGTH AND
VOLUME OF LATERALS OR
LATERAL FEEDER PIPES DOES
NOT IMPACT SIZE OF DOSE.
LEGEND
LATERAL FEEDER PIPES
LOCATE VALVE CONTROL BOX
AT ELEVATION BELOW
LOWEST LATERAL SERVED
HEADER MANIFOLD PIPE
CHECK VALVE
FLOW CONTROL
VALVE
TRANSPORT PIPE
FROM PUMP
CHAMBER
PRESSURE DISTRIBUTION DRAINFIELD
(SLOPING GROUND)
FIGURE 3A
WA DOH Publication #337-009
Page 34 of 61
Pressure Distribution Systems - Recommended Standards and Guidance
Effective Date: July 1, 2009
PRESSURE DISTRIBUTION
LATERALS
TRANSPORT PIPE
FROM PUMP
CHAMBER
DOWN SLOPE
GRADIENT
HEADER MANIFOLD PIPE
LEGEND
CHECK VALVE
FLOW CONTROL
VALVE
FEATURES:
1. FLOW IS CONTROLLED TO EACH
LATERAL BY FLOW CONTROL
VALVE
2. BACKFLOW IS PREVENTED BY
MANIFOLD POSITION ABOVE
LATERALS
3. ACCEPTABLE VARIANCE OF DOSE TO EACH
LATERAL MAY BE IMPOSSIBLE DUE TO
DIFFERING
VOLUMES WITHIN EACH OF
THE
LATERAL FEEDER PIPES, ALL OF
WHICH DRAIN AFTER PUMP CYCLE
PRESSURE DISTRIBUTION DRAINFIELD
(SLOPING GROUND)
WA DOH Publication #337-009
LATERAL FEEDER PIPES
FIGURE 3B
Page 35 of 61
Pressure Distribution Systems - Recommended Standards and Guidance
Effective Date: July 1, 2009
Manifold Below
Threded Plug or Cap
Check Valve
Orifices
Manifold installed below freezing depth
Flow Control Valve
From Pump
= Check Valve
= Flow Control
Valve
Pressure Drainfield
Tee To Tee
Figure 4
Threaded Cap or Plug
Check Valve
Orifices
Flow Control Valve
From Pump
= Check Valve
= Flow Control
Valve
Pressure Drainfield
Cross Construction
Figure 5
WA DOH Publication #337-009
Page 36 of 61
Pressure Distribution Systems - Recommended Standards and Guidance
Effective Date: July 1, 2009
RISER WITH LOCKING LID
TO DRAINFIELD
PRESSURE LATERALS
A
A
FLOW CONTROL VALVE
SLOTS AS
REQUIRED
FLAP CHECK
VALVE
LONG SWEEP 90
DEGREE ELBOW
WASHED ROCK
DRAIN SUMP
SECTION A-A
TRANSPORT PIPE FROM
PUMP CHAMBER
DRAINFIELD CONTROL BOX
(SLOPING GROUND; MANIFOLD BELOW LATERALS)
FIGURE 6A
WA DOH Publication #337-009
Page 37 of 61
Pressure Distribution Systems - Recommended Standards and Guidance
Effective Date: July 1, 2009
TO DRAINFIELD
PRESSURE LATERALS
A
RISER WITH LOCKING LID
A
FLOW CONTROL VALVE
SLOTS AS
REQUIRED
LONG SWEEP 90
DEGREE ELBOW
SECTION A-A
WASHED ROCK
DRAIN SUMP
TRANSPORT PIPE FROM
PUMP CHAMBER
DRAINFIELD CONTROL BOX
(SLOPING GROUND; MANIFOLD ABOVE LATERALS)
FIGURE 6B
WA DOH Publication #337-009
Page 38 of 61
Pressure Distribution Systems - Recommended Standards and Guidance
Effective Date: July 1, 2009
Original Ground Surface
Original Ground Surface
Cover Soil
Cover Soil
Orifice shield
Lateral
Orifice cap
Lateral
Gravel
Gravel
Orifice covered by 2”- 6" PVC pipe cut in 1/2
Orifice with Cap Trench Detail
N.T.S.
Orifice with Cap Trench Detail
N.T.S.
Original Ground Surface
Cover Soil
6" PVC cut in half
Lateral
Gravel
Pressure line in 6" PVC 1/2 shell braced to prevent line shifting.
Orifice with Cap Trench Detail
N.T.S.
Original Ground Surface
Original Ground Surface
Cover Soil
Cover Soil
Chamber
Chamber
Lateral
Lateral
Pressure line suspended per manufacturer specifications.
Orifices must be oriented in the 12:00 position
Pressure line to be cross braced to prevent line shifting.
Orifices must be oriented in the 12:00 position
Gravelless Trench Detail
N.T.S.
Gravelless Trench Detail
N.T.S.
Orifice Caps and Shields
FIGURE 7
METER BOX OR
OTHER ENCLOSURE
THREADED CAP
BACKFILL
ORIFICE
SHIELD
LATERAL
CLEAN, WASHED
GRAVEL
CLEANOUT AND MONITORING PORT
FIGURE 8A
WA DOH Publication #337-009
Page 39 of 61
Pressure Distribution Systems - Recommended Standards and Guidance
Effective Date: July 1, 2009
THREADED CAP OR PLUG
6” PVC
PLUG IN SLEEVE
LAST ORIFICE; WITH
ORIFICE SHIELDS IF
ORIFICE ORIENTATION IS
UPWARD
BACKFILL
MATERIAL
6” - 24”
PRESSURE LATERAL
AS SPECIFIED
PVC HOSE OR
LONG SWEEP
ELBOW
DRAIN ROCK; 6” MIN.
BELOW PIPE
UNDISTURBED SOIL
6” PVC WITH DRAIN
HOLES; EXTEND TO
BOTTOM OF GRAVEL TO
MONITOR PONDING
INFILTRATIVE SURFACE
MONITORING/CLEANOUT PORT
(EXAMPLE)
FIGURE 8B
WA DOH Publication #337-009
Page 40 of 61
Pressure Distribution Systems - Recommended Standards and Guidance
Effective Date: July 1, 2009
TRIGGER TRAP
BELL
VENT PIPE
DRAWDOWN
SNIFTER PIPE
INTRUSION PIPE
DISCHARGE OUTLET
INLET PIPE
TRAP DEPTH
LONG LEG
SHORT LEG
TRAP
EXAMPLE OF SIPHON
FIGURE 9
WA DOH Publication #337-009
Page 41 of 61
Pressure Distribution Systems - Recommended Standards and Guidance
Effective Date: July 1, 2009
SECURED LID WITH GAS TIGHT SEAL
24” DIAMETER
ACCESS RISER
FINISHED GRADE
TRANSPORT PIPE
VENT PIPE
FROM
SEPTIC
TANK
TRAP
VENT
ON
24”
OFF
TO
DRAINFIELD
25 GALLONS / INCH
SECURE
MOUNTING
600 GALLONS / DOSE
SIPHON TO
TRANSPORT
REDUCER
SIPHON TANK
HIGH DOSE VOLUME EXAMPLE
SECURED LID WITH GAS TIGHT SEAL
24” DIAMETER
ACCESS RISER
FINISHED GRADE
TRANSPORT PIPE
VENT PIPE
FROM
SEPTIC
TANK
TRAP
VENT
ON
12”
OFF
TO
DRAINFIELD
SIPHON TO
TRANSPORT
REDUCER
7.5 GALLONS/INCH
90 GALLONS/DOSE
SECURE
MOUNTING
SIPHON TANK
LOW DOSE VOLUME EXAMPLE
WA DOH Publication #337-009
FIGURE 10
Page 42 of 61
Pressure Distribution Systems - Recommended Standards and Guidance
Effective Date: July 1, 2009
Appendix A – Useful Tables for Pressure Distribution
The design tables in the four sections of this appendix have been developed in order to allow the
designer to evaluate alternative lateral configurations.
Appendix A-1, LATERAL DESIGN TABLE, has a table of maximum lateral lengths for various
lateral diameters, orifice diameters and orifice spacings, and includes design criteria used to
calculate maximum lateral lengths.
Appendix A-2, ORIFICE DISCHARGE RATE DESIGN AID, contains a derivation of an
equation used to calculate orifice discharge rates and includes a table of discharge rates for
various residual heads and orifice diameters.
Appendix A-3, FRICTION LOSS DESIGN AID, includes a derivation of an equation that can be
used to calculate friction losses and a table of constants to simplify the calculation. Also
included is a table of friction loss for PVC pipe fittings.
Appendix A-4, MAXIMUM MANIFOLD LENGTHS, lists the assumptions used to calculate the
enclosed tables for maximum manifold length, one for 1/8 inch and 5/32 inch orifices (where the
minimum residual head at the distal orifice must be 5 feet) and one for orifices of 3/16 inch and
up (where the minimum residual head at the distal orifice must be 2 feet).
Throughout Appendix A, it is assumed that laterals and manifolds will be constructed using only
PVC pipe materials conforming to ASTM standards D-2241 or D-1785.
A-1: LATERAL DESIGN TABLES
The maximum allowable length for any lateral is determined by allowable differences in
discharge rates between the proximal and distal orifices. These tables assume that Qp/Qd < 1.1
Where Qp = the proximal orifice discharge rate
Qd = the distal orifice discharge rate
The maximum allowable difference in discharge rates is 10%. The maximum allowable lateral
length is a function of lateral diameter and orifice diameter and is independent of the residual
pressure.
Orifice discharge rates are a function of orifice diameter and residual pressure (see Appendix A2 for a discussion). Table A-1 gives the maximum lateral length for each orifice diameter, lateral
diameter, and orifice spacing.
WA DOH Publication #337-009
Page 43 of 61
Pressure Distribution Systems - Recommended Standards and Guidance
Effective Date: July 1, 2009
Table A-1
Lateral Design Table
Maximum Lateral Length (ft)
Orifice
(inches)
Lateral
(inches)
1/8
1/8
1/8
1/8
1/8
1/8
1/8
1/8
1/8
1/8
1/8
1/8
1/8
1/8
1/8
1/8
1/8
1/8
1/8
1/8
1/8
1/8
1/8
1/8
1/8
1/8
1/8
1/8
5/32
5/32
5/32
5/32
1
1
1
1
1
1
1
1.25
1.25
1.25
1.25
1.25
1.25
1.25
1.5
1.5
1.5
1.5
1.5
1.5
1.5
2
2
2
2
2
2
2
1
1
1
1
WA DOH Publication #337-009
Orifice Spacing
(feet)
Schedule 40
1.5
2
2.5
3
4
5
6
1.5
2
2.5
3
4
5
6
1.5
2
2.5
3
4
5
6
1.5
2
2.5
3
4
5
6
1.5
2
2.5
3
42
50
57.5
66
80
90
102
66
80
92.5
105
124
145
162
85.5
104
120
135
164
190
210
132
160
185
207
248
290
324
31.5
36
42.5
48
Pipe Material
Class 200
Class 160
51
62
72.5
81
96
110
126
76.5
92
107.5
120
144
165
186
96
116
135
150
184
210
240
141
170
197.5
222
268
310
348
39
46
52.5
60
79.5
96
110
123
148
175
192
100.5
120
140
156
188
220
246
145.5
176
202.5
228
276
320
360
39
46
52.5
60
Page 44 of 61
Pressure Distribution Systems - Recommended Standards and Guidance
Effective Date: July 1, 2009
Table A-1
Lateral Design Table (continued)
Maximum Lateral Length (ft)
Orifice
(inches)
Lateral
(inches)
5/32
5/32
5/32
5/32
5/32
5/32
5/32
5/32
5/32
5/32
5/32
5/32
5/32
5/32
5/32
5/32
5/32
5/32
5/32
5/32
5/32
5/32
5/32
5/32
3/16
3/16
3/16
3/16
3/16
3/16
3/16
3/16
1
1
1
1 1/4
1 1/4
1 1/4
1 1/4
1 1/4
1 1/4
1 1/4
1 1/2
1 1/2
1 1/2
1 1/2
1 1/2
1 1/2
1 1/2
2
2
2
2
2
2
2
1
1
1
1
1
1
1
1.25
WA DOH Publication #337-009
Orifice Spacing
(feet)
Schedule 40
4
5
6
1.5
2
2.5
3
4
5
6
1.5
2
2.5
3
4
5
6
1.5
2
2.5
3
4
5
6
1.5
2
2.5
3
4
5
6
1.5
56
65
72
48
58
67.5
75
92
105
120
63
76
87.5
99
120
140
156
96
116
135
150
184
210
240
24
28
32.5
39
44
50
60
37.5
Pipe Material
Class 200
Class 160
72
80
90
55.5
68
77.5
87
104
120
138
70.5
84
97.5
111
132
155
174
103.5
124
142.5
162
196
225
252
30
36
42.5
45
56
65
72
43.5
72
85
96
58.5
70
80
90
108
125
144
73.5
88
102.5
114
136
160
180
106.5
128
147.5
168
200
235
264
45
Page 45 of 61
Pressure Distribution Systems - Recommended Standards and Guidance
Effective Date: July 1, 2009
Table A-1
Lateral Design Table (continued)
Maximum Lateral Length (ft)
Orifice
(inches)
Lateral
(inches)
3/16
3/16
3/16
3/16
3/16
3/16
3/16
3/16
3/16
3/16
3/16
3/16
3/16
3/16
3/16
3/16
3/16
3/16
3/16
3/16
7/32
7/32
7/32
7/32
7/32
7/32
7/32
7/32
7/32
7/32
7/32
7/32
7/32
1.25
1.25
1.25
1.25
1.25
1.25
1.5
1.5
1.5
1.5
1.5
1.5
1.5
2
2
2
2
2
2
2
1
1
1
1
1
1
1
1.25
1.25
1.25
1.25
1.25
1.25
WA DOH Publication #337-009
Orifice Spacing
(feet)
Schedule 40
2
2.5
3
4
5
6
1.5
2
2.5
3
4
5
6
1.5
2
2.5
3
4
5
6
1.5
2
2.5
3
4
5
6
1.5
2
2.5
3
4
5
46
52.5
60
72
85
96
49.5
60
70
78
92
110
120
76.5
92
105
120
144
165
186
19.5
24
27.5
30
36
45
48
31.5
38
42.5
48
60
70
Pipe Material
Class 200
Class 160
54
62.5
69
84
95
108
55.5
68
77.5
87
104
120
138
81
98
112.5
129
152
180
198
24
30
35
39
44
55
60
36
44
50
57
68
80
56
62.5
72
88
100
114
57
70
80
90
108
125
144
84
102
117.5
132
160
185
210
37.5
46
52.5
60
72
80
Page 46 of 61
Pressure Distribution Systems - Recommended Standards and Guidance
Effective Date: July 1, 2009
Table A-1
Lateral Design Table (continued)
Maximum Lateral Length (ft)
Orifice
(inches)
Lateral
(inches)
7/32
7/32
7/32
7/32
7/32
7/32
7/32
7/32
7/32
7/32
7/32
7/32
7/32
7/32
7/32
1/4
1/4
1/4
1/4
1/4
1/4
1/4
1/4
1/4
1/4
1/4
1/4
1/4
1/4
1/4
1/4
1/4
1.25
1.5
1.5
1.5
1.5
1.5
1.5
1.5
2
2
2
2
2
2
2
1
1
1
1
1
1
1
1.25
1.25
1.25
1.25
1.25
1.25
1.25
1.5
1.5
1.5
WA DOH Publication #337-009
Orifice Spacing
(feet)
Schedule 40
6
1.5
2
2.5
3
4
5
6
1.5
2
2.5
3
4
5
6
1.5
2
2.5
3
4
5
6
1.5
2
2.5
3
4
5
6
1.5
2
2.5
78
40.5
50
57.5
63
76
90
102
63
76
87.5
99
116
135
156
16.5
20
22.5
27
32
35
42
27
32
37.5
42
48
55
66
34.5
42
47.5
Pipe Material
Class 200
Class 160
90
45
54
62.5
72
88
100
114
66
80
92.5
105
124
145
162
21
24
27.5
33
40
45
48
30
36
42.5
48
56
65
72
39
46
52.5
90
46.5
56
65
75
88
105
114
69
84
95
108
132
150
168
31.5
38
45
48
60
70
78
39
48
55
Page 47 of 61
Pressure Distribution Systems - Recommended Standards and Guidance
Effective Date: July 1, 2009
Table A-1
Lateral Design Table (continued)
Maximum Lateral Length (ft)
Orifice
(inches)
Lateral
(inches)
1/4
1/4
1/4
1/4
1/4
1/4
1/4
1/4
1/4
1/4
1/4
1.5
1.5
1.5
1.5
2
2
2
2
2
2
2
WA DOH Publication #337-009
Orifice Spacing
(feet)
Schedule 40
3
4
5
6
1.5
2
2.5
3
4
5
6
54
64
75
84
52.5
64
72.5
81
100
115
126
Pipe Material
Class 200
Class 160
60
72
85
96
55.5
68
77.5
87
104
120
138
63
76
85
96
58.5
70
80
90
108
125
144
Page 48 of 61
Pressure Distribution Systems - Recommended Standards and Guidance
Effective Date: July 1, 2009
A-2: ORIFICE DISCHARGE RATE DESIGN AID
Orifice discharge rates can be calculated using Toricelli's equation:
Q = C d Ao 2gh
Where: Q = the discharge rate in ft3/sec
Cd = the discharge coefficient (unitless)
Ao= the cross sectional area of the orifice in ft2
g = the acceleration due to gravity (32.2 ft/sec2)
h = the residual pressure head at the orifice in ft
The formula shown above can be simplified for design purposes by incorporating the discharge
coefficient and using conversion factors so that the discharge is given in gallons per minute and the
orifice diameter is given in inches. The discharge coefficient depends on the characteristics of the
orifice and is usually determined empirically. This value can range from 0.6 to 0.8 but a value of 0.6
was assumed for the purpose of this design aid. The formula therefore simplifies to:
Q = 11.79 d 2 h
Where: Q = the orifice discharge rate in gpm
d = the orifice diameter in inches
h = the residual pressure head at the orifice in feet
On the next page Table A-2 gives orifice discharge rates (in gpm) generated using the above formula
for various residual pressures (head) and orifice diameters.
WA DOH Publication #337-009
Page 49 of 61
Pressure Distribution Systems - Recommended Standards and Guidance
Effective Date: July 1, 2009
Table A-2
Orifice Discharge Rates (gpm)
Head (ft)
2
3
4
5
6
7
8
9
10
1/8
5/32
0.41
0.45
0.49
0.52
0.55
0.58
0.64
0.71
0.76
0.81
0.86
0.91
Orifice Diameter (in)
3/16
0.59
0.72
0.83
0.93
1.02
1.10
1.17
1.24
1.31
7/32
0.80
0.98
1.13
1.26
1.38
1.49
1.60
1.69
1.78
1/4
1.04
1.28
1.47
1.65
1.80
1.95
2.08
2.21
2.33
For residuals greater than 10 feet or for orifice diameters greater than 1/4 inch, the equation must be
used. This is also true if the residual pressure is not a whole number. For large systems use the
equation and verify with Table A-2.
Note: Table A-2 was generated assuming that the minimum residual head at the distal orifice is 5
feet when orifices are 1/8 and 5/32 inch in diameter, and 2 feet for larger orifice diameters.
WA DOH Publication #337-009
Page 50 of 61
Pressure Distribution Systems - Recommended Standards and Guidance
Effective Date: July 1, 2009
A-3: FRICTION LOSS DESIGN AID
Friction losses in pipes can be calculated using the Hazen-Williams formula:
Original form: V = 1.318 * C * R 0.63 * S 0.54
Where: V = velocity (ft/sec)
C = Hazen-Williams flow coefficient (unitless)
R = hydraulic radius (ft2/ft)1
S = slope of energy grade line (ft/1000 ft)
This equation can be modified through algebraic substitutions and using unit conversions to yield a
formula that directly calculates friction loss2:
f =
10.46L Q1.85
C 1.85 D 4.87
Where: f = friction loss (ft)
D = actual inside pipe diameter (in)
L = length of pipe (ft)
Q = flow (gpm)
C = Hazen-Williams flow coefficient (unitless)
The Hazen-Williams flow coefficient (C) depends on the roughness of the piping material. Flow
coefficients for PVC pipe have been established by various researchers in a range of values from 155
to 165 for both new and used PVC pipe. A coefficient of C = 150 generally is considered to yield
conservative results in the design of PVC piping systems.3
The equation shown above can be further simplified by assuming that only PVC pipe conforming to
ASTM standard D-2241 (or D-1785 for Schedule 40 and Schedule 80 pipe) is used. With this
assumption, the inside diameters ("D") for the various nominal pipe sizes can be determined and
combined with all other constants to yield the following equation:
1
hydraulic radius = cross sectional area of the conduit divided by the inner perimeter of the
conduit.
2
Analysis of Pipe Flow Networks, Jeppson, Ann Arbor Science Publications, 1983 (p. 41).
3
Handbook of PVC Pipe Design and Construction, 2nd Edition, Uni-Bell Plastic Pipe
Association, 1982.
WA DOH Publication #337-009
Page 51 of 61
Pressure Distribution Systems - Recommended Standards and Guidance
Effective Date: July 1, 2009
f = L (Q/K)1.85
Where:
f = friction loss through pipe (ft)
L = length of pipe (ft)
Q = flow (gpm)
K = Constant from Table C-3-1
(K can be determined for any PVC pipe conforming to the above ASTM standards using the
equation K = 42.17 * D2.63)
Table A-3-1
Table for Constant “K”
Nominal Pipe Diameter
Schedule 40
Class 200
Class 160
1
1.25
1.5
2
2.5
3
4
6
47.8
98.3
147.5
284.5
454.1
803.9
1642.9
4826.6
66.5
122.9
175.5
315.2
520.7
873.3
1692.7
4677.4
129.4
184.8
332.5
551.1
920.5
1783.9
4932
Friction loss for some PVC pipe fittings, given in terms of equivalent length of pipe, are provided in
Table A-3-2.
WA DOH Publication #337-009
Page 52 of 61
Pressure Distribution Systems - Recommended Standards and Guidance
Effective Date: July 1, 2009
TABLE A-3-2
Friction Loss for PVC Fittings1
Equivalent Length of Pipe (feet)
PVC Pipe Fittings
1
Pipe Size
(in)
90o
Elbow
45o
Elbow
Through
Tee Run
Through
Tee Branch
.5
.75
1
1.25
1.5
2
2.5
3
4
6
8
1.5
2.0
2.25
4.0
4.0
6.0
8.0
8.0
12.0
18.0
22.0
0.8
1.0
1.4
1.8
2.0
2.5
3.0
4.0
5.0
8.0
10.0
1.0
1.4
1.7
2.3
2.7
4.3
5.1
6.3
8.3
12.5
16.5
4.0
5.0
6.0
7.0
8.0
12.0
15.0
16.0
22.0
32.0
38.0
From SPEC-DATA, Sheet 15, Plastic Pipe and Fitting Association, November 1994
WA DOH Publication #337-009
Page 53 of 61
Pressure Distribution Systems - Recommended Standards and Guidance
Effective Date: July 1, 2009
A-4: MAXIMUM MANIFOLD LENGTHS
Tables A-4-1 and A-4-2 can be used to determine maximum manifold lengths for various
manifold diameters, lateral discharge rates and lateral spacings. The method used to determine
the table values is described below.
Pressurized distribution systems are designed to assure even distribution of effluent throughout
the drainfield area. Even distribution maximizes the treatment capabilities and useful life of the
absorption area. Completely uniform distribution is difficult or impossible to obtain because of
friction losses that occur in all piping networks so we settle for a standard or acceptable variance
in orifice discharges throughout the network. The maximum lateral lengths in Table A-1 were
developed to assure there will be no more than a 10% variance (drop) in the discharge rates
between the proximal and distal orifices in any given lateral. The maximum manifold lengths in
the tables below were developed to assure there will be no more than a 15% variance in
discharge rates between any two orifices in a given distribution system.
Two assumptions used to develop these tables are: (1) the maximum variance in orifice
discharge rates within a network occurs between the proximal orifice in the first lateral
connected to a manifold and the distal orifice on the last lateral connected to the manifold and
(2) the friction loss that occurs between the proximal orifice of a lateral and the point where the
lateral connects to the manifold is negligible.
Using the assumptions mentioned above a computer program was developed to calculate
maximum manifold lengths for various manifold diameters, lateral discharge rates and lateral
spacings. The program assumes that the discharge rate at the distal orifice of the last lateral in a
distribution system is as listed in Table A-2 for a given orifice size at the required minimum
residual head. That value is multiplied by 1.1 and 1.15 to determine the maximum allowable
discharge rates at the proximal orifices of the last and first laterals in the network, respectively.
The residual head (h) that corresponds to those discharges was calculated by manipulating the
orifice discharge equation in Appendix A-2 and solving for “h”.
Using the simplified equation in Appendix A-3, the friction loss that occurs across the manifold
was calculated for various materials and pipe diameters (“K”), lateral discharge rates (“Q”) and
lateral spacings (“L”). The program adds the friction loss calculated for successive pipe
segments to the residual pressure, which corresponds to the proximal orifice discharge at the last
lateral. The combined value is compared to the residual pressure at the proximal orifice of the
first lateral until it is equal to or greater than this value.
Maximum manifold lengths were calculated as described above for various pipe materials and
orifice diameters. Slightly greater manifold lengths were obtained when 1/8 and 5/32 inch
orifices were assumed using 5 feet residual pressure at the distal orifice (see Table A-4-2).
These tables were generated using Schedule 40 as the pipe material, which yields the most
conservative results (shorter manifold lengths).
WA DOH Publication #337-009
Page 54 of 61
Pressure Distribution Systems - Recommended Standards and Guidance
Effective Date: July 1, 2009
Table A-4-1
(for orifice diameters of 3/16 in. and up with minimum 2 feet of residual head)
Maximum Manifold Length (ft)
Lateral Discharge
Rate (gpm/lateral)
Manifold Diameter (inches)
2
3
Lateral Spacing (ft)
1 1/4
1 1/2
4
End
Central
Manifold Manifold 2 3 4 6 8 10 2 3 4 6 8 10 2 3 4 6 8 10 2 3 4 6 8 10 2 3 4 6 8 10 2 3
5
10
15
20
25
30
35
40
45
50
55
60
65
70
75
80
85
90
95
100
10
20
30
40
50
60
70
80
90
100
110
120
130
140
150
160
170
180
190
200
4 6 4 6 8 10 6 6 8 12 8 10 10 12 16
2 3 4
2 3 4 6 8
6 6 8
2
2 3 4
4 6 4
2
2 3 4
2 3 4
2 3 4
2 3
2
18
12
6
6
24 20 22 27 32
8 10 12 15 20
8 10 10 12 12
8
8 9 12
6 9 8
6 6 8
4 6 8
4 6 4
4 3 4
4 3 4
2 3 4
2 3 4
2 3 4
2 3 4
2 3 4
2 3 4
2 3
2 3
2 3
2
42
24
18
12
12
6
6
6
6
6
6
6
6
48
32
24
16
16
8
8
8
8
8
8
60
30
20
20
10
10
10
10
10
10
34
22
16
12
10
10
8
8
6
6
6
6
6
4
4
4
4
4
4
4
45
27
21
18
15
12
12
9
9
9
6
6
6
6
6
6
6
3
3
3
52
32
24
20
16
16
12
12
8
8
8
8
8
8
8
4
4
4
4
4
72
42
30
24
18
18
18
12
12
12
12
12
6
6
6
6
6
6
6
6
80
48
40
32
24
24
16
16
16
16
8
8
8
8
8
8
8
8
8
8
90
60
40
30
30
20
20
20
20
10
10
10
10
10
10
10
10
10
10
10
72
46
34
28
24
22
18
18
16
14
14
12
12
12
10
10
10
10
8
8
93
57
45
36
30
27
24
21
21
18
18
15
15
15
15
12
12
12
12
12
6
4
112
72
52
44
36
32
28
28
24
24
20
20
20
16
16
16
16
12
12
12
6
144
90
66
54
48
42
36
36
30
30
24
24
24
24
18
18
18
18
18
18
8
176
112
80
64
56
48
40
40
32
32
32
32
24
24
24
24
24
24
16
16
10
200
120
90
80
60
60
50
40
40
40
30
30
30
30
30
30
20
20
20
20
Instructions: This Table can be used to determine maximum length of a given diameter manifold or to determine required minimum diameter for a given manifold length.
Known values must include:
1) Manifold - lateral configuration (end or central)
2) Lateral discharge rate “Q” in gallons per minute
3) Lateral spacing in feet
Example A: Central manifold configuration, lateral discharge “Q” = 40 gpm, lateral spacing = 6 ft., manifold diameter = 4 inch; Maximum length = 12 ft.
Example B: End manifold configuration, lateral discharge “Q” = 30 gpm, lateral spacing = 6 ft., manifold length = 18 ft.; Minimum diameter = 3 inch
WA DOH Publication #337-009
Page 55 of 61
Pressure Distribution Systems - Recommended Standards and Guidance
Effective Date: July 1, 2009
TABLE A-4-2
(for orifice diameters of 1/8 in. and 5/32 in. with minimum 5 feet of residual head)
Maximum Manifold Length (ft)
Lateral Discharge
Rate (gpm/lateral)
Central
End
Manifold Manifold
5
10
10
20
15
30
20
40
25
50
30
60
35
70
40
80
45
90
50
100
55
110
60
120
65
130
70
140
75
150
80
160
85
170
90
180
95
190
100
200
1 1/4
2
6
4
2
2
3
9
3
3
4 6 8 10 2
8 12 16 10 8
4 6 8 10 4
4
4
2
2
2
2
1 1/2
3
12
6
3
3
3
4
12
8
4
4
4
6
18
6
6
6
8
16
8
8
10
20
10
10
2
14
8
6
4
4
4
2
2
2
2
2
2
2
2
3
18
12
6
6
6
3
3
3
3
3
3
Manifold Diameter (inches)
2
3
Lateral Spacing (ft)
4 6 8 10 2 3 4 6 8 10
20 30 32 40 30 39 48 60 72 80
12 18 16 20 18 24 28 36 40 50
8 12 8 10 14 18 20 24 32 30
8 6 8 10 12 15 16 18 24 30
4 6 8 10 10 12 12 18 16 20
4 6 8 10 8 9 12 12 16 20
4 6
8 9 12 12 16 20
4
6 9 8 12 16 10
4
6 6 8 12 8 10
6 6 8 6 8 10
4 6 8 6 8 10
4 6 8 6 8 10
4 6 4 6 8 10
4 6 4 6 8 10
4 3 4 6 8 10
4 3 4 6 8 10
4 3 4 6 8
2 3 4 6 8
2 3 4 6 8
2 3 4 6
4
2
48
30
22
18
16
14
12
12
10
10
8
8
8
8
6
6
6
6
6
6
3
63
39
30
24
21
18
15
15
12
12
12
9
9
9
9
9
9
6
6
6
4
76
48
36
28
24
20
20
16
16
12
12
12
12
12
8
8
8
8
8
8
6
96
60
42
36
30
24
24
18
18
18
18
12
12
12
12
12
12
12
12
12
6
8
120
72
56
40
40
32
24
24
24
24
16
16
16
16
16
16
16
8
8
8
10
130
80
60
50
40
40
30
30
20
20
20
20
20
20
20
10
10
10
10
10
2
100
64
48
40
34
30
26
24
22
20
20
18
18
16
16
14
14
14
14
12
3
129
81
63
51
45
39
36
30
30
27
24
24
21
21
21
18
18
18
18
15
4
156
100
76
60
52
48
40
36
36
32
28
28
28
24
24
24
20
20
20
20
6
204
126
96
78
66
60
54
48
42
42
36
36
36
30
30
30
30
24
24
24
8
240
152
112
96
80
72
64
56
56
48
48
40
40
40
32
32
32
32
32
32
10
280
180
130
110
90
80
70
70
60
60
50
50
50
40
40
40
40
30
30
30
Instructions: This Table can be used to determine maximum length of a given diameter manifold or to determine required minimum diameter for a given manifold length.
Known values must include:
1) Manifold - lateral configuration (end or central)
2) Lateral discharge rate “Q” in gallons per minute
3) Lateral spacing in feet
Example A: Central manifold configuration, lateral discharge “Q” = 40 gpm, lateral spacing = 6 ft., manifold diameter = 4 inch; Maximum length = 18 ft.
Example B: End manifold configuration, lateral discharge “Q” = 30 gpm, lateral spacing = 6 ft., manifold length = 24 ft.; Minimum diameter = 3 inch
WA DOH Publication #337-009
Page 56 of 61
Pressure Distribution Systems - Recommended Standards and Guidance
Effective Date: July 1, 2009
Appendix B – Volume of Pipe
(gallons per foot)
Nominal Diameter
(in)
0.75
1
1.25
1.5
2
2.5
3
4
5
6
8
10
12
WA DOH Publication #337-009
PR 160
Type of Pipe
PR 200
0.058
0.098
0.126
0.196
0.288
0.428
0.704
1.076
1.526
2.586
4.018
5.652
0.035
0.058
0.092
0.121
0.188
0.276
0.409
0.677
1.034
1.465
2.485
3.861
5.432
Schedule 40
0.028
0.045
0.078
0.106
0.174
0.249
0.384
0.661
1.039
1.501
Page 57 of 61
Pressure Distribution Systems - Recommended Standards and Guidance
Effective Date: July 1, 2009
Appendix C - Advantages / Disadvantages of Dosing Systems
Demand Dosing, Timed Dosing, Reduced Dose Volumes, Orifices in 12:00 o'clock Position,
Orifices in 6:00 o'clock Position, Network Remaining Full or Partially Full between doses
1.
Demand Dosing
a. Least complex of control systems and therefore least costly to install and easiest to
understand.
b. Not sensitive to heavy use days and therefore will not activate the alarm circuit with
weekend guests, large laundry days or parties.
c. Does not protect the drainfield, mound or sand filter from hydraulic surges and
overload.
d. Does not meter the effluent to the receiving component throughout a 24 hour period;
instead delivers the dose whenever a dose volume accumulates in the pump chamber.
Household water use patterns are usually in morning, evening and weekend surges.
2.
Timed Dosing
a. Meters the effluent to the receiving component in discrete, evenly spaced doses.
b. Allows more frequent, smaller doses to be pumped to the receiving component,
thereby promoting unsaturated flow through the soil or filter media.
c. Protects the receiving component from hydraulic overload.
d. Sensitive to heavy use days and therefore may often activate the alarm circuit when
the volume of wastewater exceeds the design flow. Some causes are: weekend
guests, large laundry days, parties, and leaking fixtures.
e. More costly and complicated installation and maintenance.
f. Can be used to help detect groundwater leaking into the septic tank or pump chamber.
3.
Reduced Dose Volumes
a. More frequent, smaller doses with intervening resting and aeration periods, are
pumped to the receiving component, thereby assuring unsaturated flow through the
soil or filter media.
b. May require smaller orifices, smaller transport and lateral pipes, check valves and
orifices in the 12 o'clock position in order to reduce the flow rate and to maintain the
system full of effluent between doses. The smaller orifices will increase the
frequency of maintenance due to clogging. Likewise, maintaining the pipes full of
effluent between doses will promote more rapid biological growth on the inside of the
pipes and thereby promote clogging of the orifices.
WA DOH Publication #337-009
Page 58 of 61
Pressure Distribution Systems - Recommended Standards and Guidance
Effective Date: July 1, 2009
4.
Orifices in the 12 o'clock Position
a. As mentioned above, orifices in this position will maintain the laterals full or partially
full and therefore reduce the amount of effluent needed to pressurize the system. This
feature is important when designing a system with reduced dose volumes.
b. Orifices in the "up" position require the use of orifice shields or chambers, to prevent
blocking of some orifices with gravel pieces. Shields also deflect the squirt over a
wider surface area and spread the effluent over more of the infiltrative surface.
Shields have the greatest importance in systems with medium to coarse sand soils or
with imported media providing the treatment.
c. Maintaining effluent in the lines will promote biological growth, which will
accelerate clogging of the orifices and buildup of sludge and slime in the lines. It
also makes the laterals subject to freezing in areas where this is a concern.
d. May be drained by putting a few orifices in the 6:00 o’clock position, or by draining
laterals and transport line back to the surge tank. However, these practices will
increase the dose volume required.
5.
Orifices in the 6 o'clock Position
a. When some or all of the orifices are in the "down" position, the laterals will drain
between dose cycles retarding the biological growth in them and reducing freeze up
potential. When the system drains, a good rule of thumb for equal distribution is to
design the dose volume to be at least 7 times the volume of the liquid that drains after
a dose.
b. When the orifice at the distal end (farthest from the manifold) is in the down position,
sludge in the lines tends to be driven to the distal end of the lateral and out the last
orifice. As that orifice clogs, the next in line will clog, and so on.
c. Although systems with some or all of the orifices in the down position may be less
prone to clogging, they also will require a larger dose volume to pressurize the
system, due to laterals draining between pump cycles.
d. Orifices in the down position cannot be directed to gravelless chambers, and therefore
will not have as wide a distribution pattern. However there are special orifice shields
available for orifices oriented in this position.
6.
Network Remaining Full, or Partially Full, Between Doses
(laterals can rarely be maintained at a level grade, therefore some orifices will be lower
than others, so some of the effluent will drain out the lowest 12:00 o’clock orifice)
a. Allows smaller, more frequent doses with intervening resting and aeration periods, to
be pumped to the receiving component, thereby promoting unsaturated flow through
the soil or filter media.
b. Maintaining effluent in the lines will promote biological growth, which will
accelerate clogging of the orifices and buildup of sludge in the lines. It also makes
the laterals subject to freezing in areas where this is a concern.
WA DOH Publication #337-009
Page 59 of 61
Pressure Distribution Systems - Recommended Standards and Guidance
Effective Date: July 1, 2009
Appendix D - Advantages / Disadvantages of Siphon Dosed Systems
1.
Some advantages of siphons are:
a. they do not require electricity;
b. there are no moving parts;
c. they can be constructed entirely of corrosion resistant material;
d. they require very little maintenance;
e. they do not require external controls as cycling is automatic;
f. duplex installations can be made to alternate automatically;
g. they can dose a remote drainfield without a large transport line to the siphon
chamber;
h. they allow the use of small pumps with low energy consumption, to dose a system
with high velocity requirements.
2.
Some drawbacks of siphons are:
a. they cannot, by themselves, limit the total volume discharged to the drainfield in a
day and therefore cannot protect the pressure distribution component from hydraulic
overload;
b. they can go into a trickling mode and will remain there until manually recharged with
air; this condition does not achieve equal distribution and may destroy the receiving
component;
c. they are slower to enter the fully pressurized phase which can result in somewhat
unequal distribution on a sloped site; and
d. the available head to pressurize the system is fixed and therefore design and
installation errors cannot be overcome by increasing the pressure head.
WA DOH Publication #337-009
Page 60 of 61
Pressure Distribution Systems - Recommended Standards and Guidance
Effective Date: July 1, 2009
Appendix E - References
Converse, J.C., 1974. Distribution of Domestic Waste Effluent in Soil Absorption Beds,
Transactions of the America Society of Agricultural Engineers, Vol. 17, No2, pp. 299-309.
Converse, J.C., J.L. Anderson, W.A. Ziebell, and ZJ. Bouma, 1975. Pressure Distribution to
Improve Soil Absorption systems, Home Sewage Disposal, Proceedings National Home Sewage
Disposal Symposium, American Society of Agricultural Engineers, St. Joseph, MI pp. 104-115.
Otis, R.J., J.C. Converse, B.L. Carlisle, and J.E. Witty, 1978. Effluent Distribution, Home
Sewage Treatment, Proceedings of the 2nd National Home Sewage Treatment Symposium,
American Society of Agricultural Engineers, St. Joseph, MI pp. 61-85.
WA DOH Publication #337-009
Page 61 of 61
APPENDIX O-VII
PRESSURE DISTRIBUTION NETWORK DESIGN
Septic tank effluent or other pretreated effluent can be distributed in a soil
treatment/dispersal unit either by trickle, dosing or uniform distribution. Trickle flow,
known as gravity flow, occurs each time wastewater enters the system through 4"
perforated pipe. The pipe does not distribute the effluent uniformly but concentrates it in
several areas of the absorption unit. Dosing is defined as pumping or siphoning a large
quantity of effluent into the 4" inch perforated pipe for distribution within the soil
absorption area. It does not give uniform distribution but does spread the effluent over a
larger area than does gravity flow. Uniform distribution, known as pressure distribution,
distributes the effluent somewhat uniformly throughout the absorption area. This is
accomplished by pressurizing relatively small diameter pipes containing small diameter
perforations spaced uniformly throughout the network and matching a pump to the
network.
This material has been extracted and modified from a paper entitled “Design of Pressure
Distribution Networks for Septic Tank- Soil Absorption Systems” by Otis, 1981. It also
includes material from the “Pressure Distribution Component Manual for Private Onsite
Wastewater Treatment Systems” by the State of Wisconsin, Department of Commerce,
1999.
Design Procedure
The design procedure is divided into two sections. The first part consists of sizing the
distribution network which distributes the effluent in the aggregate and consists of the
laterals, perforations, and manifold. The second part consists of sizing the force main,
pump, dose chamber, and suitable controls.
A. Design of the Distribution Network: Steps:
1. Configuration of the network.
The configuration and size of the absorption field must meet all soil and site
criteria. Once any limitations have been established, the distribution network can
be designed.
2. Determine the length of the laterals.
Lateral lengths are defined as the distance length from the manifold to the end of
the lateral. For a center manifold it is approximately one half the length of the
absorption area. For end manifolds it is approximately the length of the absorption
area. The lateral should end about 6" to 12" from the end of the absorption bed.
1
3. Determine the perforation size, spacing, and position.
The size of the perforation or orifices, spacing of the orifices and the number of
orifices must be matched with the flow rate to the network.
Size: The typical perforation diameter has been 1/4", but with the requirement of
Class I effluent, carry-over particles have been greatly reduced allowing smaller
diameter orifices to be used. Orifices as small as 1/8" are commonly used in sand
filter design, however orifice shields are generally used to protect the orifice from
being compromised by the aggregate. Smaller diameter perforations are also at
risk from burrs when drilling. Shop drilling the orifices under tight specifications
reduces the concern. A sharp drill bit will drill a much more uniform orifice than a
dull drill. Replace drills often. Remove all burrs and filing from pipe before
assembling it. As a compromise, one might consider using 5/32” or 3/16”
diameter orifices which will allow for more orifices than if 1/4" orifices were
used.
Spacing: It is important to distribute the effluent as uniformly as possible over the
system to increase effluent/soil contact time and maximize treatment efficiency.
Typical spacing has been 30-36" but some designers have set spacing further
apart to reduce pipe and pump sizes. Typical spacing for beds has been 6
ft²/orifice (J.C.Converse; 2000).
Positioning: In cold climates, it is essential that the laterals drain after each dose
event to prevent freezing. Because of the longer laterals normally encountered in
mounds, the orifices are typically placed downward for draining as it is much
more difficult to slope the lateral toward the manifold/force main because of their
greater length.
4. Determine the lateral pipe diameter.
Based on the selected perforation size and spacing, Fig. A-1a through A-3b
should be used to select the lateral diameter. Lateral diameter is also used to
determine dose volume. (Fig. A-5).
5. Determine the number of perforations per lateral.
Use:
N = (p/x) + 0.5
N = (p/x) + 1
for center feed/center manifold
for end fed/end manifold
Where:
N = number of perforations,
p = lateral length in feet and
x = perforation spacing in feet.
Round number off to the nearest whole number.
2
6. Determine the lateral discharge rate.
Based on the distal pressure selected, Table A-1 gives the perforation discharge
rate. The designer must choose an operational pressure (in units of feet) at a distal
point. This is the starting point of selecting a pump and determining if the system
has equal distribution.
7. Determine the number of laterals and the spacing between laterals.
Since the criteria of 6 ft²/orifice is the guideline, the orifice spacing and laterals
spacing are interrelated. For absorption area widths of 3 ft, one distribution pipe
along the length of trench requires an orifice spacing of 2 ft. For a 6 ft wide
absorption area with the same configuration it would require orifice spacing of 1
ft. or the system could utilize a manifold with several laterals and have better
coverage. Ideally, the best option is to position the perforations to serve a
square such as a 2.5’ by 2.5’ area but that may be difficult to do but a 2’ by 3’ is
much better than a 6’ by 1’ area.
8. Calculate the manifold size and length.
The manifold length is the length pipe between the outer laterals. For smaller
systems assume the manifold size is the same as the force main diameter since the
manifold is an extension of the force main. There are procedures for determining
the manifold size for larger systems (Table A-2) from Otis, 1981.
9. Determine the network discharge rate.
This value is used to size the pump. Take the lateral discharge rate and
multiply it by the number of laterals or take the perforation discharge rate and
multiply it by the number of perforations.
B. Design and Selection of the Force Main, Pump, Dose Chamber and
Controls.
1. Develop a system performance curve.
The system performance curve predicts how the distribution system performs
under various flow rates and heads. The flow rate is a function of the total head
that the pump works against. As the head becomes larger, the flow rate decreases
but the flow rate determines the network pressure and thus the relative uniformity
of discharge throughout the distribution network. The best way to select the pump
is to evaluate the system performance curve and the pump performance curve.
Where the two curves cross, is the point where the system operates relative to
flow rate and head.
3
The total dynamic head that the pump must work against is the:
1. System network head (1.3 x distal pressure)
2. Elevation difference between the pump and the highest point in the
system.
3. Friction loss in the force main.
The system network head is the pressure maintained in the system during
operation to assure relatively uniform flow through the orifices. The 1.3 multiplier
relates to the friction loss in the manifold and laterals which assumes that the
laterals and manifold are sized correctly.
The elevation difference is between the pump and the highest point in the system
in feet (the pump industry uses the bottom of the pump tank).
The friction loss in the force main between the pump tank and the inlet to the
network is determined by using Table A-3. Equivalent length for fittings should
be included. Equivalent lengths are found in Table A-4.
2. Determine the force main diameter.
The force main diameter is determined from Table A-2. The number of laterals
and/or length of manifold should not exceed these maximums.
3. Select the pressurization unit.
Pumps
Using pump performance curves, select the pump that best matches the required
flow rate at the operating head. Plot the pump performance curve on the system
curve. Then determine if the pump will produce the flow rate at the required head.
Do not undersize the pump. It can be oversized but will be more costly.
4. Determine the dose volume required.
The lateral pipe void volume determines the minimum dose volume. The
recommended dose volume is 10 times the lateral volume. It is required that the
system be timed dosed daily based on the design flow. Small doses need to be
applied; however, sufficient volume is needed to distribute the effluent uniformly
across the network. Table A-5 gives the void volume for various size pipes.
4
5. Size the dose tank.
For residential applications, the dose tank must be large enough to provide for:
a. The dose volume.
b. The dead space resulting from placement of the pump on a concrete
block.
c. A few inches of head space for floats
d. 24 hour reserve capacity based on 150 gallons per bedroom.
The pump tank must have sufficient surge capacity to allow for timed dosing. See
Section E of the manual for additional information and requirements for dosing
other applications.
6. Select controls and alarms.
Select quality controls and alarms. Follow electrical code for electrical
connections.
DESIGN EXAMPLE
This example will follow these steps to design a pressure distribution network for a bed
system. All requirements found in Section F; Absorption Field Methods and Guidelines
for Class I Effluent of the manual must be followed.
The bed absorption area is 452 ft² (113 ft long by 4 ft wide). The force main is 125 ft long
and the elevation difference is 9 ft with three 90° elbows. Central manifold distribution
system will be used.
A. Design of the distribution network. Steps:
1. Configuration of the network.
This is a narrow absorption bed on a sloping site. (4’ x 113’ = 452 ft²)
2. Determine the lateral length.
Use a center feed, the lateral length is:
Lateral Length = (B / 2) - 0.5 ft
= (113 / 2) - 0.5 ft
= 56 ft
Where: B = bed absorption length.
5
3. Determine the perforation spacing and size.
Perforation spacing:
It is recommended that each perforation covers a maximum area of 6 ft².
The absorption area is 4 ft wide.
Two laterals on each side of the center.
Spacing = (area/orifice x no. of laterals / (absorption area width)
= (6 ft² x 2) / (4 ft)
= 3 ft.
Best option: Ideally, the best option is to position the perforations to
serve a square but that may be difficult to do. In this example, each
perforation serves a 2' by 3' rectangular area. With an absorption area of 6
ft wide with one lateral down the center, perforation spacing would be 1 ft
apart and the perforation would serve an area of 6 by 1 ft which would be
undesirable.
Perforation size:
Smaller diameter perforations may reduce system discharge flow rate,
reduced pump requirements, at the same time increasing the number of
orifices benefitting equal distribution through out the system. This
example uses 3/16" perforations.
4. Determine the lateral diameter.
Using Fig. A-2a (3/16") to determine the minimum lateral diameter:
The laterals on each side of the center manifold each has the length of 56
ft with 3 ft spacing between orifices, these point to a lateral diameter of
1.5".
5. Determine number of perforations per lateral and number of perforations.
Using 3.0 ft spacing in 56 ft a lateral yields 19 perforations each:
N = (p/x) +0.5 = (56 / 3.0) +0.5 = 19 perforations/lateral
Number of perforations = 4 lateral x 19 perforations/lateral = 76
Check - Maximum of 6 ft2 / perforation =
6
Number of perforations = 412 sqft/6 ft² = 75; (76 > 75, is okay)
6. Determine lateral discharge rate (LDR).
Using network pressure (distal) pressure of 3.5 ft and 3/16" diameter
perforations,
Table A-1 gives a discharge rate of 0.78 gpm, regardless of the number of
laterals.
LDR = 0.78 gpm/perforation x 19 perforations = 14.8 gpm/lateral
7. Determine the number of laterals.
This was determined in Step 3 and 4.
Two laterals on each side of center feed = 4 laterals spaced 2 ft apart.
8. Calculate the manifold size.
The force main diameter is determined from Table A-2 on the manual.
The manifold is generally the same size as force main as it is an extension
of the force main or it could be one size smaller. This example will use a
2” manifold.
9. Determine network discharge rate (NDR)
NDR = 4 laterals x 14.8 gpm/lateral = 59.2 or 60 gpm
Pump has to discharge a minimum of 60 gpm against a total
dynamic head yet to be determined.
10. Total dynamic head.
Sum of the following:
System head = 1.3 x distal head (ft)
= 1.3 x 3.5 ft
= 4.5 ft
Elevation head = 9.0 ft (Pump shut off to network elevation)
Head Loss in Force Main = Table A-3 and A-4 for 60 gallons and
125 ft of force main and 3 elbows.
Equivalent length of pipe for fittings can be found in Table A-3
3- 2" 90° elbows @ 9.0 ft each = 27 ft of pipe equivalent.
7
Head Loss through 100’ of PVC pipe can be found in Table A-2
125’ of 2" force main plus the head loss in the fittings equals
= 7.0 (125 ft + 27 ft)/100 = 10.6 ft
Total Dynamic Head (TDH) = Sum of the three
TDH = System head + Elevation head + Head Loss in Force Main
4.5 + 9 + 10.6 = 24.1 ft (2" force main) = 24 ft of head
11. Pump Summary
Pump must discharge 60 gpm against a head of 24 ft with 2" force main.
These are the calculated flow and head values. The actual flow and head
will be determined by the pump selected. A system performance curve
plotted against the pump performance curve will give a better estimate of
the flow rate and total dynamic head the system will operate under.
12. Select the Pump
Using a performance curve from the pump manufacture, the point where
the flow rate intersects (60 gpm) the total dynamic head (24 ft) should fall
under the pump curve. A pump can be over sized, but undersized pumps
will lead to failure in performance and/or longevity.
4. Determine the dose volume.
Determine the pipe void volume from Table A-5. Use 10 times the lateral
void volume.
Dose Volume = 10 x length of lateral x number of laterals x Void volume
Lateral diameter =
Lateral Length =
No. of laterals =
Void volume =
1.5"
56'
4
0.092 gal/ft
10 x 56 x 4 x 0.092 = 206 gal./dose
8
5. Size the dose tank.
The pump tank size should be based on the dose volume, 24 hour storage
volume, and room for a block beneath the pump and control space. This
example is for a residential application, additional information on dosing
requirements can be found in Section E of the manual.
6. Select controls and alarm.
Time Dosing: The advantage of time dosing provides more frequent doses
and levels out peak flows to the bed.
CONSTRUCTION AND MAINTENANCE
Good common sense should prevail when constructing and maintaining these systems.
Water tight construction practices must be employed for all tanks. Surface runoff must be
diverted away from the system. Any settling around the tanks must be filled with the soil
brought to grade or slightly above to divert surface waters.
Perforation Discharge Rates (GPM)
Table A-1
Distal
Pressure
(ft)
1.0
1.5
2.0
2.5
3.0
3.5
4.0
4.5
5.0
Perforation Diameter (in)
1/8
5/32
3/16
1/4
5/16
3/8
---------------------------------------GPM--------------------------------------------0.18
0.29
0.41
0.74
1.15
1.66
0.23
0.35
0.50
0.90
1.41
2.03
0.26
0.41
0.58
1.04
1.63
2.34
0.29
0.45
0.66
1.17
1.82
2.62
0.32
0.50
0.72
1.28
1.99
2.87
0.34
0.54
0.78
1.38
2.15
3.10
0.37
0.57
0.83
1.47
2.30
3.32
0.39
0.61
0.88
1.56
2.44
3.52
0.41
0.64
0.93
1.65
2.57
3.71
Values were calculated as: gpm = (11.79 x d² x √h)
Where: d = orifice dia. in inches and h = head feet.
9
Table A-2 Maximum Manifold Length (ft) For Various Manifold Diameters Given the
Lateral Discharge Rate and Lateral Spacing (from: Otis, 1981)
Lateral
Discharge
Rate
End
Manifold
Center
Manifold
10 / 5
20 / 10
30 / 15
40 / 20
50 / 25
60 / 30
70 / 35
80 / 40
90 / 45
100 / 50
110 / 55
120 / 60
130 / 65
140 / 70
150 / 75
160 / 80
170 / 85
180 / 90
190 / 95
200 / 100
Manifold
Diameter = 1¼”
Manifold
Diameter = 1½”
Manifold
Diameter = 2”
Manifold
Diameter = 3”
Manifold
Diameter = 4”
Manifold
Diameter = 5”
Lateral Spacing
(ft)
2 4 6 8 10
Lateral Spacing
(ft)
2 4 6 8 10
Lateral Spacing
(ft)
2 4 6 8 10
Lateral Spacing
(ft)
2 4 6 8 10
Lateral Spacing
(ft)
2 4 6 8 10
Lateral Spacing
(ft)
2 4 6 8 10
4 8 6 8 10
4 4 6
2
10 8 12 16 20
4 4 6 8 10
2 4 6
12 16 24
6 8 12
4 8 6
4 4 6
2 4 6
2 4
2
2
2
24
16
8
8
8
30
20
10
10
26
16
12
10
8
8
6
6
4
4
4
4
4
2
2
2
2
2
2
2
40
24
16
12
12
12
8
8
8
4
4
4
4
4
4
4
4
4
4
4
48
30
24
18
12
18
12
6
6
6
6
6
6
6
6
6
6
56
32
24
16
16
16
8
8
8
8
8
8
8
8
70
40
30
20
20
20
10
10
10
10
10
10
10
42
26
20
16
14
12
10
10
8
8
8
6
6
6
6
6
4
4
4
4
64 84
40 54
26 36
24 30
20 24
16 24
16 18
12 18
12 18
12 12
12 12
8 12
8 12
8 12
8 12
8 6
8 6
8 6
8 6
4 6
96
64
48
32
32
24
24
16
16
16
16
16
16
8
8
8
8
8
8
8
110
70
60
40
40
30
30
20
20
20
20
10
10
10
10
10
10
10
10
10
84
54
42
34
30
26
24
22
20
18
16
16
14
14
14
12
12
12
12
10
134
84
64
52
44
40
36
32
28
28
24
24
24
20
20
20
20
16
16
16
174
106
84
66
60
48
48
42
42
36
36
30
30
24
24
24
24
24
18
18
200 240
128 150
96 110
80 90
72 80
64 70
56 60
46 60
46 50
40 50
40 40
32 40
32 40
32 40
32 30
32 30
24 30
24 30
24 30
24 30
10
Table A-3 Friction Loss in Schedule 40 Plastic Pipe
(ft/100 ft), Based on Hazan-Williams; C = 150
Pipe Diameter (Inches)
Flow
(GPM)
1
2
3
4
5
6
7
8
9
10
11
12
13
14
15
16
17
18
19
20
25
30
35
40
45
50
60
70
80
90
100
150
200
250
300
350
400
450
500
600
700
800
900
1000
1
0.07
0.28
0.60
1.01
1.52
2.14
2.89
3.63
4.57
5.50
1 1/4
0.07
0.16
0.25
0.39
0.55
0.76
0.97
1.21
1.46
1.77
2.09
2.42
2.74
3.06
3.49
3.93
4.37
4.81
5.23
1 1/2
0.07
0.12
0.18
0.25
0.36
0.46
0.58
0.70
0.84
1.01
1.17
1.33
1.45
1.65
1.86
2.07
2.28
2.46
3.75
5.22
2
0.07
0.10
0.14
0.17
0.21
0.25
0.30
0.35
0.39
0.44
0.50
0.56
0.62
0.68
0.74
1.10
1.54
2.05
2.62
3.27
3.98
3
4
6
8
10
Velocities in this area are below 2 ft/sec.
0.07
0.08
0.09
0.10
0.11
0.12
0.16
0.23
0.30
0.39
0.48
0.58
0.81
1.06
1.38
1.73
2.09
0.07
0.09
0.12
0.16
0.21
0.28
0.37
0.46
0.55
1.17
0.07
0.16
0.28
0.41
0.58
0.78
0.99
1.22
0.07
0.11
0.16
0.20
0.26
0.32
0.38
0.54
0.72
0.07
0.09
0.11
0.14
0.18
0.24
0.32
0.38
0.46
11
Table A-4 Friction losses through plastic fittings in terms of
equivalent lengths of pipe
(Sump and Sewage Pump Manufacturers, 1998)
________________________________________________________________________
---------------Nominal size fitting and pipe -----------------Type of Fitting
1¼
1½
2
2½
3
4
-----------------------------------------------------------------------------------------------------------90° Elbow
7.0
8.0
9.0
10.0
12.0
14.0
45° Elbow
3.0
3.0
4.0
4.0
6.0
8.0
STD. Tee
7.0
9.0
11.0
14.0
17.0
22.0
(Diversion)
Check Valve
11.0
13.0
17.0
21.0
26.0
33.0
Coupling/
Quick Disconnect
1.0
1.0
2.0
3.0
4.0
5.0
Gate Valve
0.9
1.1
1.4
1.7
2.0
2.3
Table A-5
Void volume for various diameter pipes.
__________________________________________________
Nominal Pipe Size
Void Volume
(In.)
(gal./ft)
--------------------------------------------------------------------------3/4
0.023
1
0.041
1¼
0.064
1½
0.092
2
0.163
3
0.367
4
0.650
6
1.469
__________________________________________________
12
13
14
15
16
17
18
19
20
References:
Converse, J.C. 1974 Distribution of domestic waste effluent in soil absorption beds.
Trans. Of the ASAE. 17:299-304.
Converse, J. C. 1999. Septic tanks and pump chambers with emphasis on filters, risers,
pumps surge capacity and time dosing. Small Scale Waste Management Project. 345
King Hall, University of Wisconsin-Madison, 1525 Linden Drive, Madison, WI 53706.
Converse, J.C. and E.J. Tyler. 2000. Wisconsin Mound Soil Absorption Systems, Siting,
Design and Construction. Small Scale Waste Management Project. 345 King Hall,
University of Wisconsin-Madison, 1525 Linden Drive, Madison, WI 53706. Publication
No. 15.22.
Falkowski, G.M. and J.C. Converse. 1998. Siphon performance and pressure distribution
for on-site systems. In. On-site Wastewater Treatment. Proceedings of the Fifth National
Symposium on Individual and Small Community Sewage Systems. ASAE. Joseph, MI
49085.
Machmeier, R.E. and J.L Anderson. 1988. Flow distribution by gravity flow in perforated
pipe. In. On-site Wastewater Treatment. Proceedings of the Fifth National Symposium on
Individual and Small Community Sewage Systems. ASE. Joseph, MI 49085.
Otis, R.J. 1981. Design of pressure distribution networks for septic tank- soil absorption
systems. Small Scale Waste Management Project. 345 King Hall, University of
Wisconsin- Madison, 1525 Linden Drive, Madison, WI 53706. Publication No. 9.6.
Sump and Sewage Pump Manufacturers Association. 1998. Recommended guidelines for
sizing effluent pumps. P.O. Box 647 Northbrook, Il 600065-0647.
Wisconsin Administrative Code. 1999. Pressure distribution component manual for
private onsite wastewater treatment systems. Department of Commerce, Safety and
Building Division, Madison, WI.
21