1
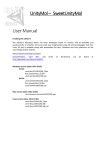
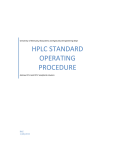
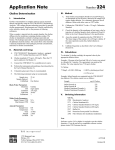
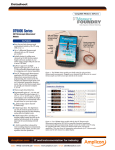
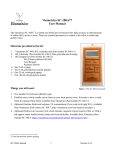
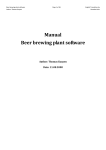
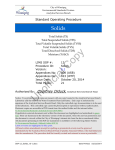
Application Note
Rapid Measurement of Xylose &
Glucose Monitoring Corn Stover
Fermentation in Bioethanol Production
I.
Introduction
Simultaneous glucose and xylose concentrations can be
measured during fermentation of complex matrices such as
pretreated corn stover during the production of bioethanol. A
measurement can be made in about one minute with minimal
preparation using the YSI 2700 SELECT. YSI's enzyme
electrode technology provides for specific glucose measurements
in the range of 0.05 to 9.00 g/L and for xylose measurements in
the range of 0.5 to 30.0 g/L (undiluted). Measurements are
virtually unaffected by color, turbidity, density, pH, and most
chemical substances.
When configured with YSI glucose oxidase and YSI pyranose
oxidase membranes, the YSI 2700 analyzer measures glucose
and xylose with aspiration of just 13 microliters of sample. Most
samples require simple filtration and dilution prior to
measurement. Results are displayed using PC-based software 1 .
The sample is automatically flushed from the electrode chamber
within 30 seconds after results are displayed and the YSI 2700 is
ready to measure the next sample. Turn around time per sample
is under two minutes.
In the study described glucose and xylose were periodically
measured in filtered corn stover fermentation samples over a 48
hour period during lab-scale bioethanol production 2 . Some
samples required dilution. Results were compared to HPLC runs
of the same samples (see results below). The advantage of a
simple, fast, and accurate simultaneous glucose and xylose
measurement is to provide near real time data for these two key
parameters. Timely information related to the progress of sugar
fermentation may help researchers improve ethanol yield.
II.
Materials and Setup
Sample Collection
Number 328
YSI 2700 Instrument Setup
See the YSI 2700 user’s manual for general setup and safety
information.
Chemistry electrode and reagent configurations depend on dual
channel operation. The YSI 2700 in its current configuration
does not have ‘xylose’ programmed into the setup menu. To run
these two chemistries simultaneously follow the setup
information outlined below.
Under Menu choose Setup, and then choose MeasParam to
access the electrode assignment configuration. Set/confirm the
following parameters.
Sample Size
Cal Method
13 microliters
Two Station
Black Probe Parameters
Chemistry
Unit
Calibrator
End Point
CalStation#
Peroxide (Xylose) 3
g/L
20.0
30 seconds
2
White Probe Parameters
Chemistry
Unit
Calibrator
End Point
CalStation#
Dextrose (glucose)
g/L
2.50
30 sec
1
Autocal Parameters 4
Sample Error
Temperature
Time
Sample
Cal Shift
Calibration Station(s)
Sample Station
ON
1°C
0 Min 5
0 Sam
2%
#1 (glucose); #2 (xylose)
#3 (or #4 if turntable)
III. Method
Collection container (appropriate volume for fermentor sample)
Whatman #2 filter paper, funnel and collection vessel
Nylon syringe filter (0.22 micron); 3 ml luer lock syringe
Collection tubes (1.5 or 2.0 ml microcentrifuge tube)
YSI 2700D, configured for glucose & xylose measurement
PC with spreadsheet software (e.g., Microsoft® Office Excel)
Alternatively, PC with LabView™ user-interface software
A.
Calibrate the YSI 2700 by entering Run Mode or, if in
Run Mode, by pressing the Calibrate key.
B.
Each day, prior to runs, perform the FCN membrane test
using YSI 2363 solution.
C.
Each day, prior to runs, test the linearity of the system
with YSI 1531 (9.00 g/L glucose) linearity standard;
followed by running a second linearity test with 30.0 g/L
xylose linearity standard. Record only the displayed
value for the chemistry you are testing.
3
Xylose is not currently a choice in MeasParam setup. Select ‘Peroxide’
for this application.
1
YSI PC-based software automatically compensates for glucose/xylose
measurement interactions. Alternatively, YSI- displayed results may be
manually entered into a customized spreadsheet program available as a
free download from www.ysilifesciences.com. See user guide for details.
2
YSI greatly appreciates the contributions of Nancy Dowe and her team
at the National Renewable Energy Laboratory, US DOE, Golden, CO.
4
Enter AutoCal menu from RunMode under Setup Menu.
5
Automatic calibration is disabled. The YSI PC-based algorithm directs
calibration for simultaneous glucose & xylose measurement. If
performed manually, follow instructions in the Calibration Instruction
Sheet.
1725 Brannum Lane
PO Box 279
Yellow Springs, Ohio 45387 USA
937.767.7241 • 800.659.8895 • www.ysilifesciences.com • [email protected]
Page 1 of 4
A27328A
10/2008
B80
D.
If using the manual spreadsheet entry protocol, next run
each calibration solution as a sample. Record the nA PL
currents for each electrode and for each solution and
enter the 4 values IXx, IXg, IGx and IGg. These values
are recorded in a spreadsheet (see Page 4).
E.
When idle for more than 30 minutes during sampling or
after running 5 samples, initiate a calibration to ensure
greatest accuracy.
F.
Collect sample from the fermentation vessel, ensuring a
representative sample.
G.
Filter the sample using Whatman #2 paper to eliminate
the bulk of the particulate matter. Collect the filtrate.
H.
If necessary, dilute the sample with reagent water.
Record dilution factor. (See Page 4 regarding sample
dilution.)
I.
If also running samples for HPLC comparison, check pH
using a test strip. Add 1% NH4OH solution to adjust pH
to ~7. Record volume of base added 6 .
J.
Mix samples well and remove at least 2 ml using a clean,
disposable 3 mL syringe for each.
K.
Secure a 0.22 µ filter cartridge to the luer fitting and
dispense the sample into a microcentrifuge tube. This
step eliminates small particulates and virtually all cells.
L.
M.
N.
V.
Results
Seven samples over a 48-hour fermentation of acid-hydrolyzed
corn stover where collected and filtered. The samples were
collected at 0, 4, 8, 12, 24, 32 and 48 hours to monitor xylose
and glucose consumption (main sugars from the acid
hydrolyzate). Split samples from each collection time were
measured by HPLC 8 configured for a sugar profile, and by the
YSI 2700 configured for simultaneous xylose and glucose
measurement. The results of a representative run are displayed in
Table 1.
Samples T-0 and T-4 were diluted ten-fole and two-fold,
respectively, to bring the signals within reportable ranges for
xylose. The results from diluted samples were back calculated.
From HPLC data, samples were known to contain several sugars
that are potential interferences for the pyranose oxidase
membrane. These are Arabinose, mannose, galactose and
cellobiose. None were found to have a significant effect on the
xylose reading. In the corn stover matrix studied glucose and
xylose are by far the dominant sugars from saccharification and
YSI values tracked HPLC results very closely.
Sample
Glucose (g/L)
Xylose (g/L)
(hours)
HPLC
YSI
bias
HPLC
YSI
bias
T-0
21.8
20.1
-1.7
53.8
57.4
+3.6
T-4
3.3
2.1
-1.2
38.4
34.5
-3.9
T-8
1.1
0.5
-0.6
22.0
23.3
+1.3
T-12
0
0.3
+0.3
13.5
13.1
-0.4
T-24
0
0.2
+0.2
7.0
7.0
0.0
T-32
0
0.1
+0.1
6.6
6.5
-0.1
T-48
0
0.1
+0.1
6.1
5.9
-0.2
7
Present the sample to the YSI 2700 for measurement
using Station #4 (turntable) or #3 (manual presentation).
Record the glucose and xylose nA PL probe currents
displayed or printed by the 2700. Enter values into the
spread-sheet software provided, Rx for xylose electrode
and Rg for glucose electrode PL currents.
Record the glucose and xylose corrected concentrations
from the spreadsheet software; adjust with calculations
for dilutions, as necessary.
Table 1: Data from Run 072707 at NREL
IV. Calculations
Glucose & Xylose - Corn Stover Fermentation
Samples that were diluted must be back-calculated by the
dilution factor. Cross signal interference between glucose and
xylose probes are automatically corrected using YSI-provided
software.
70
HPLC xylose
60
YSI xylose
Sugar, g/L
50
To provide the most reliable results the YSI electrode signals
were recorded for both calibration data and for sample
concentrations. The net nA (nanoamperes) signal values were
obtained from the detailed printouts of the YSI 2700 and entered
into the YSI software as described in the Calibration Instruction
Sheet. Each calibration was run three times to ensure stability
before samples were run. Each sample was run in triplicate to
verify precision in the measurement. Averages of samples were
used to derive the values shown in the tables and graphs.
HPLC glucose
40
YSI glucose
30
20
10
0
0
10
20
30
Time, hrs
40
50
60
Figure 1: YSI vs. HPLC – Depletion over 48 Hours
6
The pH adjustment step is required only for HPLC measurements in
this study. The YSI measurement is quite tolerant of samples from pH 4
to 9.
7
An aliquot of this same sample was run by HPLC to obtain a reference
value for comparison to YSI glucose and xylose values.
Glucose was depleted within 10 hours while xylose depletion did
not reach completion. Concentrations of both sugars were
relatively stable within 24 hours of the start of fermentation.
8
Hewlett Packard 1100 with RI detector, Shodex SP0810 column;
HPLC grade water mobile phase; 10-50 µL sample; 0.6 mL/min flow;
85°C.
Page 2 of 4
Application Note
Number 328
Correlation Plots of YSI vs. HPLC for Glucose and Xylose
Correlation data are plotted using values from Table 1 and the
results obtained in the repeat run two weeks later at YSI.
Therefore each concentration point contains two sets of data.
In the preliminary investigation presented above glucose and
xylose concentrations proved to correlate well with HPLC results
when compared in aliquots of the same samples. Concentrations
were compared periodically over the 48-hour fermentation as
shown in Figure 1. Although relatively few samples were studied
good correlation was observed as shown in Figures 2 & 3.
Glucose from Corn Stover Fermentation - YSI vs. HPLC
25
20
y = 0.9033x - 0.0866
2
R = 0.9957
g/L YSI
15
10
5
0
0
5
10
15
20
25
-5
g/L HPLC
YSI Part Numbers:
2700D Biochemistry Analyzer
2365 Glucose Oxidase Membrane Kit
2761 Xylose Membrane Kit
2357 Buffer Kit
2776 Glucose/Lactate Calibrator (2.50 g/L glucose)
1531 Glucose Linearity Test Standard (9.00 g/L)
2767 Xylose Calibrator (20.0 g/L)
2768 Xylose Linearity Test Standard (30.0 g/L)
2363 Potassium Ferrocyanide Test Solution
2392 NaCl Solution (for membrane installation)
Xylose from Corn Stover Fermentation - YSI vs. HPLC
70
y = 0.9937x - 0.2523
2
R = 0.9852
g/L YSI
50
In conclusion the YSI 2700 can be used to monitor glucose and
xylose to gain valuable information relevant to maximizing
ethanol production efficiency. The YSI technology allows users
to collect more data during critical time windows to help better
understand process conditions, and in some cases could allow
users to adjust process conditions during the fermentation. The
technology is applicable to bench-scale, pilot-scale and
production scale uses.
VII. Ordering Information
Figure 2: YSI vs. HPLC – Glucose during 48-hour Fermentation
60
The YSI 2700 configured for xylose and glucose provided results
with relative ease of use, speed and accuracy compared with
HPLC. Since the YSI is also known to tolerate samples of a
broad pH range and show little or no effect to color and turbidity,
it provides an excellent complementary method to HPLC when
monitoring fermentations using lignocellulosic biomass.
40
30
20
10
VIII. Related YSI Application Notes
0
0.0
10.0
20.0
30.0
g/L HPLC
40.0
50.0
60.0
Figure 3: YSI vs. HPLC – Xylose during 48-hour Fermentation
Rapid Measurement of Residual Ethanol in Corn
Stillage (Beer) during Distillation (Note # 326)
Rapid Measurement of Glucose during Fermentation in
Bioethanol Production (Note #327)
VI. Discussion
Lignocellulosic biomass has been widely studied as a feedstock
for fermentation in fuel ethanol production. For example, acidtreated corn stover produces a variety of fermentable sugars that
include glucose, xylose, mannose, arabinose, cellobiose, and
galactose. Carbohydrate profiles from HPLC analysis showed
that glucose and xylose in initial feedstock represent more than
half of all carbohydrates in the acid-hydrolyzate; and for that
reason can be important markers to evaluate the progress and
efficiency of the fermentation process.
HPLC is currently the most common method used to measure
glucose and xylose, along with other key metabolites during the
production of ethanol. HPLC is quite accurate and precise but is
based on separation technology and optical-based measurements
that require significant pretreatment of the sample. In addition,
time to results after pretreatment may be 30 minutes or more.
1725 Brannum Lane
PO Box 279
Yellow Springs, Ohio 45387 USA
937.767.7241 • 800.659.8895 • www.ysilifesciences.com • [email protected]
Page 3 of 4
A27328A
10/2008
B80
IX. Dilution of Samples
X.
As with most analytical methods there is a concentration range
that provides optimal accuracy and precision. The YSI xylose
and glucose methods are specified independently for
performance; however these two analytes frequently occur
together. Since there is cross-signal interference between the
glucose and xylose electrodes compensation equations are
applied in mixed solutions of glucose and xylose. In some cases
the combined signals exceed the linear range of one or both
electrodes. In this situation dilution of sample is recommended to
improve accuracy of results.
We offer several options to measure xylose and glucose with the
YSI 2700. Selected results from the detail printout of the 2700
provide the information you need to calculate glucose and xylose
concentrations; and provide dilution equations if necessary. The
Microsoft Excel™ file can be downloaded at no cost from
www.YSILifeSciences.com.
YSI has developed a software tool that helps you to assess the
need for dilution in your sample. If you provide an estimate of
the expected glucose and xylose concentrations in your sample,
the software automatically calculates an appropriate dilution
factor. This tool improves the reliability of the result while
saving you time and effort to perform trial dilutions. Please see
the steps below and refer to the user’s manual for more detail.
The dilution equations may be downloaded from the YSI Life
Sciences’ website.
Do the following to determine if sample dilution will improve
your results.
1.
Enter the calibration PL currents (nA) for each electrode
and for each analyte. The information appears on the YSI
2700 printout. These four values must be entered into the
downloaded spreadsheet. First enter IXg and IGg, glucose
at the xylose electrode and glucose at the glucose electrode,
respectively. Then enter IXx and IGx, xylose at the xylose
electrode and glucose at the xylose electrode, respectively.
2.
Enter the best estimates of the xylose and glucose in
gram/liter concentration units for your sample. The optimal
dilution factor will be displayed. You may round that value
to create a whole number to simplify the dilution protocol.
Manual Entry from YSI 2700 Printouts
When you determine if dilution of sample is necessary you may
continue to use the data from the 2700 print report to determine
the glucose and xylose concentrations.
Enter the Rg and Rx values in the fourth box down in the
dilution template shown in Figure 4. The final results for xylose
and glucose, including correction for dilution, are shown in the
lowest boxes of the template. The results appear in g/L
concentration units.
XI. Remote Control with LabView™ Software
Alternatively, YSI offers PC-based software. Using a custom
interface cable available from YSI Life Sciences the YSI 2700
can be operated remotely from a PC to command calibrations
and samples. Results of sample runs are displayed on the PC and
stored in files that the user manages. See the main user-interface
below.
Figure 5: LabView™ User Interface Screen
The dilution factor may be entered on the user interface screen.
As samples are run by the 2700 the program automatically
displays the results, corrected for dilution as required.
Refer to the YSI 2700 User Guide for more detailed information.
Figure 4: Dilution Calculator Template
When you determine if dilution of sample is necessary you may
continue to use the data from the 2700 print report to determine
the glucose and xylose concentrations. In the template the Rg
and Rx values are entered in the fourth box down. The results,
adjusted for dilution, appear in the fifth and lowest box shown in
Figure 4.
Page 4 of 4