1
Troubleshooting Common
HPLC Problems
http://www.hplc1.com/shodex/english/dd.htm
HPLC
Performance Monitoring
Use Your Test Method
(Known Performance)
Troubleshooting
* Monitor at least One Peak in one injection
- Plate Count (Peak width relative to RT),
- Peak Asymmetry,
- Retention Time and/or Retention parameter
- Relative Retention Time for Critical Pair of Analytes.
- Peak Response
* Inject Multiple Runs
- Precision (at least 5 injections)
- Accuracy (Use Control Samples)
1
2
3
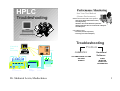
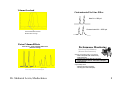
Troubleshooting
Detector
1. Fucose
2. Galactosamine
3. Glucosamine
4. Galactose
5. Glucose
6. Mannose
300
mV
4
6
Control &
Data
Processing
Problem
5
0.00
5.00
Minutes
20.00
Waste
CHEMISTRY
COLUMN/GUARD COLUMN
SOLVENT
SAMPLE
flows 50-5000µL/min)
PUMP
INJECTOR
DETECTOR
INTEGRATION
Fraction
Collector
a b
cd
Pump
Hardware/
Software
Auto
Sampler
HPLC Column
in Oven
Dr. Shulamit Levin, Medtechnica
1
Performance Monitoring
Use Your Test Method
(Known Performance)
Plate Count - Efficiency of the
Separation
* Monitor at least One Peak in one injection
- Plate Count (Peak width relative to RT),
- Peak Asymmetry,
- Retention Time and/or Retention parameter
- Relative Retention Time for Critical Pair of Analytes.
- Peak Response
* A "Plate Count" Actually Is a
Determination Of Both
The Column AND Instruments'
Performance
* Inject Multiple Runs
- Precision (at least 5 injections)
- Accuracy (Use Control Samples)
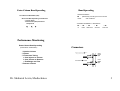
Performance Monitoring
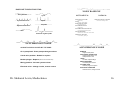
Column Efficiency:
N = the number of Theoretical Plates
a = is a constant depending on the Method used
tr = retention time of peak
W = the peak width (time units) at a given peak height
Performance Monitoring
Band Spreading
tR
N=a
(
tr
W
2
)
h
t0
w
METHOD
Peak Width at Half Height
Peak Width at 4.4% Peak Height (5 Sigma)
Tangent
a
5.54
25.0
16.0
Dr. Shulamit Levin, Medtechnica
* Band Spreading Impacts Chromatographic
Performance -- The Greater The Band Spreading,
The Poorer The Performance (ie; Resolution)
* Band Spreading Contains Both An Instrument
AND A Column Contribution
2
Extra-Column Band Spreading
Band Spreading
* Column Contribution
The Observed Bandwidth (TOT)
* Sum of the Bandspreading Contributions
- Column (COL)
- Extra-Column (EC) Instrument
components
σ2
TOT
=
σ2
COL
+
σ2
EC
σ2
=
COLUMN
optimized by choosing the correct column
and conditions
* Instuments Contribution = Extra-Column
σ2 =
EC
σ2
TUBING
+ σ2
CONNECTIONS
+ σ2
+ σ2
INJECTORS
DETECTORS
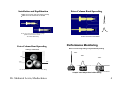
Performance Monitoring
Extra-Column Band Spreading
(Instruments' Contribution)
1. Injection Volume
2. Injector
3. Connection Tubing
a. from Injector to Column
b. from Column to Detector
c. Endfittings and Frits
4. Detector Volume
Dr. Shulamit Levin, Medtechnica
Connectors
Waters SpherisorbR and
many other brands
0.090"
Parker
Style
Other Waters R Columns
0.130"
Waters
Style
3
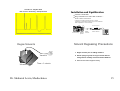
Installation and Equilibration
Extra-Column Band Spreading
Make sure column inlet connected correctly
Make sure nut and ferrule are seated
Good Seal
NOTE: column inlet connector not seated properly
{PEEK Connectors Easier to Use -THF makes PEEK brittle}
Column Connection Contribution
Extra-Column Band Spreading
Performance Monitoring
Effect of Connecting Tubing on System Bandspreading
Tubing Contribution
.009"
.020"
.009"
.040"
.040"
.020"
note the differences of the inner diameter of this tubing
Diluted/Distorted Band
sample band dispersion inside tubing
Dr. Shulamit Levin, Medtechnica
4
Measuring The Instruments
Contribution
* Perform An Instrument Band Spreading Test
Performance Monitoring
To perform a measurement:
- disconnect column from system
- connect injector directly to detector
Parameter
Flow Rate
Chart Speed
Setting
1.0 mL/min
20 cm/min
Detector Sensitivity
0.5 - 1.0 AUFS
Time Constant
0.2 seconds or less
dilute test mixture 1 to 10 in mobile phase
inject 2 to 5 µl of this solution
Performance Monitoring
Using 5 sigma efficiency method, measure the peak width
at 4.4% of peak height
Convert to microliters using the following equation:
Performance Monitoring
Impact of System Band Spread on a Plate Count:
( )( ) ( ) (
2cm
PW
1min
20 cm
1 mL
min.
µL
1000µ
mL
) = 100 (µL)
where:
1min/20cm = chart speed
1 mL/min = flow rate
1000 µL/mL= volume correction factor
µL +/- 30µ
µL
Typical LC System should be 100µ
µL
Microbore System should be no greater than 20µ
Dr. Shulamit Levin, Medtechnica
- System with 70µl Band Spread >> 10,000 plates
- System with 130µ
µl Band Spread >> ~8,000 plates
On the Same Column!
Assumption: <40% loss in resolution at k' = 5 and N= 10,000 and <20% loss
in resolution at the preferred value
5
Incorrect Sample Solvent
Performance Monitoring
Use Your Test Method
(Known Performance)
0.006
Sample in MeOH
0.005
0.004
Minocycline
AU 0.003
* Monitor at least One Peak in one injection
- Plate Count (Peak width relative to RT),
- Peak Asymmetry,
- Retention Time and/or Retention parameter
- Relative Retention Time for Critical Pair of Analytes.
- Peak Response
Demeclocycline
Tetracycline
0.002
0.001
0.000
20.0
10.0
30.0
Minutes
Sample in HPLC Mobile Phase
0.006
(0.1% TFA, 4%ACN and 5%MeOH in Water)
0.005
Minocycline
0.004
Tetracycline
AU 0.003
Demeclocycline
0.002
* Inject Multiple Runs
- Precision (at least 5 injections)
- Accuracy (Use Control Samples)
0.001
0.000
10.0
20.0
30.0
Minutes
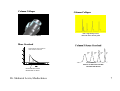
Column Use
Silicas hydrolyze at high pH
Instability of bonded phase at low pH
Elevated temperatures decrease
column lifetime
C18 approximately 1000 times more
stable than CN
ppm solubility of Silica in water
Silica Solubility Curve
240220200180160140120100806040200-
Silica
Polymer
pH 2 - 8
pH 2 -12
At pH <2 the functional
group is stripped
1
2
3
4
5
6
7
8
9
10
pH
Dr. Shulamit Levin, Medtechnica
6
Column Collapse
Column Collapse
voids - high back pressure,
distorted and/or double peaks
voided column
Mass Overload
Column/Volume Overload
encountered when mass injected onto
column exceeds a certain limit.
0.60
500
µL
0.40
300
µL
100
µL
10
µL
0.20
0.00
5.00
5.00
10.00
15.00
Minutes
EFFECT OF INJECTION VOLUME
ON PEAK DISTORTION
Lift-off Point Moves Earlier
Retention times are shorter
Dr. Shulamit Levin, Medtechnica
7
Volume Overload
Contaminated In-Line Filter
New frit = 800 psi
Contaminated frit = 2500 psi
Lift-off Point Remains Constant
Retention times are longer
Extra Column Effects
Isocratic LC - Time Constant Differences
(Detector setting)
Performance Monitoring
Use Your Test Method
(Known Performance)
* Monitor at least One Peak in one injection
- Plate Count (Peak width relative to RT),
- Peak Asymmetry,
- Retention Time and/or Retention parameter
- Relative Retention Time for Critical Pair of Analytes.
- Peak Response
left is 0.1 secs
right is 10 secs
note the noisy baseline on left chromatogram
Dr. Shulamit Levin, Medtechnica
* Inject Multiple Runs
- Precision (at least 5 injections)
- Accuracy (Use Control Samples)
8
Solvent Composition
Retention Time Problems
Reproducibility
Clearly
Clearly specify
specify HOW the
the Mobile Phase
Phase is to be prepared
Drifting Retention
Solvent Composition
Temperature
pH-Control
Ion Pairing
Equilibration
Stationary Phase Stability
Column Contamination
Hydrophobic Collapse
60/40
pH Reminder: Measure pH Before the organic is added
Temperature Control
23.5°C
Retention Time Reproducibility
Non-Column Influences:
pH
26.3°C
Neutrals: No Influence
Acids: Reduced Retention with Increasing pH
Bases: Increased Retention with Increasing pH
10% Change in Retention per 0.1 pH Units
Dr. Shulamit Levin, Medtechnica
9
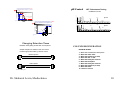
Reversed-Phase Retention Behavior of Acidic
Compounds Relative to Changes ± 1 pH Unit
from pKa
pH Control
AZT: Robustness Testing
35
Un-ionized Acid
Capacity Factor (k)
30
6% Methanol, 6% THF
- 1 pH unit = 91% un-ionized
25
Small Change
in pH = Large
change in k
(potential
reproducibility
problems)
20
15
10
pKa
Imp. 1
AU
0.010
+ 1 pH unit = 91% ionized
Imp. 3
0.008
Ionized Acid
5
0
Phoebe, Tran
1
2
3
4
5
±1
6
7
8
9
10
11
0.004
12
pH
Imp. 4
0.002
19
© Waters Corporation 2000
(101300)
pH 2.5
Imp. 2
0.006
0
Reversed-Phase Retention Behavior of Basic
Compounds Relative to Changes in pH
1.7
25
Un-ionized Base
5.0
6.7
8.4
10.
11.
13.
15.
16.
18.
20.
21.
Time [min]
0.010
> ± 2 pH units provides stable
retention (better reproducibility
at flat portions of curve)
30
3.4
Imp. 1
AU
35
Capacity Factor (k)
0.000
-0.002
Imp. 3
0.008
pH 2.7
Imp. 2
0.006
0.004
20
Imp. 4
0.002
0.000
15
pKa
-0.002
10
1.7
3.4
5.0
6.7
8.4
10.
11.
13.
15.
16.
18.
20.
Time [min]
Ionized Base
5
0
0
1
Phoebe, Tran
2
3
4
5
6
7
±1
±2
8
9
10
11
12
pH
© Waters Corporation 2000
(101300)
23
Changing Retention Times
Retention times getting shorter after each injection?
Sample analytes can adhere to and cover active
functional group sites making a shorter column
Before injection
15 cm
After injection
Covered functional groups
12 cm
Dr. Shulamit Levin, Medtechnica
COLUMN REGENERATION
REVERSE PHASE
1. Wash with unbuffered mobile phase
2. Wash with 100% water
3. Wash with methanol (or ACN)
4. Wash with THF or IPA
5. Wash with methylene chloride
6. Wash with N-Heptane
7. Wash with methylene chloride
8. Wash with methanol (or ACN)
9. Wash with water
10. Return to solvent
10
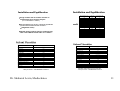
Installation and Equilibration
Installation and Equilibration
Inte rnal Diameter (mm)
Length (mm)
Column Volume (mL)
2.0
2.0
3.9
3.9
3.9
3.9
3.9
4.6
4.6
5
8
7.8
19
25
30
40
47
50
150
300
50
75
100
150
300
150
250
100
100
300
150
100
300
100
300
300
.47
.94
.6
.9
1.2
1.8
3.6
2.5
4.2
2.0
5.0
4.3
43
49
212
125
520
589
Purge column with 10 column volumes of
mobile phase to be used in analysis
(>>> 4.6x150mm = 25mL)
Reversed-Phase (C18 etc.) columns equilibrate
quicker than Normal Phase columns
(magnitude of ten)
Normal phase columns (silica or alumina) may
take several DAYS at flow rates of 1.0 ml/min
Solvent Viscosities
Solvent
Solvent Viscosities
Viscosity [cP] at 20° C
Acetone
Acetonitrile
Cyclohexanone
Di-isopropylether
Diethyl ether
Dimethyl acetamide
Dimethyl formamide
Dimethyl sulfoxide
Dioxane
Ethanol
Ethyl acetate
Hexafluoroisopropanol
iso-Propanol
Isooctane
Methanol
0.32
0.37
0.98
0.37
0.23
2.1
0.92
2.2
1.54
1.2
0.45
1.0
2.5
0.5
0.6
Remember: Some mixtures are more viscous than
either pure solvent -- 50/50 MeOH/H2O is almost 2x
Dr. Shulamit Levin, Medtechnica
Solvent
Viscosity [cP] at 20° C
Methyl acetate
0.37
Methylene chloride
0.44
Methylethyl ketone
0.4
n-Heptane
0.42
n-Hexane
N-Methyl pyrrolidone
n-Pentane
0.33
1.67 (25? C)
0.235
n-Propanol
2.3
o-Dichlorobenzene
1.41
Tetrahydrofuran
0.46
Toluene
1.2.4-Trichlorobenzene
0.59
1.89 (25? C)
Water
1.0
m-Xylene
0.62
o-Xylene
0.81
Remember: Some mixtures are more viscous than
either pure solvent -- 50/50 MeOH/H2O is almost 2x
11
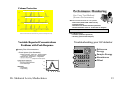
Column Protection
Column Protection
Major cause of column deterioration is contamination.
Use of guard columns may increase column life-time
to > 10,000 analyses
column coupler
1. Guard column should be regarded as a cost-effective
sacrifice to extend analytical column life-time
2. Should contain IDENTICAL packing material as the
analytical column
e.g. using a different C18, with different
retention properties could actually destroy
the separation
30mm guard
column
Well designed, well packed guard column will actually
IMPROVE the analytical separation efficiency
Column Protection
Column Protection
1: Sulfanilamide
Column:
Sentry Nova-Pak C18
Mobile Phase:
Sentry Symmetry C8
2: Sulfadiazine
Conditions
Symmetry™ C 8 3.9 mm X 150
mm with Sentry™ Guard
Column 3.9 mm X 20 mm
water/methanol/glacial acetic
acid 79:20:1
Adsorbosphere C18
3: Sulfathiazole
Upchurch ODS
Brownlee NewGuard RP-18
Alltech Econosil C18
4: Sulfamerazine
Zorbax Reliance Rx C8
Injection 5020
2
0%
20%
40%
60%
80%
100%
5: Sulfamethazine
1
Start
% of original efficiency
0
Effect of guard column on HPLC columns efficiencies
Analytical column Nova-Pak C18 (150 x 3.9mm or 4.6mm) except Zorbax Rx C8 (150 x 4.6mm)
Sample was 0.5µ
µL injection acenapthene (2.9 mg/mL) and acetone (34 µL/mL) in ACN/Water
6: Succinylsulfathiazole
2
4
6
8
10
Minutes
Chromatogram of Life-time Test
* Guard Column Changed Every 500 Injections
Dr. Shulamit Levin, Medtechnica
12
Column Protection
Performance Monitoring
A. Initial injection on Symmetry C8 Sentry guard column
Use Your Test Method
(Known Performance)
B. After 550 injections on same Sentry guard column
* Monitor at least One Peak in one injection
- Plate Count (Peak width relative to RT),
- Peak Asymmetry,
- Retention Time and/or Retention parameter
- Relative Retention Time for Critical Pair of Analytes.
- Peak Response
C. New Sentry Guard column for injection 551 on analytical column
Extension of column lifetime with Guard Column using a mixture of sulfa drugs as the sample
Variable Reported Concentrations
Problems with Peak Response
Linearity Test of Concentrations
* Inject Multiple Runs
- Precision (at least 5 injections)
- Accuracy (Use Control Samples)
Troubleshooting your UV detector
0.01
- Check Injector (Use Standards)
** Multiple
Multiple Injections
Injections -- Same
Same Vial
Vial --- Syringe
Syringe Problem
Problem
or
or IfIf Only
Only 1st
1st Injection
Injection Low
Low --- Septa
Septa Problem
Problem
** Different
Different Vials
Vials --- Evaporation
Evaporation --- Degradation
Degradation
** Injection
Injection Volume
Volume Test
Test (Weight
(Weight before
before and
and after
after injection)
injection)
RSD < 5-15%
- Integration Software
S
R
AUFS
Offset
Reference
Energy
Sample Energy
Absorbance
Offset
0.010
** Electronic
Electronic Peak
Peak Generator
Generator
** Poor
Poor Peak
Peak Shape
Shape
AU
- Detector
** Cell
Cell Problem
Problem
** Lamp
Lamp Failing
Failing
0.005
0.000
51.8 52.0 52.2 52.4 52.6 52.8
Minutes
Dr. Shulamit Levin, Medtechnica
13
Extraneous Peaks
Unusual Phenomena
Extraneous Peaks
Problems with Baseline
Isocratic LC - Extra Peak - Sharp - Contaminant
Extraneous Peaks
Sample
0.100
Blank
Extraneous Peaks
0.028
0.026
0.090
0.022
0.030
0.020
0.010
0.018
0.016
0.014
0.012
AU
0.040
TBHQ - 4.525
AU
0.050
BHT - 10.633
0.020
0.060
BHA - 6.896
0.070
PG - 2.919
0.024
0.080
0.010
0.008
0.006
0.004
0.002
0.000
0.000
0.00 2.00 4.00 6.00 8.00 10.0012.0014.00 16.0018.0020.0022.0024.0026.0028.00 30.00
Minutes
-0.002
0.00 2.00 4.00 6.00 8.00 10.00 12.00 14.00 16.00 18.0020.00 22.00 24.00 26.0028.00 30.00
Minutes
Isocratic LC - Broad -Peak from Previous Injection or Injector
Contamination
Dr. Shulamit Levin, Medtechnica
14
Isocratic LC - Negative Peak
often occurs in Ion-Pairing -- Sample Solvent
Installation and Equilibration
Connect Column Inlet
Purge Column at Low Flow Rate To Waste -Then Connect to Detector
( begin flow of analytical columns at 0.1 ml/min
increase by 0.2 ml/min increments every 30 seconds until
final analytical flow rate is reached)
mobile phase flow direction
Waters
1.0
HPLC Pump
Manual
Injector
Guard
Column
HPLC Column
Detector
Degas Solvents
Solvent Degassing Precautions
1. Degas solvents prior to adding modifiers
Vacuum
2. Helium sparge is good, as long as solvent doesn't
change due to volatility of solvents and/or additives
3. Solvents should be degassed daily
Ultrasonic bath
Time = 1 minute
Dr. Shulamit Levin, Medtechnica
15
BASELINE TROUBLESHOOTING
NOISY BASELINE
Noisy baseline
Cyclic
INSTRUMENTAL
WEAK DETECTOR LAMP
Synchronous noise
Spikes
Replace lamp
CHEMICAL
TRASH ELUTING OFF COLUMN
Flush column with strong solvent
LEAKS
Stop leaks. Replace fittings
No peaks
Asynchronous noise
DETECTOR CELL DIRTY
Flush with 6N nitric acid
GAS IN MOBILE PHASE
Degas solvent
GAS BUBBLE IN DETECTOR CELL
Put .009" tubing after detector (not RI!)
Drift
ELECTRONIC NOISE
Positive & negative peaks
Remove source. Shield cables. Clean contacts
SENSITIVITY TOO HIGH
Lower sensitivity. Adjust gain
SYNCHRONOUS NOISE
ALMOST ALWAYS CAUSED BY THE PUMP
Air in pump head - Prime pump and degas solvent
Check valve problem - Rebuild or replace
Broken plunger - Replace (blame it on someone else)
Mixing problem - Increase system volume
Electrical noise - Change circuits, remove source
Dr. Shulamit Levin, Medtechnica
ASYNCHRONOUS NOISE
BUBBLES
Degas mobile phase
GAS CAUGHT IN DETECTOR
Degas mobile phase. Put
backpressure on cell.
LEAKS
Fix leaks, replace fittings
MIXING PROBLEMS
Increase system volume
PLUGGED LINES
Remove plug, flush system
ELECTRICAL PROBLEMS
Remove source, change circuits
16
BASELINE DRIFT
INSTRUMENTAL
GRADIENT - SOLVENT B ABSORBS MORE
THAN SOLVENT A
Try a new mobile phase, use baseline
subtraction
SOLVENT CHANGING (GAS ABSORPTION,
EVAPORATION
Helium sparge, enclose solvents
SOLVENT LEAKS
Tighten, replace fittings
THERMAL EFFECTS (ESPECIALLY RI,
CONDUCTIVITY, ECD)
Cell temperature regulation
BACKPRESSURE CHANGES
Filter solvents and samples. Sample too
viscuous
SIPHONING (RI, CONDUCTIVITY, ECD)
Increase system volume
MIXING PROBLEMS
CYCLIC BASELINE
CHEMICAL
COMPOUNDS ELUTING OFF COLUMN
Run strong solvent until baseline is stable
SOLVENTS IN GRADIENT ARE NOT PURE
Change the solvent batch or
manufacturer.
Check if the solvents are grandient
grade.
SPIKES
BUBBLES
Degas solvent
POOR ELECTRICAL CONNECTION, LOOSE WIRING
Clean and tighten detector leads, check wiring,
replace spade lugs.
LAMP RELAY TRYING TO FIRE A DEAD LAMP
Replace lamp
ELECTRICAL NOISE
Change circuits, remove source
Common sources include switching valves,
compressors, muffle furnaces, fraction collectors,
power conditioners, lighting, poor power source.
Dr. Shulamit Levin, Medtechnica
TEMPERATURE FLUCTUATIONS
Thermally insulate. Move away from ventilation.
Increase cell temperature.
MIXING PROBLEMS
Increase system volume
GAS IN MOBILE PHASE
Degas solvents
ELECTRICAL PROBLEMS
Change circuits, remove source
ERRATIC PUMP
Repair pump
PLUG
Remove obstruction, flush system
NO PEAKS
INSTRUMENTAL
Injector not making injections
Pump not pumping
Dead detector
Integrator/recorder not wired
correctly
Gain setting too low
Leaks
CHEMICAL
Column retaining all compounds
Bad or wrong mobile phase
Bad or wrong standard or sample
Wrong guard column
WHAT TO DO:
Remove column and inject acetone
solution to make a peak
WHAT TO DO:
Inject acetone solution to make a peak
17
NEGATIVE & POSITIVE PEAKS
INSTRUMENTAL
Air bubbles passing through cell
Degas mobile phase
You're using an RI detector
May be normal since peak direction is a
function of
refractive index differential from mobile
phase
All peaks negative - polarity wrong
Reverse leads or change detector polarity
All peaks negative - You're using indirect UV
Change polarities or reverse leads
CHEMICAL
Some eluting compounds
absorb less than solvent
Use a different or cleaner
solvent
Strange things can happen!
Radio transmitters can cause baseline noise
Contaminated helium bottles and lines can cause noise
System components can get coated with impurities
Solvent vendors can misname solvent bottles
Some filters can introduce particulates
Basic assumptions
1. The HPLC is plugged in and turned on
2. Solvent is in the reservoir
3. The pumps are primed and in good working order
4. The HPLC is plumbed and wired correctly
5. The detector has a good lamp in it
6. The solvent bottle doesn't have a vacuum on it
7. You're not using acetone for solvent at 195 nm
8. You're not injecting rocks
9. You're not doing a water to hexane gradient
10. Your're not trying to detect sugars at 254 nm
11. You're not mixing MEOH and water without degassing
12. You're not sparging with nitrogen or air
13. You're not running water through a silica column
14. Solvent pH is not 13 on a silica base column
15. You're not running a 1M NaCl to 100% ACN gradient
16. You're not doing gradients with an RI detector
17. You're RI is not under the air conditioner vent
18. No buffer stalagtites on your pump heads
19. HCl vapors are not blowing onto your HPLC
20. You're having a wonderful time!
Dr. Shulamit Levin, Medtechnica
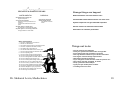
Things not to do:
* Plug the outlet of your RI detector
* Flush your system with methanol after running buffer
* Inject samples that may precipitate in the eluent
* Run long durations with HCl on your stainless steel HPLC
* Filter organic solvents through aqueous filters
* Spill buffers onto HPLC electronics
* Try to change the column frits while it still has pressure in it
* Store THF on the shelf, uncapped, for weeks
* Pump cyclohexane above 2000 psi
* Tightly seal your mobile phase container
* Cut tubing with a wire cutter
18