1
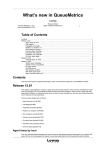
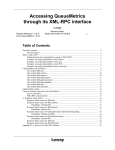
Understanding MySQL storage
and clustering in QueueMetrics
Loway
Understanding MySQL storage and clustering in QueueMetrics
Loway
Table of Contents
1. Understanding MySQL storage and clustering ....................................................................................................... 1
2. Enabling MySQL storage ............................................................................................................................... 2
2.1. Understanding MySQL storage .............................................................................................................. 2
2.2. Installing Qloaderd ............................................................................................................................. 2
2.3. Setting up QueueMetrics ...................................................................................................................... 4
3. Running QueueMetrics to monitor a cluster of Asterisk servers ................................................................................... 7
3.1. Installing Qloaderd on the Asterisk servers ................................................................................................ 7
3.2. Setting up QueueMetrics ...................................................................................................................... 7
4. Tips and tricks for Qloaderd ............................................................................................................................ 9
4.1. Checking how much data is in the database on a daily basis ........................................................................... 9
4.2. Optimizing queue_log access time .......................................................................................................... 9
5. Getting help ............................................................................................................................................. 10
iii
Chapter 1. Understanding MySQL storage
and clustering
QueueMetrics works by parsing an ACD event file called queue_log that Asterisk produces during its normal operations. QueueMetrics is
built to run with two different storage models:
• The Flat File storage model lets the data reside in a file on the Asterisk server, and is the default mode;
• The MySQL storage model uploads the data to a database using a small loader script called Qloaderd and has QueueMetrics read it
back from that database.
Running through a flat-file storage is usually enough for small call centers having both Asterisk and QueueMetrics living on the same
server. This is okay for small setups (like 10-20 agents) where the size of the queue_log file will hardly ever reach the tens of megabytes.
On the contrary, if you run a larger setup, the advantages of the MySQL storage model become more important and worth the extra setup:
• You can install QueueMetrics on a separate server from the main Asterisk server. This means that as your Asterisk server grows busier,
you don’t want to risk that someone running a monster analysis through QueueMetrics may slow it down.
• You get a lot of added flexibility: you can have MySQL, Asterisk and QueueMetrics live on different servers, and choose the best
deployment model according to your actual usage load. You can also create hot-backup scenarios with a secondary QueueMetrics
server that will take over in case the primary server should be down, and you can take full advantage of the database’s replication model
to handle high load and high-availability requirements.
• You get better efficiency: MySQL is optimized to maximize disk access efficiency when dealing with a subset of the whole data (e.g.
getting today’s information for just one queue will not need scanning your whole ACD history)
• You can have multiple Asterisk servers sending data to the same QueueMetrics instance and you can use that one instance to report on
all activity through all servers: we call this clustering. This makes it possible to build very large call centers in a simple way, just by adding
more inexpensive hardware to handle more calls and by putting yourself in a situation where a problem on a server will not take down the
whole call center but just a fraction of it.
1
Chapter 2. Enabling MySQL storage
In order to enable MySQL storage, you have to:
• Install Qloaderd on your Asterisk server and point it to the main QueueMetrics database
• Tell QueueMetrics to run reports from the database
2.1. Understanding MySQL storage
In order to set up the system, we first have to understand the concepts involved.
• The QueueMetrics database is a MySQL database loaded with the QueueMetrics default database structure. This is usually installed
with QueueMetrics (as it is needed to make it work) and can be on any machine, as QueueMetrics will connect to it via a TCP/IP socket.
When we refer to the database in the context of MySQL storage, we are usually thinking about a table called queue_log; that’s where
Asterisk log information is uploaded to.
• The database is logically divided into one or more partitions; these are virtual tables that reside within one single physical table.
Partitions are useful as they let you have more than one Asterisk queue data set within the same database. This is useful e.g. for testing,
or for sending multiple queue_log data sets to the same physical database for clusters. You can call a partition any name you like, as
long as it does not exceed 5 characters.
• Qloaderd is a small Perl script that will upload the data Asterisk produces to one chosen partition. It is built to be lightweight and pretty
smart; in case it is restarted, it will automatically detect which data is already present in the database and upload only missing data. It
runs on the Asterisk server and points to the MySQL server that QueueMetrics uses; in order to run it, you must decide a partition for it
to upload data to. If multiple copies of Qloaderd are run at once, each copy must point to its own partition, or data corruption will surely
happen.
• QueueMetrics will access MySQL data by using a special file name, that is usually "sql:partition". In order to see what is going on with
your database, QueueMetrics offers a special MySQL storage inspection mode to see which partitions are available, which are active
and how much data is in them.
2.2. Installing Qloaderd
First you have to install Qloaderd and then you’ll have to configure it to suit your needs.
2.2.1. Installing on TrixBox or other CentOS based Linux distros
If you run TrixBox or any other CentOS/RHEL base Linux distro, you can install Qloaderd very easily using the provided yum package
manager:
wget -P /etc/yum.repos.d http://yum.loway.ch/loway.repo
yum install qloaderd
If in the future you would like to upgrade it, you will do so by running:
yum update qloaderd
The installation process installs all necessary components and dependencies, Qloaderd itself and starts it immediately. Qloaderd is
installed in /usr/local/qloader and its startup script is installed as /etc/init.d/qloaderd. If you just installed Qloaderd using yum, skip to the
section called Section 2.2.3, “Customizing Qloaderd”
2.2.2. Manual Qloaderd installation
In order to download the Qloaderd package, go to the Downloads page on QueueMetrics' website.
Make sure you have the following packages available on your system, as Qloaderd will use Perl’s DBI to connect to MySQL:
libdbi
libdbi-dbd-mysql
libdbi-drivers
Unpack the Qloaderd tar-ball and copy the file qloader.pl to a location of your choice (we suggest /usr/local/qloader). Run the following
commands to make sure the file is executable:
cd /usr/local/qloader
dos2unix qloader.pl
chmod a+x qloader.pl
We also provide a "plain-vanilla" startup script that can be installed in your local startup directory in order to start Qloader automatically. It
may require a bit of tweaking, but it will run on all Linux distributions. You should very likely copy it from Other-initscript to /etc/init.d on your
system.
2
Enabling MySQL storage
Run the following commands to make sure the file is executable:
dos2unix /etc/init.d/qloaderd
chmod +x /etc/init.d/qloaderd
In order to have the service started on boot, use the command:
chkconfig --add qloaderd
(or the equivalent for your distribution).
2.2.3. Customizing Qloaderd
Before using Qloaderd, you must define:
• The name and address of the MySQL database server
• On which partition is it supposed to upload data to
• The Asterisk log file it must upload
• Its own error log file
To set the name and address of the MySQL server, edit the file /usr/local/qloader/qloader.pl and change the following lines as needed:
my
my
my
my
$mysql_host
$mysql_db
$mysql_user
$mysql_pass
=
=
=
=
"10.10.3.5";
"queuemetrics";
"queuemetrics";
"javadude";
Please make sure that the MySQL server will allow connecting from the Asterisk server - this can usually be obtained by running a SQL
statement on the database server, such as:
grant all privileges on queuemetrics.* to 'queuemetrics'@'10.10.3.100'
identified by 'javadude';
where the string "10.10.3.100" in the example is the internal IP address of the Asterisk box we’re installing Qloaderd on.
To set the other parameters, edit the file /etc/sysconfig/qloaderd and change the following parameters:
PARTITION=P001
QUEUELOG=/var/log/asterisk/queue_log
LOGFILE=/var/log/asterisk/qloader.log
If you are unsure what to set the partition to, just leave it to P001 for the moment. The queuelog parameter is the name of the file Asterisk
produces and it is to be uploaded. The logfile parameter is a log file where Qloaderd will write its activity to and that you can look up to
debug problems.
2.2.4. Starting and stopping Qloaderd
To test if everything is in order, you can now start Qloaderd by running:
/etc/init.d/qloaderd start
It should start up and start writing to its own log file. To see if everything is okay, you just run:
tail -f /var/log/asterisk/qloader.log
And it should output something like:
|Fri Sep 14 09:33:24 2007|QueueMetrics MySQL loader - $Revision: 1.3 $
|Fri Sep 14 09:33:24 2007|Partition P001 - PID 2827 - TZ offset: 0 s.
- Heartbeat after 900 s.
|Fri Sep 14 09:33:24 2007|Now connecting to DB qm14 on 10.10.3.5 as
user queuemetrics with password queuemetrics
|Fri Sep 14 09:33:24 2007|Ignoring all timestamps below 0
As you can see, it states what it is trying to do and will start uploading data. Every 100 lines of uploaded data or 900 seconds of Asterisk
ACD inactivity, it will output a reference line that tells how much data it has uploaded in the current usage session.
If you see something like:
3
Enabling MySQL storage
|Fri Sep 14 09:25:49 2007|QueueMetrics MySQL loader - $Revision: 1.3 $
|Fri Sep 14 09:25:49 2007|Partition P001 - PID 2749 - TZ offset: 0 s.
- Heartbeat after 900 s.
|Fri Sep 14 09:25:49 2007|Now connecting to DB log_code on 10.10.3.5 as
user ldap with password ldappo
E|Fri Sep 14 09:25:49 2007|---ERROR FOUND-E|Fri Sep 14 09:25:49 2007|Error type: dr
E|Fri Sep 14 09:25:49 2007| Statement:
E|Fri Sep 14 09:25:49 2007|
Error: Unknown database 'log_code'
E|Fri Sep 14 09:25:49 2007|Waiting 15s before reattempting to connect
This means that it was not possible to connect to the database - very likely your server, database, user, password or access grants are
wrong. Please note that in case of an error, it will simply try again - this way, no matter what happens to your database, Qloaderd will try
again and again until it can establish a working connection and will then upload data.
You can stop or restart Qloaderd using the following commands:
/etc/init.d/qloaderd stop
/etc/init.d/qloaderd restart
2.2.5. Testing if data is actually being uploaded
To make sure that data is being uploaded correctly, you should log on to the database server, open the MySQL shell and issue a command
like:
select partition, queue, count(*) as n_records
from queue_log
group by partition, queue
order by partition, queue
The result should look something like this:
+-----------+------------------+-----------+
| partition | queue
| n_records |
+-----------+------------------+-----------+
| P003
| myqueue
|
9 |
| P003
| NONE
|
121 |
| P003
| queue-abc
|
2096 |
| P003
| queue-test
|
1341 |
| P003
| UNK
|
17 |
| P01
| qq-group
|
33000 |
| P01
| cust-rajax
|
204 |
| P01
| NONE
|
8139 |
| RT
| NONE
|
8064 |
| RT
| q1
|
9216 |
| RT
| q2
|
9216 |
+-----------+------------------+-----------+
11 rows in set (0.16 sec)
This report shows:
• That we are using three distinct partitions: P003, P01 and RT. (Af first you will only find one).
• For each partition, we see the Asterisk queue names involved plus the special keyword NONE
• For each queue, we get an idea of how many records it generated, i.e. how big it was. As a rough estimate, consider that each call
generates an average of around three or four records (but this is dependent on how your call center is set up).
As your Asterisk system runs and data is uploaded into the database, you should see the figures for the number of records rise between
repetitions of the same query. If the figures don’t change, or you do not see you partition at all, this means that Qloaderd is not uploading
data.
2.3. Setting up QueueMetrics
Setting up QueueMetrics is very straightforward: if you click on "Run custom reports" and enter "sql:P001" as the filename, you can check if
your partition P001 contains data for the queue you just selected.
4
Enabling MySQL storage
Just remember to configure the queues you want to report on, before running this test.
2.3.1. Changing the defaults
Of course, you’ll want QueueMetrics to automatically use the partition you choose as its default data source - you can easily do this by
editing the file configuration.properties and setting:
# This is the default queue log file.
default.queue_log_file=sql:P001
After restarting QueueMetrics, the MySQL storage source will be used as a default.
2.3.2. Using the QueueMetrics database inspector
As it is not always easy to understand how much data is in the database, QueueMetrics offers a database inspection tool to easily see
which data is available.
You can enter it by clicking on the "Mysql storage information" link from the "Edit QueueMetrics settings" section (if you do not find that link,
make sure your admin user holds the key USR_MYSQL).
If it takes a while to enter the page, this is perfectly normal; in order to produce the data seen through the inspector, it performs a series
of table scans. As adding the correct indexes for faster analysis would use a lot of disk space and slow down the database system
considerably versus an occasional use of the inspector, they were not included with QueueMetrics.
5
Enabling MySQL storage
From this page we see which partitions are available for analysis. For each partition we can see:
• The total number of entries available
• An estimated number of calls
• The date of the oldest and most recent call entry
• How many days does the data span over
• The last heartbeat: if there is no data to upload (e.g. at night), the Qloaderd will in any case upload a Heartbeat record every 15 minutes.
This makes it clear that, even if there is no recent data in it, a working Qloaderd is currently uploading data on that partition. If there is no
new data and the last heartbeat is over 20 minutes old, this probably means that the Qloaderd process is not running.
If we click on the details of a partition, we see a screen like the following one:
This shows which queues and agents are available on the partition, and also shows the oldest and most recent records regarding each
queue or each agent.
6
Chapter 3. Running QueueMetrics to
monitor a cluster of Asterisk servers
By using the Qloaderd mechanism, you can have a number of distinct Asterisk servers, each uploading data to a different partition of the
same QueueMetrics database. This allows to run an analysis that spans the whole cluster, and not just one single Asterisk server.
To set up a cluster of Asterisk servers to be monitored through QueueMetrics, you should adhere to the following deployment rules:
• Agent names must be unique throughout the call center; that is, you cannot have an Agent/101 working on Asterisk server A and another
Agent/101 working on Asterisk server B, as their data would be mixed and it would be quite hard to tell who did what.
• Queue names may be shared over more than one server, and QueueMetrics will report on that queue as if it had been processed on a
single box.
• As the real-time monitoring is per-queue, you can run real-time monitoring on a queue by queue basis, no matter on which physical
servers those queues are hosted on, or if they are hosted on more than one server.
This deployment permits call center scalability by adding more Asterisk servers, as needed, to handle the traffic.
in order to run a clustered version of QueueMetrics, you need to use a special cluster licence key. If you need to test this
feature before purchasing, you should ask for a cluster temporary key, as the ordinary temporary keys do not natively
support cluster mode.
3.1. Installing Qloaderd on the Asterisk servers
To get started, you must install Qloaderd on each Asterisk server and make sure that it is uploading data to the main QueueMetrics
database. Each server must be uploading data to a distinct partition, e.g. if you have three servers, you could upload to partitions named
"S1", "S2" and "S3". In short, each instance of Qloaderd is configured exactly as if it were in the single-server MySQL storage model.
3.2. Setting up QueueMetrics
Setting QueueMetrics to work with clustering requires a little effort, as we must provide it with all the necessary information required to
contact and distinguish each Asterisk server and perform its duties, e.g. logging on agents. We have to edit the configuration.properties
file and define the machines that make up our cluster by giving each a short name. This name might be the same as the partition name or
might be different - as you best see fit. In the following example, we will setup a cluster of two machines - one called "aleph" with its data
uploaded on partition "P001" and one called "trix" with its data uploaded to partition "P002".
# Cluster to poll for RT data
# list of pipe-separated members of the cluster
cluster.servers=aleph|trix
This sets up a cluster made up of two Asterisk servers, called "aleph" and "trix". For each box, we then create an entry like the following
one for "aleph":
cluster.aleph.manager=tcp:dial:[email protected]
cluster.aleph.queuelog=sql:P001
cluster.aleph.monitored_calls=z:/qm_streamcall/server_aleph
cluster.aleph.callfilesdir=
cluster.aleph.audioRpcServer=
cluster.aleph.agentSecurityKey=
And we will do the same for the other server "trix".
cluster.trix.manager=tcp:admin:[email protected]
cluster.trix.queuelog=sql:P002
cluster.trix.monitored_calls=z:/qm_streamcall/server_trix
cluster.trix.callfilesdir=
cluster.trix.audioRpcServer=
cluster.trix.agentSecurityKey=
The explanation of the entries is:
• The manager entry refers to the Asterisk manager API interface for that machine, and is written as tcp:[login]:[password]@[server]. This
is needed for Live monitoring and to login/logoff/pause agents. Make sure there is a matching entry in the file /etc/asterisk/manager.conf
on each server!
7
Running QueueMetrics to monitor
a cluster of Asterisk servers
• The queuelog file refers to which partition the data for this server will be pulled from. The format is the same as the sql:partition format we
previously encountered.
• The monitored_calls entry points to a disk share where call recordings for this machine are found. This allows to listen to calls through
the QueueMetrics browser interface.
• The other entries should be left blank.
Now change the following property:
# This is the default queue log file.
default.queue_log_file=cluster:*
And restart QueueMetrics. Now all queries are running on the whole cluster, and the real-time monitoring is running on the whole cluster as
well.
For more detail on clustering in QueueMetrics, see the section "Monitoring clusters with QueueMetrics" in the QueueMetrics user manual.
8
Chapter 4. Tips and tricks for Qloaderd
4.1. Checking how much data is in the database on a daily basis
If you want a breakdown by day of the contents of the each partition, you can run the following query:
SELECT partition,
FROM_UNIXTIME(time_id, '%Y%m%d' ) as date,
count(*) as n_rows
FROM queue_log
GROUP BY partition, FROM_UNIXTIME( time_id, '%Y%m%d' )
ORDER BY partition, FROM_UNIXTIME( time_id, '%Y%m%d' );
The result will look something like:
+-----------+----------+--------+
| partition | date
| n_rows |
+-----------+----------+--------+
| P01
| 20070329 |
4216 |
| P01
| 20070411 |
5 |
| P01
| 20070412 |
3 |
| rt
| 20070508 |
9365 |
| rt
| 20070509 | 13248 |
| rt
| 20070510 |
3883 |
+-----------+----------+--------+
6 rows in set (0.45 sec)
And will tell you how many rows were uploaded per partition, per day.
4.2. Optimizing queue_log access time
If you would like QueueMetrics to access the database faster, you can run the following query to reorganize data on disk:
ALTER TABLE `queue_log`
ORDER BY partition, time_id, unique_row_count
This query might take a very long time to complete if the database is big and will lock the table until completion, so it should be run in a
moment when the system is idle (e.g. at night via a cron job).
9
Chapter 5. Getting help
If you are still experiencing problems installing or running QueueMetrics, we suggest you check out the following resources:
• The QueueMetrics FAQs at http://queuemetrics.com/faq.jsp are a collection of common solved problems that people have previously
experienced with QueueMetrics. If you are faced with an error message, this is the first place to look at.
• The official QueueMetrics User Manual can be read online at http://queuemetrics.com/manual.jsp and provides very detailed
documentation on all aspects of QueueMetrics.
• The QueueMetrics forums at http://forum.queuemetrics.com will help you in pinpointing your problems and getting community support.
They are also helpful in seeing what other people are doing with QueueMetrics.
• AstRecipes is a wiki collection of Asterisk "recipes", mainly aimed at call-center users see http://astrecipes.net
• If your issues are still unsolved, you may contact Loway - refer to http://queuemetrics.com/contact.jsp for all relevant contact information.
10