1
QUEUEMETRICS USER MANUAL
Loway
QUEUEMETRICS USER MANUAL
Loway
Table of Contents
1. What is QueueMetrics? ................................................................................................................................. 1
2. Installing QueueMetrics .................................................................................................................................. 2
2.1. Prerequisites: Server .......................................................................................................................... 2
2.2. Prerequisites: Client ........................................................................................................................... 2
2.3. Version numbering scheme .................................................................................................................. 2
2.4. Where to install ................................................................................................................................ 2
2.5. Installing in practice ........................................................................................................................... 2
2.6. Updating from a previous version of QueueMetrics ....................................................................................... 5
2.7. Installing a licence key ........................................................................................................................ 6
2.8. Setting session timeout ....................................................................................................................... 8
2.9. Understanding basic security mechanisms ................................................................................................. 8
2.10. Understanding QueueMetrics memory requirements .................................................................................... 8
2.11. Understanding QueueMetrics disk I/O requirements .................................................................................... 9
3. Logging on to QueueMetrics .......................................................................................................................... 10
3.1. License information ........................................................................................................................... 11
3.2. Automatic URL login ......................................................................................................................... 12
4. Running a report ........................................................................................................................................ 13
4.1. Quick activity reports ......................................................................................................................... 13
4.2. Agent report ................................................................................................................................... 13
4.3. Custom reports ............................................................................................................................... 14
4.4. Saving queries ................................................................................................................................ 16
4.5. Understanding results: Common header .................................................................................................. 17
4.6. Exporting data from reports ................................................................................................................. 17
4.7. Understanding results: Answered calls .................................................................................................... 18
4.8. Understanding results: Unanswered calls ................................................................................................. 20
4.9. Understanding results: Area code report .................................................................................................. 22
4.10. Understanding results: Inbound ACD call attempts .................................................................................... 23
4.11. Understanding results: Call distribution .................................................................................................. 25
4.12. Understanding results: Agent activity ..................................................................................................... 27
4.13. Understanding results: Call outcomes .................................................................................................... 30
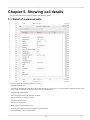
5. Showing call details .................................................................................................................................... 32
5.1. Detail of answered calls ..................................................................................................................... 32
5.2. Listening to answered calls ................................................................................................................. 33
5.3. Detail of unanswered calls .................................................................................................................. 35
5.4. Detail of IVR calls ............................................................................................................................ 36
6. Report Details ........................................................................................................................................... 37
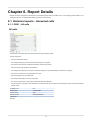
6.1. Historical reports - Answered calls ......................................................................................................... 37
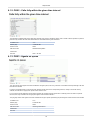
6.2. Historical reports - Details of answered calls ............................................................................................. 44
6.3. Historical reports - Unanswered calls ...................................................................................................... 46
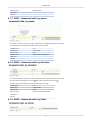
6.4. Historical reports - Details of unanswered calls .......................................................................................... 56
6.5. Historical reports - Area code analysis .................................................................................................... 57
6.6. Historical reports - Distributions ............................................................................................................ 58
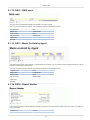
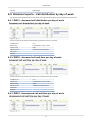
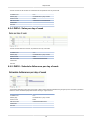
6.7. Historical reports - Call distribution by day ............................................................................................... 59
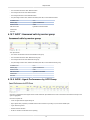
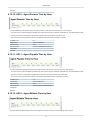
6.8. Historical reports - Call distribution by hour .............................................................................................. 62
6.9. Historical reports - Call distribution by day of week ..................................................................................... 67
6.10. Historical reports - Agents and Sessions ................................................................................................ 70
6.11. Historical reports - Details of agent sessions and pauses ............................................................................. 80
6.12. Historical reports - Call outcomes ........................................................................................................ 82
6.13. Historical reports - IVR tracking ........................................................................................................... 86
6.14. Externally generated reports .............................................................................................................. 88
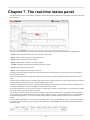
7. The real-time status panel ............................................................................................................................. 89
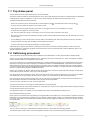
7.1. Top status panel .............................................................................................................................. 91
7.2. Calls being processed ....................................................................................................................... 91
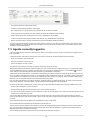
7.3. Agents currently logged in .................................................................................................................. 92
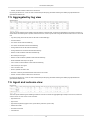
7.4. Aggregated by queue view .................................................................................................................. 93
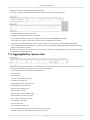
7.5. Aggregated by tag view ..................................................................................................................... 94
7.6. Agent and outcome view .................................................................................................................... 94
7.7. Using Locations ............................................................................................................................... 95
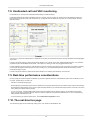
7.8. Unattended call and VNC monitoring ...................................................................................................... 96
7.9. Real-time performance considerations .................................................................................................... 96
7.10. The real-time live page ..................................................................................................................... 96
7.11. The top panel ................................................................................................................................ 97
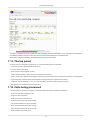
7.12. Calls being processed ...................................................................................................................... 97
7.13. Agents currently logged in ................................................................................................................. 98
7.14. Server status ................................................................................................................................ 98
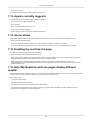
7.15. Enabling the real-time live page .......................................................................................................... 98
7.16. Help! My Real-time and Live pages display different results! ......................................................................... 98
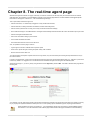
8. The real-time agent page .............................................................................................................................. 99
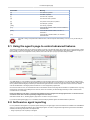
8.1. Using the agent’s page to control advanced features .................................................................................. 102
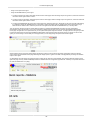
8.2. Self-service agent reporting ............................................................................................................... 102
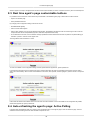
8.3. Real time agent’s page customizable buttons .......................................................................................... 104
iii
QUEUEMETRICS USER MANUAL
8.4. Auto-refreshing the agent’s page: Active Polling .......................................................................................
8.5. Gathering call information through agent-side QA forms ..............................................................................
8.6. Agents Page performance considerations ...............................................................................................
8.7. The new Realtime Agents Page ..........................................................................................................
9. Tracking IVR data .....................................................................................................................................
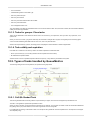
9.1. A call’s life-cycle ............................................................................................................................
9.2. Implementing IVR tracking .................................................................................................................
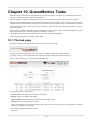
10. QueueMetrics Tasks ................................................................................................................................
10.1. The task page .............................................................................................................................
10.2. Types of tasks handled by QueueMetrics ..............................................................................................
10.3. RSS data export for tasks ................................................................................................................
11. The Agent Awareness subsystem (AGAW) ......................................................................................................
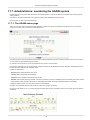
11.1. The AGAW architecture ..................................................................................................................
11.2. Installing the AGAW Licence ............................................................................................................
11.3. Agents: the AGAW client .................................................................................................................
11.4. Installing with Firefox ......................................................................................................................
11.5. Installing with Chrome ....................................................................................................................
11.6. Supervisors: accessing AGAW statistics ...............................................................................................
11.7. Administrators: monitoring the AGAW system .........................................................................................
12. Quality Assessment in QueueMetrics .............................................................................................................
12.1. Enabling QA monitoring ..................................................................................................................
12.2. Understanding Quality Assessment .....................................................................................................
12.3. Grading calls ...............................................................................................................................
12.4. Removing or Editing QA forms ..........................................................................................................
12.5. Running QA reports .......................................................................................................................
12.6. The main QA report .......................................................................................................................
12.7. The QA Summary report .................................................................................................................
12.8. The Training And Coaching Page .......................................................................................................
13. Advanced tracking of agent and grader performance ..........................................................................................
13.1. Tracking agent performance .............................................................................................................
13.2. Finding calls to be graded ...............................................................................................................
13.3. Grader calibration reports ................................................................................................................
14. Payroll data in QueueMetrics ......................................................................................................................
14.1. How it works ...............................................................................................................................
14.2. Payroll web pages .........................................................................................................................
14.3. Editing the system queue_log file .......................................................................................................
14.4. The editing log .............................................................................................................................
15. Multi-stint calls .......................................................................................................................................
15.1. Limitations and side-effects ..............................................................................................................
15.2. Multi-stint calls in QueueMetrics .........................................................................................................
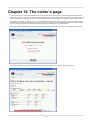
16. The visitor’s page ....................................................................................................................................
16.1. Setting up VISITORS in a real life scenario ...........................................................................................
17. Using Supervisors ...................................................................................................................................
18. Automating statistics download: the ROBOT profile ............................................................................................
18.1. Generate PDF and XLS reports and send them by e-mail ..........................................................................
18.2. Setting up a self-service wallboard .....................................................................................................
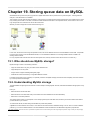
19. Storing queue data on MySQL ....................................................................................................................
19.1. Who should use MySQL storage? ......................................................................................................
19.2. Understanding MySQL storage ..........................................................................................................
19.3. Uploading data to MySQL ................................................................................................................
19.4. Loading data in QueueMetrics ...........................................................................................................
19.5. Checking MySQL database status ......................................................................................................
19.6. Optimizing the queue_log table ..........................................................................................................
19.7. Using the Asterisk Realtime QueueLog subsystem ...................................................................................
20. Monitoring clusters with QueueMetrics ...........................................................................................................
20.1. Setting up a cluster .......................................................................................................................
20.2. Setting up the members of the cluster .................................................................................................
20.3. Setting up QueueMetrics to access the cluster .......................................................................................
20.4. Using the Agent’s page with a clustered environment ................................................................................
21. Editing QueueMetrics settings .....................................................................................................................
21.1. Configuring users ..........................................................................................................................
21.2. Editing user classes .......................................................................................................................
21.3. Configuring queues ........................................................................................................................
21.4. Configuring agents ........................................................................................................................
21.5. Configuring locations ......................................................................................................................
21.6. Configuring call outcomes ................................................................................................................
21.7. Configuring Feature Codes ..............................................................................................................
21.8. Configuring Tag Codes ...................................................................................................................
21.9. Configuring pause codes .................................................................................................................
21.10. Configuring agent groups ...............................................................................................................
21.11. Configuring skills .........................................................................................................................
21.12. Configuring known numbers ............................................................................................................
21.13. Configuring QA forms ...................................................................................................................
21.14. Defining agent performance rules .....................................................................................................
iv
104
105
105
105
114
114
116
120
120
123
124
125
125
127
128
129
130
132
134
137
137
137
137
143
143
144
146
148
150
150
154
156
159
159
159
163
163
164
164
164
166
167
168
169
170
170
172
172
172
173
174
174
175
175
178
178
179
179
179
180
180
182
183
187
188
189
190
191
192
193
194
195
196
202
QUEUEMETRICS USER MANUAL
21.15. Dataset-based agent performance wizard ............................................................................................
21.16. Configuring reports .......................................................................................................................
21.17. Report ExportConfiguration pages .....................................................................................................
21.18. Configuring IVR and DID/DNIS names ...............................................................................................
21.19. Configuring CBTs (Computer Based Training) .......................................................................................
21.20. Configuring paged call lists .............................................................................................................
21.21. Configuring the new Real-time Agents Page .........................................................................................
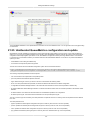
21.22. QueueMetrics configuration wizard ....................................................................................................
21.23. Unattended QueueMetrics configuration and update ................................................................................
21.24. Configuring system preferences .......................................................................................................
21.25. Installing the AGAW runner ............................................................................................................
21.26. Using the DbTest Diagnostic Tools ....................................................................................................
21.27. System audit log inspector .............................................................................................................
22. Listening to calls using Pluggable Modules (PM) ...............................................................................................
22.1. PMs to match Recorded Calls ...........................................................................................................
22.2. PMs to match Live Calls .................................................................................................................
23. Exporting call sets from QueueMetrics ...........................................................................................................
23.1. Exporting calls - an overview ............................................................................................................
23.2. Exporting calls in practice ................................................................................................................
23.3. Output format ..............................................................................................................................
23.4. Available implementors ...................................................................................................................
23.5. MP3 conversions on the fly ..............................................................................................................
24. Configuring Asterisk for QueueMetrics ...........................................................................................................
24.1. Configuring queues to report exit status ...............................................................................................
24.2. Configuring URLs to be launched by the agent real-time page .....................................................................
24.3. Listening to recorded calls using QM ...................................................................................................
24.4. Using AddQueueMember for dynamic agents .........................................................................................
24.5. Defining outbound queues (campaigns) ................................................................................................
24.6. Enabling ACD call attempts recording on Asterisk 1.0 and 1.2 .....................................................................
24.7. Enabling ACD call attempts recording on Asterisk 1.4 ...............................................................................
24.8. Listening to live calls: Unattended Call Monitoring ....................................................................................
24.9. Enabling VNC Monitoring .................................................................................................................
24.10. Enabling Agent’s page actions .........................................................................................................
24.11. Enabling XML-RPC call listening and streaming .....................................................................................
24.12. Enabling call outcomes ..................................................................................................................
24.13. Enabling call features ...................................................................................................................
24.14. Enabling pause codes ...................................................................................................................
24.15. Tracking required skills ..................................................................................................................
24.16. Closing ongoing calls ....................................................................................................................
24.17. Tracking DNIS and IVR information ...................................................................................................
24.18. Adding TAG information to calls .......................................................................................................
24.19. Enabling Hotdesking in the agent page ...............................................................................................
24.20. Running Asterisk 1.8 with QueueMetrics .............................................................................................
24.21. Handling Agents priorities on queues .................................................................................................
24.22. Using known numbers ...................................................................................................................
24.23. Configuring the AMI connection ........................................................................................................
24.24. Listening to encrypted recordings ......................................................................................................
24.25. The QueueMetrics watchdog page ....................................................................................................
25. For more information… .............................................................................................................................
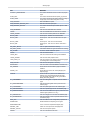
A. Default users ..........................................................................................................................................
B. Security keys ..........................................................................................................................................
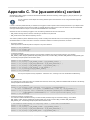
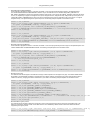
C. The [queuemetrics] context ..........................................................................................................................
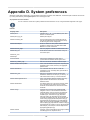
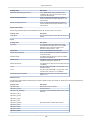
D. System preferences ..................................................................................................................................
E. Icons used by QueueMetrics ........................................................................................................................
F. Audit log records ......................................................................................................................................
F.1. Action class: User lifecycle (10XX) .......................................................................................................
F.2. Action class: Key management (11XX) ..................................................................................................
F.3. Action class: QueueLog editing (20XX) ..................................................................................................
F.4. Action class: QA editing (21XX) ..........................................................................................................
F.5. Action class: Realtime agent management (23XX) ....................................................................................
F.6. Action class: Realtime call management (24XX) .......................................................................................
G. Glossary ................................................................................................................................................
v
204
205
208
209
210
210
212
213
217
218
218
221
224
225
225
229
232
232
233
234
235
236
238
238
238
239
239
240
241
241
242
242
242
243
244
245
245
246
246
247
247
247
249
250
250
251
252
253
254
255
256
258
262
273
274
274
274
275
275
276
276
278
List of Tables
24.1. Possible API modes ............................................................................................................................... 250
vi
Chapter 1. What is QueueMetrics?
QueueMetrics is a versatile call center monitoring system dedicated to call centres based on the Asterisk PBX.
QueueMetrics lets you…
• Run reports on call center activity, divided by queue and filtered by agent and time period, that show what happened (e.g. taken calls,
lost calls, agents logging on and off…) during the specified period. Such reports can be run while Asterisk is running, so that you have no
delay in seeing what’s going on.
• See the details of call center activity, like each single call that was handled or lost, and listen to it through your web browser.
• Have a single real-time panel showing call center activity; you’ll see calls being processed by queues and agent activity in the very
moment it’s happening. You will be able to listen to your agents' calls as they are being made, and optionally see their screen through a
VNC application.
• Give your agents a web-based interface panel that lets them see their own calls while they’re being handled and optionally launch an
external web-app (like a third party CRM module) as the calls come in; they also can use it to log-on to Asterisk, log off and pause/
unpause themselves.
• Give agents a Mozilla-based system-awareness application, to see in real-time how their performance compares to the queue’s
• Allow external users, like your clients if you are an outsourcer or the QA dept if you run an in-house call center, monitor your call center in
real-time and see a stripped-down version of the current statistics.
• Allows tracking of call completion statuses and pause codes, so you can run statistics on the result of your CC activity and on the time
used by your agents, keeping track of their ACD and non-ACD time.
• Allows grading of ongoing and historical calls by a QA team, and will produce QA reports by agent on an user-selectable number of
metrics.
To meet these goals, QueueMetrics processes a file called queue_log, i.e. the log file where Asterisk writes signalling events on call
queues. QueueMetrics is preconfigured with the standard Asterisk installation paths so it will work out-of-the-box for most installations.
QueueMetrics is meant to be highly customizable; you can alter much of its behaviour to fine-tune it to your own needs (and display your
company’s - or your client’s - logo….).
QueueMetrics is an intranet application as is designed to be used through a web browser. There is no software to install on the client
machines. You can access it from anywhere, as long as you have the correct credentials.
QueueMetrics is meant to be free for smaller installations, that is up to two agents, covering most SOHO’s and passionate Asterisk
hackers. Larger installation can buy a licence based on the call centre size; our clients testify that the extra insight and control on your
operation that QueueMetrics makes possible is well worth its price tag!
1
Chapter 2. Installing QueueMetrics
QueueMetrics is written in Java, so it should run on any environment where a Java virtual machine is available. This means that the same
version of QueueMetrics runs fine on both Linux and Windows, with no need for a specific version.
2.1. Prerequisites: Server
The following software is needed to run QueueMetrics 14:
• Java SDK, version 1.6 or later
• A modern JSP and servlet container, like Apache Tomcat 5 or later
• MySQL version 5 or later
• Asterisk PBX, version 0.7 or later (versions 1.2 to 12 are fully supported)
All said software should be already installed and working on your machine before attempting to install QM.
QM was tested on various distributions of Linux, on Windows 2000/XP and many flavours of Unix.
If you use a RPM-based distribution (e.g. Red-Hat Linux, CentOS, Trixbox, Elastix, FreePBX) automatic installation using the yum package
manager is available.
2.2. Prerequisites: Client
QueueMetrics is a web based application, so it does not require any software to be installed on the client machine but a fairly modern web
browser.
QM is also a multi-user application, meaning that many users can use share the system at the same time; each user is identified by its
credentials and not by its physical location.
The following web browsers have been successfully tested with QM:
• MS Internet Explorer 8+
• Mozilla Firefox
• Opera
• Google Chrome
The application is tested extensively only with the latest generation of web browsers.
All versions of Mozilla seem to share a common problem when trying to access multiple user sessions from the same browser instance.
You should not therefore use Mozilla to access QM multiple times from the same browser; results might be unpredictable.
2.3. Version numbering scheme
Since January 2012, QueueMetrics uses a numbering system that is based on when a major release is built. The version is then year
plus the month of the release. So 12.01.1 is the first in the family that was released in January 2012. See how easy that is? It is also nice
because then you know exactly how old or new the version you are dealing with is.
Older versions of QueueMetrics had a "classical" numbering scheme, as per 1.2.3. There is no change on the licensing keys or anything
else from the old to the new numbering scheme.
2.4. Where to install
The most common case is to install QM on the same server running your Asterisk instance. This will be fine in most cases, but in very
heavily loaded servers running huge analyses it might be possible that QM will end up competing for RAM, CPU and disk I/O with the
Asterisk system. In this case, QM should be installed on a separate server and log files should be replicated (or MySQL storage used,
Chapter 20, Monitoring clusters with QueueMetrics ) to minimize impact on the Asterisk server.
In most cases - like mid-sized call centres up to 20 agents on line - it will usually be okay to have everything on the same production server.
It will be fine to have MySQL run on a separate server from the main QM installation.
2.5. Installing in practice
Installing QM is easy and only takes a few minutes. If you run a RPM -based Linux distribution, see below for automatic installation.
2
Installing QueueMetrics
1. Make sure your servlet container is working
2. Make sure your MySQL is working and you have the "create" grants for a new database.
3. Download the latest version of QueueMetrics from http://queuemetrics.com
4. Unpack QM in the webapp/ folder of your servlet container. The folder created will usually be named something like queuemetrics-1.7.0 rename it asneeded.
5. Download the MySQL connector and place it in WEB-INF/lib with the other Jar archives. It is important that you use the file named
mysql-connector-java-3.0.10-stable-bin.jar, that can be downloaded from http://www.mysql.com/products/connector-j/index.html Other
versions of the MySQL connector will likely work but might require some minor tweaking of parameter (The most common case is when
a version of the Connector/J greater or equal than 3.1 is in use. To solve this problem see the page http://queuemetrics.com/faq.jsp. The
current versions of QueueMetrics will handle such parameter tweaking automatically)
6. Create a database called queuemetrics in your MySQL installation and fill it with data taken from the file WEB-INF/README/
queuemetrics.sql. The process will probably be something like:
• Enter your MySQL shell as root typing:
mysql mysql
• Create the new database
CREATE DATABASE queuemetrics;
GRANT ALL PRIVILEGES ON queuemetrics.* TO 'queuemetrics'@'localhost'
IDENTIFIED BY 'javadude';
• Exit the MySQL shell
• Load the database sample with something like
mysql --user=queuemetrics
--password=javadude queuemetrics < queuemetrics_sample.sql
• Edit WEB-INF/web.xml, change the parameters of JDBC_URL to reflect your installation. The included version uses a database called
queuemetrics that is on a the same server, using a user called "queuemetrics" which password is "javadude".
• Restart your servlet container
• Point your browser to http://127.0.0.1:8080/queuemetrics
• Log in and change the default QM installation passwords.
If you encounter any problems with this setup, you should point your browser to http://127.0.0.1:8080/queuemetrics/dbtest for a JDBC
tester page.
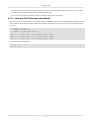
2.5.1. Installing using yum
On Linux distributions that are derived from Red Hat, it is possible to install QueueMetrics using an automated procedure using the yum
utility.
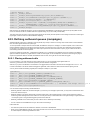
Just type the following commands:
wget -P /etc/yum.repos.d http://yum.loway.ch/loway.repo
yum install queuemetrics
The installation will start automatically and all dependencies will be handled automatically. When it finishes, there is a screen telling you to
type a command to create the database; follow the on screen instructions to create it. Within this installation, the database installation is
optional as the system will recognize that the database is missing and will begin the database installation wizard, as described in the next
chapter (Automatic database creation).
When finished, point your browser to http://127.0.0.1:8080/queuemetrics and log in using the default credentials.
The current QueueMetrics installation can always be found at /usr/local/queuemetrics/qm-current
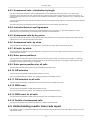
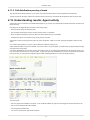
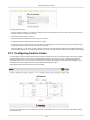
2.5.2. Automatic database creation
When you first open Queuemetrics and no database is present, the system will check a few times for an available database. This usually
takes about 10 seconds. QueueMetrics will then display a missing database error for a few seconds and will then automatically jump to the
database creation wizard.
3
Installing QueueMetrics
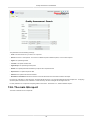
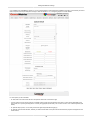
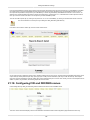
Once you select the "Create QueueMetrics Database now >>>" button, the system will take you to the next screen where you will need
to enter the "MYSQL root user" and the "MYSQL root password" details and select "Submit". These are the only editable fields within the
displayed form.
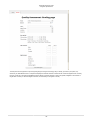
This page displays the database creation steps in real-time, showing the Status and time taken to complete each task.
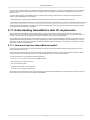
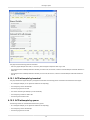
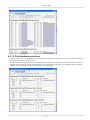
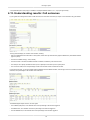
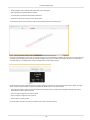
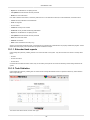
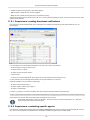
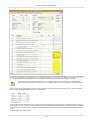
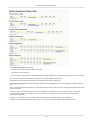
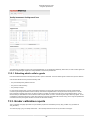
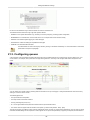
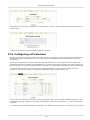
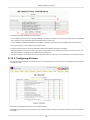
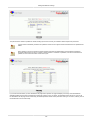
2.5.3. Using the JDBC tester page
The main source of problems when installing QueueMetrics is to correctly set-up the JDBC connection to the MySQL database. In order
to ease the installation process, there is a test page available at the URL http://127.0.0.1:8080/queumetrics/dbtest [http://127.0.0.1:8080/
queuemetrics/dbtest]
The test page will look like the following figure:
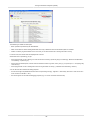
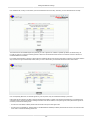
If all tests show the OK status, then you are ready to start QueueMetrics. If any test should fail, the web app will tell you the reason of the
failure and possible workarounds.
4
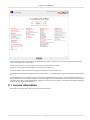
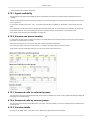
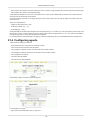
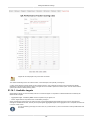
Installing QueueMetrics
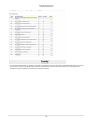
If all tests are Okay, it’s a good idea to click on the link that checks that you have the latest version of the database and updates it in case
it’s necessary.
In this case, for example, one of the tests fails:
It is very important that you restart the servlet container after tweaking with the JDBC configuration; otherwise your changes may work in
the DBTest page but might not be seen by QueueMetrics.
If you run QueueMetrics on a publicly-accessible machine, you may want to disable the DBtest utility - you can do so by setting a
configuration property. This will also inhibit showing technical data in the licence page.
2.6. Updating from a previous version of QueueMetrics
If you choose to update from a previous working version of QueueMetrics:
• Make a backup of the files web.xml and configuration.properties that are found in WEB-INF/. To be extra-safe, make a backup of the
whole working webapp and of the database being used.
• Unpack the new version of QueueMetrics
• Copy the old files web.xml and configuration.properties so your licence and preferences are preserved
• Copy the additional Jar files not distributed with QueueMetrics, e.g. the MySQL connector
• Restart the servlet container
• Run the DB tester
• From the DB tester, run the database update utility
• Once the database update utility reports a success, you’re ready to log-in to QueueMetrics
2.6.1. Automatic update using yum
If you originally installed QueueMetrics using yum, you can upgrade your system using yum as well.
• Make a backup copy of the files web.xml and configuration.properties that are found in WEB-INF/. To be extra-safe, make a backup of
the whole working webapp and of the database being used.
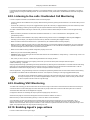
• Type the following command:
yum update queuemetrics
and follow the update process. Yum will check if a newer version is available and will install it. - Copy the old web.xml and
configuration.properties over the default ones that were installed using yum. - Restart QueueMetrics by entering:
/etc/init.d/queuemetrics restart
• Point your browser to http://127.0.0.1:8080/queumetrics/dbtest and check if the database is consistent. If there are changes that need to
be made to the old database schema, the database update utility (see below) will handle them automatically.
See also Making settings permanent when upgrading through yum Section 2.7.3, “Making settings permanent when upgrading through
yum”.
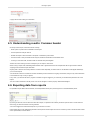
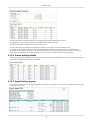
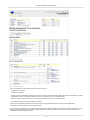
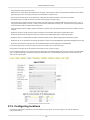
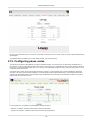
2.6.2. The database update utility
QueueMetrics ships with an utility that makes it very easy to check and upgrade an existing database to the latest version used by newer
versions QueueMetrics. Before running the update utility, make sure you have a backup of the QM database!
You can access it directly pointing your browser to http://127.0.0.1:8080/queuemetrics/dbtest/
5
Installing QueueMetrics
Once you access the DB updater, it will check and update the database and then optimize it for maximum access performance. This may
take a while if you have a lot of queue_log data loaded into it.
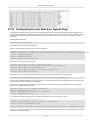
From this very page, you can also check a number of system properties through the so-called DbTest Diagnostic Tools:
• The current QueueMetrics configuration.properties settings
• The Java environment used
• The Java memory and CPU settings
• Whether the AMI connection to the Asterisk is working
• The current Asterisk configuration
• The current MySQL storage data (with search ability)
For further details, see the complete description Section 21.26, “Using the DbTest Diagnostic Tools” of the DBTEST module.
As this page lets you acces the inner configuration of QueueMetrics, it should be turned off on publicly accessed systems.
This can be obtained by setting a configuration parameter as detailed on the DBTEST page itself.
2.7. Installing a licence key
QueueMetrics ships with a limited evaluation key that lets you use the system freely with up to two agents. If you need to evaluate with a
larger call center, you will be sent a temporary key that will process as many agents as needed. The same happens when you decide to
buy the product.
The key is a single long hexadecimal sequence with minuses in the middle and looks like the following string:
012345678-0987564D-3C082EF8-012345678-0987564D-3C082EF8
The length of the key may vary according to the features needed.
Once Loway sends you the temporary or official key, you can install it either through the graphical interface or manually through a shell.
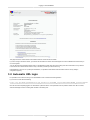
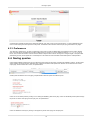
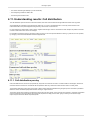
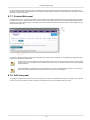
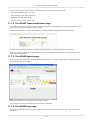
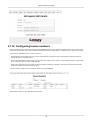
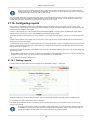
2.7.1. Installing a new key
Log on to QueueMetrics as "demoadmin" and click on the License page, if you have the correct grants you should see a label called "Install
new license key"; click on it.
6
Installing QueueMetrics
Copy the activation code you received by e-mail into the license box and press "Install". The system will restart in a few seconds (you may
see a blank page - if you do, just try and reload). Log off an on again. On the License page you should see the new key.
If you see any errors, follow the manual installation procedure detailed below.
2.7.2. Manual installation of a license key
• Locate the file WEB-INF/web.xml within the QM webapp
• Edit the file with a text editor
• Locate the section with the licence, looking like
<init-param>
<param-name>LICENZA_ARCHITETTURA</param-name>
<param-value>...........</param-value>
</init-param>
Insert your licence key within the param-value tag, all on one line, exactly as it was sent to you - Save the modified file - Restart your
servlet container - Login to QM as usual using your browser - Click on the "Licence" label to see your current licence.
2.7.3. Making settings permanent when upgrading through yum
Instead of updating properties in the web.xml file, it is possible to edit the tpf.proprerties file by uncommenting the properties you need to
change - the one you will likely change are LICENZA_ARCHITETTURA and JDBC_URL. The values defined in tpf.properties basically
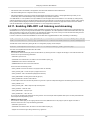
override the servlet properties with the same name.
LICENZA_ARCHITETTURA=1234-5678-........
#START_TRANSACTION=qm_start
#JDBC_DRIVER=com.mysql.jdbc.Driver
JDBC_URL=jdbc:mysql://localhost/......
#SMTP_HOST=my.host
#SMTP_AUTH=true
#SMTP_USER=xxxx
#SMTP_PASSWORD=xxxxx
When installing using yum, the tpf.properties file is automaticaly copied from the current version to the new one, without the need to do this
manually. We anyway suggest that you make a backup of your existing configuration and database before upgrading, just to be on the safe
side.
If you use the tpf.properties file, you can safely ignore editing the web.xml file.
2.7.4. License expiration notification
QueueMetrics will notify users on the Home Page when the license is about to expire; this helps preventing downtime in case a license
actually expires without renewal.
7
Installing QueueMetrics
It is possible to turn off this additional notification by setting a configuration property.
2.8. Setting session timeout
The default session timeout value for QueueMetrics is 30 minutes. This means that if the application is left idle for more than 30 minutes by
a user, the resources associated with the user session are reclaimed and the user session expires. If the user tries to continue, he will have
to log on again.
It is possible to change the inactivity period that will result in a session timeout by changing the session-timeout parameter in web.xml,
expressed in number of minutes:
<session-config>
<session-timeout>30</session-timeout>
</session-config>
If changing this parameter, it is important to keep in mind that real-world users will only seldom use the "Log off" button and will usually rely
on closing the browser window when they terminate using QueueMetrics. As the amount of data stored in memory by QueueMetrics can be
quite large (runs of tens or hundreds of thousand calls are quite common) they will be using up RAM until the session times out.
2.9. Understanding basic security mechanisms
Each user accessing QM should have his own user and password. The administrator can easily setup multiple accounts from the
administrative interface. All user activity is tagged to the user performing it, so it’s a good idea to give an account to each person accessing
the system. Accounts can be created, blocked and revoked in a matter of minutes.
Each feature that QM offers is enabled by a special key, as if there was a padlock protecting it from unauthorized access. The
administrator gives each user a key ring that specifies which locks the user can open, and therefore what the user can do. A list of keys
used in QM is available in Appendix B, Security keys.
To ease the burden of administering multiple users, keys can be grouped into classes. Each class offers the additional advantage of giving
the key ring a label, so that it’s easier to see whether an user is an Administrator, a User or an Agent by looking at the label and not at the
very keys s/he holds.
Individual keys can be granted or revoked individually to handle special cases, in addition to the ones anyway present in the user’s class.
For more information, see Chapter 21, Editing QueueMetrics settings.
A list of default users provided with the standard QM installation and their default passwords can be found in Appendix A, Default users.
Just to be on the safe side, QueueMetrics keeps an Audit Log of all activities that may have security implications; see The Audit log
Section 21.27, “System audit log inspector” for more details.
2.10. Understanding QueueMetrics memory requirements
To understand QueueMetrics' memory needs, you must consider that the memory requirements are roughly proportional to the width of
the analysis and to the number of required events to track. You may think of it as the number of calls plus the number of agent events, i.e.
agents logging on and off and setting pauses on and off.
Calls can be restricted by the queue filter, but all agent events in the required time window are tracked. This gives you an idea of the
memory usage.
Though the actual memory requirements depend considerably on the actual content of your analysis and the exact brand and version of
Java virtual machine that you are running, you should expect to be possible to track circa 80,000 calls and 40,000 agent events with a
standard 64 megabyte Sun Java VM and Tomcat running.
You can of course start your servlet container with more memory in order to allow more room for larger analyses. The standard way in
Tomcat is to pass additional Java parameters is to store them in the environment variable JAVA_OPTS before starting Tomcat.
Typing:
JAVA_OPTS="-Xms256M -Xmx512M -server"
export JAVA_OPTS
And then starting Tomcat will start up a Java virtual machine that has 256 megabytes of available memory and can use up to 512
megabytes, and runs in server mode. Consider that this memory is shared between all QueueMetrics users and all Java web-apps, so the
more the better.
Consider also that Java will never return this memory to the system free memory pool, even when it stops using it. The only way to have
this memory returned to the system memory pool is to stop the Java VM and restart it. Therefore, it’s a good idea to perform a scheduled
restart of the servlet container, to avoid possible memory leaks and to reclaim now-unused memory to the main pool.
8
Installing QueueMetrics
As a last note, the memory footprint of a Java VM may be quite larger than the memory you give it as Java heap space, as it will need RAM
space for the VM itself and all its required libraries. Overheads of 50-100 megabytes are not unheard of, depending on the Java Virtual
Machine in use.
A more in-depth discussion of QueueMetrics memory usage and live monitoring can be found on the "Advanced Configuration Manual",
chapter "Tuning QueueMetrics memory settings".
A real-life example for a large call-center with about 400 agents logged on and running on a dedicated server may be like:
-Xms4096M -Xmx4096M -server -XX:+UseParallelGC -XX:PermSize=512M -XX:MaxPermSize=512M
But the actual optimal configuration on a large system should be determined by running the system for a while under the required workload
and monitoring the actual resource consumption.
2.11. Understanding QueueMetrics disk I/O requirements
Disk I/O required by QueueMetrics is directly proportional to the queue_log size as it is read from scratch every time you ask for a full
analysis. Even if you only care about what happened yesterday between 3 and 4 PM, your 50-megabyte queue_log will be read entirely. As
the queue_log usually don’t get too large even in the largest installations, this is usually a feasible strategy.
The big advantage of using MySQL as a storage medium is that the queue_log rows are indexed when importing, so only relevant rows are
extracted and transferred to QueueMetrics. This should speed things up a bit for the largest installations. Also with MySQL you can put the
database on an entirely different server in order to avoid disk I/O problems with the local system running Asterisk - see Chapter 19, Storing
queue data on MySQL for complete details.
2.11.1. How much load can QueueMetrics handle?
In order to test if our product behaves correctly under load, we routinely do a stress test of QM simulating 20 users who keep on running
reports and real-time monitoring.
We consider the test passed and the product worth releasing if QueueMetrics can handle over one million continuous transactions with no
memory problems - they are usually far more than any user will likely do, and with a very constrained VM size.
The stress test that QM 1.4 passed had the following parameters:
• Sun Java 1.4.2_04 running in server mode with 256Mb fixed heap
• SQL storage using connector version 3.10
• 20 concurrent reporting users
• Simulated CC with nearly 1,500 calls per day
• No errors on over 2,000,000 transactions run
QM will easily scale upwards giving it more Java heap space to accommodate larger datasets. Call centres with over 400 agents online and
50,000 calls per day are not an uncommon target for QueueMetrics.
9
Chapter 3. Logging on to QueueMetrics
To log on to QueueMetrics, you have to point your browser to the address of the server where you installed QM. As servlet containers are
often installed on ports different than the standard HTTP one, it might be necessary to specify the port address.
For example, if you install Tomcat 5 on the same server you’re accessing QM from, you may end up pointing your browser to: http://
localhost:8080/queuemetrics.
Ask your system administrator for the correct web address of your instance of QueueMetrics.
If all goes well, you will see a page like the following one:
This and the following screenshots are taken using Opera 8 on Windows; other environments may present minor discrepancies from what
is shown here.
If your system administrator has already configured QM, you might see you firm’s logo on the top left part of the screen and a different
welcome message.
To enter the system as a user, enter the standard credentials demouser with password demo and click on the "Log in" button, or use the
credentials your administrator has provided.
If you prefer to use a different language from the default English, you can choose one of the other supported languages from the drop-down
box. After choosing the language, the main page will be reloaded.
10
Logging on to QueueMetrics
The user is presented with the Home Page, that is the starting point of QM. The name of the user and the current class for the user are
shown on the top-right corner of the window.
To end the current session, you have to press the "Log off" icon or close the browser window.
To print the current page in a printer-friendly format, you just press the "Print" icon.
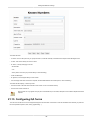
To see more details on the current user and change its access password, click on the "Info" icon.
To reset queue search parameter (time period, offset, multi-stint mode…) to the defaults without logging off and on again, press the Reload
icon.
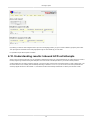
As of QueueMetrics 12.10 it is possible to view the configuration.properties file from the Home page. This is achieved by adding the key
EDIT_CFG to the admin user, which will enable a link on the Home page, within the Administrative Tools, that will allow access to the file. It
is possible to edit it either in unstructured format (as a text file), or for the most common options, a GUI interface is available as explained in
Section 21.24, “Configuring system preferences” .
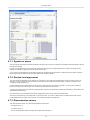
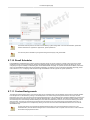
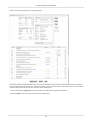
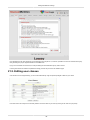
3.1. License information
Pressing the "Licence information" label, a page like the one below is shown.
11
Logging on to QueueMetrics
This page shows the current release of the software and the current license information.
If you are running a free demo version, you will see that the maximum number of licensed agents is 2 and an additional text will remind you
on how to register.
You can also see some information being shown on the Operating System and Java version being used. Such information is very useful to
in the case of errors and should be sent to Loway in the case you think you have found a bug.
If QueueMetrics is to be run on a publicly-accessible box, it is possible to hide all technical information from the user by setting a
configuration property.
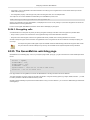
3.2. Automatic URL login
It is possible to use a direct link to log in into QueueMetrics from an external browser application.
If you click on an URL like the following:
http://my.qm:8080/queuemetrics/qm_autentica.do?AUTH_logon=demoadmin&AUTH_password=demo
then the user will be implicitly logged in as "demoadmin" password "demo". Auth parameters can be passed in either HTTP GET or POST,
with the advantage of POST of making them invisible to the calling user.
12
Chapter 4. Running a report
To successfully run a report, your system administrator must have configured the correct queues in use on your system. You will find them
in the drop-down menu on top of the page. See Section 21.3, “Configuring queues” for details on how to do it.
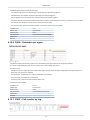
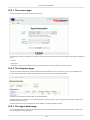
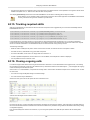
4.1. Quick activity reports
The quickest way to obtain an analysis is by selecting the queue and the report you want to analyze and then click on the appropriate time
frame below the "Quick activity reports" title on the home page.
The defined time frames are the following:
• Today, Yesterday, The day before yesterday The day in question, starting from midnight to midnight
• Last day, Last 7 days, Last 30 days, Last 90 days The exact time period, starting from the current hour backwards.
QueueMetrics implements an extended dropdown that allows easy access to queues and reports. Extended options could
be reached clicking on the magnifier glass located on the right side of the dropdown.
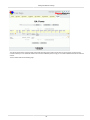
The system will then show the "Answered calls" page, like here below.
On top of the page, you can see a multi-tab menu; by clicking on it you can select which part of the report you are going to see. To go back
to the home page, click on the "Home" tab. You can also see all the analyses at once by clicking on the "All" label (this is mostly useful
when printing the results to paper).
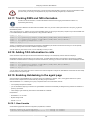
4.2. Agent report
If the user has the appropriate grants, s/he can restrict the analysis to a single agent. This way one can see exactly what one agent did.
To use this feature, select the agent you want to filter by and click on the desired time period in the "Agent report" section of the Home
Page.
If you are running an agent-restricted report, you should know that:
• For inbound traffic, no calls are shown in the "Lost calls" page. This is because an inbound call that has been lost has never been
connected to any agent, so there is no way to attribute them to one single agent.
• All outbound calls placed by the agent (answered or not) are shown
13
Running a report
• Agent statistics are shown only for the given agent
• As always, activity is restricted by queue - no activity but the one happening on selected queues is shown.
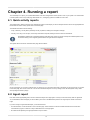
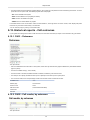
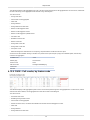
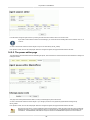
4.3. Custom reports
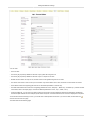
Custom reports are available by clicking on "Run custom report" from the Home Page.
A new menu will appear, asking for custom report parameters:
The meaning is as follows:
• Queue is the queue or composite queue you want to analyze;
• Call filtering criteria can be specified by clicking on the title to open it (see below);
• Start and end date let you select the period you want to analyze, with five-minute resolution or, optionally
• Time period a fixed time period in the past you want to analyze.
• File is the queue_log file you want to analyze. You may want to change it to run reports on a different Asterisk server or on an older
archived version of your queue_log. If you run QM on the same machine as Asterisk, the file name should be already correct. Make
sure the file is readable to your servlet container. If you use MySQL storage or clusters, the file will look something like "sql:P001" or
"cluster:*"
• Time zone offset is to be set if the Asterisk server that created the queue_log file was in a different time zone from the one you are using.
• Join multi-stint calls lets you join together the pieces of the same call if it has been processed by more than one Asterisk queue (see
Chapter 15, Multi-stint calls ).
14
Running a report
By clicking on the "Run custom report" button, you can run the analysis, which output is the same as the "Quick activity report" and will be
explained below.
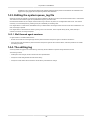
4.3.1. Call search criteria
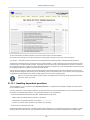
A number of criteria can be specified to better zoom in on a given set of calls.
• Agent is a specific agent code
• Location is a given location
• Supervision lets you search only for agents that have the current user as their supervisor
• Outcome lets you select a call outcome
• Call features lets you select a call feature code
• Call tags lets you filter by call tag
• Variables lets you filter by a generic variable associated to a call
• Asterisk call-id search by substring on the Asterisk’s UniqueID of the call
• Caller search by substring on the Caller-ID
• Wait duration lets you specify the call waiting duration
• Call duration lets you specify a minimum and maximum for the call duration
• Disconnection cause lets you pick a disconnenction reason for the call
• Enter position lets you enter a minimum and maximum enter position (note: this is not tracked for every call)
• Number of attempts lets you select a given number of attempts
• DNIS lets you select calls that have a specific DNIS (if tracked)
• IVR choice lets you select calls that have a specific IVR choice (if tracked)
• Server for clustered systems, lets you select only calls that were processed on a given server
• Non-contiguous reports let you choose the day(s) of the week and the time periods that you want to include in the reports.
Note that:
• Criteria involving a full-text search (e.g. Caller) can optionally support full Regular Expressions; if they start by "^" they will be processed
as Regular Expressions. E.g. entering "^\d+$" means "find all fields which value is made up only of numeric characters, having at least
one character".
• Criteria involving a time-range require you to enter both time values as HH:MM:SS or HH:MM. Invalid values cause the time-range to be
ignored.
• Criteria involving an integer range can optionally be left blank; leaving the miminum value blank is the same as entering "0", while leaving
the maximum value blank equals to "any number".
• Invalid criteria are discared and are not used as rectriction. The list of applied criteria is shown on the "Common header" that is available
on every page.
• If multiple criteria are input at the same time, they are AND-ed together - that is only calls that suit all given criteria will be shown.
• Running criteria with multi-stint calls may or may not lead to the results you are expecting. See Chapter 15, Multi-stint calls for more
information on this issue.
Search criteria are ignored for real-time reports.
When a report is run with criteria set, all statistics are computed "as if" those were the only calls available; so e.g. agent sessions may yeld
different results from what you would get with no criteria.
4.3.2. Persistent user properties
Per-user persistence settings allow user search configuration to be stored and kept even after log off and can be changed and re-stored at
any stage.
15
Running a report
Custom Reports maintain the latest query parameters entered, even when a user logs off and logs back in, in order to facilitate the workflow of a user requiring the same reports on a daily basis. The Refresh button allows to clear the input query parameters at any stage.
4.3.3. Preferences
The value set in default.hourly_slot acts as a default for a drop down box that is available within the Preferences of the Custom Reports
page. User that edit this value basically override the default and can change it to a set of predefined durations: 1, 2, 3, 5, 10, 15, 20, 30,
60, 90, 120, 240 and 480 minutes. Once this value is edited, it stays the same until the user logs off or changes it again. This option adds
persistence (per user) to the options set in Custom Reports. This makes the user-accessible customisation options of QM persistent.
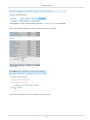
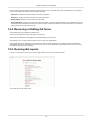
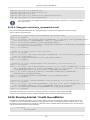
4.4. Saving queries
Users holding SQUERY_ADD security keys are allowed to save queries for later usage. If holding also SQUERY_FORALL, saved queries
will be visible for all users if required, otherwise query visibility is restricted to that specific user. Queries can be saved from the custom
report page, where a bottom line is shown, as reported below.
Saved queries are listed on the home page, grouped between historical reports and realtime reports.
Users can run the saved queries by clicking on it. If holding the SQUERY_ADD security keys, users can edit already saved queries through
the pencil icon shown when flying over the query link, as reported below:
Users can delete their own keys by clicking on the proper key shown when flying over the query link:
16
Running a report
A popup will be shown asking for confirmation
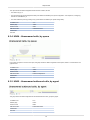
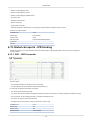
4.5. Understanding results: Common header
On the top of each report, a box will be shown showing:
• Which queue or queues were considered for the analysis
• The time period the analysis refers to
• Whether the report is about the whole of the queue or is filtered by some criteria
• The total number of calls processed for this analysis, divided into answered and unanswered ones.
• If running in multi-stint mode, the total number of calls that were joined together
There is also a box showing a number of analyses you can export in CSV format.
When running in report mode, QM distinguishes between calls or agent sessions that are complete and calls or agent sessions that are
"ongoing" at the moment the report was taken.
Ongoing calls or sessions are usually marked in red and counted separately, as data for them is not definitive and will appear differently if
you run further reports.
You should also note that a call that has not been answered yet will be counted as "Ongoing unanswered", though it may well be answered
in the nearest future by one of your agents.
In any case, if you need to see calls in progress or whether an agent is logged in, you should rely on the Real-time panels and not on the
reports.
TIP: The number of decimals is usually set to 1 but can be changed to 2 via the property: default.decimalDigits=1
4.6. Exporting data from reports
It is possible to export data in Microsoft Excel, Comma-Separated Values (CSV) or XML right from most QueueMetrics panels.
By clicking on the Excel, CSV or XML icons below each report, it is possible to save exactly the same report as seen on screen and then
edit it using your favourite number-crunching software.
You must be logged in to download the reports, as you see them on screen.
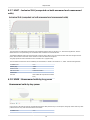
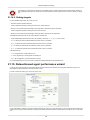
Users holding the key USR_REPORTS_EXPORT could export the whole analysis to a PDF or XLS files by mean of the two buttons located
on the report header, as shown below:
17
Running a report
If you are looking for an automatic way to export a full analysis to one file, you should probably have a look at Chapter 18, Automating
statistics download: the ROBOT profile.
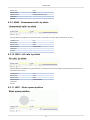
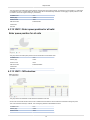
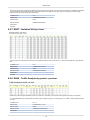
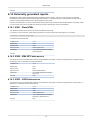
4.7. Understanding results: Answered calls
The answered calls section deals with calls that were correctly handled by agents.
The top panel shows:
• How many calls were handled;
• The average call length (i.e. time the caller spends talking to an operator);
• The maximum and minimum call lengths recorded for the given time period;
• The total call length (for all calls on all operators);
• The average call waiting time (i.e. the time a caller was waiting on a queue before being connected to an operator).
• The minimum and maximum call waiting times on record
• The total waiting time for all handled calls.
• The average initial position of the call in the queue
• The minimum and maximum initial queue positions that have been detected
• The queue position coverage: as this information is not tracked for all calls, this ratio shows the average number of calls that had queue
position record.
You can see that the information above is reported twice: on the left for all calls, including incomplete ones, and on the right for complete
calls only, i.e. excluding calls that were started before or terminated after the given time frame.
18
Running a report
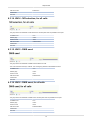
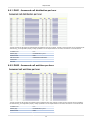
4.7.1. Agents on queue
This report shows which agents have been available for the given queue, how many calls each one handled and the percentage of all calls
that each one handled.
If calls are connected directly to a phone terminal, QM tries its best to show the corresponding terminal, usually in the format used by
Asterisk, like "SIP/303" to signify a SIP phone whose number is 303.
If you connect to H.323 telephones via the OH323 module, the recorded channel names have no meaning and do not refer to a specific
terminal; that’s why all OH323 calls are grouped together under the label "OH323/-".
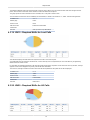
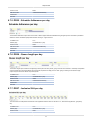
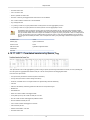
4.7.2. Service level agreement
This report shows the distribution of call waiting times. It shows how many calls were answered within a given time frame, usually 120
seconds in 10 second increments (the time frame and increment can be modified by the administrator, if needed - see Section 21.24,
“Configuring system preferences” ).
It is also possible to have two time frames in order to have a higher granularity for shorter time periods - e.g. having SLA computed in
intervals of 5 seconds up to 20 seconds, and in intervals of 10 seconds up to 120 seconds.
You get a percentage of how many calls were answered within X seconds; the percentage includes calls answered in a shorter time frame
and therefore grows with time.
The "delta" value you see is the absolute increment, expressed in number of calls, between each time frame.
This metric is computed only on answered calls, i.e. ignoring lost calls . If your SLA is defined in terms of taken and lost calls, see the
corresponding metrics "Inclusive SLA" on Section 4.8.4, “Inclusive Service Level Agreement”.
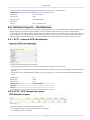
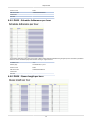
4.7.3. Disconnection causes
This report shows the reason why calls were terminated; this means that:
• The agent hung up, or
• The caller hung up, or
• The call was transferred outside the queue and the agent was freed again, or
19
Running a report
• The call was ongoing at the time the report was run.
4.7.4. Transfers
This graph shows how many calls were transferred to each extension in the given time frame. This lets you know who is handling exception
calls.
when a call is transferred outside the queue system, its length is no more recorded by the queue subsystem; therefore you
only get to see the length of the call while the agent was on line.
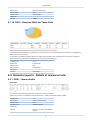
4.7.5. Answered calls by queue
If more than one queue is in use for the report, this graph shows the relative magnitude of each queue.
Inbound queues are marked with the symbol
while outbound queues use the symbol
.
4.7.6. Answered calls by direction
If more than one queue is in use for the report, this graph shows the relative magnitude of inbound versus outbound calls made.
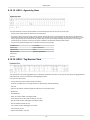
4.7.7. Answered calls, by stints
This graph counts the distribution of multi-stint calls on selected queues. If multi-stint mode is not enable, all calls will have only one stint.
4.7.8. Queue position
This graph shows the initial queue position that the calls had when they joined the queue. For example, a queue position of 1 means that
a call was first in line, of 5 means that a call had four other calls in line before being answered. As the logging of queue positions is a bit
inconsistent, some calls might be missing it ("Untracked")
4.7.9. IVR selection
This graph shows the distribution of IVR selections available in the calls processed.
This must be tracked manually in Asterisk - See "Configuring Asterisk for QueueMetrics" below.
4.7.10. DNIS used
This graph shows the distribution of DNIS lines available in the calls processed.
This must be tracked manually in Asterisk - See "Configuring Asterisk for QueueMetrics" below.
4.7.11. Detail of answered calls
This page shows the detail of answered calls. See Chapter 5, Showing call details.
4.8. Understanding results: Unanswered calls
Unanswered calls are calls that were lost, i.e. the caller could not connect to an agent. This usually means that either the caller hung up,
fed up with waiting, or the queue system decided to discharge the caller, maybe sending him to voicemail or another queue.
20
Running a report
if you run a report with an agent filter, or a supervisor filter, or a location filter, the number of lost calls in the report is usually
zero, showing just outgoing calls, if any. This is because the agent is specified only for taken calls and not lost ones, so not
deleting them all would show, e.g., the taken call data for one single agent and the lost calls for all of the queue. You can
override this behaviour through a configuration switch if you feel this is not correct for you.
The Unanswered calls page looks like the following picture:
The report shows:
• How many calls were lost;
• The average waiting time before disconnection;
• The average queue position at disconnection (i.e. how many calls the queue had to dispatch before connecting the caller to an operator).
• The minimum and maximum wait times
• The minimum and maximum queue position at disconnect.
• The average, minimum and maximum initial queue position, and the coverage given for this computation
As with answered calls, this report is computed twice; the version on the left is for all calls monitored, while the version on the right only
holds data for calls that were complete at the moment the analysis was run.
4.8.1. Disconnection causes
This report shows the relative magnitude of disconnection causes, that are:
• The caller hung up, or
• The queue timed out and discharged the caller (if this feature is enabled by the queue configuration - see Chapter 24, Configuring
Asterisk for QueueMetrics), or
• The caller exited the queue by pressing a key (if this feature is enabled by the queue configuration).
4.8.2. Unanswered calls, by queue
If more than one queue is in use for the report, this graph shows the relative magnitude of each queue.
21
Running a report
4.8.3. Unanswered calls - distribution by length
This report is functionally equivalent to "Service level agreement" in the Answered calls section (see Section 4.7.2, “Service level
agreement”), but is computed on lost calls. It shows how many calls were hung up within a given time frame, usually 120 seconds in 10
second increments (the time frame and increment can be modified by the administrator, if needed - see Section 21.24, “Configuring system
preferences”).
You get a percentage of how many calls were lost within X seconds; the percentage includes calls lost in a shorter time frame and therefore
grows with time.
The "delta" value you see is the absolute increment, expressed in number of calls, between each time frame.
4.8.4. Inclusive Service Level Agreement
The inclusive SLA corresponds to the Service Level Agreement metrics shown on Section 4.7.2, “Service level agreement”, with the
difference that it is computed taking into consideration both answered and unanswered calls.
4.8.5. Unanswered calls by key press
If there are any calls that are were set unanswered because the caller pressed a key to exit the queue, this graph shows which keys were
pressed and how many calls were terminated for that reason.
4.8.6. Unanswered calls, by stints
This graph tells the stint distribution of unanswered calls. It corresponds to the graph called "Answered calls, by stints".
4.8.7. All calls, by stints
This graph tells the stint distribution of all processed calls. It corresponds to the sum of the graphs called "Answered calls, by stints" and
"Unanswered calls, by stints"
4.8.8. Enter queue positions
This graph shows the initial queue position that the calls had when they joined the queue. For example, a queue position of 1 means that
a call was first in line, of 5 means that a call had four other calls in line before being answered. As the logging of queue positions is a bit
inconsistent, some calls might be missing it ("Untracked")
4.8.9. Enter queue positions for all calls
This graph shows the initial queue positions for both answered and unanswered calls.
4.8.10. IVR selection
This graph shows the distribution of IVR selections available for lost calls.
This must be tracked manually in Asterisk - See "Configuring Asterisk for QueueMetrics" below.
4.8.11. IVR selection for all calls
This graph shows the distribution of IVR selections for all calls (taken and lost) available in the report.
4.8.12. DNIS used
This graph shows the distribution of DNIS lines that lead to lost calls.
This must be tracked manually in Asterisk - See "Configuring Asterisk for QueueMetrics" below.
4.8.13. DNIS used, for all calls
This graph shows the distribution of DNIS lines for all calls (taken and lost) available in the report.
4.8.14. Details of unanswered calls
This page shows full details of unanswered calls Section 5.3, “Detail of unanswered calls”.
4.9. Understanding results: Area code report
If the Caller*ID is present, it is possible to break down both answered and unanswered calls to specific area codes by clicking on the "Area
code analysis" button.
22
Running a report
By selecting a number of caller id digits to search upon and a starting digit position, you get a number of statistics grouped by area codes.
This report gives an immediate check of the geographical origin of calls handled by your call center.
It is possible to export all the reports as needed.
4.10. Understanding results: Inbound ACD call attempts
When running an inbound call center, it is very important to determine the reason why a call is delayed: are your clients refusing to answer?
Did they forget to log off before leaving their workplace? The inbound ACD call attempts metrics try to answer to these questions.
As these metrics are not usually recorded by Asterisk, you’ll have to patch and recompile your Asterisk system in order to gather them - see
the section Section 24.6, “Enabling ACD call attempts recording on Asterisk 1.0 and 1.2”. If you do not do so, the metrics presented here
will always appear zeroed out. With Asterisk 1.4, this feature should be automatically enabled with no need to patch the source code.
23
Running a report
This page shows the following pieces of information:
• How many agent attempts were made, i.e. how many times the agent’s telephones were rung in total
• The average number of attempts that were necessary for a taken call; the minimum, maximum and total attempts made that resulted in a
taken call
• The average number of attempts that were necessary for a lost call; the minimum, maximum and total attempts made that resulted in a
lost call
4.10.1. ACD attempts by terminal
This graph breaks down agent attempts by the agent that was called. The following pieces of information are extracted for each agent:
• N. of lost agent attempts (i.e. the agent was called but not responding)
• The average ring time for lost attempts
• The total ringing time for lost calls
• The number of taken agent attempts (i.e. calls answered)
• The average ring duration for taken calls
• The total ring time for taken calls
4.10.2. ACD attempts by queue
The following metrics are extracted and broken down by queue:
• N. of lost agent attempts (i.e. the agent was called but not responding)
• The average ring time for lost attempts
• The total ringing time for lost calls
24
Running a report
• The number of taken agent attempts (i.e. calls answered)
• The average ring duration for taken calls
• The total ring time for taken calls
4.11. Understanding results: Call distribution
The call distribution report shows when calls were handled, when calls were lost and the average wait times broken down by period.
All percentages are calculated on the call class they belong to, i.e. a 50% of "Unanswered calls" on one day means that 50% of all
unanswered calls for the period happened during that day, not that 50% of calls were lost.
For each metrics, the total number of calls is shown, together with average, minimum and maximum times. Graphs are plotted on the total
number of calls broken down and on the averages.
It is possible to change the interval in the Hourly graphs, so that you can have reports break down calls e.g. by half-hours or hour quarters,
by changing a value in the QueueMetrics master configuration file.
4.11.1. Call distribution per day
Calls, both taken and lost, are shown per specific day. Days with no events are not shown. The total numbers of call lengths, wait time for
answered calls and wait time for unanswered calls are plotted for each day. Sales and contacts are also shown on a daily basis.
The Schedule Adherence report shows the number of distinct agents that were detected during the given period. This makes it possible to
detect the number of different people that had been working on a given moment.
The Queue Length report shows the average length of the queue for each period, giving minimums and maximums. The Steps computation
shows how fast each queue progresses during the period, expresses in steps per hour. Note: giving a meaning to the Queue Length
reports may be hard in the case of composite queues.
25
Running a report
4.11.2. Call distribution per hour
Events are shown on a 24-hour distribution. If this graph appears to be incorrect, you have to run a "Custom report" setting the time zone
accordingly (see Section 4.3, “Custom reports”).
The total numbers of call lengths, wait time for answered calls and wait time for unanswered calls, together with sales and contacts, are
plotted for each hourly interval. The size of hourly intervals can be controlled by the default.hourly_slot configuration property, making it
possible to run this reports based on 30-minute, 20-minute or 15-minute intervals.
26
Running a report
4.11.3. Call distribution per day of week
This report shows the weekly behaviour of your queues. The longer the analysis period, the more significant its results will be.
The total numbers of call lengths, wait time for answered calls and wait time for unanswered calls are plotted for each day of the week.
4.12. Understanding results: Agent activity
Agent activity refers to the behaviour of Asterisk defined agents. If you connect you queues straight to telephone terminals, this section will
always be empty.
Each agent may be flagged as being a member of four priority groups:
• Main: the agents usually answering the queue
• Spill: the agents answering the queue if all "Main" agents are busy or unavailable
• Wrap: the agents answering the queue if all "Main" and "Spill" agents are busy or unavailable
• Undefined: this agent is not a member of any priority group for this queue
This feature is useful if priority groups are used in the queue configuration. If they are not used, just assign all agents to "Main" for each
queue.
If an unknown agent appears on a queue, it will be marked as "Undefined", written in red.
Agent names are written in blue and are clickable, if you click on them in any of the graphs, you will be lead to a popup that detail the logon
and pause history for that agent.
As a default, QueueMetrics will show and count an agent session if and only if the agent handled at least one call during this session. This
may not be what you want when you use pause codes - an agent may log on and immediately go on pause to do some back-end activities.
If this is the case, you should set the configuration option default.useRawAgentSessions to true to see all agent sessions.
The report shows:
• How many agents were available for the queue. To be considered available, an agent must have logged in and taken at least one call.
• How much time all agents have been available
• The average agent available time
• The minimum and maximum agent session durations
27
Running a report
• The total billable and not billable pause times
4.12.1. Agent availability
This graph shows which agents were available during the specified time frame and the percentage of agents' available time each one
cumulated.
This time is calculated per all queues any agent is a member of, as the act of logging on is in general for the whole system and not specific
to one single queue.
For each agent, the total time on pause - if any - is computed and broken down as "Billable" or "Not billable" - see the section on Pause
Codes.
The "overlapping" is the amount of time that an agent was paused BUT taking calls. As you can pause in the middle of a call (maybe your
system doesn’t allow this, but it is conceivable) you could have a period where you are paused BUT on conversation as well.
The % written next to the graph is the percentage of the pause time.
4.12.2. Session and pause duration
For each agent, the total number of sessions and pauses is computed (session time is already deducted of pause time). For both sessions
and pauses, an average length is computed.
The "Pause percentage" is how much time an agent was on pause compared to available time.
The "Pauses per session" computes how many pauses - on average - each agent makes for each log-in session.
These metrics should be considered according to your call center rules on pauses and time-out.
4.12.3. Answered calls for selected queues
This graph shows who of your agents answered calls for the queues you selected. The number of calls, together with total and average call
durations are computed accordingly.
4.12.4. Answered calls by service groups
This graph show which priority levels handled calls for your queue. This shows whether your main line is staffed enough to handle the load
of incoming calls.
4.12.5. Session details
By clicking on the "Detail" button, a new page is shown, detailing each agent session that was recorded.
28
Running a report
For each agent session, the start and end times are recorded, together with the total duration in seconds.
If the agent logs on via the call back function, the designated call back extension is shown.
The number of pauses and the total pause time in seconds is shown.
The "Srv" column tells you on which server an agent was working in case you set up a cluster of Asterisk servers.
It is possible to sort the table for each title, in either descending and ascending order. To do this, click once on the desired title for
descending sort, and twice for ascending sort. Once the table is sorted, an arrow symbol will appear close to the title, so you know on
which column it was sorted last. As the sorting is done on the client machine, it may take a while with very large tables.
4.12.6. Pause activity details
This table shows the specific pauses that each agent took and the pause code that was entered for each pause. It also shows whether the
pause taken was considered to be billable or non-billable.
4.12.7. Agent history popup
If you click on an agent’s name, a new popup will appear with full history for that agent. You can scroll in it as needed by using arrow keys
or the wheel of your mouse.
29
Running a report
A complete description of the popup is available in the Report Details: Section 6.11.3, “Popup of agent activity” .
4.13. Understanding results: Call outcomes
If your agents are entering Pause codes or Call outcomes, the "Outcomes" tab will let you report on the information they just entered.
The top panel will display an overview of the situation, showing:
• How much billable time there has been on this system, broken down by ACD/call time ("agent available time") and billable activities
(agent on pause)
• The total non billable time (e.g. lunch, breaks)
• The total number of Contacts, Qualified Contacts and Sales, as defined by call outcome codes
• The Sales per Hour (SPH), Qualified Contacts per hour (QCPH) and Contacts per Hour (CPH) ratios
• The Conversion index, that is the percentage of sales over the total number of sales and contacts.
Further down the page, you can find details explaining Billable and Non-billable activities, with average, minimum and maximum session
durations, and a percentage on all activities of the same kind.
The Detailed Agent Report will show, for each agent:
• The Available (ACD) time, as an absolute value and a percentage of its total time logged on
• The Billable time, as an absolute value and a percentage of its total time logged on
• The Non-Billable time, as an absolute value and a percentage of its total time logged on
30
Running a report
• The number of Sales And Contacts the agent had (if a sale is counted a s both a Sale and a Contact, it’s counted only once as a Sale)
• The Sales per Hour (SPH) and Contacts per Hour (CPH) ratios for this agent
• The Conversion ratio, that is the percentage of sales over the total number of sales and contacts.
4.13.1. How are Call Outcomes calculated?
The idea is that a call can be a Contact, or a specialized contact that is a Qualified Contact, or a specialized Qualified Contact that is a Sale
This is needed because all the SPH, CPH and QCPH are calculated not on the totals of each class, but on sums of that class and generic
types, like:
S = Number of Sales
C = Number of Contacts
Q = Number of Qualified Contacts
CPH = C / (logon time - not billable pause time)
QCPH = Q / (logon time - not billable pause time)
SPH = S / (logon time - not billable pause time)
Conversion indexes are calculated as:
CO% = S / C
QC% = S / Q
31
Chapter 5. Showing call details
As shown above, QM lets you see the very detail of calls handled by Asterisk.
5.1. Detail of answered calls
For each answered call, the following information is shown:
• Date and time for the call;
• The Caller-ID, if available (the Caller-ID format may differ according to your local Telco - in some countries it include the full name of the
caller, in others it might be a number and in others it may be unavailable at all);
• The queue that handled the call;
• The total waiting time before the agent was connected;
• The duration of the call, talking to an agent;
• The initial position of the call
• The cause of disconnection;
• Which agent or terminal handled the call.
• How many agent attempts were made before this call was answered
• The call completion code your agents entered
32
Showing call details
• How many stints make up this call
• The server that handled this call (in the case of clusters)
Optionally other information could be shown:
• The asterisk unique ID associated to each call
• An icon that opens a new web page with an URL user customizable (useful for proprietary CRM integrations). To enable these two
columns, the keys default.crmapp and default.showAstClid have to be correctly set. Please read Section 21.24, “Configuring system
preferences” and Appendix D, System preferences for further details.
It is possible to sort the table for each title, in either descending and ascending order. To do this, click once on the desired title for
descending sort, and twice for ascending sort. Once the table is sorted, an arrow symbol will appear close to the title, so you know on
which column it was sorted last. As the sorting is done on the client machine, it may take a while with very large tables.
If you click on the small icon on the right, it will be possible to see the details of the call, including:
• Asterisk’s internal Call-ID code
• The call date and time
• The caller-id (if any)
• The agent handling the call
• The call duration
• The wait time
• The disconnection cause
• The extension the call was transferred to
• The URL that was linked to this call through the Queue() command, if any
• The call status code
• The server that handled this call
• The sound files (one or more) that were recorded for this call (see below).
If the call is ongoing and you have the special grants to do so, a red scissor icon might appear next to the call status to allow for brute-force
call closure. See the section Section 24.16, “Closing ongoing calls” for further details.
The call may also display:
• If the call has more than one stint - that is was rebuilt through multi-stint mode - then a list of stints is visible. If a call has only one stint,
then the Stints tab is not needed and appears disabled. See Chapter 15, Multi-stint calls
• If a call has events on it - that is specific items happening at points in time that go beyond what is displayed for the main call - they are
shown in the Events tab. If not, they are disabled. The ones currently tracked are IVR traversal events, failed call connection attempts
and music-on-hold events.
• A set of markers (Note: QueueMetrics till release 14.10.4 shows "tags" instead of markers).
• A link to open the QA form(s) available for that call
5.2. Listening to answered calls
If there are audio recordings, they will be shown by the bottom of the call details page. If the call was monitored, i.e. recorded to disk, a
number of sound files may be shown. By clicking on a sound file you can listen to it straight from your browser.
You can optionally have other types of media linked to a specific call, for example chat transcripts, free text or documents. They will be
opened in the browser.
Please note that:
• The recorded file name must contain the Asterisk Call ID for QM to relate it to the call - see Section 24.3, “Listening to recorded calls
using QM” for tips on how to configure Asterisk correctly to implement this feature;
• The audio storage on the Asterisk server must be readable by the servlet container;
• You must have the correct sound codecs to listen to the sound file on your PC. WAV files usually work out of the box but are
comparatively quite big, while GSM files require an additional codec pack on most Windows machines but consume disk storage much
33
Showing call details
more efficiently. The best compromise is usually to use the WAV49 format on Asterisk, that is played natively by Windows machines but
has a compression and sound quality comparable to the GSM format. The HTML5 player requires WAV or MP3 files.
• Asterisk will usually record two different sound files - one for the caller and the other for the agent and will then mix them together at
the end of the call. If this does not happen automatically, you might find two different sound files, named "-in" and "-out", each of which
contains the voice of one of the parties. If your call is a multi-stint call, you may find a number of different sound files for it.
• It is possible to use different PMs to handle different audio needs - see Chapter 22, Listening to calls using Pluggable Modules (PM).
• If generated by Asterisk, QueueMetrics can display a variety of other file type call attachments, ie. calls that are shown with a file
extension that is not necessarily a sound file (image, video, audio, text or application files).
It is also possible to add markers in order to keep notes about "points of interest" for the call at hand, as shown in the example below:
By clicking on the Play icon next to a marker, the correct audio recording is loaded in the embedded player and it is started at the point in
time specified in the marker.
Until release 14.10.4, QueueMetrics used the name "tags" instead of "markers".
5.2.1. The HTML5 Audio Player and Markers
Since QueueMetrics 15.02, it is possible to play audio straight in the browser using an HTML5-enabled audio player.
This has many advantages:
• You can play the audio straight in the browser, jumping back and forth as needed
• You can speed-up the audio playing, in order to take less time to listen to calls
• It integrates with the Markers editor, so you can add a comment at a specific point in time and see it later. When you click on a comment,
the audio editor starts playing at that very point in time.
This is extermely powerful, and can be done either on the Call Details panel (under the Markers tab) or on the QA form.
In order for this to work, you need:
• A modern browser supporting HTML5 audio playback
• The system property 'audio.html5player' must be set to true.
• If audio files are hosted outside of QueueMetrics, your HTTP server must support Http-Range requests. QueueMetrics supports HttpRange file streaming natively.
• Files must be stored in a format that is compatible with the browser. Presenty this means that your audio files should either be saved as
WAV or MP3. GSM and WAV49 files will likely not work.
• Streaming is not supported for encoded audio recordings.
Users having the capacity of adding and removing markers should hold the keys CALLMONITOR_ADDTAGS and
CALLMONITOR_DELTAGS respectively.
34
Showing call details
The following pieces of information are tracked through the Markers page:
• System ID and Asterisk unique-id; marker author and time
• Time offset and duration (in seconds). You can leave the duration field blank. Values can be input as an integer number of seconds or as
MM:SS
• A title (max 200 characters). Newline characters are allowed.
• A color for display (this may be used to set, say, all sales in red, all issues in blue, etc).
5.3. Detail of unanswered calls
The unanswered calls detail is quite similar to that of answered calls.
The following data are shown:
• Date and time of the lost call;
• The Agent that placed the call (if it’s outbound) or blank if inbound;
• Caller-ID;
• Queue that handled the call;
35
Showing call details
• Disconnection cause;
• Position at disconnection, if available;
• Waiting time before disconnection, if available;
• The initial position of the call when it joined the queue, if available;
• The number of Agent attempts made before disconnection;
• The call code, if entered (this might be added automatically, e.g. by outbound diallers marking unsuccessful attempts as "unanswered"
versus "fax" or "voicemail")
• The key pressed on disconnection (if any)
• The number of stints this call has
• The server that handled the call
Optionally other information could be shown:
• The asterisk unique ID associated to each call
• An icon that opens a new web page with an URL user customizable (useful for proprietary CRM integrations). To enable these two
columns, the keys default.crmapp and default.showAstClid have to be correctly set. Please read Section 21.24, “Configuring system
preferences” and Appendix D, System preferences for further details.
Please note that on a queue timeout, Asterisk will not report the waiting time, as it is fixed and same as the queue timeout.
It is possible to sort the table for each column, in either descending and ascending order. To do this, click once on the desired title for
descending sort, and twice for ascending sort. Once the table is sorted, an arrow symbol will appear close to the title, so you know on
which column it was sorted last. As the sorting is done on the client machine, it may take a while with very large tables.
If the call is ongoing and you have the special grants to do so, a red scissor icon might appear next to the call status to allow for brute-force
call closure. See the section Section 24.16, “Closing ongoing calls” for further details.
5.4. Detail of IVR calls
IVR calls, that is calls that were handled without being queued, can be displayed through the pop-up linked to the Section 6.2.4, “OD04
- IVR details (paged)” data block. The contents are very similar to the information displayed for taken or lost calls, though the only
information currently tracked are call IVR events, DID and caller-id.
36
Chapter 6. Report Details
Reports can be fully configured by deciding which of the following blocks shall be included in each - see Configuring reports Section 21.16,
“Configuring reports”. The default report already includes all common blocks.
6.1. Historical reports - Answered calls
6.1.1. OK01 - All calls
The answered calls section deals with calls that were correctly handled by agents.
The top panel shows:
• How many calls were handled;
• The average call length (i.e. time the caller spends talking to an operator);
• The maximum and minimum call lengths recorded for the given time period;
• The total call length (for all calls on all operators);
• The average call waiting time (i.e. the time a caller was waiting on a queue before being connected to an operator).
• The minimum and maximum call waiting times on record
• The total waiting time for all handled calls.
• The average initial position of the call in the queue
• The minimum and maximum initial queue positions that have been detected
• The queue position coverage: as this information is not tracked for all calls, this ratio shows the average number of calls that had queue
position record.
Available since
1.6.0
Default page
Answered calls
Shortcut code
OK01
XML-RPC code
OkDO.RiassAllCalls
Parameters
-
See also
37
Report Details
6.1.2. OK02 - Calls fully within the given time interval
The answered completed calls section deals with calls that were correctly handled by agents. This is similar to what’s reported on previous
panel but may exclude calls that were started before or terminated after the given time frame.
Available since
1.6.0
Default page
Answered calls
Shortcut code
OK02
XML-RPC code
OkDO.RiassFullyWithin
Parameters
-
See also
OK01 - All calls
6.1.3. OK03 - Agents on queue
This report shows which agents have been available for the given queue, how many calls each one handled and the percentage of all calls
that each one handled.
If calls are connected directly to a phone terminal, QM tries its best to show the corresponding terminal, usually in the format used by
Asterisk, like "SIP/303" to signify a SIP phone whose number is 303.
If you connect to H.323 telephones via the OH323 module, the recorded channel names have no meaning and do not refer to a specific
terminal; that’s why all OH323 calls are grouped together under the label "OH323/-".
The pie graph shows which agents have been available for the given queue representing the percentage of all calls that each one handled.
Available since
1.6.0
Default page
Answered calls
Shortcut code
OK03
XML-RPC code
OkDO.AgentsOnQueue
Parameters
-
See also
38
Report Details
6.1.4. OK04 - Service level agreement
This report shows the distribution of call waiting times. It shows how many calls were answered within a given time frame, usually 120
seconds in 10 second increments (the time frame and increment can be modified by the administrator, if needed - see below).
You get a percentage of how many calls were answered within X seconds; the percentage includes calls answered in a shorter time frame
and therefore grows with time.
The "delta" value you see is the absolute increment, expressed in number of calls, between each time frame, while the "Offered" column
displays the result of the taken calls divided by the total taken plus the total lost.
This metric is computed only on answered calls, i.e. ignoring lost calls . If your SLA is defined in terms of taken and lost calls, see the
corresponding metrics "Inclusive SLA" on Section 4.8.4, “Inclusive Service Level Agreement”.
The graph reports the percentage of how many calls were answered within X seconds, as reported in the table.
Since 1.6.2, it is possible to configure the time frame and increment separately for an initial period and the rest of the interesting period; in
this way it is possible to have different breakdowns, e.g. every 5 seconds up to 20 seconds and every 10 seconds up to 120 seconds. See
Section 21.24, “Configuring system preferences”.
For example, by setting:
• initial_interval=5 and max_initial_interval=20
• interval=10 and max_monitored_delay=60
You get the following cutoff points: 5, 10, 15, 20, 30, 40, 50, 60 seconds
By setting:
• initial_interval=3 and max_initial_interval=3
• interval=5 and max_monitored_delay=60
You get the following cutoff points: 3, 5, 10, 15, 20, 25,… seconds
By setting
• initial_interval=0 and max_initial_interval=0
• interval=10 and max_monitored_delay=120
You get the default cutoff points: 10, 20, 30, 40, 50 , 60, 70, 80, 90, 100, 110 and 120 seconds
Available since
1.6.0
Default page
Answered calls
Shortcut code
OK04
XML-RPC code
OkDO.ServiceLevelAgreement
Parameters
-
39
Report Details
See also
UN18 UN07 UN06
6.1.5. OK05 - Disconnection causes
This report shows the reason why calls were terminated; this means that:
• The agent hung up, or
• The caller hung up, or
• The call was transferred outside the queue and the agent was freed again, or
• The call was ongoing at the time the report was run.
The graph reports the percentage values associated to the reason of why calls were terminated, as calculated in the table.
Available since
1.6.0
Default page
Answered calls
Shortcut code
OK05
XML-RPC code
OkDO.DisconnectionCauses
Parameters
-
See also
6.1.6. OK06 - Transfers
This graph shows how many calls were transferred to each extension in the given time frame. This lets you know who is handling exception
calls.
when a call is transferred outside the queue system, its length is no more recorded by the queue subsystem; therefore you
only get to see the length of the call while the agent was on line.
Available since
1.6.0
Default page
Answered calls
Shortcut code
OK06
40
Report Details
XML-RPC code
OkDO.Transfers
Parameters
-
See also
6.1.7. OK07 - Answered calls, by queue
If more than one queue is in use for the report, this table shows the relative magnitude of each queue.
The graph reports the percentage associated to each queue in the table.
Available since
1.6.0
Default page
Answered calls
Shortcut code
OK07
XML-RPC code
OkDO.AnsweredcallsByQueue
Parameters
-
See also
6.1.8. OK08 - Answered calls, by direction
If more than one queue is in use for the report, this table shows the relative magnitude of each queue.
Inbound queues are marked with the symbol
while outbound queues use the symbol
The graph reports the percentage associated to each queue in the table.
Available since
1.6.0
Default page
Answered calls
Shortcut code
OK08
XML-RPC code
OkDO.AnsweredcallsByDirection
Parameters
-
See also
6.1.9. OK09 - Answered calls, by stints
41
.
Report Details
This graph counts the distribution of multi-stint calls on selected queues. If multi-stint mode is not enable, all calls will have only one stint.
Available since
1.6.0
Default page
Answered calls
Shortcut code
OK09
XML-RPC code
OkDO.StintsOk
Parameters
-
See also
6.1.10. OK10 - Queue position
This graph shows the initial queue position that the calls had when they joined the queue. For example, a queue position of 1 means that
a call was first in line, of 5 means that a call had four other calls in line before being answered. As the logging of queue positions is a bit
inconsistent, some calls might be missing it ("Untracked")
Available since
1.6.0
Default page
Answered calls
Shortcut code
OK10
XML-RPC code
OkDO.QPosOk
Parameters
-
See also
6.1.11. OK11 - IVR selection
This graph shows the distribution of IVR selections available in the calls processed. We can also see the IVR duration values, which is
related to the time that the call was within the IVR before entering the queue.
This must be tracked manually in Asterisk - See "Configuring Asterisk for QueueMetrics" below.
Available since
1.6.0
Default page
Answered calls
Shortcut code
OK11
XML-RPC code
OkDO.IvrOk
Parameters
-
See also
42
Report Details
6.1.12. OK12 - DNIS used
This graph shows the distribution of DNIS lines available in the calls processed.
This must be tracked manually in Asterisk - See "Configuring Asterisk for QueueMetrics" below.
Available since
1.6.0
Default page
Answered calls
Shortcut code
OK12
XML-RPC code
OkDO.DnisOk
Parameters
-
See also
6.1.13. OK13 - Music On Hold by Agent
This allows to see the total number of Music on Hold (MOH) events per agent, how many MOH instances took place throughout a call, the
average and total duration of MOH events.
This must be tracked manually in Asterisk - See "Configuring Asterisk for QueueMetrics" below.
Available since
12.2.0
Default page
Answered calls
Shortcut code
OK13
XML-RPC code
OkDO.MOHOk
Parameters
-
See also
6.1.14. OK14 - Report Header
This is the report header and will be added automatically on each tab on the screen and at the beginning of each session in the PDF and
Excel report export.
Available since
13.04.9
43
Report Details
Default page
Beginning of each page
Shortcut code
OK14
XML-RPC code
OkDO.HDRRpt
Parameters
-
See also
HDRRpt
6.1.15. OK15 - Required Skills for Taken Calls
This data block displays the skills that were required for taken calls in the current reports.
As multiple skills may be required for the same call, or some calls may have no required skill, the sum of all skills may be significantly
different from the number of calls.
For each skill, the average wait and talk duration of all calls having that specific skill is computed. Plus, the minimum, average and
maximum level at which this skill was requested for the specific set of calls is displayed.
Available since
15.10
Default page
Answered calls
Shortcut code
OK15
XML-RPC code
OkDO.SkillsOk
Parameters
-
See also
UN19, UN20
6.2. Historical reports - Details of answered calls
6.2.1. OD01 - Queue details
This page shows the detail of answered calls. See Chapter 5, Showing call details.
When running a report, it is advisable to use block Section 6.2.3, “OD03 - Queue details (paged)” instead.
Available since
1.6.0
Default page
Details of answered calls
Shortcut code
OD01
XML-RPC code
DetailsDO.CallsOK
Parameters
-
See also
Section 6.2.3, “OD03 - Queue details
(paged)”
44
Report Details
6.2.2. OD02 - Add to export job
This is a pseudo-block that is used to display a button for call export. The button may not be displayed if the user does not have the correct
grants. As it does not actually contain data, it cannot be queried over XML-RPC.
Available since
1.7.0
Default page
Details of answered calls
Shortcut code
OD02
XML-RPC code
-
Parameters
-
See also
6.2.3. OD03 - Queue details (paged)
This page shows the paged detail of answered calls. See Chapter 5, Showing call details.
The details of calls are paged - so you can move back and forth - and you can control which columns will appear on screen. The paged
mode uses way less memory and is quicker to use than the full list as in Section 6.2.1, “OD01 - Queue details”.
When accessing the data source though XML-RPC or printing a report, it is mandatory to use the OD01 block, as this block is interactive
and will not render correctly.
Available since
13.03
Default page
Details of answered calls
Shortcut code
OD03
XML-RPC code
-
Parameters
-
See also
Section 6.2.1, “OD01 - Queue details”
and Section 21.20, “Configuring paged
call lists”
6.2.4. OD04 - IVR details (paged)
This block shows the paged detail of IVR calls. These are calls that did not hit a queue in the current report and thererfore are reported as
neither answered nor unanswered.
45
Report Details
The details of calls are paged - so you can move back and forth - and you can control which columns will appear on screen. The paged
mode uses way less memory and is quicker to use than the full list as in Section 6.2.5, “OD05 - IVR details (full list)”.
When accessing the data source though XML-RPC or printing a report, it is mandatory to use the OD05 block, as this block is interactive
and will not render correctly.
Available since
13.03
Default page
Details of answered calls
Shortcut code
OD04
XML-RPC code
-
Parameters
-
See also
Section 6.2.5, “OD05 - IVR details (full
list)”
6.2.5. OD05 - IVR details (full list)
This block shows the paged detail of IVR calls. These are calls that did not hit a queue in the current report and thererfore are reported as
neither answered nor unanswered.
This block prints a complete list and should be used only for printing and XML-RPC querying.
Available since
13.03
Default page
Details of answered calls
Shortcut code
OD05
XML-RPC code
DetailsDO.CallsIVR
Parameters
-
See also
Section 6.2.4, “OD04 - IVR details
(paged)”
6.3. Historical reports - Unanswered calls
Unanswered calls are calls that were lost, i.e. the caller could not connect to an agent. This usually means that either the caller hung up,
fed up with waiting, or the queue system decided to discharge the caller, maybe sending him to voicemail or another queue.
if you run a report with an agent filter, or a supervisor filter, or a location filter, the number of lost calls in the report is usually
zero, showing just outgoing calls, if any. This is because the agent is specified only for taken calls and not lost ones, so not
deleting them all would show, e.g., the taken call data for one single agent and the lost calls for all of the queue. You can
override this behaviour through a configuration switch if you feel this is not correct for you.
6.3.1. UN01 - All calls
46
Report Details
The report shows:
• How many calls were lost;
• The average waiting time before disconnection;
• The average queue position at disconnection (i.e. how many calls the queue had to dispatch before connecting the caller to an operator).
• The minimum and maximum wait times
• The minimum and maximum queue position at disconnect.
• The average, minimum and maximum initial queue position, and the coverage given for this computation
Available since
1.6.0
Default page
Unans.
Shortcut code
UN01
XML-RPC code
KoDO.ReportKoAll
Parameters
-
See also
6.3.2. UN02 - Calls fully within the given time interval
The unanswered completed calls section deals with calls that were lost. This is similar to what’s reported on previous panel but may
exclude calls that were started before or terminated after the given time frame.
Available since
1.6.0
Default page
Unans.
Shortcut code
UN02
XML-RPC code
KoDO.ReportKoFully
Parameters
-
See also
6.3.3. UN03 - Disconnection causes
47
Report Details
This report shows the relative magnitude of disconnection causes, that are:
• The caller hung up, or
• The queue timed out and discharged the caller (if this feature is enabled by the queue configuration - see Chapter 24, Configuring
Asterisk for QueueMetrics), or
• The caller exited the queue by pressing a key (if this feature is enabled by the queue configuration).
Available since
1.6.0
Default page
Unans.
Shortcut code
UN03
XML-RPC code
KoDO.DiscCauses
Parameters
-
See also
6.3.4. UN04 - Unanswered calls, by queue
If more than one queue is in use for the report, this graph shows the relative magnitude of each queue, either in a numerical than in a
graphical form.
Available since
1.6.0
Default page
Unans.
Shortcut code
UN04
XML-RPC code
KoDO.UnansByQueue
Parameters
-
See also
6.3.5. UN05 - Unanswered outbound calls, by agent
This graph shows the relative magnitude of unanswered outbound calls, grouped by agent.
Available since
1.6.0
Default page
Unans.
Shortcut code
UN05
XML-RPC code
KoDO.OutboundKo
Parameters
-
See also
48
Report Details
6.3.6. UN06 - Unanswered calls - distribution by length
This report is functionally equivalent to "Service level agreement" in the Answered calls section (see Section 4.7.2, “Service level
agreement”), but is computed on lost calls. It shows how many calls were hung up within a given time frame, usually 120 seconds in 10
second increments (the time frame and increment can be modified by the administrator, if needed - see Section 6.1.4, “OK04 - Service
level agreement”).
You get a percentage of how many calls were lost within X seconds; the percentage includes calls lost in a shorter time frame and therefore
grows with time.
The "delta" value you see is the absolute increment, expressed in number of calls, between each time frame, while the "Offered" column
displays the result of the taken calls divided by the total taken plus the total lost.
The graph reports the percentage of how many calls were not answered within X seconds, as reported in the table.
Available since
1.6.0
Default page
Unans.
Shortcut code
UN06
XML-RPC code
KoDO.UnansByLen
Parameters
-
See also
UN07 UN18 OK04
49
Report Details
6.3.7. UN07 - Inclusive SLA (computed on both answered and unanswered
calls)
The inclusive SLA corresponds to the Service Level Agreement metrics shown on Section 4.7.2, “Service level agreement”, with the
difference that it is computed taking into consideration both answered and unanswered calls.
The difference between UN07 and UN18 is that the number of calls in UN18 is only the number of taken calls within the given answer
period, while in UN07 it is the total number of taken and lost calls within the time period.
The graph reports the same information found in the table, but in a graphical way.
The time frame and increment can be modified by the administrator, if needed - see Section 6.1.4, “OK04 - Service level agreement”.
Available since
1.6.0
Default page
Unans.
Shortcut code
UN07
XML-RPC code
KoDO.InclusiveSLA
Parameters
-
See also
OK04 UN06 UN18 (Inclusive Answered
SLA)
6.3.8. UN08 - Unanswered calls by key press
If there are any calls that are were set unanswered because the caller pressed a key to exit the queue, this graph shows which keys were
pressed and how many calls were terminated for that reason.
Available since
1.6.0
50
Report Details
Default page
Unans.
Shortcut code
UN08
XML-RPC code
KoDO.ReportKoKeyPress
Parameters
-
See also
6.3.9. UN09 - Unanswered calls, by stints
This graph tells the stint distribution of unanswered calls. It corresponds to the graph called "Answered calls, by stints".
Available since
1.6.0
Default page
Unans.
Shortcut code
UN09
XML-RPC code
KoDO.StintsKo
Parameters
-
See also
6.3.10. UN10 - All calls, by stints
This graph tells the stint distribution of all processed calls. It corresponds to the sum of the graphs called "Answered calls, by stints" and
"Unanswered calls, by stints"
Available since
1.6.0
Default page
Unans.
Shortcut code
UN10
XML-RPC code
KoDO.StintsOkKo
Parameters
-
See also
6.3.11. UN11 - Enter queue position
51
Report Details
This graph shows the initial queue position that the calls had when they joined the queue. For example, a queue position of 1 means that
a call was first in line, of 5 means that a call had four other calls in line before being answered. As the logging of queue positions is a bit
inconsistent, some calls might be missing it ("Untracked")
Available since
1.6.0
Default page
Unans.
Shortcut code
UN11
XML-RPC code
KoDO.QPosKo
Parameters
-
See also
6.3.12. UN12 - Enter queue position for all calls
This graph shows the initial queue positions for both answered and unanswered calls.
Available since
1.6.0
Default page
Unans.
Shortcut code
UN12
XML-RPC code
KoDO.QPosOkKo
Parameters
-
See also
6.3.13. UN13 - IVR selection
This graph shows the distribution of IVR selections available for lost calls.
We can also see the IVR duration values, which is related to the time that the call was within the IVR before entering the queue.
This must be tracked manually in Asterisk - See "Configuring Asterisk for QueueMetrics" below.
Available since
1.6.0
Default page
Unans.
Shortcut code
UN13
52
Report Details
XML-RPC code
KoDO.IvrKo
Parameters
-
See also
6.3.14. UN14 - IVR selection, for all calls
This graph shows the distribution of IVR selections for all calls (taken and lost) available in the report.
Available since
1.6.0
Default page
Unans.
Shortcut code
UN14
XML-RPC code
KoDO.IvrOkKo
Parameters
-
See also
6.3.15. UN15 - DNIS used
This graph shows the distribution of DNIS lines that lead to lost calls.
This must be tracked manually in Asterisk - See "Configuring Asterisk for QueueMetrics" below.
Available since
1.6.0
Default page
Unans.
Shortcut code
UN15
XML-RPC code
KoDO.DnisKo
Parameters
-
See also
6.3.16. UN16 - DNIS used, for all calls
This graph shows the distribution of DNIS lines for all calls (taken and lost) available in the report.
Available since
1.6.0
Default page
Unans.
Shortcut code
UN16
XML-RPC code
KoDO.DnisOkKo
Parameters
-
See also
53
Report Details
6.3.17. UN17 - Call Overview
The answered calls section deals with calls that were correctly handled by agents.
For each queue included in the report, the following data will be shown:
• Calls offered: total number of calls in the period to hit that queue
• Calls answered: total number of answered calls
• Lost calls: total number of calls that have not been answered
• Average call length: it computed only on the talk time of answered calls, expressed as MM:SS
• Total call length: the total cumulate speak time for each queue, expressed as decimalized hours
• Average wait Q: the average wait time for both answered and lost calls
• Total wait Q: total cumulate wait time for answered and unanswered calls, expressed as decimalized hours
In the first line, there is a "Total" line, that sums up the values shown in previous lines.
The following lines are sorted according to the number of offered calls.
Available since
1.6.1.1
Default page
Unanswered calls
Shortcut code
UN17
XML-RPC code
KoDO.OverviewOkKo
Parameters
-
See also
6.3.18. UN18 - Inclusive Answered SLA
The inclusive SLA corresponds to the Service Level Agreement metrics shown on Section 4.7.2, “Service level agreement”, with the
difference that it is computed taking into consideration both answered and unanswered calls.
54
Report Details
The difference between UN07 and UN18 is that the number of calls in UN18 is only the number of taken calls within the given answer
period, while in UN07 it is the total number of taken and lost calls within the time period.
The graph reports the same information found in the table, but in a way that is easier to read.
The time frame and increment can be modified by the administrator, if needed - see Section 6.1.4, “OK04 - Service level agreement”.
Available since
1.6.1.2
Default page
Unans.
Shortcut code
UN18
XML-RPC code
KoDO.InclusiveAnswSLA
Parameters
-
See also
UN07 (Inclusive SLA) UN06 OK04
6.3.19. UN19 - Required Skills for Lost Calls
This data block displays the skills that were required for lost calls in the current reports.
As multiple skills may be required for the same call, or some calls may have no required skill, the sum of all skills may be significantly
different from the number of calls.
For each skill, the average wait duration of all calls having that specific skill is computed. As lost calls never have any talk time, it always
appears as 0:00 and is displayed for symmetry with blocks OK15 and UN20.
The minimum, average and maximum level at which this skill was requested for the specific set of calls is displayed.
Available since
15.10
Default page
Unans.
Shortcut code
UN19
XML-RPC code
KoDO.SkillsKo
Parameters
-
See also
UN20, OK15
6.3.20. UN20 - Required Skills for All Calls
55
Report Details
This data block displays the skills that were required for all calls in the current reports.
As multiple skills may be required for the same call, or some calls may have no required skill, the sum of all skills may be significantly
different from the number of calls.
For each skill, the average wait and talk duration of all calls having that specific skill is computed. Plus, the minimum, average and
maximum level at which this skill was requested for the specific set of calls is displayed.
Available since
15.10
Default page
Unans.
Shortcut code
UN20
XML-RPC code
KoDO.SkillsOkKo
Parameters
-
See also
UN19, OK15
6.4. Historical reports - Details of unanswered calls
6.4.1. UD01 - Detail of unanswered calls
This page shows full details of unanswered calls Section 5.3, “Detail of unanswered calls”.
In general this data block should not be used in reports but block Section 6.4.2, “UD02 - Lost calls (paged)” should be preferred.
Available since
1.6.0
Default page
Details of unanswered calls
Shortcut code
UD01
XML-RPC code
DetailsDO.CallsKO
Parameters
-
See also
Section 6.4.2, “UD02 - Lost calls
(paged)”
6.4.2. UD02 - Lost calls (paged)
This page shows the paged detail of unanswered calls. See Chapter 5, Showing call details.
The details of calls are paged - so you can move back and forth - and you can control which columns will appear on screen. The paged
mode uses way less memory and is quicker to use than the full list as in Section 6.4.1, “UD01 - Detail of unanswered calls”.
When accessing the data source though XML-RPC or printing a report, it is mandatory to use the UD01 block, as this block is interactive
and will not render correctly.
Available since
13.03
Default page
Details of unanswered calls
Shortcut code
UD02
56
Report Details
XML-RPC code
-
Parameters
-
See also
Section 6.4.1, “UD01 - Detail of
unanswered calls” and Section 21.20,
“Configuring paged call lists”
6.5. Historical reports - Area code analysis
6.5.1. AC01 - Area code report
If the Caller*ID is present, it is possible to break down both answered and unanswered calls to specific area codes by clicking on the "Area
code analysis" button.
By selecting a number of caller id digits to search upon and a starting digit position, you get a number of statistics grouped by area codes.
This report gives an immediate check of the geographical origin of calls handled by your call center.
Available since
1.6.0
Default page
Area code analysis
Shortcut code
AC01
XML-RPC code
AreaAnDO.Setup
Parameters
-
See also
6.5.2. AC02 - Detail for answered calls
This report shows the answered calls grouped following the rules defined in AC01 - Area code report.
Available since
1.6.0
Default page
Area code analysis
Shortcut code
AC02
XML-RPC code
AreaAnDO.CallsOK
Parameters
-
See also
AC01 - Area code report
6.5.3. AC03 - Detail for unanswered calls
57
Report Details
This report shows the unanswered calls grouped following the rules defined in AC01 - Area code report.
Available since
1.6.0
Default page
Area code analysis
Shortcut code
AC03
XML-RPC code
AreaAnDO.CallsKO
Parameters
-
See also
AC01 - Area code report
6.6. Historical reports - Distributions
When running an inbound call center, it is very important to determine the reason why a call is delayed: are your clients refusing to answer?
Did they forget to log off before leaving their workplace? The inbound ACD call attempts metrics try to answer to these questions.
As these metrics are not usually recorded by Asterisk, you’ll have to patch and recompile your Asterisk system in order to gather them - see
the section Section 24.6, “Enabling ACD call attempts recording on Asterisk 1.0 and 1.2”. If you do not do so, the metrics presented here
will always appear zeroed out. With Asterisk 1.4, this feature should be automatically enabled with no need to patch the source code.
6.6.1. AT01 - Inbound ACD call attempts
This page shows the following pieces of information:
• How many agent attempts were made, i.e. how many times the agent’s telephones were rung in total
• The average number of attempts that were necessary for a taken call; the minimum, maximum and total attempts made that resulted in a
taken call
• The average number of attempts that were necessary for a lost call; the minimum, maximum and total attempts made that resulted in a
lost call
Available since
1.6.0
Default page
Distrib.
Shortcut code
AT01
XML-RPC code
DistrDO.ReportAcd
Parameters
-
See also
6.6.2. AT02 - ACD attempts by queue
The following metrics are extracted and broken down by queue:
• N. of lost agent attempts (i.e. the agent was called but not responding)
• The average ring time for lost attempts
58
Report Details
• The total ringing time for lost calls
• The number of taken agent attempts (i.e. calls answered)
• The average ring duration for taken calls
• The total ring time for taken calls
Available since
1.6.0
Default page
Distrib.
Shortcut code
AT02
XML-RPC code
DistrDO.AcdByQueue
Parameters
-
See also
6.6.3. AT03 - ACD attempts by terminal
This graph breaks down agent attempts by the agent that was called. The following pieces of information are extracted for each agent:
• N. of lost agent attempts (i.e. the agent was called but not responding)
• The average ring time for lost attempts
• The total ringing time for lost calls
• The number of taken agent attempts (i.e. calls answered)
• The average ring duration for taken calls
• The total ring time for taken calls
Available since
1.6.0
Default page
Distrib.
Shortcut code
AT03
XML-RPC code
DistrDO.AcdByTerminals
Parameters
-
See also
6.7. Historical reports - Call distribution by day
The call distribution report shows when calls were handled, when calls were lost and the average wait times broken down by period.
All percentages are calculated on the call class they belong to, i.e. a 50% of "Unanswered calls" on one day means that 50% of all
unanswered calls for the period happened during that day, not that 50% of calls were lost.
For each metrics, the total number of calls is shown, together with average, minimum and maximum times. Graphs are plotted on the total
number of calls broken down and on the averages.
It is possible to change the interval in the Hourly graphs, so that you can have reports break down calls e.g. by half-hours or hour quarters,
by changing a value in the QueueMetrics master configuration file.
6.7.1. DD01 - Answered call distribution per day
59
Report Details
Taken calls are shown per specific day. Days with no events are not shown.
Available since
1.6.0
Default page
Call distribution, by day
Shortcut code
DD01
XML-RPC code
CallDistrDO.AnsDistrPerDay
Parameters
-
See also
6.7.2. DD02 - Answered call wait time per day
The total numbers of call wait time for answered calls are plotted for each day.
Available since
1.6.0
Default page
Call distribution, by day
Shortcut code
DD02
XML-RPC code
CallDistrDO.AnsWaitPerDay
Parameters
-
See also
6.7.3. DD03 - Unanswered call wait time per day
The total numbers of lost wait time for lost calls are plotted for each day.
Available since
1.6.0
Default page
Call distribution, by day
Shortcut code
DD03
XML-RPC code
CallDistrDO.UnansWaitPerDay
Parameters
-
See also
6.7.4. DD04 - Sales per day
Sales and contacts are shown on a daily basis.
Available since
1.6.0
Default page
Call distribution, by day
60
Report Details
Shortcut code
DD04
XML-RPC code
CallDistrDO.SalesPerDay
Parameters
-
See also
6.7.5. DD05 - Schedule Adherence per day
The Schedule Adherence report shows the number of distinct agents that were detected during the given period. This makes it possible to
detect the number of different people that had been working on a given moment.
Available since
1.6.0
Default page
Call distribution, by day
Shortcut code
DD05
XML-RPC code
CallDistrDO.StaffPerDay
Parameters
-
See also
6.7.6. DD06 - Queue length per day
The Queue Length report shows the average length of the queue for each period, giving minimums and maximums. The Steps computation
shows how fast each queue progresses during the period, expresses in steps per hour. Note: giving a meaning to the Queue Length
reports may be hard in the case of composite queues.
Available since
1.6.0
Default page
Call distribution, by day
Shortcut code
DD06
XML-RPC code
CallDistrDO.QPosPerDay
Parameters
-
See also
6.7.7. DD07 - Inclusive SLA per day
The inclusive SLA corresponds to the Service Level Agreement metrics shown on Section 4.7.2, “Service level agreement”, grouped by
day.
Available since
1.6.0
Default page
Call distribution, by day
Shortcut code
DD07
61
Report Details
XML-RPC code
CallDistrDO.InclSlaPerDay
Parameters
-
See also
6.7.8. DD08 - Traffic Analysis by period - per day
This report shows aggregate inbound/outbound activity per day.
• Date: the date, hour or day of week used for the report.
• Avg agents: the average number of agents, as calculated by agents logged in for each period versus the total period. E.g. if an agent
logs in at 10:00 and logs off at 11:30, and a second agent logs in at 10:15 and logs off at 11:00, the period for 10:00 to 10:30 will show
1.5 available agents.
• Avg calls/agent: number of INCOMING calls (answered+unanswered) per period versus average available agents
• Service level: the SLA (see below), computed on INCOMING calls only
• Unans: Lost calls (INCOMING only)
• Unans short: Lost calls below X seconds (INCOMING only, as a percentage of all calls)
• Avg out: number of OUTGOING calls (completed and lost) per period versus number of available agents
• Out/in: ratio of outbound to inbound
• Avg ans. Average answer time (for INCOMING only)
• Avg talk time: Average talk time (for INCOMING only)
• Max wait ans: Maximum answer time in period (for INCOMING only)
• Max wait lost: Maximum wait time for lost calls in period (for INCOMING only)
• Max duration: Maximum talk time in period (for INCOMING only)
• Max duration OUT: Maximum talk time in period (for OUTGOING only)
• N. offered: Total number of INCOMING calls
• N Answered: Total number of answered INCOMING calls
• N Answered out: Total number of answered OUTGOING calls
• Min Agents: minimum number of agents logged on for the period
• Max Agents: maximum number of agents logged on in the period
The Service Level is measured against a time period that is specidfied in the default.secondsServiceLevel parameter (default is 20, as to
say "percentage of calls answered within 20 seconds").
Short calls are defined as being shorter than the default.shortCallsLimit parameter - default is 5 seconds.
Available since
1.6.0.4
Default page
Call distribution, by day
Shortcut code
DD08
XML-RPC code
CallDistrDO.TrafficAnPerDay
Parameters
-
See also
DH08, DW08
6.8. Historical reports - Call distribution by hour
Events are shown on a 24-hour distribution. If this graph appears to be incorrect, you have to run a "Custom report" setting the time zone
accordingly (see Section 4.3, “Custom reports”).
62
Report Details
6.8.1. DH01 - Answered call distribution per hour
The total numbers of call lengths for answered calls are plotted for each hourly interval. The size of hourly intervals can be controlled by the
default.hourly_slot configuration property, making it possible to run this reports based on 30-minute, 20-minute or 15-minute intervals.
Available since
1.6.0
Default page
Call distribution, by hour
Shortcut code
DH01
XML-RPC code
CallDistrDO.AnsDistrPerHr
Parameters
-
See also
6.8.2. DH02 - Answered call wait time per hour
The total numbers of call wait time for answered calls are plotted for each hourly interval. The size of hourly intervals can be controlled by
the default.hourly_slot configuration property, making it possible to run this reports based on 30-minute, 20-minute or 15-minute intervals.
Available since
1.6.0
Default page
Call distribution, by hour
Shortcut code
DH02
63
Report Details
XML-RPC code
CallDistrDO.AnsWaitPerHr
Parameters
-
See also
6.8.3. DH03 - Unanswered call wait time per hour
The total numbers of call lengths for unanswered calls are plotted for each hourly interval. The size of hourly intervals can be controlled by
the default.hourly_slot configuration property, making it possible to run this reports based on 30-minute, 20-minute or 15-minute intervals.
Available since
1.6.0
Default page
Call distribution, by hour
Shortcut code
DH03
XML-RPC code
CallDistrDO.UnansWaitPerHr
Parameters
-
See also
6.8.4. DH04 - Sales per hour
The total numbers sales and contacts, are plotted for each hourly interval. The size of hourly intervals can be controlled by the
default.hourly_slot configuration property, making it possible to run this reports based on 30-minute, 20-minute or 15-minute intervals.
Available since
1.6.0
Default page
Call distribution, by hour
64
Report Details
Shortcut code
DH04
XML-RPC code
CallDistrDO.SalesPerHr
Parameters
-
See also
6.8.5. DH05 - Schedule Adherence per hour
The Schedule Adherence report shows the number of distinct agents that were detected during the given period. This makes it possible to
detect the number of different people that had been working on a given moment.
Available since
1.6.0
Default page
Call distribution, by hour
Shortcut code
DH05
XML-RPC code
CallDistrDO.StaffPerHr
Parameters
-
See also
6.8.6. DH06 - Queue length per hour
65
Report Details
The Queue Length report shows the average length of the queue for each period, giving minimums and maximums. The Steps computation
shows how fast each queue progresses during the period, expresses in steps per hour. Note: giving a meaning to the Queue Length
reports may be hard in the case of composite queues.
Available since
1.6.0
Default page
Call distribution, by hour
Shortcut code
DH06
XML-RPC code
CallDistrDO.QPosPerHr
Parameters
-
See also
6.8.7. DH07 - Inclusive SLA per hour
The inclusive SLA corresponds to the Service Level Agreement metrics shown on Section 4.7.2, “Service level agreement”, grouped each
hour.
Available since
1.6.0
Default page
Call distribution, by hour
Shortcut code
DH07
XML-RPC code
CallDistrDO.InclSlaPerHr
Parameters
-
See also
6.8.8. DH08 - Traffic Analysis by period - per hour
Distribution of calls and agent availability per hour (or interval you specified). The whole 24h are mapped out for ease of comparison.
For a complete description of parameters, see DD08 - Traffic Analysis by period - per day Section 6.7.8, “DD08 - Traffic Analysis by period
- per day”
Available since
1.6.0.4
Default page
Call distribution, by hour
Shortcut code
DH08
XML-RPC code
CallDistrDO.TrafficAnPerHr
Parameters
-
66
Report Details
See also
DD08, DW08
6.9. Historical reports - Call distribution by day of week
This report shows the weekly behaviour of your queues. The longer the analysis period, the more significant its results will be.
6.9.1. DW01 - Answered call distribution per day of week
The total numbers of call lengths for answered calls are plotted for each day of the week.
Available since
1.6.0
Default page
Call distribution, by day of week
Shortcut code
DW01
XML-RPC code
CallDistrDO.AnsDistrPerDOW
Parameters
-
See also
6.9.2. DW02 - Answered call wait time per day of week
The total numbers of call wait time for answered calls are plotted for each day of the week.
Available since
1.6.0
Default page
Call distribution, by day of week
Shortcut code
DW02
XML-RPC code
CallDistrDO.AnsWaitPerDOW
Parameters
-
See also
6.9.3. DW03 - Unanswered call wait time per day of week
67
Report Details
The total numbers of call wait time for unanswered calls are plotted for each day of the week.
Available since
1.6.0
Default page
Call distribution, by day of week
Shortcut code
DW03
XML-RPC code
CallDistrDO.UnansWaitPerDOW
Parameters
-
See also
6.9.4. DW04 - Sales per day of week
The total numbers sales and contacts, are plotted for each day of the week.
Available since
1.6.0
Default page
Call distribution, by day of week
Shortcut code
DW04
XML-RPC code
CallDistrDO.SalesPerDOW
Parameters
-
See also
6.9.5. DW05 - Schedule Adherence per day of week
The Schedule Adherence report shows the number of distinct agents that were detected during the given period. This makes it possible to
detect the number of different people that had been working on a given moment.
Available since
1.6.0
Default page
Call distribution, by day of week
Shortcut code
DW05
XML-RPC code
CallDistrDO.StaffPerDOW
Parameters
-
See also
68
Report Details
6.9.6. DW06 - Queue length per day of week
The Queue Length report shows the average length of the queue for each period, giving minimums and maximums. The Steps computation
shows how fast each queue progresses during the period, expresses in steps per hour. Note: giving a meaning to the Queue Length
reports may be hard in the case of composite queues.
Available since
1.6.0
Default page
Call distribution, by day of week
Shortcut code
DW06
XML-RPC code
CallDistrDO.QPosPerDOW
Parameters
-
See also
6.9.7. DW07 - Inclusive SLA per day of week
The inclusive SLA corresponds to the Service Level Agreement metrics shown on Section 4.7.2, “Service level agreement”, grouped for
each day of week.
Available since
1.6.0
Default page
Call distribution, by day of week
Shortcut code
DW07
XML-RPC code
CallDistrDO.InclSlaPerDOW
Parameters
-
See also
6.9.8. DW08 - Traffic Analysis by period - per day of week
Distribution of calls and agent availability per day of week.
69
Report Details
For a complete description of parameters, see DD08 - Traffic Analysis by period - per day Section 6.7.8, “DD08 - Traffic Analysis by period
- per day”
Available since
1.6.0.4
Default page
Call distribution, by day of week
Shortcut code
DW08
XML-RPC code
CallDistrDO.TrafficAnPerDOW
Parameters
-
See also
DD08, DH08
6.10. Historical reports - Agents and Sessions
Agent activity refers to the behaviour of Asterisk defined agents. If you connect you queues straight to telephone terminals, this section will
always be empty.
Each agent may be flagged as being a member of four priority groups:
• Main: the agents usually answering the queue
• Spill: the agents answering the queue if all "Main" agents are busy or unavailable
• Wrap: the agents answering the queue if all "Main" and "Spill" agents are busy or unavailable
• Undefined: this agent is not a member of any priority group for this queue
This feature is useful if priority groups are used in the queue configuration. If they are not used, just assign all agents to "Main" for each
queue.
If an unknown agent appears on a queue, it will be marked as "Undefined", written in red.
Agent names are written in blue and are clickable, if you click on them in any of the graphs, you will be lead to a popup that detail the logon
and pause history for that agent.
As a default, QueueMetrics will show and count an agent session if and only if the agent handled at least one call during this session. This
may not be what you want when you use pause codes - an agent may log on and immediately go on pause to do some back-end activities.
If this is the case, you should set the configuration option default.useRawAgentSessions to true to see all agent sessions.
6.10.1. AG01 - Agent session detail
This report shows:
• The number of available agents in the considered period
• The average agent time availability
• The minumum agent time availability
• The maximum agent time availability
• The cumulated agents time availability
Available since
1.6.0
Default page
Agents and Sessions
Shortcut code
AG01
XML-RPC code
AgentsDO.ReportAgents
Parameters
-
See also
70
Report Details
6.10.2. AG02 - Session and pause durations
This report shows:
• The number of sessions for each available agent
• The number of pauses for each available agent
• The average pause time
• The percentage between the pause time and the availability time for each agent
• The number of pauses for each session, for each available agent
Available since
1.6.0
Default page
Agents and Sessions
Shortcut code
AG02
XML-RPC code
AgentsDO.SessionPauseDur
Parameters
-
See also
6.10.3. AG03 - Agent availability (for all the queues they are member of)
This report shows:
• The agent available time
• The total billable and not billable pause times
In the latest release a new column has been added (Paused on Conversation), which displays occupancy values.
Available since
1.6.0
Default page
Agents and Sessions
Shortcut code
AG03
XML-RPC code
AgentsDO.AgentAvail
Parameters
-
See also
6.10.4. AG04 - Answered calls (for selected queues)
71
Report Details
This report shows:
• The number of answered calls for each agent
• The cumulated call time for each agent
• The average call time for each agent
• The average wait time for each call taken
• The percentage of taken calls, related to the total queue calls, for each agent
Available since
1.6.0
Default page
Agents and Sessions
Shortcut code
AG04
XML-RPC code
AgentsDO.AnsCallsQueues
Parameters
-
See also
6.10.5. AG05 - Answered calls by custom group
This report shows:
• The number of answered calls for each defined agent group
• The cumulated call time for each defined agent group
• The average call time for each defined agent group
• The percentage of taken calls, related to the total queue calls, for each defined agent group
The report displays separately the following cases:
• Agents that are known to QueueMetrics but have no custom group, are counted under the group "-"
• Agents that are not known to QueueMetrics but found in the analysis are counted under "Undefined".
Available since
1.6.0
Default page
Agents and Sessions
Shortcut code
AG05
XML-RPC code
AgentsDO.AnsCallsCG
Parameters
-
See also
6.10.6. AG06 - Answered calls by location
This report shows:
• The number of answered calls for each defined location
72
Report Details
• The cumulated call time for each defined location
• The average call time for each defined location
• The average wait time for each defined location
• The percentage of taken calls, related to the total queue calls, for each defined location
Available since
1.6.0
Default page
Agents and Sessions
Shortcut code
AG06
XML-RPC code
AgentsDO.AnsCallsLocation
Parameters
-
See also
6.10.7. AG07 - Answered calls by service group
This report shows:
• The number of answered calls for each defined service group
• The cumulated call time for each defined service group
• The average call time for each defined service group
• The percentage of taken calls, related to the total queue calls, for each defined service group
Available since
1.6.0
Default page
Agents and Sessions
Shortcut code
AG07
XML-RPC code
AgentsDO.AnsCallsSG
Parameters
-
See also
6.10.8. AG08 - Agent Performance by ACD Group
One entry is presented for each agent session. What makes this report different from most is that inbound and outbound activity for the
agent is aggregated.
Items are computed as:
• Level: the agent level this agent belongs to
• Agent: agent name (if present) or Asterisk internal code if unknown. By clicking on it, the session details open.
• Login: Session login time
• Duration: Session duration
• N.calls in: Number of calls taken for this queue(s)
73
Report Details
• N calls out: Number of calls outbound made for these campaign(s)
• Tot calls: calls in + calls out
• Average duration IN
• Average duration OUT
• Average duration for all (weighted)
• Available: precentage of idle time
• On call IN: percentage of time on call inbound
• On call OUT: percentage of time on call outbound
• Pause Billable: percentage of time on a pause code marked as billable
• Pause Unbillable: percentage of time on a pause code marked as unbillable, or not specified, or unknown. (a.k.a. Clerical time)
Available since
1.6.0.4
Default page
Agents and Sessions
Shortcut code
AG08
XML-RPC code
AgentsDO.PerformanceAcdGroups
Parameters
-
See also
6.10.9. AG09 - Agent Occupancy Report
The report details the occupancy rate for each and all agents in the current analysis.
• The Agent column contains the decoded name, level and current group of the agent (if defined, expressed as an icon like elsewhere in
QM). By clicking on the agent name, it is possible to open a popup with the session details for that agent.
• Total session time is the sum of the duration of all sessions in the current analysis, from start to end.
• Pause Billable is the total time on Billable pauses, for all sessions considered.
• Pause Non Billable is the total time on Non-Billable pauses, for all sessions considered.
• Total pause time is the sum of all pauses for all sessions considered.
• Total talk time is the sum of all time that the specified agent spent in conversation during the sessions considered.
• Occupancy is computed as: Talk time / (Total session � Total Pause) and expressed as a percentage, as per the numeric examples
show in the table above.
In the latest release a new column has been added (Paused Conversation) which is subtracted from the total pauses time; this way
Occupancy will never be able to be over 100%.
The first line is labeled "All agents" and is computed according to the following rules:
• Total session time, Pause billable, Pause non billable, Pause wrap, Total pause, Total talk time are computed as sums of the rest of data
in each column
• Occupancy is computed as: Sum talk time / (Sum Total session � Sum Total Pause)
Available since
1.6.2.4
Default page
Agents and Sessions
Shortcut code
AG09
XML-RPC code
AgentsDO.AgentOccupancy
Parameters
-
74
Report Details
See also
6.10.10. AG10 - Agent Session Time by Hour
The report details the total presence time of each agent over the 24h for which you are running the current analysis.
• The Agent column contains the agent’s decoded name, level and current group (if defined, expressed as an icon like elsewhere in QM).
• Total time is the sum of the duration of all sessions included in the current analysis, from start to end.
• One or more columns are present for each hour’s timeframe where total session information is present
Available since
1.7.2
Default page
Agents and Sessions
Shortcut code
AG10
XML-RPC code
AgentsDO.AgentBillableTimeByHour
Parameters
-
See also
6.10.11. AG11 - Agent Payable Time by Hour
The report details the payable presence time of each agent over the 24h for which you are running the current analysis.
• The Agent column contains the agent’s decoded name, level and current group (if defined, expressed as an icon like elsewhere in QM).
• Total time is the sum of the duration of payable session time within the current analysis, from start to end.
• One or more columns are present for each hour’s timeframe where payable session information is present
Available since
1.7.2
Default page
Agents and Sessions
Shortcut code
AG11
XML-RPC code
AgentsDO.AgentPayableTimeByHour
Parameters
-
See also
6.10.12. AG12 - Agent Billable Time by Hour
The report details the billable presence time of each agent over the 24h for which you are running the current analysis.
75
Report Details
• The Agent column contains the agent’s decoded name, level and current group (if defined, expressed as an icon like elsewhere in QM).
• Total time is the sum of the duration of billable session time within the current analysis, from start to end.
• One or more columns are present for each hour’s timeframe where billable session information is present
Available since
1.7.2
Default page
Agents and Sessions
Shortcut code
AG12
XML-RPC code
AgentsDO.AgentBillableTimeByHour
Parameters
-
See also
6.10.13. AG13 - Agent Session View
This report shows a set of calls aggregated by agents. It reports session information and shows, for each agent, the main figures for
aggregated calls related to that agent. The first row reports the overall aggregated values.
Each row in the report shows:
• The agent name (the first line contains all agents information)
• Presence, calculated as sum of all agent sessions (so including pauses time)
• Talk time
• Idle time, calculated by subtracting pauses and talk time from the presence figure
• Billable time
• Not billable time
• Sales: the number of taken calls flagged "sales"
• S PH (Sales per hour): the number of sales per hour ratio
• QC: the number of taken calls flagged as qualified contacts
• QC PH: Qualified contacts per hour
• Cont: number of taken calls flagged as "contacts"
• CPH: Contacts per hour
• Offered: Overall taken + lost calls
• Answered: taken calls
• Conv: convertion ratio
• QConv: qualified convertion ratio
• Goal Ftrs: number of goal flagged feature codes found in the call dataset
• Ftrs: number of feature codes found in the call dataset
• Avg: average talk time
• T: by clicking on that icon, a popup with the taken call list (used to count the aggregated) is shown
• L: by clicking on that icon, a popup with the lost call list (used to count the aggregated) is shown
Available since
15.9
Default page
Agents and Sessions
Shortcut code
AG13
76
Report Details
XML-RPC code
AgentsDO.AgentSessionsView
Parameters
-
See also
6.10.14. AG14 - Queue Session View
This report shows a set of calls aggregated by queue. It reports queue information and shows, for each queue, the main figures for
aggregated calls related to that queue. The first row reports the overall aggregated values.
Each row in the report shows:
• The queue name (the first line contains all queues information)
• Presence, calculated as sum of all agent sessions in the queue
• Talk time
• Idle time, calculated by subtracting pauses and talk time from the presence figure
• Billable time
• Not billable time
• Sales: the number of taken calls flagged "sales"
• S PH (Sales per hour): the number of sales per hour ratio
• QC: the number of taken calls flagged as qualified contacts
• QC PH: Qualified contacts per hour
• Cont: number of taken calls flagged as "contacts"
• CPH: Contacts per hour
• Offered: Overall taken + lost calls
• Answered: taken calls
• Conv: convertion ratio
• QConv: qualified convertion ratio
• Goal Ftrs: number of goal flagged feature codes found in the call dataset
• Ftrs: number of feature codes found in the call dataset
• Avg: average talk time
• T: by clicking on that icon, a popup with the taken call list (used to count the aggregated) is shown
• L: by clicking on that icon, a popup with the lost call list (used to count the aggregated) is shown
QueueMetrics uses an approach where it does not exactly track sessions per queue. If an agent joins and leaves multiple
queues during the same session, QueueMetrics does not track where each session starts and ends. Therefore, while we
may get accurate details of the time an agent was available, if an agent may cherry pick queues or work on multiple queues
at once, we will have to find a way to estimate when its time was spent. In order to do this QueueMetrics counts the local
time an agent was available per session, then it multiplies this value by the percentage of talk time that happened on each
queue.
Available since
15.9
Default page
Agents and Sessions
Shortcut code
AG14
XML-RPC code
AgentsDO.QueueSessionsView
Parameters
-
See also
77
Report Details
6.10.15. AG15 - Agents by Hour
The report details the number of agents available on the selected queues each hour for each day in the report.
• The first column (Day) reports the date who the line is referred to
• The next 24 columns report the number of agents found for at least one second in the associated hour. Numbers are reported black if
the timeband has been covered completely by the agents, are reported red if at least one agent is not present for the whole hour. In this
case, by flying over the red number the user can have an idea on what’s the coverage percentage for the timeband. The coverage is
counted as the sum of periods, in seconds, the agents cumulated in that timeband, divided by 3600 seconds.
• The last column reports the agents seen, for at least one second, during the day
Available since
14.10.5-938
Default page
Agents and Sessions
Shortcut code
AG15
XML-RPC code
AgentsDO.AgentByHour
Parameters
-
See also
6.10.16. AG16 - Tag Session View
This report shows a set of calls aggregated by tag. It reports tags information and shows, for each tag, the main figures for aggregated calls
related to that tag. The first row reports the overall aggregated values.
Each row in the report shows:
• The tag name (the first line contains all tags information)
• Presence, calculated as sum of all agent sessions for agents taking calls with related tag
• Talk time
• Idle time, calculated by subtracting pauses and talk time from the presence figure
• Billable time
• Not billable time
• Sales: the number of taken calls flagged "sales"
• S PH (Sales per hour): the number of sales per hour ratio
• QC: the number of taken calls flagged as qualified contacts
• QC PH: Qualified contacts per hour
• Cont: number of taken calls flagged as "contacts"
• CPH: Contacts per hour
• Offered: Overall taken + lost calls
78
Report Details
• Answered: taken calls
• Conv: convertion ratio
• QConv: qualified convertion ratio
• Goal Ftrs: number of goal flagged feature codes found in the call dataset
• Ftrs: number of feature codes found in the call dataset
• Avg: average talk time
• T: by clicking on that icon, a popup with the taken call list (used to count the aggregated) is shown
• L: by clicking on that icon, a popup with the lost call list (used to count the aggregated) is shown
QueueMetrics uses an approach where it does not exactly track sessions per tag. If an agent joins and leaves multiple
queues during the same session, QueueMetrics does not track where each session starts and ends. Therefore, while we
may get accurate details of the time an agent was available, if an agent may cherry pick queues or work on multiple queues
at once, we will have to find a way to estimate when its time was spent. In order to do this QueueMetrics counts the local
time an agent was available per session, then it multiplies this value by the percentage of talk time that happened on each
queue.
Available since
15.09
Default page
Agents and Sessions
Shortcut code
AG16
XML-RPC code
AgentsDO.TagSessionsView
Parameters
-
See also
6.10.17. AG17 - Cumulated sessions by Queue, Tag
This report shows a set of calls aggregated by queue and tag. It reports queue and tags information and shows, for each queue/tag pair,
the main figures for aggregated calls related to that pair. The first row reports the overall aggregated values.
Each row in the report shows:
• The queue name (the first line contains all queues information)
• The tag name (the first line contains all tags information)
• Presence, calculated as sum of all agent sessions for agents taking calls with related tag
• Talk time
• Idle time, calculated by subtracting pauses and talk time from the presence figure
• Billable time
• Not billable time
• Sales: the number of taken calls flagged "sales"
• S PH (Sales per hour): the number of sales per hour ratio
• QC: the number of taken calls flagged as qualified contacts
• QC PH: Qualified contacts per hour
• Cont: number of taken calls flagged as "contacts"
• CPH: Contacts per hour
• Offered: Overall taken + lost calls
• Answered: taken calls
79
Report Details
• Conv: convertion ratio
• QConv: qualified convertion ratio
• Goal Ftrs: number of goal flagged feature codes found in the call dataset
• Ftrs: number of feature codes found in the call dataset
• Avg: average talk time
• T: by clicking on that icon, a popup with the taken call list (used to count the aggregated) is shown
• L: by clicking on that icon, a popup with the lost call list (used to count the aggregated) is shown
QueueMetrics uses an approach where it does not exactly track sessions per queue/tag. If an agent joins and leaves
multiple queues during the same session, QueueMetrics does not track where each session starts and ends. Therefore,
while we may get accurate details of the time an agent was available, if an agent may cherry pick queues or work on
multiple queues at once, we will have to find a way to estimate when its time was spent. In order to do this QueueMetrics
counts the local time an agent was available per session, then it multiplies this value by the percentage of talk time that
happened on each queue.
Available since
15.09
Default page
Agents and Sessions
Shortcut code
AG17
XML-RPC code
AgentsDO.SessionByQueueTagReport
Parameters
-
See also
6.11. Historical reports - Details of agent sessions and pauses
6.11.1. AD01 - Detail of agent sessions
For each agent session, the start and end times are recorded, together with the total duration in seconds.
If the agent logs on via the call back function, the designated call back extension is shown.
The number of pauses and the total pause time in seconds is shown.
The "Srv" column tells you on which server an agent was working in case you set up a cluster of Asterisk servers.
It is possible to sort the table for each title, in either descending and ascending order. To do this, click once on the desired title for
descending sort, and twice for ascending sort. Once the table is sorted, an arrow symbol will appear close to the title, so you know on
which column it was sorted last. As the sorting is done on the client machine, it may take a while with very large tables.
Available since
1.6.0
Default page
Details of Agent sessions and pauses
Shortcut code
AD01
XML-RPC code
DetailsDO.AgentSessions
80
Report Details
Parameters
-
See also
6.11.2. AD02 - Detail of agent pauses
This table shows the specific pauses that each agent took and the pause code that was entered for each pause. It also shows whether the
pause taken was considered to be billable or non-billable.
Available since
1.6.0
Default page
Details of Agent sessions and pauses
Shortcut code
AD02
XML-RPC code
DetailsDO.AgentPauses
Parameters
-
See also
6.11.3. Popup of agent activity
This is not a normal data block but it is the popup that is displayed whenever you click on an agent’s name.
• The top table reports session, pause, billable and payable time
81
Report Details
• The bottom table shows the details of all agent sessions, with a break-up of all pauses that were made during that session. For each
pause with a known pause code, their billable-payable status is displayed:
• BP: Pause is Billable and Payable
• BNP: Pause is Billable but not payable (be careful!)
• NBP: Pause is not billable but Payable
• NBNP: Pause is neither billable nor payable
In the latest release a new "Conversation" column has been added on, to the right of the "On Pause" column, which displays the pause
time there may have been while actually in conversation.
You can close the popup by clicking on the Close button.
6.12. Historical reports - Call outcomes
If your agents are entering Pause codes or Call outcomes, the "Outcomes" tab will let you report on the information they just entered.
6.12.1. OU01 - Outcomes
This report shows:
• How much billable time there has been on this system, broken down by ACD/call time ("agent available time") and billable activities
(agent on pause)
• The total non billable time (e.g. lunch, breaks)
• The total number of Contacts, Qualified Contacts and Sales, as defined by call outcome codes
• The Sales per Hour (SPH), Qualified Contacts per hour (QCPH) and Contacts per Hour (CPH) ratios
• The Conversion index, that is the percentage of sales over the total number of sales and contacts.
Available since
1.6.0
Default page
Call outcomes
Shortcut code
OU01
XML-RPC code
OutcomesDO.GeneralRep
Parameters
-
See also
6.12.2. OU02 - Call results, by outcomes
This report shows:
82
Report Details
• The number of total calls grouped by outcome
• The number of answered calls grouped by outcome
• The number of unanswered calls grouped by outcome
• The percentage of calls related to each outcome
Available since
1.6.0
Default page
Call outcomes
Shortcut code
OU02
XML-RPC code
OutcomesDO.CallResByOutcome
Parameters
-
See also
6.12.3. OU03 - Billable activities
In this report you can find details explaining Billable activities, with average, minimum and maximum session durations, and a percentage
on all activities of the same kind.
Available since
1.6.0
Default page
Call outcomes
Shortcut code
OU03
XML-RPC code
OutcomesDO.ActivBillable
Parameters
-
See also
6.12.4. OU04 - Non billable activities
In this report you can find details explaining Non billable activities, with average, minimum and maximum session durations, and a
percentage on all activities of the same kind.
Available since
1.6.0
Default page
Call outcomes
Shortcut code
OU04
XML-RPC code
OutcomesDO.ActivNotBillable
Parameters
-
See also
6.12.5. OU05 - Detailed agent report
83
Report Details
The Detailed Agent Report will show, for each agent:
• The Available (ACD) time, as an absolute value and a percentage of its total time logged on
• The Billable time, as an absolute value and a percentage of its total time logged on
• The Non-Billable time, as an absolute value and a percentage of its total time logged on
• The number of Sales And Contacts the agent had (if a sale is counted a s both a Sale and a Contact, it’s counted only once as a Sale)
• The Sales per Hour (SPH) and Contacts per Hour (CPH) ratios for this agent
• The Conversion ratio, that is the percentage of sales over the total number of sales and contacts.
Available since
1.6.0
Default page
Call outcomes
Shortcut code
OU05
XML-RPC code
OutcomesDO.AgentReportDetailed
Parameters
-
See also
6.12.6. OU06 - Outcomes per agent
This data block displays all the status codes for each call handled by each agent within the current reporting selection.
If a call has no associated status code, then it is counted under a special status code called "-".
The columns show:
• The agent name. As an agent might have multiple status codes, the agent name will appear multiple times. If the agent belongs to an
agent group, the proper icon is displayed.
• The call outcome, specified both as a code and a description (if it is present)
• The type currently associated with the status code
• The total number of calls for that agent under that status code
All columns are client-sortable.
Available since
13.04.3
Default page
Call outcomes
Shortcut code
OU06
XML-RPC code
OutcomesDO.AgentOutcomes
Parameters
-
See also
6.12.7. OU07 - Call results, by tag
84
Report Details
This data block displays calls aggregated by tag code. The first line reports the figures for all aggregated call. The second row, marked with
the dash code as tag, counts aggregates for all calls with no tag code assigned.
The columns show:
• The tag code name
• Total number of calls aggregated
• Taken calls
• Average talk time
• Average wait time on taken calls
• Number of calls flagged as sales
• Number of calls flagged as contact
• Number of calls flagged as qualified contact
• Conversion ratio
• Qualified conversion ratio
• Number of lost calls
• Average wait on lost calls
• Average wait on IVR calls
• Time spent on IVR
• Ratio and histogram for total calls the row is reporting, compared with the overall total call in the report
All columns are client-sortable. Clicking on the lens icons present in the report will open a popup with call details (taken, lost and IVR)
counted in the aggregation.
Available since
15.09
Default page
Call outcomes
Shortcut code
OU07
XML-RPC code
CallTagDO.CallResByTag
Parameters
-
See also
6.12.8. OU08 - Call results, by feature code
This data block displays calls aggregated by feature code. The first line reports the figures for all aggregated call. The second row, marked
with the dash code as feature, counts aggregates for all calls with no feature code assigned.
The columns show:
• The feature code name
• Goal/Not goal flag for feature code
• Total number of calls aggregated
• Feature conversion factor, counted as ratio between the total calls and the call flagged as contact
• Taken calls
• Average talk time
• Average wait time on taken calls
85
Report Details
• Number of calls flagged as sales
• Number of calls flagged as contact
• Number of calls flagged as qualified contact
• Conversion ratio
• Qualified conversion ratio
• Number of lost calls
• Average wait on lost calls
• Ratio and histogram for total calls the row is reporting, compared with the overall total call in the report
All columns are client-sortable.
Available since
15.09
Default page
Call outcomes
Shortcut code
OU08
XML-RPC code
OutcomesDO.CallResByFeature
Parameters
-
See also
6.13. Historical reports - IVR tracking
The following reports let you trrack information about IVR calls and goals. A detailed explanation of IVR can be found in: Chapter 9,
Tracking IVR data
6.13.1. IV01 - IVR Traversals
This block shows:
• The IVR paths examined, in total (as the sum of all choices)
• For each IVR path, the choices made on that path (prepended by #)
For each path, the following information is computed:
• The number of calls traversing that path
• The number of IVR goals reached immediately after that path (a goal can be a queue or an activity expressly earmarked as a goal)
• The success rate, as the percentage of goals on all calls that entered the menu
• The number of hang-ups made in that IVR menu
• The attrition rate, as the number of hang-ups versus total number of calls
Available since
13.03
Default page
IVR
Shortcut code
IV01
XML-RPC code
IvrDO.IvrReport
86
Report Details
Parameters
-
See also
6.13.2. IV02 - IVR Timing
This block shows:
• The IVR paths examined, in total (as the sum of all choices)
• For each IVR path, the choices made on that path (prepended by #)
For each path, the following information is computed:
• The number of calls traversing that path
• The average traversal time for that IVR menu
• The total traversal time (as the sum of all times for each call)
• The maximum and minimum traversal times
Available since
13.03
Default page
IVR
Shortcut code
IV02
XML-RPC code
IvrDO.IvrTiming
Parameters
-
See also
6.13.3. IV03 - IVR Goals
This block shows:
• For each goal, all the paths that lead to that goal and their selection (the digit that was pressed in order to reach the goal)
• The number of calls that reached each goal
• The average, minimum and maximum traversal time to to reach the goal. The time is computed since the call is first tracked, and not only
on the final IVR menu.
Available since
13.03
Default page
IVR
Shortcut code
IV03
XML-RPC code
IvrDO.IvrGoals
Parameters
-
87
Report Details
See also
6.14. Externally generated reports
QueueMetrics is able to fetch and display data blocks generated by external systems. This may be used to enhance the standard
QueueMetrics reports with data that is handled outside of QueueMetrics - for example, data from a CRM application or order tracking
systems or anything else that makes sense to display together with queue data.
In order to use these blocks, you need to create external data providers that will generate the data that QueueMetrics is to display. Details
on how to do this can be found in the XML-RPC Manual in the section called Dynamic blocks in QueueMetrics.
6.14.1. XS01 - Plain HTML
This data block includes a block of HTML right into the QueueMetrics report page.
For example, in order to include an HTML fragment generated by a server located at http://server/page.php you would set:
url=http://server/page.php
in the data block’s parameter field.
Available since
13.12
Default page
None
Shortcut code
XS01
XML-RPC code
ExtSourceDO.HTML
Parameters
url: The URL that points to the page
generating HTML
See also
6.14.2. XS02 - XML-RPC data source
This data block includes a formatted table of data into the QueueMetrics report page. The data must be generated in a specified format by
an XML-RPC server, as described on the XML-RPC Manual.
Available since
13.12
Default page
None
Shortcut code
XS02
XML-RPC code
ExtSourceDO.XMLRPC
Parameters
url: The URL that points to the XMLRPC server
See also
XS01
6.14.3. XS03 - JSON data source
This data block includes a formatted table of data into the QueueMetrics report page. The data must be generated in a given format by a
JSON server, as described on the XML-RPC Manual.
Available since
13.12
Default page
None
Shortcut code
XS03
XML-RPC code
ExtSourceDO.JSON
Parameters
url: The URL that points to the page
generating a JSON document
See also
XS01
88
Chapter 7. The real-time status panel
The real time status panel can be accessed by clicking the "Start real-time monitoring" label from the home page. It will show a page similar
to the one below:
On the top of the page there is a control table showing the last update timestamp and other dropdown selectors as specified below:
• Reload: It defines the update period will be used to refresh the shown data
• Agents: Shows or hides the Agents currently logged in table
• Queues: Shows all queues or only active queues
• Agents: Toggle between all agents or members only agents
• Location: If granted by user permissions, defines which location is shown
• Group: Defines wich agent group is shown
• Superv.: Filter out agents not supervised by current user
The page is able to auto-refresh in background at the period specified in the first dropdown but you can anyway force a faster reload by
clicking the "Reload" button.
Next to the control table, there is the data section. Depending on the status of previously mentioned dropdown, three sections could be
shown.
The first is a table showing a summary of all calls flowing through queues. Following that summary, there is a table showing which calls are
currently handled by the queue system, then the agents logged in at the moment.
This page is invaluable because can tell you in a glimpse what’s happening in the call center; it is meant to stay open in a window on the
CC manager’s workstation to have the exact feeling of what is going on at the moment.
On the sample page above, you can see two calls and two connected agents. Just like in the main analysis, you can choose which queues
you want to monitor to avoid being overwhelmed by data.
You can also see that the current call environment has triggered a number of yellow and red alarms, as specified in the queue definition.
You can configure red an yellow alarms for most numeric values that appear on screen - see the chapter Section 21.3.1, “Setting attention
levels (Red and yellow alarms)”. You can also set sounds linked to yellow or red alarms, that will be played if a red or yellow alarm is
present.
Since the release of QueueMetrics 12.04, this panel has an added feature, which is the "Add Member" button, that allows an administrator
or supervisor to add an agent to a queue, as required. Users holding the RT_ADDMEMEBER key will be able to add agents directly from
the Realtime page.
89
The real-time status panel
In order to change the default audio files, see "Appendix D: System Preferences". If you want to turn them off completely,
just set them to blank.
The top menu bar shown in the above picture has been replaced by a left menu panel since QueueMetrics 15.10.
Since the release of QueueMetrics 15.09, the top panel contains a three bricks icon. Flying over with the mouse allows the user to select
the report blocks will be shown in the realtime page. The number of available blocks is dependente by a set of configuration keys.
Thre three bricks icon has been replaced since QueueMetrics 15.10 by a checkbox list located on the new menu bar located on the left
side, as reported below.
The menu bar can be optionally collapsed clicking on the << button to best fit realtime panel blocks.
90
The real-time status panel
7.1. Top status panel
The top status panel shows a quick status report for the current situation.
The first line shows information for all selected queues as a sum, while if there is relevant information for a specified queue it is displayed in
a separate line. If an alarm is triggered for one of the numeric values displayed, the relevant cell turns either yellow or red.
The displayed fields have the following meanings:
• Queue: The name of the queue. Inbound queues are marked with the symbol
, while outbound queues use the symbol
.
• N. agents: how many agents are logged on to the system, in total
• Ready agents: how many agents are ready to take calls, i.e. are logged on and are not in conversation or on pause
• On pause: how many agents are currently on pause
• Unk: how many agents are currently in conversation, but are not currently known as member of this queue
• Bsy: how many agents who are both members of the given queue and some other queue are currently busy because they are on call on
the other queue.
• N. Calls Waiting: how many inbound calls are currently waiting in the selected queue. Outbound queues never have any call waiting.
• On phone inbound: how many agent are talking on the selected inbound queue
• On phone outbound: how many agents are talking on an outbound queue
Please note that, as agents are not linked to a specific queue save for the moment they are actually talking to a caller on the queue,
the agent information is computed for all agents on the Asterisk server and not for specific queues, unless the "Members" option in the
"Agents" dropdown is selected.
7.2. Calls being processed
A list of calls flowing through the selected queues is presented on the middle table. If no call is present the table is displayed empty.
When a call is processed, the following fields are shown: - Queue: the queue that is handling the call; - Caller: The Caller*ID, if available; Entered: The date and time the call entered the queue system.
If the call is not answered yet, the "Waiting" field is displayed in red and is calculated according to the current date and time of the server.
Depending on what type of information is present in the database (ATTEMPTS or RINGNOANSWER), is possibile to have information
about the last agent not picking up the call or the actual ringing agent’s phone. The default configuration works with a standard Asterisk
configuration and lets able to have RINGNOANSWER information. Please refer to Chapter 24, Configuring Asterisk for QueueMetrics for
the how to configure Asterisk generate ATTEMPTS information.
When a call is answered, the "Waiting" field tells the time that the caller had to answer; the "Agent" field shows the agent (or terminal) the
caller is talking to and the "Duration", in red, is the current call duration.
If the call is ongoing and connected to an agent, moving the mouse on the wizard icon at the end of the line, some icons, like Call Monitor
and VNC Monitor icons may be present. By clicking on one of these icons you activate the specified monitoring (see below).
If the call is ongoing and you have the special grants to do so, a red scissor icon might appear, moving the mouse on the wizard icon, to
allow for brute-force call closure. See the section Closing ongoing calls for further details.
As soon as a call is completed or hung up, it exits the Calls panel.
This panel can be turned on or off through the "Calls" dropdown on the top of the page.
The "MOH" field shows the amount of time a customer is on hold with music, during a call. If multiple HOLD instances took place during the
call, this filed will show the total "on hold" time.
To implement this feature, it is necessary to have an Asterisk patch, which can be obtained by following this link:
https://reviewboard.asterisk.org/r/1778/
NOTE: The link to this Asterisk patch is provided by the Copyright holders and Contributors as is and any fitness for a particular purpose is
Disclaimed. In no event shall Loway be liable for any direct, indirect, incidental, special, exemplary, or consequential damages (including
Loss of use, data, profits or business interruption) however caused (including negligence or otherwise), arising in any way from the use of
this Asterisk patch.
The "Srv" column is used only in cluster-based environments to tell you on which server the call is being handled.
The last field contains a "wand" that on mouse-over displays a drop-down menu which allows to perform the following actions:
91
The real-time status panel
• VNC: Monitor agents via a VNC remote session
• IM: Begin an Instant Messaging session with an agent
• QA: Access the QA Form for the specific call (must have the QA_TRACK key enabled)
• Close: Close the call in the QM log, but not in Asterisk (must have the CLOSECALLS key enabled)
• Hangup: Close the live call in the PBX (must have the RT_HANGUPCALL key enabled)
• Transfer: Transfer the call to another extension (must have the RT_TRANSFERCALL key enabled).
• Monitor now: Start a listen-in chanspy Asterisk session (must have the MON_AUDIO key enabled)
To have precise realtime reporting a perfect clock synchronization is required. If your QM is on a different server, make sure the clocks
are exactly aligned or you may see strange values in all fields. The NTP protocol offers excellent clock synchronization precision and is
available on most operating systems.
7.3. Agents currently logged in
A list of available agents for all queues is displayed in this field. For each agent, the name, last log on and extension, if logged in via callback, is provided.
A graphical indication of the status of each agent is shown using a coloured dot, where the following cases are possible:
• Green dot: the agent is ready to take calls
• Yellow dot: the agent is currently on a call
• Red dot: the agent is currently on pause
This panel can be turned on or off through the "Agents" dropdown on the top of the page.
The Queue(s) field shows the queues an agent is logged on to. This is meaningful only for agents who log-in on a queue-by-queue basis
using the AddMember command in Asterisk. If an agent logs on to all queues he’s enabled to work on, a small database logo may be
shown, telling the viewer that the agent is linked to queues through the Asterisk’s configuration.
As the queue_log file usually contains no information on what queue(s) an agent is a member of, usually all agents are shown when they
log on, no matter to what queue they will work on. This might be a problem for larger call centres, so it is possible to see only calls and logons of agents that are a member of the current queue. Membership is set by clicking on the "Agents" button of the queue settings page.
Make sure your queue membership data is up-to-date before clicking this button!
If the "All" option was selected in the "Agents" dropdown , all agents logged in on Asterisk will be shown, no matter to which queue they
belong. When "Members" is selected, instead, only agents defined for the selected queue will be displayed.
By turning on the property "realtime.show_incorrect_queue_sets", the Queues field will display each queue with a different color code:
• in black: queues the agent is a known member of
• in brown: queues the agent is currently working on but he’s not a known member of
• as a down-arrow: queues the agent is a known member on but he’s not currently logged on to. In order to see the list of queues, fly over
the down-arrow symbol with your cursor.
The On Pause field will contain the time the agent went on pause; if the agent is using a pause code to mark the reason for going on
pause, the decoded pause code is shown as well. A switch can be used to show the pause start time either as an absolute hour or a time
increment.
The Srv field will contain the server identifier for QueueMetrics running in cluster mode.
The Free Since field will contain the length of period since the last taken call.
The Last call and On queue fields show the start time of the last call the agent handled (which is latest) and on which queue the last call
was. This can be useful to diagnose queue strategy problems that lead to unfair call distribution, or agents having problems with their
telephones and therefore not taking calls correctly.
The IVR field shows the call time spent on the IVR process before the call enter in the queue.
92
The real-time status panel
Waiting time and Duration fields are related to the last call taken.
The "wand" icon mouse-over displays a drop-down menu which allows to perform the following actions:
• VNC: Monitor agents via a VNC remote session
• IM: Begin an Instant Messaging session with an agent
• Remove Member: Remove an agent from a queue (must have the RT_REMOVEMEMBER key enabled)
• Pause Agent: Put an agent in a Pause state (must have the RT_PAUSEAGENT key enabled)
• Unpause Agent: Un-pause an agent so he/she is available to take calls (must have the RT_UNPAUSEAGENT key enabled)
• Send Text Message: Send a text message to an agent (must have the RT_SENDTEXTAGENT key enabled). The SMS functionality
works only with asterisk 10+ versions.
The last icon is a direct link to reports. Clicking on this icon will run an historical report by populating the query with parameters similar to
what generated the realtime panel results.
7.4. Aggregated by queue view
This block reports realtime figures related to each selected queue. All values are aggregated by queue except for the first row where calls
for the whole selected queue set is reported. On each column a user could find:
• An icon representing the queue direction (inbound/outbound)
• The queue name
• The total call time
• The number of calls feed by the queue
• The number of answered calls
• Average wait time for all calls in the queue
• Average talk time for answered calls
• Number of calls marked as sales
• SPH: Sales per hour figure
• Number of calls marked as qualified contact
• QCPH: Qualified contacts per hour figure
• Cont: number of calls marked as contact
• CPH: Contact per hour figure
• Conv: convertion ratio
• QConv: qualified conversion ratio
• SLA: percentage of calls matching the SLA time configured for the queue
• Goal Ftrs: number of goal marked feature codes found in the call set
93
The real-time status panel
• Feature: number of feature codes found in the call set
By clicking on the last icon, a user can start an historical report with query parameters matching the realtime page parameters that
generated the selected row.
7.5. Aggregated by tag view
This block reports realtime figures related to tags associated to processed calls. All values are aggregated by tag except for the first row,
where calls for the whole tag set is reported, and the second row, where only calls with no tag are counted. On each column a user could
find:
• Tag name (empty for all call set, dash for calls with no associated tags)
• The total call time
• The number of calls with associated tag
• The number of answered calls with associated tag
• Average wait time for all calls with associated tag
• Average talk time for answered calls with associated tag
• Number of calls marked as sales with associated tag
• SPH: Sales per hour figure
• Number of calls marked as qualified contact with associated tag
• QCPH: Qualified contacts per hour figure
• Cont: number of calls marked as contact with associated tag
• CPH: Contact per hour figure
• Conv: convertion ratio
• QConv: qualified conversion ratio
• Goal Ftrs: number of goal marked feature codes found in the call set
• Feature: number of feature codes found in the call set
By clicking on the last icon, a user can start an historical report with query parameters matching the realtime page parameters that
generated the selected row.
7.6. Agent and outcome view
This block reports realtime figures related agent sessions and calls. All values are aggregated agent except for the first row, where lost
calls are shown. On each column a user could find:
• Agent status icon
• Agent name
• Agent status explained (Logged on time, pause status, pause time, pause code)
• Offered call number
• Answered call number
• Total talk time
94
The real-time status panel
• Total idle time (counted as session time purged from talk and pause time)
• Billable pause time
• Non billable pause time
• Average talk time
• Sales: number of calls markes as sale
• SPH: Sales per hour figure
• Number of calls marked as qualified contact
• QCPH: Qualified contacts per hour figure
• Cont: number of calls marked as contact
• CPH: Contact per hour figure
• Conv: convertion ratio
• QConv: qualified conversion ratio
• Goal Ftrs: number of goal marked feature codes found in the call set
• Feature: number of feature codes found in the call set
By clicking on the last icon, a user can start an historical report with query parameters matching the realtime page parameters that
generated the selected row.
7.7. Using Locations
You can also assign each agent to al Location, i.e. a group of agents working together that you want to monitor as an unit. They might be
a supervisor’s team, or people working in the same building, or maybe in the same location for big multinational call-centres. This way you
can avoid being cluttered with information about all agents working on the selected queue(s)and only see those you are actually interested
in.
Note that when you filter by agents or locations you may see calls being queued and then disappear. This happens because all calls that
wait to be answered on a queue are shown, but answered calls are shown only if the answering agents is a member of your defined filter
conditions.
Imagine you have two groups of agents, one working in NY and the other one in LA. You are the supervisor of the NY group, so you are
filtering by location. You see a call entering your queue and then disappear. The reason why might be that it was answered by someone in
LA, so QueueMetrics filters it out for you.
It is also possible to have QM ask for a location to be selected in any case for Real-time reports. As locations can be key-protected,
this is a handy way to determine which agents can be seen by which supervisors. In order to enable this feature, you must set the
realtime.assignedLocationsOnly property. When this is set:
• When a user enters the real-time screen, the dash that means "Any location" is not shown anymore and the first location they have the
grants to see is be selected.
• If a user has no grants to see at least one location, an error message is raised and they are not able to enter the real-time screen
95
The real-time status panel
7.8. Unattended call and VNC monitoring
It is possible for you to set up both Unattended Call Monitoring and VNC Monitoring.
Unattended Call Monitoring makes it possible to listen to an ongoing call from an agent; by clicking on the small telephone-shaped icon,
that will appear moving the mouse under the wizard icon, a popup will be shown where you may enter your current extension or PSTN
telephone number.
As soon as you confirm the entered data, your telephone will ring and you will start listening to the ongoing call between the selected agent
an the caller.
In order to set up this behaviour, please see the section Section 24.8, “Listening to live calls: Unattended Call Monitoring”. It is possible to
use different PMs to handle different audio needs - see Chapter 22, Listening to calls using Pluggable Modules (PM).
It is also possible to set up the system in order to allow the real-time monitoring of the agent’s screen using VNC. If this feature is enabled,
a small screen will appear close to the agent’s name; by clicking on it, your selected VNC application will be launched and you will be
monitoring the agent’s screen.
In order to set up this behaviour, please see the section Section 24.9, “Enabling VNC Monitoring” of this manual.
7.9. Real-time performance considerations
Running a large set of real-time pages / wallboards may impose a significant burden on a QueueMetrics system. But sometimes you have
no choice. The best way to run them is to:
• Use SQL or CLUSTER storage types
• Set the beginning of the analysis to the minimum usable time. For example, QM usually runs the real-time report since the last midninght,
but sometimes a sliding window of (say) 8 hours might be equally effective in your scenario and require a fraction of the load. You control
this by setting the realtime.startHour property
• Turn on row caching - this allows QM to keep cached and pre-processed copies of objects it needs to run the Real-time and Agents
Page. This may offer a significant speed up, ofter by an order of magnitude, and will reduce database load. You turn on this feature by
setting realtime.useRowCache to true.
• Tune Java memory for maximum performance - see the Advanced Configuration manual.
7.10. The real-time live page
The real-time live page can be accessed by clicking on the "Live" tab next to the "Realtime" tab.
96
The real-time status panel
This page is not built from the queue_log data as all other information reported by QueueMetrics, but it' s read right from each Asterisk
box’s Manager interface. So what you see in this page is the status of each Asterisk box, as reported by itself.
This feature is still less developed than the Realtime page, but still can be pretty useful.
7.11. The top panel
On the top panel, for each queue on each server, you will see the following pieces of information:
• Tot: the total number of agents available for this queue
• Free: the number of free agents
• Pause: the total number of agents on pause
• Talking: the total numbers of agents who are in conversation at the moment
• Other q.: the number of agents that are logged in to this queue and some other queue, and are at the moment busy on another queue.
• Logoff: the number of possible agents that are defined for this queue but are not logged on at the moment.
• Length: the current queue length, i.e. how many calls are waiting in line before being connected to an agent
• Max wait: the current maximum wait time for this queue.
7.12. Calls being processed
In the calls panel you see the following pieces of information, sorted from oldest to newest by call start-time:
• Server: the server that is handling this call
• Queue: the name of the queue
• Caller-id: the caller-id of this call, if any
• Wait: the wait time (if the call is not connected)
• Talk: the total duration (if the call is connected)
• Q.Pos: the queue position (if the call is waiting)
• Agent: the agent handling this call, if connected
• Entered: the time this call was queue
97
The real-time status panel
• Status: the call status
The Wait and Talk times cannot be distinguished at the moment.
7.13. Agents currently logged in
In the agents panel you can see the following pieces of information:
• Server: the server your agent is logged on to
• Agent: the agent
• Status: if the agent is free, paused or on call
• Logon: the time this agent logged on
• Queues: to which queues is this agent connected at the moment
7.14. Server status
The last panel details the status of each server making up the cluster. If a server is not correctly set up, it will appear as KO.
• Server: the server that QM is polling
• Status: OK - the server answered correctly; KO - it was impossible to retrieve information from this server
• Time: how much querying this server took. If this value goes up all of a sudden, your server is likely experiencing overload.
7.15. Enabling the real-time live page
To enable the real-time live page you must do the following:
• Make sure that your users have the RTLIVE security key
• Make sure you have a clustering set up and the manger interfaces are set correctly. You can even not use clustering for reporting,
though the manager interfaces will be read through the cluster.*.manager properties.
• Make sure that Asterisk has the manager API enabled, and that your IP address, login and password are correct. E.g.
tcp:dial:[email protected] will tell QueueMetrics to connect to the manager port on server 10.10.3.100 and use the user dial with
password bingo to log on.
7.16. Help! My Real-time and Live pages display different
results!
In this case most likely the Live page is correct. This is due to the fact that sometimes Asterisk will not log some events correctly, and so
the status of the call-center inferred from the queue_log file may end up not being correct.
If this happens to you:
• Log agents off and on again
• Check that Asterisk is correctly installed
• Check that error queue exist (e.g. timeouts) log their status correctly
• If you think that what QM shows on the Live page is wrong, you can get a trace of the dialog involved by setting the property
manager.dump. See Appendix D, System preferences.
98
Chapter 8. The real-time agent page
QM lets each agent have his/her own page, where they can see the current flow of calls they have just answered and launch external
CRM web apps. Since release 14.0.6 QueueMetrics includes a new real-time page based on movable resizable and draggable panels.
Information on this page is on Section 8.7, “The new Realtime Agents Page”.
This is quite useful, because the agent can:
• see their own status, i.e. whether they’re logged on or they’ve been disconnected;
• see their last calls, including information like Caller ID, duration and waiting times;
• see from which queue the call is coming, even if they lost the announcement message;
• launch external web apps - like CRM software - that might be automatically linked to the Caller-ID or other information input by the caller
• read the messages broadcasted to him
• start a new conversation calling a phone number
• have a subset of AGAW information
• track information about the current call on QA forms
Also, it is possible to use this page in order to:
• Log the agent on and off to Asterisk and/or a specific queue
• Pause and un-pause the agent, entering the pause activity code if needed
• Set the outcome code for each call
To avoid excessive consumption of system resources on big centres, only the most recent part of the log file is processed and so only a
few calls are shown.
In order to use this feature, a user must be configured as having the same login as the Asterisk agent string (e.g., "Agent/101") and it must
hold the key AGENT. Our suggestion is to use the same set of credentials the agent uses to login to the Asterisk system.
When the agent logs on - you can try this by using the demo account Agent/101, password 999 - s/he sees a reduced home page like the
following one:
As of release 12.10 the Agent page includes a Home button that allows to get back to the above agent web page at any stage (no security
key or property are required to enable this feature) and one or more reporting options selectable by queue, report type and durations.
Agents enabled to access to Icon Section 8.7, “The new Realtime Agents Page” and logging in to QueueMetrics starting
from release 14.10.5 will be directed to their realtime page instead of their home page. This feature could be disable by
99
The real-time agent page
mean of a default configuration key set to the configuration.properties fille. Please see Appendix D, System preferences for
further details.
This block of reporting functions is made visible for agents by enabling the SSAREPORT key within the user configuration/administration
page (Cfg Users tab), which can be reached by selecting the Edit users link form the main QueueMetrics administrator Home page. An
agent can run a report based only on the queues and reports assigned to him/her. The agent does not have a Search button enabled, so s/
he is not able to access any kind of Custom Reports. The reporting can be run directly from the agent web page.
See section Chapter 21, Editing QueueMetrics settings for further details.
By clicking on "Show inbound calls", the agent is led to the inbound calls page:
This page tells the agent that he’s logged on and shows the last calls he has handled. This page lists also a subset of AGAW information
related to the logged agent. In this case we see that there is an ongoing conversation and many previous calls.
On top of the page a field tells the agent whether s/he is:
• Logged on: ready and able to take or make calls;
• Logged on queues: followed by the list of queues the agent is dynamically logged on through the Add Member button;
• Logged off: the agent has voluntarily left or has forcibly been disconnected by the queue system;
• On pause: the agent has asked for a pause from the queue system;
• Undetermined: whether there is no relevant information to tell the agent status in the last part of the log file.
The fields the agent can find in the call list are as follows:
• Entering at is the date and time the call entered the queue system;
• Waiting is the waiting time before being connected to the agent;
• Talking is the talking time for that call. If the call is ongoing, the time will be estimated and written in red.;
• Caller ID is the call’s identification, if available;
• Queue is the queue handling the call;
• URL is a clickable link that opens a third party CRM app. The agent opens the third party CRM app by clicking on it, or QM can open it up
automatically the first time the URL is presented. If the URL contains bracketed placeholder sequences, they are expanded (see below)
• Status is whether the call is ongoing or terminated;
• Transfer is the extension the call was transferred to (if any).
• Outcome is the call outcome that the agent can set for this call. This must be set within a maximum timeframe of 30 minutes from the
moment the call enters the queue; after this given period the call outcome cannot be added as the icon is no longer present.
• QAForm This icon allows specific agents to access the QA form for the call, but only if such agent holds the QA_TRACK key.
100
The real-time agent page
After the call list table, if enabled by configuration as explained in Section 21.24, “Configuring system preferences”, a table lists the AGAW
information related to the atomic queues the agent is working on. For more information about the AGAW subsystem, please refer to
Chapter 11, The Agent Awareness subsystem (AGAW).
To avoid hammering the QM server with excessive work, only the last piece of the log is analyzed. This parameter can be fine tuned by the
system administrator in order to maximise usefulness without creating an excessive server load (see Section 21.24, “Configuring system
preferences”).
Whenever an agent receives a call, s/he should press the "Reload" button on the page in order to see the incoming call. If you use a SQL
storage mode, you can enable Section 8.4, “Auto-refreshing the agent’s page: Active Polling” in order to have the page reload automatically
when a new call is detected.
The page reloads automatically every two minutes in order tomaintain the user logged on in QM.
Each time the call history changes, and if there is an URL associated to the call shown on top of the list, a new window will automatically
be opened pointing to the specifig URL. This feature could be disabled modifying the value associated to the configuration key
realtime.agent_autoopenurl as specified in Section 21.24, “Configuring system preferences”.
URLs are passed to the Queue() command in Asterisk, or - if missing - they can defined in the QueueMetrics queue configuration as a
default. They can include a set of placeholders that are expanded with the details of the call being handled, as in the following table.
Placeholder
Meaning
[A]
The agent’s numeric code, e.g. 101 for Agent/101
[U]
The call’s Asterisk UniqueId
[S]
The Server ID (for clusters)
[Q]
The name of the queue
[T]
The timestamp of the call
101
The real-time agent page
Placeholder
Meaning
[C]
The caller-id, if present
[D]
The DNIS, if present
[I]
The IVR Path, if present
[O]
The outcome code, if present
[P]
The position in the queue, if present
[M]
The attempts, if present
[TAG]
The call tag, if present
[F:x]
If the call has a feature called x, the text of feature x;
otherwise blank.
[FX:x]
If the call has a feature called x, it is set to 1;
otherwise 0
[V:x]
If the call has a variable called x, the value of x;
otherwise blank.
If the URL is being recomputed with a different value, it will be reopened automatically. This may or may not be what you
want.
8.1. Using the agent’s page to control advanced features
The buttons on the agent’s page can be used to log agents on and off, to dynamically add or remove them to one or more queues, to dial a
phone number, to pause and unpause them and set the call status. Each button could independently be enabled or disabled changing the
associated key value in the configuration. When pressed, each button will open up a pop-up window asking for details:
As of QM release 12.10 it is possible to set input validation for both the agent code and the extension. As an example, by setting the key
realtime.agentRegexp=1\\d\\d you are defining that the agent code must start with a one and cannot be more than 3 digits, while by setting
the key realtime.extensionRegexp=\\d\\d\\d\\0 you define that the agent extension must be four digits and must end with a zero. Please
note that the backslash in the regexp has to be written as \\ in the configuration.properties file.
Once the user clicks on Run, the command will be sent to the Asterisk server and the page will be reloaded. It is possible that on very busy
machines the commands may be delayed a few seconds, so that it is necessary to reload the page manually in order to check that the
command has run successfully.
Please note that for this to work it is necessary that Asterisk has been configured to manage Agent actions - it will NOT work on
an Asterisk server that’s not been specifically configured to work with it!
See section Section 24.10, “Enabling Agent’s page actions” in order to set up this feature.
If you want to have agents logging on, it is mandatory that the underlying Asterisk agents are defined without a password.
8.2. Self-service agent reporting
It is now possible to allow agents to run specific reports directly from the agent page. These new features are available as of QueueMetrics
version 12.10 and are already enabled for the included sample agents. In order to configure other agents having the same functionalities
available, the following steps need to be implemented:
• Assign a queue (or a set of queues) to the agent
102
The real-time agent page
• Assign a new report to the agent
• Assign the SSAREPORT key to the agent
1. To assign a queue to an agent, select Edit queues from the Home page, select the Assign reports to agents icon, select the check-box
next to the chosen agent. Save to confirm.
2. To assign a report to the agent, select Edit reports from the Home page, select the Assign reports to agents icon, select the check-box
next to the chosen agent. Save to confirm.
3. To assign the SSAREPORT key to the agent, select Edit users, select the pencil icon, add the key to the User keys field. Alternatively,
it is possible to assign the SSAREPORT key to all agents by editing the agents class by selecting Edit users from the Home page,
select the Show classes button, select the pencil icon of the Agents class and add the SSAREPORT key in the Keys field.
This new block of reporting functions is made visible for agents by enabling the SSAREPORT key within the user configuration/
administration page (Cfg Users tab), which can be reached by selecting the Edit users link form the main QueueMetrics administrator
Home page. An agent can run a report based only on the queues and reports assigned to him/her. To assign queues to an agent you have
to select the Edit queues link from the QueueMetrics administrator Home page and select the Assign reports to agents icon next to the
queue you want to assign. This will take you to the page where you can simply assign the queue to the chosen agents.
When assigning reports, the same criteria applies as assigning queues, where we access the report configuration page from the Edit
reports link on the administrator Home page. Selecting the Assign reports to agents icon takes to the page where you assign the selected
report to each agent.
An administrator can also assign the maximum amount of time that an agent can have available, when viewing historical reports from the
agent web page. The key default.ssarMaxReportPeriod is defined within the configuration.properties file. If this key is not present within this
file, then the default time is 15 (days).
103
The real-time agent page
When an agent runs a report, the agent does not have a Search button enabled, so s/he is not able to access any kind of Custom Reports.
8.3. Real time agent’s page customizable buttons
It’s possibile to have a maximum of four buttons fully customizable in the realtime agent’s page. These buttons could be used to:
• Open a new browser page
• Dial a predefined extension.
By changing some configuration settings, each button can be:
• Enabled/Disabled globally
• Have a custom label assigned
• Have an URL specified. If [A] or [U] are specified inside the URL, QueueMetrics will expand it with the numeric Agent code or with the
Unique Call ID of the last call processed (if present, otherwise Unspecified will be used).
• As an alternative to the URL, have two Asterisk call legs specified that will be dialed when the button is pressed. The placeholder [A] is
exanded - if present - with the numeric Agent code.
The image below shows the buttons in action.
To have more details on the configuration settings involved, please read the Appendix D, System preferences.
In the following example, the first two buttons will open an external web page; the third one is disabled and the fourth could be used to
start a call to the secretary. When a button is associated to a dial action, when pressed, it will be highlight in yellow as shown in the picture
below.
Please note that buttons will be hidden if there is not at least one button enabled. To have more details on the configuration key details,
please read Appendix D, System preferences.
8.4. Auto-refreshing the agent’s page: Active Polling
In default mode, QueueMetrics asks for an agent to push the Reload button on the agent’s page in order to refresh the page. This was
needed to avoid hammering the server with hundreds of requests at once.
104
The real-time agent page
Since QueueMetrics 13.04, it is possible to have the agent page reload automatically when running the Row Cache; and you can therefore
have a screen-pop that is completely automated. The idea is that a very lightweight transaction is run to check whether there is new data
that might involve the agent; if there is, a page refresh is performed an all data is recomputed.
The following preferences must be set in configuration.properties:
realtime.useActivePolling=true
realtime.ajaxPollingDelay=5
realtime.useRowCache=true
realtime.agent_autoopenurl=true
As this setting depends on the Row Cache - see The Row Cache Section 21.26.4, “RAM cache inspector” - is is mandatory that you use a
SQL-based storage type.
to confirm that Active Polling is working, look at the date and time value on the bottom right corner of the agent’s page.
When Active Polling is working, you should see it change every few seconds.
8.5. Gathering call information through agent-side QA forms
QA forms - described in detail in Chapter 13, Advanced tracking of agent and grader performance - can be used on the agent’s page in
order to gather generic information about the current call. They may act as a kind of embedded database of calls that is accessible for
reporting within QM itself.
In order to turn on the filling of QA forms by agents, you need to:
• Make sure your agents hold the QA_TRACK security key. You might consider adding it to the Agents class.
• Create special QA forms to be used by agents. You can use security keys to make sure that your agents have access only to the forms
they are supposed to see, versus forms used for "proper" QA tracking by QA specialists
• Create form items made of multiple-selection or "Yes/No" questions
• In agent’s forms, all or most questions will be non-scoring, as you are gathering information and not evaluating an agent’s behavior
• QA forms can have multiple sections that turn on or off based on the answers to other questions. Questions can also be made optional.
• You can associate free-text comments to QA items by clicking on the pencil icon on the right-hand side of the question
8.6. Agents Page performance considerations
Running a large set of agent pages may impose a significant burden on a QueueMetrics system. The best way to run them is to:
• Use SQL or CLUSTER storage types
• Set the lookback period to the minimum usable period - you control this by setting the realtime.max_bytes_agent property to the number
of seconds it must look back. For example, if your agent shifts are of 6 hours, you could use a number between 22000 and 25000.
• Turn on row caching - this allows QM to keep cached and pre-processed copies of objects it needs to run the Real-time and Agents
Page. This may offer a significant speed up, ofter by an order of magnitude, and will reduce database load. You turn on this feature by
setting realtime.useRowCache to true.
• If you use Active Polling, try and increase the polling delay.
• Tune Java memory for maximum performance - see the Advanced Configuration manual.
• Consider AGAW as an alternative to running thousands of agents pages at once.
8.7. The new Realtime Agents Page
Since release 14.0.6 QueueMetrics includes a new real-time page based on movable resizable and draggable panels. The new page is
available for agents holding the key NEWAGENTPAGE.
Using the new page has several advantages:
• Draggable and resizable panels for each main activity. This ensures only the options used by the agent are visible on the page.
• Integrated soft-phone, WebRTC enabled (currently working only on Chrome browsers and Asterisk11+Webrtc2sip or with Asterisk12)
allows agents to receive and generate calls without an external SIP phone.
105
The real-time agent page
• Whole integration with an external CRM and/or other custom web pages.
• Easy login/logout and pause/unpause procedure.
• Per agent layout customization with sessions persistence.
• Keyboard shortcuts help to open/close most of the panels.
The first time an agent enters the real-time page he sees something similar to the below picture:
At the top of the page there is a menu bar. On the right side there is an icon representing a letterbox. By clicking on this icon the agent can
show/hide a panel containing the most recent received messages. If the panel is not visible and the agent receives a new message, the
icon starts blinking. The message panel could be accessed through Alt+9 keyboard shortcut
On the left side of the current agent name there’s a tooltip, appearing via mouseover, that contains the agent session details. The agent
status contains a bullet that defines the status of the agent with different colors, as per below scheme:
• black: the agent status is unknown. This could happen if the last agent activity is outside of the configurable analysis timer used by
QueueMetrics to retrieve agent information.
• green: the agent is logged in on at least one queue
• purple: the agent is logged out from all queues
• red: the agent is currently paused
At the right side of the menu bar there’s the dropdown menu shown in the below picture:
106
The real-time agent page
The dropdown menu allows the agent to access all the different panels:
• SoftPhone
• Call Status
• Call List
• Agent Logon
• Pauses
• Dialout
All the panels can be accessed by clicking on the associated menu row or through the keyboard shortcut combination key as specified
in the menu (i.e. Alt+1 for softphone panel). If properly configured, the dropdown menu allows to select a web page that will be shown as
background. This is the case, for example, of an external CRM page or Company intranet pages.
8.7.1. The integrated soft phone panel
Keyboard shortcut: Alt+1. The new real-time agents page integrates a softphone based on the sipml5 project. This softphone is proved
running properly with Chrome browser and Asterisk11+webrtc2sip or Asterisk12. The softphone automatically registers to the SIP/WebRTC
server with the SIP credentials specified in the user administration page and a green bullet is shown in the softphone panel. The agent can
start calls typing the number to be dialed then clicking on the "Start Call" button.
Each time the agent receives a call from the queue, the softphone pops up and the "Start Call" button blinks red. Clicking on the "Start
Call" the agent could answer to the call. During the call touch tones could be sent by clicking on the dial pad provided in the panel. Since
QueueMetrics 15.02 the softphone shows the callerId SIP username (usually this information matches with the incoming caller ID).
For more information on how to configure the softphone, please refer to Section 21.21, “Configuring the new Real-time Agents Page” and
Section 21.4, “Configuring agents”
107
The real-time agent page
The softphone uses the local PC microphone. Chrome security policies allow permanent use of the local microphone only
for sites secured with HTTPS. Please make sure your QueueMetrics instance is running over secured HTTP and relax all
security policies for the QueueMetrics URLs. This could be done by clicking on the shield located in the Chrome URL bar
and selecting "allow not secure scripts for this site". Be sure to allow microphone usage for the QueueMetrics URL at the
very first call.
8.7.2. The call status panel
Keyboard shortcut: Alt+2. This panel reports a summary of current ongoing call.
8.7.3. The call list panel
Keyboard shortcut: Alt+3. It reports the list of most recent calls. Each row is associated with a call. The agent could find, for each call, a set
of clickable icons useful to open the URL associated to the call (if any) or to open the outcome or the QA form panel (see below).
Calls are chronologically ordered and the first row is yellow marked for live calls. The icon shown in the first column reflects the queue
direction (inbound or outbound calls). Since QueueMetrics 15.02 the list reports also outbound calls that are not answered by the calleed
(like the second call in the example below where the talking period is null). Since QueueMetrics 15.04 agents can schedule a redial for a
specific call through WombatDialer integration. To do this, a recall scheduler panel can be open by clicking on the icons at the very right
side of each call reported in the list. Since QueueMetrics 15.09 the list reports call tags and feature codes. When flying over the outcome
column, a popup with optional notes associated to feature codes is shown.
8.7.4. Agent logon panel
Keyboard shortcut: Alt+4. The Agent logon panel is used to handle the login and logout process. The panel reports two lists of queues. On
the left side there is the list of queues where the agent could login; on the right side there is the list of queues where the agent is already
logged in. To login/logout to a queue or a set of queues, the agent must select the queue(s) from the correct list then click on the proper
button located in between the lists. Based on the direction defined by a set of arrows on each button, the login (from left to right) or logout
(from right to left) process is performed. The agent can login/logout on all the assigned queueues or on all the available queues with a
single click through the arrow/line or double arrows labeled buttons
108
The real-time agent page
In order to login/logout, the agent must compile the Agent Code and the Current Extension fields (available in hotdesking mode). If
not properly specified, the fields will be marked red and no login/logout processes are triggered. The Agent cannot change their Agent
Code and Current Extension fields if already logged on a queue (this feature may be disabled setting a specific configuration key, see
Appendix D, System preferences for realtime configuration parameters).
The Agent logon panel lets the agent able to switch between multiple servers (only for cluster mode).
8.7.5. Pauses panel
Keyboard shortcut: Alt+5. The Agent can pause and unpause itself by selecting the appropriate pause code from the dropdown list then
clicking to the Pause button. The Agent can teminate the pause by clicking on the Unpause button.
A pause can be associated to an undefined code only if specified by a configuration key set, otherwise the agent must
always specify an appropriate pause code before clicking the Pause button.
8.7.6. Dialout panel
Keyboard shortcut: Alt+6. The dialout panel is used to start a call through an outbound queue. The dropdown in the panel reports only the
outbound queues where the agent is already logged in.
109
The real-time agent page
An agent can start a call by typing the number in the text field, then selecting the appropriate outbound queue from the dropdown and
clicking on the "Dial" button. If the softphone panel is enabled it will pop up with the "Start Call" button blinking red. The Agent must click on
this button in order to start the call.
8.7.7. Custom Web panel
Keyboard shortcut: Alt+7. The custom web panel is used to embed a user defined external website or custom intranet pages. The panel
is refreshed each time it’s selected and/or moved. Target for this panel is to allow integration with custom implemented indicators and/or
messages. For complex external pages, or for pages where spurious refreshes should avoided, please use the custom background (see
below) instead of this panel.
The panel is optionally enabled by modifying the configuration keys realtime.agent_webpanel1_url and realtime.agent_webpanel1_label
located in the configuration.properties file.
For technical reasons is not possible to handle keyboard shortcuts if the current keyboard and mouse focus is associated
with this panel. It’s recommended to click on a different panel or the menu bar in order to take the focus before using again
keyboard shortcuts.
When QueueMetrics is operating by an HTTPS secured server, be sure to provide the panel contents too over HTTPS, or
instruct the Agent browsers to allow mixing unsecured HTTP contents on secured pages.
8.7.8. QA Form panel
QA grading is available through the QA form panel by clicking on the proper icon associated to the call list for a specific call. This panel is
the exact copy of the "old" QA form panel so the Agent can still perform every action available through the old form.
110
The real-time agent page
QA grading is enabled only for agents holding the security key QA_TRACK
8.7.9. Outcome code panel
Each call can be flagged by an outcome code and, if the enabled, by a set of feature codes. This could be done through the outcome panel
reachable by clicking on the related icon in the call list panel. To assign an outcome code, the Agent should select it from the dropdown,
then click on the Run pushbutton. If feature codes are enabled and available, they are shown in the lower part of the dialog. Available
feature codes, associated with current assigned outcome, are shown in the dropdown. To add a feature code, a user should select it from
the dropdown list, add an optional note on the textbox placed on the very right side, then press Add button. As soon as the feature code
has been added, it will be shown in the list on the lowest part of the dialog. Each feature code has its own red cross mark that can be used
to remove the specific feature code by clicking on it. Multiple feature codes can be added to a single call. If same feature code is added
several time to a specific call, only the last version will be shown in the reports.
111
The real-time agent page
The feature code sub-panel is not shown if not enabled by system configuration. For more documentation, please see
Asterisk interactions on Appendix IV Appendix D, System preferences
The outcome panel is enabled only for agents holding the security key USR_OUTCOME
8.7.10. Recall Scheduler
If WombatDialer is available and the queue is properly configured, agents can ask for a redial on a specific call by mean of this dialog.
Scheduling a recall is done by selecting the number to be dialed (this field is already populated when opening the dialog, but can be
changed by the agent if needed), the scheduling time and the WombatDialer campaign. An optional note can also be added; notes will be
sent to the WombatDialer toghether with the rescheduling information. For details on how to configure the selectable campaings, please
refer to Section 21.3.3, “Configuring redial services through WombatDialer” and the Appendix D, System preferences
8.7.11. Custom Backgrounds
The background of the working area in new real-time page can be customized with up to tree different URLs pointing to external websites.
Each background can be selected by clicking on the left dropdown menu and/or through the keyboard shortcuts ALT+B (for the first
background) or ALT+Q or ALT+W (for the second and the third background). The first background is something different from the other two
backgrounds because it’s aimed to be used by an external CRM subsystem. If properly configured, each time an Agent answers to a call,
the first background is automatically selected reflecting the information associated to the new call. This is useful for retrieving information
about the caller. The Agent can promote the first background to be placed on top of the panels through the keyboard shortcut ALT+0.
Reverting to the normal operation is accomplished by clicking on the menu bar in the area located between the left menu icon and the
QueueMetrics logo.
For technical reasons is not possible to handle keyboard shortcuts if the current keyboard and mouse focus is not
associated with a panel but with the background. It’s recommended to click on a panel or the menu bar in order to take the
focus before using keyboard shortcuts.
112
The real-time agent page
When QueueMetrics is operating by an HTTPS secured server, be sure to provide the background contents too over
HTTPS, or instruct the Agent browsers to allow mixing unsecured HTTP contents on secured pages.
113
Chapter 9. Tracking IVR data
Since QueueMetrics 13.03, IVR information is tracked natively within QueueMetrics.
IVR information is different from queue information, as:
• IVR data is typically tracked before a call hits a queue, and bears no queue information. So IVR calls might be ancestors of any call in the
system.
• If you know happen to know from the start of the call that a particular call belongs to a more specific area, you may want to track this
immediately so that this IVR call will not appear on "unassigned" calls (see below for more information).
• IVR data is made up of multiple IVR menus, each of which may have a selection, that is a digit pressed by the caller in order to
progress forward.
• An IVR Path is a unique sequence of IVR menus that lead to a destination
• IVRs may define goals, that is activities that don’t lead the caller directly to a queue but are tracked as they satisfy, in a fully automated
manner, the needs of a caller. For example, when a caller reaches the TTS menu reading back their current account amount in your
banking IVR, that is usually a goal you want to track.
• If a call is still in the IVR phase at the end of the analysis, without having reached any goal or having hung up, it is considered hung up
just after the last known event.
IVR tracking requires changes to the current dial-plan of Asterisk in order to track the required information. Such changes - detailed in
section Section 9.2, “Implementing IVR tracking” - are not complex to implement, and are implemented natively in the QueueMetrics
module of FreePBX. So if you use a common Asterisk distribution, chances are you already have IVR tracking available.
9.1. A call’s life-cycle
When a call is tracked withing QM, it may traverse the following tree:
As you can see, QM defines three time periods about a call:
• the IVR Time, that is between when a call is first tracked and when it hits a queue. For calls that do not have any events before hitting a
queue, it is always set to zero.
• the Wait Time, that is how long a call has been waiting on a queue before being answered or hung up
• the Talk Time, that is the length of the conversation between the agent and the caller.
9.1.1. IVRs and QueueMetrics
QueueMetrics handles IVRs when running reports by filtering all calls by the set of queues specified in the report. As IVRs have no queues,
all IVRs are processed for the time period requested. IVRs that end up on queues different from the ones being reported on are reported as
"lost".
IVR activity usually takes place before the call is queued. Filters on IVRs, DNIS and caller-ids are correctly applied to the analysis if
specified (so you can drill down an IVR analysis on a specific selection path or on a caller / called number).
What you get out of an IVR analysis:
• Tracing IVR paths: the report Section 6.13.1, “IV01 - IVR Traversals”. This way you can see which paths were traversed, how many calls
went through each path and what happened to them. This is very useful as it is the key to understanding attrition - people hangin up
without having reached a goal.
• Tracing IVR timings: the report Section 6.13.2, “IV02 - IVR Timing”. By understanding the timing statistics of each IVR menu, you
can improve the user experience by making often-accessed items higher on the menus and on top of the tree. This improves user
satisfatction and saves circuit usage.
• Tracing IVR goals: the report Section 6.13.3, “IV03 - IVR Goals”. For each goal, what path traversal tree was followed, how much it took
for it to be traversed as average / min / max times.
• IVR call details: all calls that were not queued are availble in the IVR call details, under the codes Section 6.2.4, “OD04 - IVR details
(paged)” and Section 6.2.5, “OD05 - IVR details (full list)”.
The detailed description of each data block is visible in the relevant manual section.
114
Tracking IVR data
9.1.2. Using IVR areas
Considering an IVR call as a possible ancestor of any queued call on the system is often overkill. Very often you are able to tell - for
example, based on the DNIS or the caller-id - the "area" that the call pertains to. If this does not happen, calls tracked at the IVR level do
not belong to a queue but are possible ancestors of any queue â## and therefore appear in the IVR and attrition reports for any queue.
Though this requirement is formally correct (as the main reason for having an IVR offered is routing the caller into the correct queue) it
often happens that at some point during the call life-cycle, before the call is connected to a queue, you can determine an â##areaâ## of
interest that may or may not be a specific queue.
For example, if your call center services multiple clients, you will likely have a separate DNIS for each. When that DNIS is called, maybe
you do not yet know if the call will be connected to "client7-sales" or "client7-support", but you are sure that it will be for "client, so it will be
inappropriate to show that call as a general untagged ancestor to any call queued on the system.
9.1.3. Tagging calls by area in the QueueMetrics security system
The QueueMetrics security system is built so that only information pertaining to the queues an user has express permission on are
accessible for reporting or monitoring.
As the unit of access is the queue, we had find an access token that acts "as-if" it was a proper queue. We call this "area" and we will log
this to the queue_log in the general queue field.
This makes it possible to decide on which areas the reports should run by adding the areas to the allowed queues for a specific report, as
you would generally do when creating a composite queue.
For instance, to implement the example above, you might be reporting on a composite queue defined as "ivr-client7|client7-sales|client7support".
A call starts it life-cycle by belonging to area NONE, then starts belonging to an area as soon as one is specified, and starts belonging to a
queue as soon as it hits one. Neither behavior is reversible.
The following visibility rules apply:
IVR call - area = NONE (c.1) IVR call - area set (c.2)
IVR call - queue reached
(c.3)
Any report for any queue
Visible
-
-
Reports for destination
queue(s) only
Visible
Not Visible
Visible
Reports for area(s) and
destination queue(s)
Visible
Visible
Visible
The initial QueueMetrics IVR tracking only implemented columns #1 and #3 of the table above. By adding the "areas" as in column #2:
• Existing systems are backwards-compatible; the behavior does not change unless you specify an area for a call;
• You are free - if you want - to specify an area immediately, so that the behavior specified in column #1 does never happen on your
system.
9.1.4. Using areas
The following general rules apply to areas:
• A call is displayed in QueueMetrics as belonging to the last area or queue it was showing at its termination or by the end of the requested
time-frame.
• An area is set on the first call verb having an area different from NONE. This may or may not be the first tracking verb on the call.
• You cannot specify an area of NONE after a call had an area specified. This behavior is implemented in order to avoid logging the area
on each IVR key-press on manually-created dial-plans. If you do, the area is not changed
• If you specify a different area for the call, the new code replaces the old one.
• When a call finally enters a queue, the queue code replaces the area code
The area name might be any valid name in Asterisk (lowercase ascii7 string, not containing spaces or pipes). Uppercase names are
automatically lowercased upon reading. It is perfectly allowable to use the very same code for a queue and an area.
We suggest using name similar to "ivr-abc" in order to make it clear it is not a normal queue.
In cases where the IVR tree is extremely complex, you might want to specify multiple areas for the same call. In this case, when you run a
report, you must specify all the different areas that make up your IVR tree as the allowed queue(s) for the report. As always:
• Any call which final state was without an area will be visible in all reports.
• Any call which final state is in a certain area is only visible to users having that area defined as a possible queue
115
Tracking IVR data
9.2. Implementing IVR tracking
In order to track IVR data, we need to tell QM a few bits of infromation:
• When a digit is pressed, the time-stamp when the event happens, the digit pressed and the name of the IVR menu. These are logged
through the verb INFO-IVRAPPEND
• When a call is started, you may want to log the moment when the call reaches the PBX; the calling number and optionally the calling
DID. This is done through INFO-IVRSTART and it is optional
• When a goal is reached, you may want to log the name of the goal. This is done through INFO-IVRGOAL and it is optional
• When a call is hung up in the IVR, you may want to log this information in order to have detailed IVR timing. This is done through INFOIVRHANGUP and it is optional.
Before QueueMetrics 13.03, QueueMetrics used to track IVR sequences as one single record containing the digit sequence
and optionally a second entry tracking IVR wait time. Though this is still recognized by QueueMetrics, it is impossible to run
traversal analyses on such data as the required information is not present.
9.2.1. Dial-plan tracking
In order to implement dial-plan tracking, the unique-id logged must match the unique-id of the call leg that will reach the queue.
In order to track the beginning of a call, you should produce an INFO IVRSTART record like the following one:
1353461650|1353461627.33271|NONE|NONE|INFO|IVRSTART|1234|5556777
This way you track both the caller-id of the caller ("1234" in or case) and the DNIS the call came though ("5556777" in our case). You may
leave either field blank if that information is not needed.
The record above is optional - if it is missing calls will be tracked from the first IVR menu, and the traversal time for that IVR menu will be
set to zero.
In order to track an IVR digit, you would use the following format:
1353461660|1353461627.33271|NONE|NONE|INFO|IVRAPPEND|1|ivr-2
In this case, we tell QM that the key 1 was pressed in IVR "ivr-2". The IVR event duration (that is, how much it took the caller to make a
selection) is automatically inferred from the end of the previous event. If this is not the case, you have an option to pass it explicitly to QM
as the last paramenter (6 seconds in the case shown):
1353461670|1353461627.33271|NONE|NONE|INFO|IVRAPPEND|1|ivr-2|6
If a goal is reached, you should mark this by producing a record like:
1353461680|1353461627.33271|NONE|NONE|INFO|IVRGOAL|attendant3|ivr-2|6
The goal in this case is called "attendant3". The IVR name is optional an not currently used. The explicit timing duration is optional.
A call can have only one goal. Any call hitting a queue is considered to having reached a goal.
In order to tell QM that a call hung-up in an IVR, you should produce a record like:
1353461660|1353461627.33271|NONE|NONE|INFO|IVRHANGUP|
9.2.2. Tracking areas
The logging is changed so that the INFO verbs allows the reading of this piece of information. So any sub-verb (e.g. INFO DNIS, INFO
IVRSTART, INFO IVRAPPEND and more) will work correctly with this.
An example of logging might be:
1345678|1234.5678|IVR-1|NONE|INFO|IVRSTART|1234|12345
This logs the IVRSTART as belonging to area IVR-1.
It is perfectly valid to assign a call to an area from a specific point in time onwards (generally because they made a defining IVR decision)
1345668|1234.5678|NONE|NONE|INFO|IVRSTART|1234|12345
1345679|1234.5678|IVR-3|NONE|INFO|IVRAPPEND|3|MYMENU
As shown above.
9.2.3. Deprecated IVR tracking verbs
The following records are understood by QM but should not be used anymore:
116
Tracking IVR data
1000000|214530.A|sk-fissi|NONE|INFO|IVRWAIT
1000000|214530.A|sk-fissi|NONE|INFO|IVR|345
9.2.4. The FreePBX module
Since FreePBX 2.11 a new module is available on the FreePBX SVN repository. This module allows to easily integrate FreePBX IVR with
QueueMetrics. The module will be published shortly and will be available through the standard FreePBX modules administration page. Till
this date, you could manually install the module following the below steps. In a command shell, type the code:
svn co http://svn.freepbx.org/modules/branches/2.11/queuemetrics
tar -cvf queuemetrics-2.11.0.1.tar queuemetrics/
gzip queuemetrics-2.11.0.1.tar
This generates a queuemetrics-2.11.0.1.tar.gz module you can install on your FreePBX box.
In the FreePBX modules administration page press the "Upload modules" button.
Browse to the queuemetrics-2.11.0.1.tar.gz file you downloaded from the FreePBX repository.
then press "Upload" to store the file on your FreePBX box.
You will find the module in the modules administration page.
117
Tracking IVR data
Click on it then select the "Install" option. Click on "Process" at the bottom of the page.
Then confirm.
At the end of the procedure you will find a new option on the Settings menu.
118
Tracking IVR data
This opens a new page settings where you can enable the QueueMetrics IVR log routines.
119
Chapter 10. QueueMetrics Tasks
Tasks are a general mechanism to send some QM users a set of actions to perform. This could be, e.g. an agent which call has been
reviewed, or a grader knowing that an agent has accepted a task.
Tasks are handled on a separate page that works as a "mailbox" for incoming tasks and lets you check the tasks you generated.
Differently from the way QueueMetrics usually works, tasks also allow for "direct URL linking", so that you can have a short URL that is
published over RSS or email and allows the user access to the task. Before access is granted, anyway, user authentication is performed.
Tasks are strictly typed, that is, you can have only a given set of them. In order to handle a basic one-to-one communication, a generic
Note task is provided.
Tasks are shown on the top of each page generated by QueueMetrics - when you have new tasks, you see a flasing NEW icon. A user’s
tasks are exported over RSS - a RSS icon allows easy subscription by clicking on it.
Unread tasks are also shown on the AGAW page, with a count of the number of tasks outstanding.
Access to the Task subsystem is controlled by the key TASKS.
10.1. The task page
If the user is enabled for tasks, they will see a couple of new icons on the top every page:
The yellow icon leads to the tasks page; if you have new tasks, it is displayed together with a flashing NEW icon.
The orange icons lets you acees a RSS feed for all the tasks for the current user (see below on how to set this up).
When you click on the yellow icon, you are lead to the tasks editor page:
On top of the page, you see a selector with:
• Tasks to be done: tasks addressed to me that I have to complete
• My group: Tasks for my class that I can address
• Tasks I completed: the set of tasks that I completed (and their completion codes)
• Task I sent: The tasks I sent somebody else (if any)
• A box to access directly a task by number (it will be found only if the current user can see it: that is, he is the assignee, or a member of
the group it is assigned to, or the assigner).
You can optionally make the list shorter by selecting:
• A task type
120
QueueMetrics Tasks
• The period the task was supposed to be due
• An option to display future tasks as well
• The Process field which is formed by the Process Family / Process ID and can be inserted only via XML-RPC.
For each task, the following information is displayed:
• An icon displays whether the task is overdue (red), about to be due (yellow) or yet to be due (green)
• The task sender
• The task ID, that is an unique number that lets you access a specific task directly
• An icon for the type of task involved
• The task description
• The due date (if any).
• The status: it can be TBD (to be done) or Completed or Disputed.
The list is paged, so you only see the first 10 elements or so.
When you click on a the pencil icon of a task, it is displayed in a panel like the one below:
This is a QA task; tasks of other kinds may differ slightly in their appearance and behavior.
The top box contains a description of the task; while the bottom box contains a note that can be edited freely.
The following buttons are typical:
• View: in case the task is related to something else (like in this case, a QA form) this button lets you access a form with the related
information.
• Process: the user acknowledges having seen the task
• Dispute: the user acknowledges having seen the task, and disputes the given score
• Edit Note: lets you save the edited Note field.
By the bottom of the page, general information on the task is displayed:
• From: the originator
• To: the receiver
• Created on: the day it was created
• Valid from: the day the task started being addressable
121
QueueMetrics Tasks
• Expires on: the deadline for completing the task
• Last updated: the date this task was last processed
• Status: the current task status
If the task is related to other tasks, a task history table is shown. In this table user could find, for each related task, information about:
• Task Id: the unique identifier of the related task
• From: the originator
• To: the receiver
• Created on: the day it was created
• Valid from: the day the task started being addressable
• Expires on: the deadline for completing the task
• Last updated: the date this task was last processed
• Satus: the current task status
• Abstract: the task title
• Notes: notes associated to the task (if any)
When a user processes or disputes a task, it is possible to ping a specific URL if defined within the property default.tasks.pingURL. Further
details about this property can be found within the System Preferences chapter.
10.1.1. Extended task reports
Users holding the special key TASKS_VIEWALL can monitor all tasks on the system - they will have three new choices in the drop-down
menu:
• All tasks
• All tasks to be done
• All tasks done
Combined with the advanced search criteria, they can be used by the superuser to monitor the well-being of tasks being handled on the
system.
10.1.2. Task Statistics
Users holding the special key TASKS_REP can access the tab showing task statistics where it is possible to Search by Tasks start/end
date and by Task type.
The result of such Search shows, for each Task Type:
122
QueueMetrics Tasks
• The Process field
• Created/existing tasks for each task Type
• How many tasks are Open
• How many are Overdue
• How many have been Solved within the due date
• How many were Solved late
• The Average Resolution Time
The "View Details" icon leads to Task Details where one can see the Status of each Task, the users involved, the Task Creation date/time,
Validity From and Expiry date/time.
10.1.3. Tasks for groups: Class tasks
Tasks can be addressed to user Classes as well as users. This is useful e.g. for supervisors, when you mean "Any supervisor", not a
specific one.
When you act on such a task, you get the ownership, that is the task is changed as to signify it was originally sent to the acting agent.
You do not see outstanding class tasks with the "new" icon, as it is for personal tasks.
When a task is processed by a person, the acting person is displayed as "PersonsName on behalf of AgentClass".
10.1.4. Task validity and expiration
Each task has a "Valid from" and "Due by" dates. This makes it possible to create tasks that:
• Show up in the future (so you can add yourself a task to complete some future action)
• Be notified of the expiration dates.
All tasks that do not have a specified expiration date are to expire by 7 days after they are added to the system.
10.2. Types of tasks handled by QueueMetrics
The following task types are currently defined, as explained in the graph below:
10.2.1. Call QA Graded Task
This task is generated when someone grades a call processed by an agent, and it is sent to the agent that processed the call.
The title is. "Call graded on queue XXXX processed on XXX".
When you click on the task, you are lead to the correct QA form for that call. You can enter comments on that call and ACCEPT/DISPUTE
the grading. When you process that task, a new task of type NOTE is sent to the grader.
If you DISPUTE the grading, a NOTE task is sent out to the person who graded the call and a separate one to the supervisor of the agent
who disputed (if any).
123
QueueMetrics Tasks
10.2.2. Note Task
This task simply displays a text and can open up a URL when clicking on the Accept button. This is used to notify on an ACCEPT/
DISPUTE. The task note is sent when some events happen in QueueMetrics like, for example, when someone grades an agent call, or an
administrator/supervisor changes group for a particular agent. The task note could also be sent through an external XML-RPC call.
10.2.3. Training Task
This is a special task that contains a URL and is sent to the agent by the grader to improve their skills. This is used to send links to CBTs
where URLs can be defined through the Section 21.19, “Configuring CBTs (Computer Based Training)” pages. This task could be sent
through the Performance Tracker Result Page, the Grader Report page and the Training & Coaching Page.
An agent can accept (open up the URL) or dispute this task. (This task basically behaves like a Note but has a Dispute button as well).
10.2.4. Meeting Task
Meeting Tasks (also called Coaching Tasks) can be sent though the Performance Tracker Result Page, the Grader Report page and the
Training & Coaching Page. This task includes a message and a date and time of the meeting event. This is a task that can also be sent to
an agent via XML-RPC.
An agent can accept or dispute/refuse/reject this task.
10.3. RSS data export for tasks
Any QueueMetrics user can subscribe to their own "task inbox" as RSS feed. You can access the RSS feed and subscribe to it in most
browsers just by clicking on the orange RSS icon that is displayed next to the Tasks icon.
In order to display the RSS icon, you need to set the properties as described in the chapter below: "Setting computed URLs"
This access method offers no security at all, so any user who has access to any other user’s workstation can access the
other person’s RSS feed.
The RSS feed contains only the the titles of current tasks to be done and a link; when the link is clicked, the user is authenticated (if
necessary) and lead to the tasks page # so basically clicking on the RSS link is the same thing as going to the Tasks page and selecting a
task in order to view its details. If the user that logs on is not the intended recipient of the task, the task is not displayed.
It is advisable that the RSS polling speed be set to a minimum on the RSS reader (like once every 20 minutes or so) in
order to minimize the load on the QM server.
10.3.1. Setting computed URLs
In the configuration files, you should set two properties before using RSS tasks:
url.qm=http://qmserver.my.corp:8080/queuemetrics
url.rss=http://qmserver-rss.my.corp:8080/queuemetrics
In general, the servers qmserver and qmserver-rss should be the same machine - this is necessary because if your RSS reader is
embedded in your browser, every time it requests a RSS feed, it also logs you off from the current session.
124
Chapter 11. The Agent Awareness
subsystem (AGAW)
QueueMetrics was designed primarily to be used by supervisors and administrators to keep track of what is going on in the Call Centre.
In most Call-Centres, keeping track of the current activity level using a real-time wallboard and/or the agent’s page is enough. In some
high-performance setups, with large and geographically distributed agent groups, it is mandatory to have a better level of performance
awareness by the agents, and to have "off band", live communication lines going from the supervisor to the agent and from the agent to the
supervisor.
QueueMetrics addresses this issue using a module called Agent Awareness (AGAW), that is basically a Firefox or Chrome plug-in that
each agent can use to see:
• A wealth of information about how the agent and/or the queue is performing; this information offers a large set of performance metrics so
that the feedback on the agent’s behaviour is immediate
• A way for the agent to get in touch with her supervisors using an "off-band" channel (chat) so that they can keep on working with no
downtime when speaking to their supervisors or with second-line product experts
• A way for the supervisor to send targeted broadcast messages to his own agents, making it feasible to monitor geographically-dispersed
agents
The choice of developing Firefox/Chrome plug-ins was because this way the agent can keep on working on a browser-based interface
(CRM, data entry…) while keeping an eye on their own statistics in a non-obtrusive manner.
The AGAW implementation is divided into three logically distinct elements:
• The configuration and supervisor access part, done through QueueMetrics: Supervisors and managers can monitor the AGAW modules
through the QueueMetrics program, when given the correct security keys to do so. They can also send and remove broadcast messages
to agents through the main QueueMetrics interface.
• The Queue Runner : This is a command-line Java program that, in turn, runs statistics for all defined queues and agents. Though it
leverages on QueueMetrics to run the analysis, it does not run within a servlet container and doesn’t have any visible interface. The
Queue Runner can reside on a separate server from the main QueueMetrics instance.
• The AGAW facades: The facades are the access points for each agent to log on and see their own statistics. They run in a servlet
container and are positioned under the QueueMetrics webapp. The facades are not strictly speaking a part of QueueMetrics, and are
thought of to be deployed on a separate server to handle very high load.
Each component can work separately on a separate server; the whole system is tied together by the usage of the same MySQL database.
As the part that might be handling the highest load is the AGAW facades, that are constantly polled by hundreds or thousands of
concurrent agents, they can be deployed on a plurality of separate servers and can even connect to multiple replicas of the main DB in
order to handle the highest loads.
11.1. The AGAW architecture
The AGAW architecture is composed of the basic QM architecture and a number of new modules, as displayed.
125
The Agent Awareness subsystem (AGAW)
The new AGAW modules are drawn in red (AGAW Runner, AGAW database, AGAW Facade) while traditional QueueMetrics components
are drawn in blue.
This is the way it works:
1. QueueMetrics receives data from one or more Asterisk servers and processes it
2. The AGAW Runner, a specialized, command-line script, runs periodically (e.g. every 5 minutes) and gather statistics for all selected
queues. This is a time-consuming task where "hard real-time" is not necessary. Queues are processed in a sequential order.
3. Data processed by the Runner is stored in a specialized database
4. A set of cron scripts "purges" the database periodically from stale data.
On the client side:
1. A Firefox/Chrome extension polls the system every few seconds to gather new data and new broadcast messages
2. The AGAW facade component is able to retrieve the latest pre-processed data in a few milliseconds, allowing to have hundreds or
thousands of clients fed without overloading the QueueMetrics server
Though it is a separate entity from the main QueueMetrics, all AGAW components ship within the same installation as QM - so there is no
need for a separate installation.
In order to activate the AGAW subsystem, see Section 21.25, “Installing the AGAW runner”. Full configuration information can be found in
Section 21.3.4, “Configuring queues to be processed by the AGAW Runner”. You will also need an AGAW licence key (or you can use the
supplied, two-agent free key).
11.1.1. Security keys used by the AGAW subsystem
The following security keys control the accessibility of the AGAW sub system.
Key
Subsystem
Meaning
AGAW
Facades
This agent can access data
through a facade (already set by
default in class AGENTS)
AGAW_ADM
QM
Lets you access the AGAW
administrator pages: seeing the
logs, the runs in progress, etc.
AGAW_REP
QM
Lets you access per-supervision
and per-location supervisor
statistics
126
The Agent Awareness subsystem (AGAW)
Key
Subsystem
Meaning
BRO_MSG
QM
Enables the Broadcast Messages
page (from the Real-time page)
MON_IM
QM
This supervisor can start an IM
chat to the given client (if the agent
has an IM address defined on
record)
11.2. Installing the AGAW Licence
The installation of the AGAW licence requires a first step prior to installing the licence key, whereas we need to enable the AGAW profile
that ships with QueueMetrics (which is usually disabled) by configuring the AGAW user. Choose "Edit Users" from the Home page and
select the "Cfg Users" tab. Make sure that "Enabled" field is set to "Yes". Once you have filled out the required fields, as shown in the
image below, select "Save".
You can now install the new AGAW licence key by selecting the "Agent Awareness manager" link from the Home page and clicking on the
"Install new key" button at the bottom of the screen. This will open a popup that allows to enter/paste the new licence key. By clicking on
the "Run" button, we will see that the AGAW runner is restarted.
To check the successful installation of the new key, select the "Logs" tab, where you should see that the Queue runner is currently running
on a set of queues.
You now have to configure the queues on which AGAW will run. Select "Edit Queues" from the Home page and select one of the atomic
queues (not a composite queues) amongst the displayed queues (ie. a queue that matches only one Asterisk queue).
127
The Agent Awareness subsystem (AGAW)
Make sure that the field "AGAW enabled for this queue" is set to "Yes" as shown in the image above. Set the "AGAW lookback period",
which is the length of time (in minutes) in the past that is used for the realtime analysis.
The AGAW "Attention Levels" are alarms that can be set as values in seconds, to trigger alarms for the queue or the agent. Once this form
has been completed, select "Save" and proceed with the installation of the AGAW Client, as described in the following chapters.
11.3. Agents: the AGAW client
The AGAW client is used by each agent taking part in the AGAW project and receiving statistics. It is currently deployed as a Firefox/
Chrome extension; the facade component was meant to be modular, so it is well possible that other front-ends will be written in the future.
128
The Agent Awareness subsystem (AGAW)
11.4. Installing with Firefox
AGAW can be installed in Firefox by browsing the Licence page of QueueMetrics and clicking on the "Firefox" link. It will work both in
Windows and Linux versions of Firefox
It is also possible to send the link via e-mail to other Firefox users that share the same QueueMetrics instance.
Once you click on the link, you should authorize installation of the extension.
After the installation, you will need to restart your browser. When you restart, you will notice a new entry called "QueueMetrics sidebar" in
the "Tools" menu.
In FireFox 4 and newer, you have to manually enable the "Menu" bar, so that you can find the "Tools" menu. Once the
extension is active and running, you can disable the "Menu" bar.
The first time you open the sidebar, you will have to click on the "Setup" button.
129
The Agent Awareness subsystem (AGAW)
You should enter the following information:
• Server URL: http://myserver:8080/queuemetrics/qm_agaw_facade_ajax.do (take from the Licence page)
• Username: the agent code (or leave blank)
• Password: the agent’s QM password (or leave blank)
11.5. Installing with Chrome
AGAW can be installed in Chrome by browsing the Licence page of QueueMetrics and clicking on the "Chrome" link.
It is also possible to send the link via e-mail to other Chrome users that share the same QueueMetrics instance.
On older versions of Chrome, it is enough to click on the link to have the extension installed. On versions 21 and higher, the user must:
• Download the extension (agaw4chrome.crx) to their PC
• Click the wrench icon on the browser toolbar.
• Select "Tools" > "Extensions".
• Drag the file just downloaded onto the Extensions page.
• You will need to authorize the newly installed extension after reviewing its security settings
This will add the QM icon at the top right-hand corner of your browser page (next to the Chrome settings icon).
130
The Agent Awareness subsystem (AGAW)
Sysadmins managing a large number of workstations may find it easier to simply add their QM instance to the list of safe
servers users can add extensions from. See http://www.chromium.org/administrators/policy-list-3#ExtensionInstallSources
By clicking on the new icon, the QueueMetrics AGAW settings page will be displayed, as shown below:
You should enter the following information:
• Server URL: http://myserver:8080/queuemetrics/qm_agaw_facade_ajax.do (take from the Licence page)
• Username: the agent code
• Password: the agent’s QM password
The "Panel height" Advanced setting allows to alter/adjust the size (in pixels) of the extension panel, as required.
If you ever need to remove the AGAW extension you can simply select the Chrome settings icon and choose Tools/Extensions - here you
can click on the "Remove" button next to the extension name. Confirm the extension removal.
11.5.1. AGAW Client usage
AGAW Client usage depends on the agent being able to login to QueueMetrics using the Agent’s page and hold the AGAW key.
If the AGAW web-server processes crash, the client will become blank and it can be restarted by toggling the sidebar off and on again.
The client can be set up to require a manual authentication or to provide it by default, by entering or not entering the defaults in the Setup
popup.
Once the agent logs in, he gets a display that shows the current situation. On the top of the section, the current name of the agent is
displayed, as well as the system time when the page was last updated. Other agent information is shown, e.g. the current agent status, the
Asterisk code, the current location and supervisor (if any).
Also, a list of queues is displayed, where:
• The agent is a known member, or
• The agent has data for it
131
The Agent Awareness subsystem (AGAW)
For each queue a different set of parameters can be displayed. The only common parameter is the current number of waiting calls, that is
always displayed. Each parameter can be shown at the agent level, or at the queue level, or both.
Each parameter can have its own alarm threshold - this is definable separately per-queue and per-agent.
At the bottom of the client section there is a space reserved for broadcast messages that are of interest for the current agent, and are
shown in a "bulletin board" fashion, for a given period (a few hours) and showing only the latest ones.
At the moment, you can either use QueueMetrics or the AGAW client in the same browser, unless you use a different alias
for the server in order to have two active, distinct user sessions. See ???.
11.5.2. Which parameters can be displayed on the client?
A large set of metrics can be displayed on the client. We suggest to keep them to a minimum, to avoid cluttering the agent’s view with
information that is not currently critical to her work.
Code
Description
Available for queue?
Available for Agent?
ACL
Average Call Length
X
X
Wrap
Average wrap time
X
X
Avg Wait
Average wait time
X
Max Wait
Maximum wait time
X
N. Wait
Number of calls waiting
X
N Calls
Absolute number of calls
CPH
Contacts per Hour
X
X
QCPH
Qualified Contacts per
Hour
X
X
SPH
Sales per Hour
X
X
QCONV%
Qualified Conversions %
X
X
CONV%
Conversions %
X
X
X
For all metrics, red and yellow alarms can be set separately at the queue and agent level, and for each queue separately.
11.5.3. Contacting supervisors
If this feature is enabled in the queue, agents can talk back to supervisors using an XMPP/Jabber client. This will happen by clicking on a
link that points to the correct supervisor next to the queue name.
If you have FastPath installed, you can use FastPath to create a virtual supervisor queue that will be available through a "Chat Now" button
that will appear on the bottom of the AGAW client.
11.6. Supervisors: accessing AGAW statistics
By giving the key AGAW_REP to your supervisors, you can have them monitor the statistics of their own agents, filtering by the locations
they are allowed to see or their own supervision.
This will lead to a page where the statistics for the relevant agents will be displayed. These are the actual live stats that your agents are
seeing.
All the statistics can be displayed in a set of colours:
• Black: the agent is seeing this item, no alarms
132
The Agent Awareness subsystem (AGAW)
• Yellow: the agent is seeing this item, yellow alarm triggered
• Red: the agent is seeing this item, red alarm triggered
• Gray: this item is hidden from the agent (but is calculated all the same).
Statistics are reloaded when the AGAW runner script runs, so will be updated sequentially by queue. If the runner script is not active, stale
statistics will be displayed.
11.6.1. Supervisors: sending broadcast notifications
If the supervisor holds the key BRO_MSG, when he navigates to the Realtime page there will be a tab called "Broadcast" as in the
following page:
From this page you can enter broadcast messages that can reach one or more of the following:
• Everyone logged in (using the Lightning icon)
• All agents working on a queue
• All agents working at a specific location
• A specific agent
• If the user has the key SUPERVISOR, all the agents he’s currently supervising (using the Group icon)
It is also possible to remove messages that have been sent using the "Delete" icon on the right.
Broadcast notifications can be received in multiple ways:
• By agents using the AGAW client, or
• By agents logged in with the Agent’s page, or
• By agents via an RSS feed
In order for your agents to access their broadcast feed, they should point their RSS reader to the following URL:
http://qmserver-rssname.corp:8080/queuemetrics/qm_rss_broadcasts.do?user=Agent/101
where Agent/101 is the agent code for the agent whose messages we want to receive.
Enabling RSS feeds requires a special configuration - see the discussion for Tasks over RSS Section 10.3, “RSS data
export for tasks” which address the same needs.
11.6.2. Supervisors: contacting specific agents
If the agent has a defined XMPP address (defined in the Agent configuration page) and the supervisor holds the key MON_IM, there will
be a new icon that will appear in the Realtime screen and will allow contacting the agent directly via XMPP/Jabber.
133
The Agent Awareness subsystem (AGAW)
11.7. Administrators: monitoring the AGAW system
Administrators can run a general supervision of the whole AGAW system. In order for this feature to be enabled, they must be given the
AGAW_ADM key.
This allows for the "Agent Awareness" entry to appear under the "Edit QueueMetrics settings" section.
By clicking on it, the user is led to the Status page.
11.7.1. The AGAW status page
This is the main page used to monitor the AGAW subsystem. All data in this section is populated by the Queue Runner - if the Queue
Runner is not running, then you will find no data in this section!
This page shows the name of each queue that has been or is being processed, when the run started and ended, how much time it took to
run, the number of calls and distinct agents involved.
For example, in the screenshot you can see that there are two queues in "Current" status.
At the bottom of the page, you can see the number of entries per status plus the database size. When requested, QueueMetrics will send
the client all queues that are in the "Complete" state.
Possible run statuses are:
• Querying: data is being gathered for this queue
• Inserting: data is being written to the database
• Complete: data is available for the AGAW clients to read
• Obsolete: data that was previously available, now waiting for deletion (A number of database systems have better performance if data is
being added to a table versus the case where it is being added and deleted. So we do programmed deletions of stale data)
A histogram makes it clearer as to which kind of lines are in the database.
The page can be reloaded using the button at the top to see what’s going on in real-time.
By clicking on the details of a run, you will see all agent information that has been computed for that run of the queue, like in the following
screenshot:
134
The Agent Awareness subsystem (AGAW)
If there are any color alarms, they are shown as the background color. Possible color configurations are:
• Black text: item visible in the client, no alarm
• Yellow background: Item visible, yellow alarm
• Red background: Item visible, red alarm
• Gray text: This item is hidden from the client.
11.7.2. The AGAW Table maintenance page
It is possible to perform either a manual or a programmed table maintenance. We suggest basically running table maintenance from a
script, but the manual option is available in case it’s needed.
Maintenance will first purge unused records, and will then run a table optimization to maximize access and insert speed.
For each operation performed, an overview is displayed, showing the duration of the required operation in milliseconds.
When running on a busy system, high maintenance times are normal, as the database back-end will try to find a suitable moment to
perform the required operations.
11.7.3. The AGAW Agents page
The Agent page is based on the same routine that fetches data for an agent - if you select the agent, then all the data that would be
currently served to that agent is shown.
Agents can be selected from the drop-down box on the top of the page.
This is useful to see what an agent would see without accessing a real facade.
11.7.4. The AGAW logs page
The system log instead will show the log of the activity for both the Queue Runner and for each agent - this is useful to see real-life
performance:
135
The Agent Awareness subsystem (AGAW)
The AGAW log is divided into three parts:
• Admin: operations performed by the administrators.
• Client: access times for clients reading AGAW data. One entry is added for each time the AGAW system is accessed
• Loader: The activity log of the AGAW runner. From here you can see if the Runner is working and what it is doing.
In case of errors, the relevant lines are displayed with a red dot.
When the Runner is processing, you get:
• A line saying that the runner is starting, its current version and how many queues it’s going to consider (eg. "Queue Runner $Revision:
1.16 $ starting - 3 queues to go.")
• A line for each processed queue, if errors were encountered and how long it took, one by one (e.g. "Q: queue-dps L: 0 - Everything okay
- took 250 ms");
• A line saying that the runner is shutting down and how long the whole run took (e.g. "Queue Runner terminating - 828 ms")
You can also see client accesses for debug purposes:
• You see which agent requested data and the amount of processing time (e.g. "Agent/101 - Client Query: Q:2 B:0 E:0 Took 297 ms Pr:0
Lo:94 Ut:0 Pe:0 Co:203 Br:0 = 297")
• The various figures can be used for debugging purposes (e.g. "Co" is the connection time to the DB)
136
Chapter 12. Quality Assessment in
QueueMetrics
QueueMetrics includes a Quality Assessment (QA) module that lets you:
• Define a set of metrics to be used for call grading
• Have the QA team grade calls while they’re being processed or from historical recordings
• Run complete reports by queue and by agent
12.1. Enabling QA monitoring
In order to use QA monitoring, you should have the following security keys assigned:
• QA_TRACK: this key means that the person can input QA data. If this person has the keys to access historical calls or real-time calls, he
will be able to fill-in QA forms. Individual forms can be further restricted by key-protecting them
• QA_REPORT: this keys means that the holder can access QA reports. Individual forms can be further restricted by protecting them with
a reporting key as well.
• USR_QAEDIT: this key means that the holder can modify and create QA reporting forms.
12.2. Understanding Quality Assessment
The QA module in QueueMetrics was built in order for a specific QA supervisor to track the performance of agents on a given set of
metrics. Each metric is expressed as a long description and has an unique engagement code (a short acronym up to 5 letters).
Metrics are user-definable and are clustered together in forms; a form can hold up to 130 metrics divided in up to 10 metric groups.
A single reporter can grade a call only once for each defined form; any attempt to grade a the same form for the same call multiple times
will not be accepted.
For security reasons, call grading data cannot be modified once input, and forms with live data associated to them cannot be deleted
from the system. In order to have a reduced set of metrics available if you use successive versions of a form over the period, it is possible
to close a form, i.e. to avoid further input. Deletions, if any, will be performed at the database level by the system administrator.
Grading data is expressed as integer numbers between 0 and 100; grading all fields is mandatory, except for fields marked as "optional" in
the form definition. The QA team can also input free text comments linked to a specific call.
It is possible to edit thresholds for different levels of QA grades, e.g. 0-25: Issue, 26-50: Improvement required, 51-75: Meets
expectations, 76-100 Exceeds expectations. These values can be defined on a form-by-form basis, and make it possible to count the
number of items that belong to each category and to use a colour code for immediate graphic representation.
12.3. Grading calls
Grading data can be input while listening to the live call (Unattended monitoring) or while looking at the historical call details or through a
particular formatted URL string.
12.3.1. Grading calls on the real-time page
If an agent has the required grants, he will get the grading icon on the right of the "Calls being processed" table:
137
Quality Assessment in QueueMetrics
The icon appears only when a call being processed is connected to an agent (as the point is rating the agent). By clicking on that icon, a
popup will appear that lets you enter QA data. You should be listening to the call using the Unattended Monitoring icon in QueueMetrics or
a different passive listening schedule as set up in your call center.
12.3.2. Grading historical calls
In order to do the grading of historical calls, you proceed as is the case for audio recordings. If QA grading is enabled, the button "Track
QA" will appear on the call detail popup, as in the picture below.
By clicking on the button, the call detail popup will close and a QA form will load.
12.3.3. The input form
If multiple QA forms are available for this QA person, they will be able to select the correct form by selecting the "Input form" field on the top
right.
138
Quality Assessment in QueueMetrics
The top-left box shows the current threshold values for each levels (please note that the label associated to each level is form customizable
from the form configuration page. See Section 21.13, “Configuring QA forms” for further information). While you input data into the form,
you can see that the number of items that fall into each category and the average and total scores are updated in real-time.
For each section is reported the overall section score and average. Zero values are marked in red. This simplifies the
discovering of session shortcuts (See Section 21.13.2, “Configuring QA items” for further details) for already scored forms.
As soon as the form has been graded and saved, a set of checkboxes are shown on the right column of each level. These checkboxes
could be used to show/hide questions falling in each specific range.
On the top-right box, after the Input form field, a form Status dropdown reports the current form status. Actually this dropdown is read only
and their status could be changed modifying the dataset stored in the database with an external application. Following the form status you
can see the call details: when it started, on which queue it was processed, the agent processing it, the caller-id and the Asterisk internal
call-id.
On the top right there are three buttons:
139
Quality Assessment in QueueMetrics
• Close is used to exit the form without saving changes
• Notes is used to toggle between scores and notes associated to the call
• Print is used to start the print process. The print procedure will show scores and notes on the same page.
Then a general purpose "timer" widget is shown. You can use it, for example, to track the hold time when listening to a call conversation.
At the bottom of the form is the button Save, that is used to exit the form saving changes. This button will appear only when data are in a
consistent state that allows saving.
If you load a saved form, it will be shown in read-only mode.
On the bottom part of the form there are the different items to be graded, grouped into a set of categories. If a box contains invalid data (i.e.
something that is not a number between 0 and 100 included) it will be displayed in yellow and the form shall not be saved.
Following the form definition, items can be graded by:
• inserting a score value
• selecting the appropriate value from the dropdown menu
• checking the proper Yes/No options.
Items that are not mandatory have an associated N/A checkbox; when checked, it disables the related score value and lets the user save
a form without specifying any score for that item. If all fields within a given section are defined as N/As, then the Overall Performance will
display the entire section with an N/A Average total value.
Items reported in italic are shortcut items; that is, if a shortcut item totalizes a score that falls into the "Issue" category, the overall form
score will be set to 0.
The value set in some items may control the set of items that are enabled for the current form; that’s why the form is evaluated again after
each user input.
Is possible to assign a free text note or a set of notes to each question in the form. We call this type of notes as "per-question" notes. Perquestion notes could be added clicking on the icon on the right side of each question and typing the text in the shown popup. Questions
with already associated per-question notes are marked with a different icon as per the following figure:
For a thorough description of how Forms and Items can be set up, please see the chapter Configuring QA forms Section 21.13,
“Configuring QA forms” .
140
Quality Assessment in QueueMetrics
When a form is saved, it appears as per the following figure:
It basically shows the same data that was input, but it cannot be changed anymore (except for users holding specific keys as defined by
Removing or Editing QA forms Section 12.4, “Removing or Editing QA forms”) and the supervisor information is shown. If there are known
audio recordings for this call, they are shown under the "Audio recordings" box.
The form now displays a Toggle N/As button which allows to show/hide the Non Applicable specified fields.
Pressing the Notes button, the form will change as per the following figure:
141
Quality Assessment in QueueMetrics
The user can insert one or more notes that will be saved by pressing the "Add" button; all comments already added are listed in
chronological order together with the per-question notes inserted for a set of specific form. Per-question notes associated to the selected
form are shown at the beginning of the comments list.
For each call it is possible to add markers which can be created and deleted as required, in order to keep further details regarding that
specific call. This works best in conjuction with the HTML5 audio player as described on the HTML5 Player Section 5.2.1, “The HTML5
Audio Player and Markers”.
Is not possible to submit partial forms. If you compile a partial form, switch to the note view and submit a note, the scores
already compiled will be lost.
12.3.4. Grading over HTTP access
Is possible to grade a particular call through an HTTP request to the QueueMetrics server with an URL specifically formatted for this
purpose.
When an URL is typed in the browser, QueueMetrics redirects its output to the login page (if required) where the user could log in to
continue.
QueueMetrics shows the grading input form in the browser window and the user can grade the call and/or add notes to it.
The URL to be used to trigger the grading procedure should follow the syntax below:
http://qmserver.corp:8080/queuemetrics/qm_qa_jumptogradepage.do?
QAE_astclid=1286184814.122
&QAE_queue=queuename
&QAE_formName=FormToBeGraded
&QAE_CallStartDate=2010-10-04.11:00:00
(of course the URL should appear all on one line).
142
Quality Assessment in QueueMetrics
In the example, we trigger a grading procedure on the host qmserver.corp on port 8080 The context is queuemetrics (but could change
based on local install). Then there are some parameters following:
• QAE_astclid : specifies the Asterisk unique id for the call to be graded
• QAE_queue : specifies the queue name where the call has been taken
• QAE_formName: specifies the name of the form to be graded
• QAE_CallStartDate: specifies the day where the call has been taken. The value should be formatted as YYYY-MM-DD.hh:mm:ss and
should represent the time before the call (it’s not important to specify the exact time where the call has been taken but it’s important to
specify a time near the period before the call).
12.4. Removing or Editing QA forms
Users holding the key QA_REMOVE can delete a form.
When a form is deleted, their content is dumped on the Audit Log.
All accesses on deleted forms are highlighted by a special message shown in the form.
After deleting a form, it is again possible to grade a call as if it was never graded before.
Users holding the keys QA_REMOVE and QA_REPLACE can edit an already submitted form. By editing an already submitted form,
QueueMetrics performs a normal delete action, then shows to the user a new editable form with pre-filled values in each row. Data are
processed by following the usual procedure.
12.5. Running QA reports
In order to run QA reports, you must go to the main page of QM and click on the "Run QA forms" label.
The system will show the following form:
143
Quality Assessment in QueueMetrics
The parameters have the following meanings:
• Form is the name of the form you want to run a report for
• Queue can be one or more queues. You can the run different reports for different queues, or use a catch-all queue
• Agent is an optional Agent filter
• Location is an optional Location filter
• Agent Group is an optional Agent Group filter
• Grader is an optional parameter that filters by the person who compiled the form
• Supervision is an optional Supervisor filter
• Outcome is an optional call outcome code filter
• Start Date and End Date are about the start time of the calls which QA forms that will be included in the report.
By clicking on "Calculate" or "Show Summary" the actual results are shown. If you have used Extra Scores (see Chapter 20.9 - Configuring
QA forms) within the QA form, the "Calculate" or "Show Summary" will return averages that are higher than 100.
It is also possible to run a report that compares graders to each other - see Section 13.3, “Grader calibration reports”.
12.6. The main QA report
The button "Calculate" shows a report like:
144
Quality Assessment in QueueMetrics
The Tracked calls per agent report shows:
• The total number of calls that were tracked for each agent
• The average score for each agent
• The total number of items that fall into "Exceeds expectations", "Meets expectations", "Improvement required" and "Issue" for each agent.
As you can see, the names of each agent are clickable in order to obtain a detail of calls by agent.
All statistics that are computed per-agent are then recomputed per-queue and per-agent-group.
The Analysts tracking calls reports shows how many calls each supervisor graded and what was the average score that this supervisor
gave.
Then, for each Section defined in the QA form, you will get the average scores for each item, plus an average of all average scores in order
to point out problems.
If an item is shown in red, it means that such item has been assigned a zero-weight value. If an item is shown in gray, it means that
such item has been set as non scoreable item. For further information on configuring items within the form, refer to the paragraph
xref:Configuring QA items[].
All columns can be sorted by clicking on the item name and all data can be downloaded in Excel, CSV or XML format.
In order to have a better understanding of what is going on, you can click on an agent’s name and get the details, as below:
145
Quality Assessment in QueueMetrics
This shows the details of all calls stored, the number of items for each call that fall into each grading category, the average rating for each
call and the comment.
By clicking on the form icon
on the right, you can access the QA form that was graded for this calls, so you can access individual scores
and listen to audio recordings that are related to this form.
12.7. The QA Summary report
The "Show Summary" button shows a report like:
146
Quality Assessment in QueueMetrics
This report calculates, for each item and for each section in the form:
• average for the whole form
• number of calls graded
• average score and cumulated percentage for each item and section that "Exceeds expectations" (the column marked "Best") or "Meet
expectations" (Good) or "Improvement required" (Ok) or "Issue" (Req.Imp.) (only for scoreable item)
• average score and number of time each value is found in the reports (only for non scoring questions)
• cumulated percentage for each item marked as "shortcut"
All values are computed accorded to the currem item weights (only for secoreable items), in case you use weighted items.
The data can be exported to Excel, CSV and XML formats.
On the top right of the report is a box containing the list of levels with related checkboxes. Values shown in the result table are coloured
following the checboxes status. This is usefull to hilite questions where average values fall in a specific set of levels. The status of
checkboxes are persisted through sessions.
147
Quality Assessment in QueueMetrics
12.8. The Training And Coaching Page
Users holdint the security key TASK_PUSH_TC will be able to access to the Training and Coaching Page. This page is the main access
point for sending CBTs and Meeting (also named Coaching) tasks to an agent or a set of agents. It’s based on a three steps wizard where
the list of users are defined in the first two steps and the proper CBT or Meeting tasks are sent in the third step. Agents selection starts by
several finding criterias, as depicted below:
• The queue dropdown
• If the finder should take care about queues components (this is useful when a composed queue is selected in the previous dropdown)
• An agent dropdown
• A location dropdown
• An agent group dropdown
Each agents mathing the criterias are shown as soon as the user presses the "Search" button, as reported in the picture below.
Looking at the list of agents found in the center of the page, a single agent can be selected by clicking on their related checkbox whether all
agents in the list can be selected by clicking on the checkbox placed on the header of the list.
As soon as agents are selected, the user can send a CBT or a Coaching task by properly filling the fields related to time and date validity
and, optionally, a note that will be shown to the agents and a reason (hidden to the agents). Specific fields for CBTs and for Coaching tasks
can be found on the most right-bottom side of the page. Tasks can be sent by pressing "Send CBT" or "Send Coaching" buttons.
At the end of process, QueueMetrics shows the number of CBT/Coaching tasks sent as reported by the following picture.
148
Quality Assessment in QueueMetrics
149
Chapter 13. Advanced tracking of agent
and grader performance
Advanced tracking of agent performance lets you pinpoint those agents whose behavior can and should be improved. In order to do this, a
score is created out of multiple items related to:
• their way each call is handled (e.g call duration)
• their call performance (e.g. number of sales)
• QA scores that were given to their calls
As the scoring is in itself quite complex and made up of multiple factors, scoring is based on a rule set that represent a business-specific
set of targets that should be met. For each rule, you have two possible levels of non-compliance # that is a yellow and a red threshold.
Each threshold can, in turn, have a peculiar score associated.
For example, you could say that the expected call duration is 100 seconds; calls that are between 100 and 150 seconds
are "yellow" and worth 1 review point, calls that are over 150 seconds are "red" and worth 4 review points. The higher your
review score, the more prominently the agent will be displayed.
When applying a rule set to a set of calls, you get a score expressed in review points for each agent selected that represents the sum of
all anomalies as detected by the chosen ruleset.
The system then displays the agents involved in reverse score order, prompting the grader to investigate further by accessing the set of
calls and the set of QA records and the relevant audio recordings.
The result of this activity is:
• In-depth knowlegde of agent performance
• Agent life cycle management: the grader can move agents between agent groups, so that you can manage a process where an agent
belongs to multiple skill groups during their lifetime
• Continuous improvement of agent performance through agent tasks, e.g. coaching sessions, or completing Commputer Based Training
to improve the agent’s skills.
For example, an agent could start her life as member of the group New Hires. When reviewed after a while, she could be moved to New
Hires Probation when she is found lacking in some subject. After a while she could be checked again and moved back to New Hires.
As collateral features, the system also offers facilities to:
• Create rule sets based on the average properties of a set of calls. This makes it easy to have reference points that can then be manually
edited.
• Track the lifecycle of agents. This is done by tracking the different agents groups each agent has been a member of and the time period
they have been there.
Just like for agents, there is also the problem of comparing graders to each other, in order to have a "fair" view of what is going on and to
make sure that grading happens under the company’s guidelines and not each grader’s own preferences. Grader calibration reports fulfill
this purpose by comparing graders to each other.
13.1. Tracking agent performance
For users holding the key "QA_PERF_TRACK" a new link appears in the QueueMetrics home page, as shown below:
When clicking on it, you are lead to the main search page:
150
Advanced tracking of agent
and grader performance
This page lets the grader search for a set of agents to be reviewed. This requires setting three search dimensions:
• A queue (or set of queues) and a time period
• A way to search for a set of agents (a specific one, or a group, or a location, or all agents that have the same supervisor).
• A QA form to be graded
• A rule set that applies to the above search and defines scoring. You should define your own before you start this activity (see
Section 21.14, “Defining agent performance rules”).
The scoring rule is usually associated to a particular queue and form but the user can override this selection by checking the option
"Override queue and form selections" and by specifying other parameters that affect the calculation, like:
• the minimum expected score,
• the minimum number of calls that should be analyzed,
• the minimum days the agent had to be in the group at the run period specified for the analysis.
These minimums are to avoid considering agents that are undersampled (e.g. if an agent has been scored only once, we can expect this
score to be less meaningful compared to an agent whose score is based on 10 elements).
The button "Search" starts the calculation process and a new page will be displayed:
151
Advanced tracking of agent
and grader performance
The items shown here are averages on all the calls that were found in the current set. The selected score rule is used to compute the
overall Score value, and agents are shown sorted by their score in descending order.
Flying with the mouse over the score value a detail rules contributing to the overall score are shown, as reported on the picture below:
At the bottom of the main table result, a second table shows the agents (if any) that were not included in the report and the threshold that
was not met.
Clicking on the agent name or the associated score value the user gives access to details. They are reported in a different page, like the
one shown below.
The details page is split in two parts. The top part reports the score details for each call the agent answered. The bottom one shows the
detailed history associated to that particular agent.
152
Advanced tracking of agent
and grader performance
Each line in the top table reports the score calculated by the rule selected in the search page without being averaged, and other relevant
information for each call.
An icon representing a pencil is shown if the call has a QA form associated with it; by clicking it, the associated QA form will be shown in
a separate pop-up dialog. Users allowed to grade calls could find a set of grayed out pencil icons to be used to score new calls from this
page. After scoring each call they should press "Refresh" to have the page updated.
A special icon is assigned to Flunked calls. A call is defined as Flunked if the related QA Form has been graded but reached an average
value below the Issue level.
13.1.1. Dynamic drill down
To make the grader’s life easier in case the set of calls to be analyzed is large, it is possible to use a set of dynamic criteria to reduce the
data that is currently displayed.
The table on the top-right lets you add up to three drill-down rules being active at the same time. Rules can be quickly disabled by clicking
on the "Turn off" checkbox on the left of each rule.
The title of the section shows the total number of calls found for the agent and the number that is actually displayed. The
ones that are not are the ones that are filtered out. In order to see them all again, just clear or turn off all the filters.
The following rules are defined:
• Call length
• A form’s average score
• The performance tracker score
• The call outcome
• Whether the call is a Flunked one, or a Sale, or a Qualified Contact, or a Contact
Special notes about rules:
• If you enter multiple rules at once, they are all active
• Rules expecting a time duration (e.g. call length) will accept input as H:MM:SS (e.g. 0:23) or an integer number of seconds.
• Rules working on a float value have the float value converted to the nearest integer and then the rule is applied.
It is always possible to sort data in the call list table by clicking on the title.
13.1.2. Taking remedial actions
By the top of the page, the grader can take remedial actions using the form displayed below.
153
Advanced tracking of agent
and grader performance
Move the agent to a different group
In order to move the agent to a different group, the grader has to select the new group through the dropdown; he can specify a reason in
the lower text box then press the OK button on the right side of the dropdown group.
If the user checks the "Remind me" checkbox before pressing the OK button, QueueMetrics will send a reminder task to the grader himself
that will be displayed after a specified number of days. (This can be used as a reminder and is optional).
A new row with the operation details will be inserted in the agent’s history table after completion.
Send a CBT to the selected agent
In order to send a CBT (Computer Based Training) to the specific agent the report is referring to, the grader should select an already known
CBT from the dropdown list or manually specify a URL. An optional note (visible to the recipient agent) and an optional reason (hidden
to the agent) can be added. Grader can optionally link a specific call with the CBT to be sent, so, the agent will be able to refer to that
particular call in the task details. To link a specific call to the CBT, the grader should click on the checkbox he can find each row in the call
list. Unlinking the call is done by clicking on the red icon in the list header.
A new Teaching task will be sent to the agent with the title and the inserted URL.
A new row with the operation details will be placed in the history table after completion.
Send a Coaching (Meeting) task to the selected agent
A grader may want to send a Coaching/Meeting task to the specific agent the report is referring to. This can be done through the Send
Coaching tab. A Coaching task is defined by a Title, a Message and a task date. The grader can optionally specify a coaching duration
(in seconds), a note (visible to the agent) and a reason text (hidden to the agent). Pressing OK generates a new coaching task with the
information provided. The task will be placed in the history table after completion.
13.2. Finding calls to be graded
This is a separate page accessed by users holding the QA_GRADER security key.
QA graders page is to provide graders with a tool that will help them in finding which calls are to be graded. Calls can be searched by
specifying several targets: per client, per queue, per agent and per agent group. Each target can be expressed as an absolute minimum, a
percentage or both.
Default targets are expressed:
• Per queue or set of queues
• Per location
• Per individual agents (that is, the minimum required for each agent)
• Per call outcome (see Section 21.6, “Configuring call outcomes” )
• Per agent or agent groups (see Section 21.10, “Configuring agent groups” )
Targets can be disabled as well, by leaving them empty.
All grading activity is done per form, that is, related to one specific form.
154
Advanced tracking of agent
and grader performance
The QA personnel is supposed to input the right targets given the goal at hand (eg. daily or weekly, per client or per queue, etc).
When they do, QueueMetrics will run a report that displays the absolute numbers involved and the number of targets that are currently
being hit. At the top of the page, QueueMetrics will then display a random selection of calls to be graded, weighted on the number of
targets each call hits (i.e. the mode targets a call hits, the more likely it is to appear in the list).
155
Advanced tracking of agent
and grader performance
The grader may do grading on some or all of the suggested calls, or may decide to do differently. When done, he clicks on #Run again#; all
the form is computed again, targets are recomputed and so is the set of possible calls.
13.2.1. Selecting which calls to grade
Each call included in the search criteria per time period or queue is first listed. The set of distinct agents involved in the queue is obtained.
Calls are then filtered off if they match the following rules:
• They have already been graded for this form
• They have no audio recording
• They will help no target
For each of the remaining calls, a score is computed by assigning one point to each of the criteria that are currently unmet absolute
number and percentage are treated as distinct criteria). Calls are then weighted based on the square of their score (that is: if a call will
help 10 targets, its relative score will be 100, while if it helps in 5 targets, the relative score will be 25), and extracted randomly, so that
it#s more likely for QueueMetrics to draw calls that match multiple criteria, but even a call matching one single criteria may appear. As the
computations involved are quite heavy (mostly when deciding if a call has associated audio and QA scoring, as this might be repeated tens
of thousands of times) each grader will have a small set to use before reloading.
13.3. Grader calibration reports
This is a separate, one-page report that is only accessed by supervisors earmarked by the key "QA_CALREP" only (in addition to
"QA_REPORT").
To access the page, you go to Quality Assessment → Run QA Reports and fill-in the form by the bottom of the page :
156
Advanced tracking of agent
and grader performance
You will also use the form by the top of the page you usually use for QA reports.
On the input page you select:
• A date range (dual selector plus predefined periods)
• One Form (if we had an option for All, we’d get way too many)
• A queue or composite queue
• A call outcome, or none for all calls
• It is possible to select an agent group as an additional filter.
• It is possible to add a minimum threshold of graded calls per grader to be included
The analysis happens at three levels:
• The whole form
• The section level
• The question level
For each form/section/question, a table is computed for the general and for each agent that has graded at least X items:
157
Advanced tracking of agent
and grader performance
For each form/section/question, an average is computed and compared to the one of all graders who graded at least X calls in the specific
area. This way it is easy to spot trends and anomalies on grading behavior. Values shown in gray refers to non scorable questions.
Average for this type of questions is counted only for reference purposes.
158
Chapter 14. Payroll data in QueueMetrics
Starting from QueueMetrics version 1.6., QueueMetrics is able to produce extensive payroll information suitable to be exported to a third
party application.
QueueMetrics is able to extract most of the data required for payroll generation from the agent sessions information reported by QM.
Through some special pages a supervisor can edit and correct that information before exporting.
14.1. How it works
Payroll is based on agent sessions and is displayed a as separate "micro-application" within QM, available only to agents holding a special
key. Each agent has a specific payroll code associated through the agents configuration page. This payroll code identifies the agent in the
payroll generated data file.
To Supervisors that can access to payroll subsection will be shown all "punch times", for a given period of time, with the opportunity to
zoom in, display incomplete sessions and display sessions for one specific agent. Supervisors holding a second special key are allowed
to correct - enlarge or restrict - agent sessions, given a set of rules that avoids overlaps with other agent activities, to be further specified.
A third key allow "enlarging" agent sessions, i.e. causing the cost to be more for the call center. Payroll extraction is just manual: the user
should inspect payroll data and download payroll trace files, to be loaded into external WR Timetracker for further processing. Supervisors
are able to see all punches and/or to filter out some of them by agent group and/or location. All activity is logged into the QueueMetrics log
subsystem.
Payroll information generated by QueueMetrics is based on a specific output file format:
• ADP "punch files", that basically handle the time an agent has been available under ACD
but the underlying structure let us able to expand the file format selection by implementing a specific file writer.
To summarize, here are the keys that limit user’s permissions when working with Payroll:
• Users allowed to check the payroll page will be marked by the key PAYROLL
• Users allowed to edit the queue_log records will be marked as QLOG_EDIT
• Users allowed to edit session data by making it longer will be marked by QLOG_LNGR (they must hold QLOG_EDIT as well).
All queue_log editing is tracked and logged.
14.2. Payroll web pages
The payroll process happens on the following web pages:
The Search page is linked from the main QM page.
159
Payroll data in QueueMetrics
14.2.1. The search page
The search page lets a supervisor search for session activity.
The page lets you select a time interval, or choose one of the pre-selected time intervals. It also lets you filter by one criteria of the following
ones:
• Location
• Agent group
• Supervisor (a button "me" is available if the user is a knows supervisor, and will pre-select the current supervisor)
14.2.2. The Sessions page
The payroll extraction page lets you preview the data that will be downloaded in the "punch" format. If you click on an agentâ##s name,
then you will be lead to a page where all sessions for that agent will be shown for the specified time interval.
The table can be exported as Excel/CSV/XML, as all other QM tables.
Next to the agent name, if present, is an icon that displays the current Agent group. If there is a payroll note for the agent, a yellow icon is
displayed by the end of the row.
The button "Export now" lets you download the "punch" data file, in the format specified on screen.
14.2.3. The Agent detail page
On the Agent detail page all sessions for that agent will be shown for the specified time interval. Next to the agent name, if present, is an
icon that displays the current Agent group.
160
Payroll data in QueueMetrics
Pause types and codes are displayed, according to the following table:
• BP: Pause is Billable and Payable
• BNP: Pause is Billable but not payable (be careful!)
• NBP: Pause is not billable but Payable
• NBNP: Pause is neither billable nor payable
A set of payroll notes can be added by the user and read. Notes could also be deleted by a user holding the proper security key (See
Appendix B, Security keys for further information).
If you have the grants to edit a session, by clicking on the icon placed next to the duration field, you will be able to edit that session.
The table can be exported as Excel/CSV/XML, as all other QM tables.
14.2.4. The Session editor page
The page displays the information about the selected agent session, and it searches the maximum/minimum values allowed for starting and
ending the session.
161
Payroll data in QueueMetrics
It will be able to change the agent session by entering the new start and end times, either one or both at once.
If you need to make a session extend over the midnight, you must enter the full resulting date in the format like "2010-11-07
11:03:40"
An error is raised if this makes the session longer and you do not hold the key QLOG_LNGR).
If the period is invalid, an error will be displayed. When the changes are applied, the page will reload with the new data
14.2.5. The pause editor page
The page displays the information about the selected agent pause, and it searches the maximum/minimum values allowed for starting and
ending the session.
This page works exactly like the Session editor, but lets you set/change the pause code as well.
An error is raised if this makes the session longer or you change a pause from non-payable to payable without holding the key
QLOG_LNGR.
If the period is invalid, an error will be displayed. When the changes are applied, the page will reload with the new data
Each time the user asks for a pause modification (either the start/end time, either the pause code) the system modifies the
database information in order to reorganize the pause in a standard format. The standard format is characterized to have
a PAUSEALL, PAUSEREASON, UNPAUSEALL sequence where the PAUSEREASON is placed one second after the
162
Payroll data in QueueMetrics
PAUSEALL event. This prevents problems with possible malformed pauses present in the database. All modifications are
logged in the syslog pages with corresponding rollback SQL statements.
14.3. Editing the system queue_log file
When the user asks for changes on a specific agent session statement, QM will try and see if it can find that session and it is "well-formed".
This means that some sessions might not be updateable though they work fine in QM.
Not well-formed sections are, for example, sections where a log-on event is not present, or overlapped with other events. This could be
caused by a not corrected queue log, following some pbx unavailability or something other.
If the target session is "well-formed", QueueMetrics will try to detect whether the change causes some havoc with other calls/sessions. If it
does, the change is rejected.
If the target section is well-formed but causes a growing cost f or the call center, and so requires the key QLOG_LNGR, that key is
checked; if not found, the change is rejected.
14.3.1. Well-formed agent sessions
An agent session is considered well-formed if:
• At least one line with one of the Agent logon verbs is present at the time stamp that is given as the start of the session
• A line with one of the logoff verbs is present at the time stamp that is given at the end of the session, with same partition ID as at least
one starting line found
14.4. The editing log
All activity details are logged to the master QM log, where they will be available for inspection though direct SQL access.
The trace log contains:
• A description of the changes, the time and the user who requested them
• A sequence of SQL that generates the new session timing
• A sequence of SQL that is able to restore the records as they were before the change
163
Chapter 15. Multi-stint calls
In QueueMetrics, we define a multi-stint call as a call that was processed on more than one queue, with one or more queue terminating it
for timeout, transfers or key exits.
In the standard QueueMetrics reporting mode, this call would be seen as a series of "lost calls" on one or more queues, possibly followed
by a taken call if the call was answered at all; the system does not notice that those events happened on the same call.
Running QueueMetrics in multi-stint mode, calls will be grouped together based on the call’s Unique-ID, and a single call will be rebuilt as a
multi-stint call so that:
• The call looks like it was handled on the first queue it was presented on; the queue enter time and queue position are those of the first
queue.
• The call will be considered "answered" if the last stint is an answered call, "lost" in all other cases
• The wait time will be the sum of the wait times on different queues (if there are intermediate wait times, like those for IVR menus, they will
not be counted)
• The talking time and agent taken the call will be taken from the last taken call
• All stats (number of call, call distribution, etc) will be counted on the new multi-stint calls.
15.1. Limitations and side-effects
Multi-stint calls aren’t for everyone. There are a number of limitations and side effects you should be aware of before attempting to run
QueueMetrics in this mode:
• Calls are grouped by the Asterisk Unique-ID code; this means that if different call stints happen on different servers in a cluster, they will
not be grouped together
• All queues the call passed on must be included in the report. If you include only the master queue, stints on other queues will not be
seen.
• Because of the previous bullet, it is usually better to configure separate "wrap up" or "timeout" queues, that is, instead of having both a
Sales and a Support queue that will send people to the General queue on timeout, it would be better to have "Sales" → "General-sales"
and "Support" → "General-support", even if "General-sales" and "General-support" are actually aliases of the same queue.
• All stints of all calls must be included between the starting and ending report times. Stints that start before the start data or end after it will
be ignored.
• Run time and memory will be comparatively more than a standard analysis, as the grouping and additional data stored take their toll on
the system
• Stint-grouping does not work for real-time analysis.
On versions of QueueMetrics up to 1.6.3, calls are filtered by search criteria before being aggregated in multi-stint mode.
This may lead to problems when you want to use filtering criteria in multi-stint mode, where only some stints match the
critera while others does not. T To avoid this issue, on newer versions of QueueMetrics calls are joined together in multistint mode before criteria are applied to the aggregated results.
15.2. Multi-stint calls in QueueMetrics
If you run calls with multi-stint mode enabled, the string "Multi-stint calls joined together" will appear on the top panel, and the number of
joined together calls will be shown.
The distribution of taken calls by stints will be shown in the "Answered calls" tab:
The distribution of lost calls by stints will be shown in the "Lost calls" tab; aggregate calls by stints will also be shown in the "Lost Calls"
page:
164
Multi-stint calls
Details of multi-stints calls are displayed in the call details pop-up, in a separate tab. See Chapter 5, Showing call details.
165
Chapter 16. The visitor’s page
If you run a call center, it is sometimes desirable to offer some strangers access to the system in order to demonstrate the quality of the
work you are doing. Of course you do not want them to access directly the full reports pages, but still you want them to be able to get a hold
of the current activity and, optionally, to monitor your agents directly, listening to the conversation or having a look at the agent’s screen.
This feature may be handy, for example, if your call center handles inbound queues for third party clients. If you let your users access the
QueueMetrics server, they will be able to see your work in real-time. Or maybe you want the marketing department to check the quality of
your work, without giving them a fully-featured report that may be hard to understand for a complete stranger.
To solve this problem QueueMetrics implements the VISITOR profile; when a visitor logs on, they see a web page like the following one:
They can then select one or more queues that they have the privilege to see, and click on "Show current system activity".
166
The visitor’s page
This page looks very similar to the real-time page, where the calls for the given queues are shown in real time. If the user is given the
MON_AUDIO or MON_VNC keys, he will have the opportunity to click on the VNC or the unattended audio monitoring icons and start the
procedure exactly the way it happens for the real-time page.
In addition to the data about the real-time activity, the user will be able to see a report of the number, average duration and average wait
time for answered and unanswered calls on the selected queue(s).
The page reloads automatically just like the real-time page, or can be reloaded by clicking on the "Reload now" button.
16.1. Setting up VISITORS in a real life scenario
• You may be running a number of queues for different clients, and you do not want one client to see the others' queues. This is obtained
very simply by protecting each queue with a different key and then assigning each visitor the correct key
• You want some visitors to use unattended audio or VNC monitoring. Distribute or revoke the keys MON_VNC and MON_AUDIO
accordingly.
• A sample visitor user has been created for the demo database that ships with QueueMetrics; it is called demovisitor with password
demo. For security reasons, this user must be manually enabled in the standard database.
167
Chapter 17. Using Supervisors
A supervisor, for what QueueMetrics is concerned, is a user holding the key SUPERVISOR. One such user has the ability to be assigned to
the known agents as their supervisor and to run a report with the additional criterion of filtering the results for all agents he is the supervisor
of. This will work in much the same way as the current Location reporting.
On the main page and on the Custom report analysis, if a user is a Supervisor, he will have an additional option: "Run the analysis for my
competency". This option will at the moment be mutually incompatible with Location filtering (if both are chosen, an error will be shown).
The analysis will proceed as usual.
In the real-time page there will be a new toggle button "Competency" to filter agents by the competency. Even in this case the filter may not
be used together with Location filtering.
For security reasons, this user must be manually enabled in the standard database.
168
Chapter 18. Automating statistics
download: the ROBOT profile
It is sometimes desirable to obtain a snapshot of the reports QueueMetrics produces at a given moment in time for future access or for
uniformity of comparison. You may, for example, want to store on disk a snapshot of the current daily activity every day at 19.00, fur future
reference.
The ROBOT profile was thought for this purpose: automating access to the wealth of statistics that QueueMetrics is able to provide.
To set this up, first make sure that you have at least one user holding the key ROBOT that is used for remote access. A sample user called
robot password robot is provided in the sample database that ships with QueueMetrics.
For security reasons, this user is present in the default database but it must be manually enabled.
Point your browser to the QueueMetrics server with a URL like the following:
http://server/queuemetrics/qm_rep.do?user=robot&pass=robot&queues=q1&period=t0
will download today’s report - the full version - for queue "q1", while the following one
http://server/queuemetrics/qm_rt.do?user=robot&pass=robot&queues=q1|q2
or, for the ajax based page version
http://server/queuemetrics/qm_rt_ajax.do?user=robot&pass=robot&queues=q1|q2
will download the realtime page for queues "q1" and "q2", and
http://server/queuemetrics/qm_wab.do?user=robot&pass=robot&queues=q1|q2
or, for the ajax based page version
http://server/queuemetrics/qm_wab_ajax.do?user=robot&pass=robot&queues=q1|q2
will download the realtime wallboard for queues "q1" and "q2".
It is then easy to automate this behaviour using an automated downloader, like for example the wget command in the Unix environment.
The following web parameters are accepted by the qm_rt (realtime page) and qm_rep (report page) generators:
Parameter
Notes
WAB
RT
REP
user
The user name.
Mandatory.
X
X
X
pass
The user password.
Mandatory.
X
X
X
logfile
The log file to use
( with full path). If
not defined, the
default one will be
used.
X
X
X
queues
One or more queues X
to be analyzed. Use
the pipe symbol to
separate multiple
entries. Use the
Asterisk name for
each queue.
X
X
reportname
The wanted dynamic
report name. If
this parameter is
not specified, the
default report will be
shown. If the report
name contains
special characters,
they should be
X
169
Automating statistics
download: the ROBOT profile
Parameter
Notes
WAB
RT
REP
properly encoded
(for example with
%20 for spaces)
period
The time period to
use. Composed by
a single letter plus
the number of days
to report about. t0:
today - t1: yesterday
d1: last 24hrs - d2:
last 48 hrs
X
filter
A single agent’s
name, like
Agent/123, that will
be used a s a filter
for the analysis.
X
t_from
Initial time,
expressed in the
format yyyy-MMdd.HH:mm:ss, e.g.
2006-01-03.12:00:00.
X
t_to
Ending time,
expressed in the
format yyyy-MMdd.HH:mm:ss, e.g.
2006-02-04.03:00:00.
X
reloads
Always set to 1
X
if the session is
to generate a
reloadable page. Do
not use for general
report extraction.
X
If you run a report, a time interval must be specified, i.e. you have to supply either a "period" or a "t_from"/"t_to" couple.
In addition to the key ROBOT, your user will need the key QUEUE_AN for reporting and REALTIME for realtime monitoring.
18.1. Generate PDF and XLS reports and send them by e-mail
By using the ROBOT profile is possible to generate PDF and XLS reports and send them to a list of e-mail recipients. The report
parameters, like queue, period, report set and the list of recipients should have been already defined in the Report ExportConfiguration
pages Section 21.17, “Report ExportConfiguration pages”.
To generate the PDF and XLS reports the ROBOT user should hold the USR_REPORTS_EXPORT key and all optional
security keys assigned to each export job.
Reports are generated by downloading the following URL (you will probably use wget or a similar tool, and will script this as a cron job so
that it will be run daily or weekly):
http://server:8080/queuemetrics/qm_export_stats_run.do?
username=robot&password=robot&exportId=X
where the exportId X parameter is the job number identifier that could be found on the Report ExportConfiguration pages Section 21.17,
“Report ExportConfiguration pages”. The server generates the required report and send it to a list of recipients. It also returns a copy of
the generated document. If you don’t want QueueMetrics to send e-mails but just need to retrieve the file, avoid configuring any e-mail
recipients.
If there is an error during the document generation or e-mail sending phase, then an error message is returned instead.
Please note that the some configuration settings are required for QueueMetrics when sending e-mails. Further details could
be found on the System Preferences Appendix D, System preferences. We suggest turning on SMTP debug when sending
your first e-mails to understand what is going on.
18.2. Setting up a self-service wallboard
By using the ROBOT profile in conjunction with reloads=1, it is quite simple to set-up an unattended wallboard for QueueMetrics.
170
Automating statistics
download: the ROBOT profile
First of all set up a low-cost Linux box to boot in its graphical environment, automatically launch a web browser and go to the following
URL:
http://server/queuemetrics/qm_wab.do?user=robot&pass=xxx&reloads=1&queues=q1|q2
or, for the ajax based page version
http://server/queuemetrics/qm_wab_ajax.do?user=robot&pass=xxx&reloads=1&queues=q1|
q2
This command will show an auto-reloading wallboard showing the real-time status of queues Q1 and Q2.
If you connect the new Linux box to a large screen or a video beamer and set it in your call-center where it will be visible by your agents,
you have just set-up a wallboard at a very low cost using commodity hardware and requiring no human intervention but turning it on in the
morning and turning it off in the afternoon.
You can do the same with the real-time screen by using the qm_rt.do or the qm_rt_ajax.do commands to create a very simple real-time
monitor running all day long for your supervisors.
Please note that there is a difference between results produced by the XML rpc realtime calls and the realtime statistics
produced through the QueueMetrics GUI when the key realtime.members_only is equal to true. The difference is related to
the agents list shown. Being the list of queues, in the XML-RPC call, specified by a list of names instead of a list of queue
unique identifiers, is not possible to correctly identify elementary queues from macro queues having the same name. In this
situation the agent list will always be calculated as sum of all agents associated to all elementary queues composing the
macro queue, even if the macro queue has directly assigned agent.
171
Chapter 19. Storing queue data on MySQL
QueueMetrics lets you store the queue_log data on a MySQL table and is able to produce the very same analyses - including real-time
analyses - from data stored on a database.
This scenario is mostly useful for large call centres, where the queue_log data starts to be quite large and the main Asterisk server is quite
busy handling its own traffic. In this case, it would be a better solution to have QM run on a separate server, so that even if it has to run a
huge analysis the main Asterisk server will not be slowed down.
QM lets you have a deployment scenario like the following one:
In this case, we see that we are using two separate servers; one for the database and one for the QueueMetrics server itself. It is possible
to use the same server for both the database and QM, or to consolidate the database on an existing database server and QM on an
existing servlet container.
It is very important that all the servers share the same system time; this way real-time events will be shown in an exact way
1
19.1. Who should use MySQL storage?
MySQL storage is useful in the following scenarios:
• Large call centres with a very busy or mission-critical Asterisk server
• Large QM reports run very often
• A large number of agents reloading QM agents pages
• Clustered call-centres monitored by a single QueueMetrics instance
In smaller environments (up to 10 agents), it is probably overkill to use MySQL storage, because the extra complexity will not be matched
by an extra performance advantage.
19.2. Understanding MySQL storage
The QM database storage engine was built with a need to adapt to existing MySQL schemas; therefore the database storage option is very
flexible.
It lets you:
• Define the names of each SQL field
• Define the name of the SQL table used (it must reside in the same database as the other QM tables)
• Define one or more table partitions
The storage system makes no assumptions on the underlying field layout of the table used, therefore you are free to define each field as
you best see fit for your scenario.
To obtain these results, the SQL settings are divided into presets and partitions.
A preset is a schema definition to be used, i.e. the names of each field involved in database storage. You can have a number of different
presets, e.g. to connect to different tables in the same database. Presets are defined in the WEB-INF/configuration.properties file.
1
The ntpdate command can be used on Linux to synchronize the system clock to an external timing source with a high degree of precision. Usage in a daily cron script is highly
recommended
172
Storing queue data on MySQL
A sample preset can be seen here:
# Preset 1: standard DB access. Edit to suit your DB needs.
sqlPreset.1.table=queue_log
sqlPreset.1.f_time_id=time_id
sqlPreset.1.f_call_id=call_id
sqlPreset.1.f_queue=queue
sqlPreset.1.f_agent=agent
sqlPreset.1.f_verb=verb
sqlPreset.1.f_partition=partition
sqlPreset.1.f_data1=data1
sqlPreset.1.f_data2=data2
sqlPreset.1.f_data3=data3
sqlPreset.1.f_data4=data4
sqlPreset.1.f_incr=unique_row_count
You can have more than one preset, by entering the same data multiple times under sqlPreset.1.., sqlPreset.2.., sqlPreset.3.. and so on.
The values for each field are:
• Table is the table name
• Time_id is the first field in the queue_log. This is used for most extractions and should be an access key.
• Call_id is the second field of the queue_log
• Queue is the third field of the queue_log
• Agent is the fourth field of the queue_log
• Verb is the fifth field of the queue_log
• Data1..Data4 are the remaining fields of the queue_log. Currently Data4 is not defined in the queue_log; in case just leave it blank.
• Partition is a logical partition of the table.
• Incr: as the minimum time detail for Asterisk activity is by the second, it is possible that events that happen on the very same second
seem to happen in the wrong, meaningless order when the data is read back from the database. It is possible to define an autoincrement field on the table that is used to make sure that rows are fetched from the database in the same exact order they were inserted
into. This table definition is the default for QM since version 1.1
A partition is a key under which separate entries are present in the same queue_log table. You could have separate servers - like test and
production - uploading each one to a different partition, and each of them would be completely independent. This is also used for clustering
scenarios, where a number of different Asterisk server upload data to the same database.
If you use a partition, your partition/time_id combo should be an access key for the table, as QM will access the table every time under this
plan.
If you do not use a partition, just leave this field blank and make sure that time_id is an access key for the table.
19.3. Uploading data to MySQL
There are a number of ways for data to be uploaded into MySQL. If we plan to use the real-time monitoring features, we must upload data
to MySQL as events happen, in order to have them seen immediately by QM.
We have developed a very safe script suitable for small to very high volume for high-volume production systems called qloaderd. It can be
easily started and stopped from the init.d commands and comes complete with start-stop scripts. Its main advantages are the following:
• Extra safe: will check for duplicate lines in the database
• Extra safe: will retry loading data on MySQL connection errors
• Creates a full import log
• Can be started/stopped as a standard system service
You can find it under the WEB-INF/mysql-utils/qloader; do not forget to read the installation docs that are in qloader-README file and to
use the correct init-script for your system.
Starting from QueueMetrics 1.7.0b8 the qloaderd provided with QueueMetrics is no more compatible with previous
QueueMetrics database versions. In order to have it working with previous QueueMetrics installations a database
modification should be applied. This is limited to adding a new field data5 on the queue_log table. The new data5 field
should have properties like other dataX fields already present in the table.
173
Storing queue data on MySQL
In the future, we expect Asterisk to be able to write queue_log data straight to a database via ODBC, so these tricks will not be necessary
anymore.
19.4. Loading data in QueueMetrics
After you configured the table in configuration.properties, using the table is only a matter of inputting
sql:[partition]|[preset]
as the queue_log file name to analyze. The partition defaults to "" (blank) if absent, while the default preset is 1.
You can do it directly from the "Run custom report" form, or preset the file name in configuration.properties as you best see fit by setting the
default.queue_log_file property.
Examples:
sql:P03
Means accessing the partition named "P03" for preset #1.
sql:X23|3
Means accessing the partition named "X23" for preset #3.
sql:|2
Means accessing the present #2 with no partition, and
sql:
Accesses preset #1 with no partition.
If you use agents pages, keep in mind that the value in realtime.max_bytes_agent will not be the portion of the queue_log to be read, but
the time interval (in seconds) that will be read for the current agent (i.e. if set to 10000, it will search agent data for the last three hours or
so).
When you enter a "sql:" file name, the error "The file sql: does not exist" means that there is a misconfiguration of the table access fields in
configuration.properties.
19.5. Checking MySQL database status
As it is not very immediate to "see" if a partition is being loaded and how much information is available on the database, we provide a
"Mysql Storage Information" page (accessible from the main "Edit settings" menu if the user holds the key USR_MYSQL) that provides
general database information.
By clicking on the link, a new page will be loaded showing the available partitions; by clicking on the "Details" button, information for the
chosen partition is extracted.
174
Storing queue data on MySQL
The total number of rows in table and the total table space is shown; for each partition, its minimum and maximum data entries and its
"heartbeat", that is fake entries that the qloaderd process will add to notify the server that the connection is still alive even if Asterisk is
producing no data.
The "number of calls" is a very rough estimate with no logic in it - it may differ a lot from the actual data calculated by reading the log. Only
its order of magnitude should match the other reports.
For each partition, all distinct agents and queues are reported, and their first and last appearance on the database. The "Days" is the time
difference in days between the first and last reference.
Please not e that accessing this page causes a number of table-scan queries to be performed on the MySQL table - the page might
become irresponsive or MySQL can be slowed down if your queue_log table is very large.
19.6. Optimizing the queue_log table
If you do a number of deletes followed by inserts on the queue_log table, for example because you manually delete a partition and upload
data in another one, the table access plan may become sub-optimal and performance may suffer. The same happens if you upload multiple
queue_log instances at once to different partitions, for example if you run a cluster.
In this case, you can manually run the following MySQL query to optimize the table:
ALTER TABLE queue_log ORDER BY partition, time_id, unique_row_count
This might take a while to run and may lock your table until it’s complete. It is not necessary to run this query if you only upload data without
ever deleting it for one single partition.
If you run a busy cluster, running it daily at a scheduled, off-peak time might produce the best results.
19.7. Using the Asterisk Realtime QueueLog subsystem
Since Asterisk 1.6.x and QueueMetrics 1.6.0 it is possible to delegate the queue logging to the Asterisk Realtime subsystem. With this
option the QueueMetrics MySQL database log will be replaced by the MySQL database populated by Asterisk.
As it is way more likely that a database will be temporarily down versus a simple text file, we generally suggest using the
flat-file queue_log logging plus qloaderd, that is optimized to avoid any possible data loss in cases of MySQL unavailability.
As the procedure to follow is different based on the version of Asterisk you are running, please check the Asterisk version before
continuing.
In any case, as a first step you need to enable the Asterisk Realtime QueueLog subsystem, as reported in http://www.voip-info.org/wiki/
view/Asterisk+queue_log+on+MySQL.
As Asterisk will be logging data to its own database, it is of paramount importance that:
• The Asterisk database is kept on the same MySQL server as the QueueMetrics database
• The user (generally queuemetrics) that Qm uses to connect to the database has read grants on Asterisk’s database
This can usually be obtained by issuing an SQL command like:
GRANT ALL PRIVILEGES
ON asteriskdb.queue_log
TO 'queuemetrics'@'%'
IDENTIFIED BY 'javadude';
Please note that, if the Asterisk Realtime QueueLog subsystem is used, the qloader process is not needed anymore.
Also, as the default Asterisk tables have no concept of "partition", a placeholder partition ("-") is used instead.
19.7.1. Realtime on Asterisk 1.6
First you need to change the default.queue_log_file key, in the configuration.properties file, in order to have something like that:
default.queue_log_file=sql:-|a16
This tells QueueMetrics to instantiate the proper Asterisk realtime analyzer and to read, in this case, the preset called a16. You need to add
it to the configuration.properties file as follow (if it is not present):
sqlPreset.a16.table=asteriskdb.queue_log
sqlPreset.a16.f_time_id=time
sqlPreset.a16.use_timestamp=true
175
Storing queue data on MySQL
sqlPreset.a16.f_call_id=callid
sqlPreset.a16.f_queue=queuename
sqlPreset.a16.f_agent=agent
sqlPreset.a16.f_verb=event
sqlPreset.a16.f_partition=
sqlPreset.a16.f_data1=data
sqlPreset.a16.f_data2=
sqlPreset.a16.f_data3=
sqlPreset.a16.f_data4=
sqlPreset.a16.f_data5=
sqlPreset.a16.f_incr=id
This defines the table structure (and name) QueueMetrics will expect to find and must match the Asterisk realtime database definition.
The "table" entry is made up of the name of the Asterisk database followed by a dot followed by the name of the queue_log
table.
Optimizing access performance
Thought the basic table definition will work out-of-the-box, QueueMetrics relies heavily on database access in order to produce any output.
It is therefore important to issue the following statements on the Asterisk database so that its table is ready for QueueMetrics:
ALTER TABLE queue_log
CHANGE COLUMN `time` `time` INT(10) NOT NULL DEFAULT 0;
ALTER TABLE queue_log ADD INDEX
ALTER TABLE queue_log ADD INDEX
qm_main ( `time`, `queuename` );
qm_hotdesk ( `event`, `time` );
The first statement makes sure that the time column be numeric, and the other two add QM’s main access indexes.
And what about the old access format?
Versions of QM before 1.7.2 used to have the format "astr:" to access the ARA database. This is still present but we do not
encourage using it anymore.
The format "astr:" is deprecated since QM Versions after 14.10.9 and can no more be used.
19.7.2. Realtime on Asterisk 1.8+
First you need to change the default.queue_log_file key, in the configuration.properties file, in order to have something like that:
default.queue_log_file=sql:-|a18
This tells QueueMetrics to instantiate the proper Asterisk realtime analyzer and to read, in this case, the preset called a18. You need to add
it to the configuration.properties file as follow (if it is not present):
sqlPreset.a18.table=asteriskdb.queue_log
sqlPreset.a18.f_time_id=time
sqlPreset.a18.use_timestamp=false
sqlPreset.a18.f_call_id=callid
sqlPreset.a18.f_queue=queuename
sqlPreset.a18.f_agent=agent
sqlPreset.a18.f_verb=event
sqlPreset.a18.f_partition=
sqlPreset.a18.f_data1=data1
sqlPreset.a18.f_data2=data2
sqlPreset.a18.f_data3=data3
sqlPreset.a18.f_data4=data4
sqlPreset.a18.f_data5=data5
176
Storing queue data on MySQL
sqlPreset.a18.f_incr=
This defines the table structure (and name) QueueMetrics will expect to find and must match the Asterisk realtime database definition.
The "table" entry is made up of the name of the Asterisk database followed by a dot followed by the name of the queue_log
table.
As this table format does not preserve the insert ordering when reading, QM may produce incorrect results unless you
perform all the steps described in the "optimization" section below.
Optimizing access performance
Thought the basic table definition will work out-of-the-box, QueueMetrics relies heavily on database access in order to produce any output.
It is therefore important to issue the following statements on the Asterisk database so that its table is ready for QueueMetrics:
ALTER TABLE queue_log
ADD COLUMN id INT(10) AUTO_INCREMENT NOT NULL FIRST,
ADD PRIMARY KEY(id);
ALTER TABLE `queue_log`
ALTER TABLE `queue_log`
DROP INDEX `bydate`;
DROP INDEX `qname`;
ALTER TABLE queue_log ADD INDEX
ALTER TABLE queue_log ADD INDEX
qm_main ( `time`, `queuename` );
qm_hotdesk ( `event`, `time` );
The first statement makes sure that there is an order-preserving index on the table, so that lines that have been inserted in the same
second still hold the original sequence when read.
The second set of statements drops indexes that are not needed by QueueMetrics; and the third set creates indexes that are needed for
efficient data retrieval in QM.
You will also need to change the property:
sqlPreset.a18.f_incr=id
So that the order-preserving index is used by QM.
177
Chapter 20. Monitoring clusters with
QueueMetrics
QueueMetrics is able to monitor clusters of Asterisk servers, in order to monitor large call centres that are spread over a number of physical
machines. This setting is often used for large deployments, as it leads to a number of advantages:
• The overall call center is safer, as the failure of one single Asterisk box leads to a down of only part of the call center an not its entirety
• The call center can easily grow to hundreds of seats simply by adding more Asterisk servers, without special optimizations or weird
configurations
• There is less risk of a deadlock on one single Asterisk instance, as the load on each box is kept low enough not to be a problem
In order to implement this, QueueMetrics has been extended to support the notion of cluster, that is a set of Asterisk servers working
together as if they were one single box. The cluster can be set up as is better fit, for example:
• Different queues for each Asterisk box, or
• The same queues on more than one Asterisk box
• Some boxes are used for inbound and some for outbound
When QueueMetrics runs in cluster mode, the whole call center is monitored as if it were a big single Asterisk box, and the basic unit for
reporting remains the set of selected queues. QueueMetrics will internally query the different servers or queue_log files as needed, and will
automatically dispatch events to the correct Asterisk box.
20.1. Setting up a cluster
To set up a cluster, you should define the following configuration variables in configuration.properties:
cluster.servers=aleph|trix
This statement tells QM that the current cluster has two members, that are called "aleph" and "trix". We suggest using a short name for
each server, as it will appear in many different screenshots. One option would be using the capital letters, like ""A", "B", "C" etc for different
members of the cluster.
For each server (in our case "aleph", but we’ll have to repeat it for all members of the cluster), we will define the following properties:
cluster.aleph.manager=tcp:user:[email protected]
This tells QueueMetrics that the manager interface for aleph can be found at 10.10.3.5, logging in as "user" with password "pass". The
manager interface is needed to run Live monitoring and can be used to run commands to Asterisk (like logging agents on and off, starting
chanspy sessions, etc).
cluster.aleph.queuelog=sql:P001
This tells QM that the queue_log file (or its contents) can be downloaded from partition P001 of the QM database. You must use MySQL
storage in order for clustering to work at all.
cluster.aleph.monitored_calls=/share/aleph/calls/
This tells QM where to look for recorded calls on each Asterisk server. This is used by QueueMetrics in order to click-and-listen to recorded
calls. A NFS or SMB share is usually a good starting point. As an alternative, you can enter the URL of an XML-RPC server that will
return information about the recorded call (for more information on this topic, see Section 24.11, “Enabling XML-RPC call listening and
streaming”).
cluster.aleph.callfilesdir=/share/aleph/callfiles/
If you do not want to connect to your Asterisk servers using the manager interface, you still need a way to send it commands (e.g. to start a
chanspy session). In order to do this, you should give QM a directory to write callfiles to. If you use the manager interface, leave this entry
blank. (We strongly suggest doing so and using the manager interface instead).
cluster.aleph.audioRpcServer=http://myserver/xmlRpcServer
If you use an XML-RPC "broker" in order to used live calls listening using a third-party software like Orecx, you should enter its URL here.
This must be activated at once for all servers by not leaving blank in the property default.audioRpcServer. In all other cases, just leave this
property blank. (for more information on this topic, see Section 24.11, “Enabling XML-RPC call listening and streaming”).
cluster.aleph.agentSecurityKey=AAA
When using the agent’s page in cluster mode, you must make sure that each agent "points" to the correct server, as this server will be
used for both pulling agent’s data and sending logon/logoff commands. This is obtained on the agent’s page through a pull-down menu
where the agent must select the correct server he’s logged on to. In order to avoid mistakes, it is possible to protect a server by adding
178
Monitoring clusters with QueueMetrics
a security key, so that only agents having that security key will see that server. If an agent has only one possible server, that server will
be automatically selected. In practice, this means that you could create two agent classes, we call them AGENT_A and AGENT_B. They
have the same keys, but in class AGENT_A there is the key SERVER_A, and in the other SERVER_B. We protect each server entry with
SERVER_A for the first and SERVER_B for the other. Then we assign users to classes AGENT_A (for agents working on the first server)
and AGENT_B (for agents working on the second server). If you want agents to manually switch servers, or your cluster is made up of only
one machine, leave this blank.
20.2. Setting up the members of the cluster
On each box that is a member of the cluster, you should set up the following items:
• Call recording: if calls are recorded to be played back through QueueMetrics, you should store them all in a directory that is accessible
through the QueueMetrics server, or set up an external XML-RPC call broker.
• Commands: if commands are to be sent to each Asterisk box, you should set up the [queuemetrics] context in the dial plan, and make
sure the manager interface is set up or the /vars/spool/asterisk/callfiles directory is shared and accessible to the QueueMetrics server. A
sample [queuemetrics] context can be found under WEB-INF/mysql-utils in the directory extensions-examples.
• Logs: you should use qloaderd to upload data to a partition on the main QueueMetrics database. Make sure that each server uploads
data to a different partition in the same database.
• Clock: make sure the clocks on all members of the cluster is synchronized, and the same goes for the clock used on the QueueMetrics
box and on the MySQL database. An utility that sync your machine’s clock to an external timing source like ntpdate will take care of this
problem if run periodically through cron.
20.3. Setting up QueueMetrics to access the cluster
First thing, you should make sure that you have a clustered license for QueueMetrics and that your license is big enough in terms of agents
to support all agents that are present in the call-center. Older licenses are valid for one Asterisk server only and QueueMetrics will complain
they are not correct. The first releases of QueueMetrics 1.4 will anyway allow accessing a cluster up to a specified future date (likely
October 2007).
To report on all members of a cluster, you should set the property:
default.queue_log_file=cluster:*
This means that all boxes defined as members of this cluster will be used a s a data source.
To report on a subset of the members of the cluster, you will use a syntax like:
default.queue_log_file=cluster:A|B|C
This way you will be reporting on boxes A, B and C.
If you want to report only on a single box, the syntax:
default.queue_log_file=cluster:C
Will be appropriate.
You can then change this property on-the-fly by going to the "Custom reports" page and editing as needed under the "File" text box.
If you have agents using QueueMetrics’s Agent’s pages, you should set them up so that each agents points to its correct server.
20.4. Using the Agent’s page with a clustered environment
The agent’s page on QueueMetrics acts as a kind of portal for an agent; she can use it to log on, log off, go to pause, enter pause codes,
launch external apps linked to a call (e.g. CRM apps) and enter call codes (see The real-time agent page).
As the number of agents can be very high if compared to the number of supervisors who run reports or monitor the call center, QM uses a
"minimal impact" policy: the page must be refreshed manually by each agent in order to avoid hammering the server with repeated page
hits and the analysis run is a stripped-down, low-fat version of the full analysis QueueMetrics is able to perform. When coming to clusters,
this means that to avoid useless load, calls for an agent will be searched only on the server the agent is working on and not on the entire
cluster.
Also, we have the problem of defining where an agent is supposed to work: as QM can issue commands to Asterisk on behalf of an agent,
it needs to know to which Asterisk server those commands must go. This is obtained by using the Server selection that will appear on the
agent’s page if QueueMetrics is running in clustered mode. If more than one server is selectable, the combo box will let the agent switch
server as she best sees fit (if only one server is selectable, QueueMetrics will use that server immediately and will make the combo locked).
As a QM installer, you can control which servers are selectable to which agents by setting the properties cluster.---.agentSecurityKey
correctly for each Asterisk server in the cluster.
179
Chapter 21. Editing QueueMetrics settings
System configuration must be done by the system administrator. Most configuration may be done straight from QM itself, while system wide
preferences must be set editing a text file on the installation server.
To log on as an administrator, you can use the supplied account demoadmin, password demo, that will bring you to a home page like the
following one:
21.1. Configuring users
Users and classes can be added, modified and deleted right from QM.
A list of users is presented and you can filter it by class or user name.
For each user, the login and full name are shown, together with the current class and any additional user keys. A user must be enabled
in order to log on, so if you want to prevent somebody from logging on without deleting its user information, you can simply disable it. A
number of default users are shipped with Enable: No in order to prevent unauthorized access.
The list of users is paged and you can use the top box named "Filter" in order to search for a specific user or a set of users that match the
entered substring. You can also click on the column name to toggle ascending versus descending sort order.
The "Create new" button lets you add new users while the "Show classes" button leads to the class editor.
180
Editing QueueMetrics settings
When you add or edit a user, you are presented with a list of fields to enter:
• Userid is a technical reference used internally. Read only.
• Login is the login string.
• Password is the password, shown in clear text.
• Real name is the name shown in the top part of the screen
• Enabled lets you temporarily disable somebody from using QM.
• E-mail is the user’s e-mail address (Optional).
• Masterkey: if set to Yes, all security key checks are bypassed. DO NOT SET UNLESS YOU KNOW WHAT YOU ARE DOING!
• Class is the current user class
• User keys are additional keys the user holds. Separate each key with a space. If a key is preceded by the minus sign, it means it’s
revoked even if the class grants it. The pushbutton HandleKeys starts a wizard helping administrators to proper handle keys for users
(see below).
• Number of logons tells how many times the user logged on in QM. Read only.
• Comment is an optional free comment.
• Token has no current use. Read only.
• Creation and Update: the user and date/time when the record was first created and then last updated. Read only.
When you first log on to QueueMetrics, you must change the passwords to all default users. Failure to do so
represents an important security breach!
The wizard heat icon located under the User keys field opens a popup where all available pre-defined security keys are listed together
with a description. By clicking on each checkbox is possible to assign/unassign the associated key to the user. The wizard helps the
administrator to generate a valid keyset by computing key dependencies and/or uncompatibles key pairs and checking or unckecking keys
accordingly.
181
Editing QueueMetrics settings
Keys inherited from the class where the user is belonging to are greyed out. Is, moreover, possible to uncheck an inherited security key
thus generating the proper negative definition for the edited user.
Flying over a checkbox with the mouse, a tooltip containing the associated security key value is shown.
Pressing Save closes the wizard and updates accordingly the User key list in the user definition page.
21.2. Editing user classes
User classes can be configured freely; you can create individual key rings with special privileges to best suit your needs.
Each class has a set of keys that can be freely edited in much the same way as users by clicking on the "edit" icon (the pencil).
182
Editing QueueMetrics settings
No class can be deleted as long as there is at least one user that is member of it.
The default classes should be enough to get most systems started:
• ADMIN is for the system administrator only, and lets you do nearly everything, including system configuration;
• MANAGERS is for most QM users, the ones that have to run the reports and monitor real-time activity;
• AGENTS is for individual agents logging on to their web page.
• VISITORS is for visitors accessing the simplified real-time page
• ROBOTS is for automated data download
The administrator can start a security key wizard by clicking on the button HandleKeys. For more information on this wizard,
please refer to the previous paragraph.
21.3. Configuring queues
A list of queues must be set before accessing QM. Each queue can be made visible to only a specific set of users by adding a key - this
can be useful if, for example, each queue has a manager viewing data for it, while only a CC manager sees data for all queues in the
center.
You can search for a specific queue by entering data into the Filter box on top of the page, or change the default sort order for the list by
clicking on one of the column names.
The default page shows:
• The queue Alias and Composition
• The Wrap and Announcement durations
• The key protecting the queue, if any
• FP - Front Page: Whether that queue will be visible from the queue selection boxes
• The number of known agents that are member of the queue, by service level (as Main - Wrap - Spill).
The pencil icon will let you edit the queue, while the "People with pencil" icon lets you change queue associations. The pie chart icon at the
end allows to define/assign the set of queues on which agents can run reports. No specific key or property are required, but this feature is
183
Editing QueueMetrics settings
only available as of QueueMetrics version 12.10. For an administrator to make this feature available for the agent, it is necessary to have at
least one queue and a report assigned to the agent. See also Section 21.16, “Configuring reports” for further details.
For each queue you have to define:
• An Alias, that is the name users will see in the queues combo box on the Home Page;
• A set of Queues, that can be the name of an Asterisk queue as seen from the Queue() command or a set of names separated by the
pipe symbol, as in queue1|queue2|queue3. This lets you aggregate queues freely. You can also use the * and ? wildcard symbols (see
below).
• An optional Wrap-up time, i.e. how many seconds an agent stays idle after hanging up;
• An optional Announcement duration, that lets you deduce the duration of the queue announcement that is played to the agent from the
actual metrics;
184
Editing QueueMetrics settings
• An optional Visibility key, that makes the queue visible only to users holding that key.
• The Call flow direction, i.e. whether the queue is an inbound (classical) queue or an outbound queue (made to track individuals agents
calling out or the activity of a full-fledged predictive dialler). Select "any call" when you aggregate queues with different call flow settings.
• If it’s Shown on front page, that is, in the main Queue selector combo box (if not, the queue is said to be invisible).
• A Chat group, that is, the XMPP address of a queue manager
• A Default URL to be used on the Agent’s page if no URL is passed in the queue log in order to open a third-party application.
The rules followed by QueueMetrics when displaying the icon link (and the associated URL) are as follows.
On the report pages:
A: If the reporting queue is not a composed queue and the queue has an associated URL (coming from the queue definition page), then
this URL is shown.
B: If the reporting queue is a composed queue and/or no URL is associated to that queue in the queue definition page, then:
B1: If the call has an associated URL in the queue_log, this will be shown
B2: If the call has not an associated URL in the queue_log then the URL specified in the configuration properties key default.crmapp will be
shown. If no default.crmapp URL has been specified in the configuration properties file, the icon will not be shown.
On the live agent page:
A: If the queue where the call comes has an associated URL in the queue configuration page then this URL is shown for each call
B: If the queue where the call comes has not an associated URL in the queue configuration page then:
B1: If the call has an associatd URL in the queue_log, this will be shown
B2: If the call has not an associated URL in the queue_log then the URL specified in the configuration properties key default.crmapp will be
shown. If no default.crmapp URL has been specified in the configuration properties file, the icon will not be shown.
• A number of Attention levels, see below.
• The current known Service groups for that queue, i.e. which agents are linked to that queue
• The current WombatDialer campaings for the queue (see below)
• The current AGAW settings for the queue (see below)
By clicking on the Agents icon, you can define the position of each agent as a member of the service groups for that key. An agent cannot
be a member of more than one group per each queue s/he is a member of.
It is of course perfectly legal for an agent defined not to be used in a specific queue.
21.3.1. Setting attention levels (Red and yellow alarms)
It is possible - but not mandatory - to define all or some attention levels for the given queue. To do so, you have to fill in each queue
attention levels parameter with an expression that will be matched to the current property’s value in order to trigger a defined alarm.
QueueMetrics does currently allow to set two possible alarm thresholds; that is a "yellow" and a "red" alarm. You can define one or both of
these properties, according to your preferences. Those values are used currently only to trigger alarms in the real-time panel.
For example, imagine we want to set a yellow alarm on the queue wait for each call; we want cells to turn yellow if the wait time exceeds 30
seconds, and to turn red if it is over one minute. To do so, we enter "> 30" in the yellow alarm box near to "Call wait duration", and "> 60" in
the red alarm box on the same line.
In the case where both yellow and red conditions match, the red alarm prevails.
Currently, the following functions can be used to match a value "=", "<", ">", "!=" (different).
The possible alarms are the following:
• Number of calls in queue: how many calls are present in the queue.
• Number of agents on call: how many agents are on call
• Number of agents waiting: how many agents are idle
185
Editing QueueMetrics settings
• Number of agents paused: how many agents are on pause
• Call wait duration: how much a call is waiting before being answered
• Call talking duration: the duration of the agent’s conversation
21.3.2. Using wildcards in queue names
QueueMetrics allows a limited use of wildcards to group together queue names. Wildcards work by matching the composition of known
single queues, so if a queue is not defined in QueueMetrics (even if it is present on Asterisk) it will NOT be matched by a wildcard of "*".
On the other side, a hidden single queue will be matched by a non-hidden front-page queue whose definition is "*".
With wildcard matching:
• "" stands for any number of characters. E.g., "open" as the queue composition will match any atomic queue starting with "open". Just
entering "*" as a queue composition will match any atomic queue on the system.
• "?" stands for a single character - e.g. "open?" will stand for "open1" and "openq", but not for "open99". You can group together a number
of question marks to match multi-character sequences of known length, e.g. "open??" will match "open99".
21.3.3. Configuring redial services through WombatDialer
WombatDialer is highly scalable, multi-server, easy-to-use telecasting platform produced by Loway. Queues in QueueMetrics can be
associated to dial campaigns in WombatDialer thus allowing easy implementation of recall services. By specifying a set of pipe separated
campaings and a maximum recall day period, an agent can schedule a recall by clicking on an icon on the call list in their own agent’s
page. For further clarifications, see section Section 8.7.10, “Recall Scheduler”
21.3.4. Configuring queues to be processed by the AGAW Runner
The AGAW Runner will use the following rules to decide which queues and agents to process:
• All queues that are "simple", i.e. not composite, are taken into consideration for processing by the runner. All queues that have the
AGAW runner enabled will be actually processed (you must enable that manually in the queue config page).
• All agents that are linked to a queue are processed for that queue, even if there is no data for them; plus, any unknown agent that is
detected working on a queue is processed for that queue..
In order for a queue to be processed by the runner, and show visible metrics to the user:
• The "Will AGAW be run…" must be set to "yes"
• The Items defined must be > 0 (or the agent will see no metrics)
• The AGAW enabled should be "Yes"
• The AGAW look back period can be left blank (default). This is the size of the look-back period the AGAW runner uses.
The set of metrics that is enabled and their alarms is defined in the AGAW queue configuration screen (click on the "AGAW alarms"
button):
As you can see, for each metric there are a couple of switches that decide:
• Whether that metrics is to be shown at all
186
Editing QueueMetrics settings
• Red and yellow alarm levels for the whole queue (to be shown in AGAW, so they might differ from the ones used for the real-time page)
• Red and yellow alarm levels for each agent separately
These settings are applied from the next run of the AGAW runner, so they can be modified while the AGAW runner is active and will be
picked up when the relevant queue is processed.
All values are always computed; you can toggle visibility of values on and off (if they are "Off" they are visible in the AGAW monitor but
NOT to the user).
Alarms can be expressed as:
• Integers (for time periods and n. calls)
• Floating-point values ( e.g. > 3.7)
• Percentages (e.g. > 10%).
While percentages for the Queue part translate to the corresponding ratio (e.g. 10% means 0.1) in the Agent part they are anchored to the
Queue metrics - that is if number of calls is at a given moment 1000 and there is an agent alarm at "< 1%" , if the number of calls taken by
that agent are less than 1% of the queue the alarm will be triggered.
If you need to express a fixed percentage in the Agent part, use the corresponding ratio, as in the Qualified Conversion example above.
21.4. Configuring agents
Agents should be configured so that they:
• are decoded to their own name when they are found in reports
• can be set as members of service levels for queues.
• can be assigned an optional Location, that can also be used as a filter condition.
• can be assigned an optional User Group, that can also be used as a filter condition.
• can be assigned to a Supervisor
• can have a VNC URL defined
• can have a Current Teminal defined.
When editing an agent, the following screenshot appears:
For each agent in use, enter:
• Agent code as the Asterisk agent code, e.g. Agent/101;
187
Editing QueueMetrics settings
• Agent description as the agent’s own name.
• Default server: for cluster mode, the default server for the agent. This information is used to pre-populate the related field in the realtime
agent page logon panel. Leave empty if the agent is not associated to a specific server.
• Agent location and Agent group can be selected from a drop-down list of defined locations. Leave blank if not needed.
• VNC Monitoring URL: the URL that will launch the VNC monitoring app for the given agent
• Current terminal: the current terminal for the given agent. If this field is left blank, unattended audio monitoring will not work. If you are
using regular Asterisk agents, just enter "-" as the current terminal to make audio monitoring work. This field is used to pre-populate the
"Current extension" field in the agent real-time logon panel.
• Instant messenger address: an XMPP address associated to the agent. Used in the real-time page for supervisors to initiate a chat with
the agent.
• WebPhone Username: the SIP username used by the softphone in the realtime agent page to authenticate the agent
• WebPhone Password: the SIP password used by the sofphone in the realtime agent page to authenticate the agent
• WebPhone Realm: The authentication SIP Realm used by the softphone in the realtime agent page to authenticate the agent
• WebPhone SIP Uri: An optional SIP URI used by the softphone. If blank, the username@sipserver [mailto:username@sipserver] is used
• Supervisor: the supervisor for this agent. This can be selected between all users holding the key SUPERVISOR.
If you want an agent to log on to their own page, you also have to create a user with the same name.
On the bottom of the page, the current association of that agent to a set of queues is shown.
It is now possible to add one or more "friendly names" for agents within the "Asterisk aliases" field, which can be found in the Agent Detail
page. The Agent Detail page is accessed by selecting the "Edit agents" link on the QueueMetrics Home page and then clicking on the
"Edit" icon for a specific agent.
21.5. Configuring locations
The following configuration transaction lets you define locations for your agents. To access this page, a user must be holding the
USR_LOCATION key.
188
Editing QueueMetrics settings
Each location has a short name, a longer description, and a visibility key, so that only users holding that key may select that location as a
source for reports.
A location cannot be deleted if at least one agent is defined for that location.
21.6. Configuring call outcomes
We define a call outcome as a flag to be added to a call, either when the call is ongoing or when the call has just finished, that will signal
the result of the call from a business point of view. Such a flag is optional for QueueMetrics and can be added to both incoming and
outgoing traffic.
The call outcome will be defined by a numeric sequence that the agent will either key in on their telephone terminal or report through
QueueMetrics itself through the Agent’s page. QueueMetrics will not consider how the sequence is entered, as long as it’s present in the
queue_log data it runs on. Such records can be generated, for example, by an outbound dialler that is able to pre-screen answered traffic.
To minimize internal searching costs, the call activity must be entered either while the call is in progress or within one hour of its
completion. If more than one call activity code is entered, the latest takes precedence over the previous ones.
As you can see, each outcome can set two flags: a "This call qualifies as contact?", "The call qualifies as Qualified Contact" and a "This
call qualifies as sale?" flag. This will be used in order to produce statistics on traffic (see section Section 4.13.1, “How are Call Outcomes
calculated?”).
If a call code is found but not defined through the configuration screen, QM will report on it and treat it as a "No contact" and "No sale" call.
189
Editing QueueMetrics settings
The editor page lets you set:
• A numeric code for that outcome. The system will check that it will not be duplicated on the list (The code should be numeric so it may
optionally be keyed-in using the rep’s terminal)
• A text label for the outcome (e.g. "Contact")
• A flag telling the system whether that outcome counts as a "Contact"
• A flag telling the system whether that outcome counts as a "Sale"
• An optional security key for that outcome. This will be used only when displaying outcome choices for a given call in the Agent’s page.
The reporting engine will report on all outcomes present in its analysis.
• A Queue visibility list - you can list a set of atomic queues for which this code will be displayed. Queues are separated by whitespaces.
The field accepts wildcards to match multiple queues and/or subqueues. If the field is left blank, then the code is displayed for all queues.
21.7. Configuring Feature Codes
For call centers that require to analyze agent performances at a level below call outcome, the concept of feature codes has been added
since QueueMetrics version 15.09. A user can think about feature code like a sub-outcomes. They can, optionally, have hierarchical
relationships with the primary outcome code. A simple example of the feature code concept is the pair of outcome/feature like "Not
Interested"/"costs too much". A call may have an unlimited number of features associated with. Some features may be flagged as goal.
Goal features are counted separately and generate separated statistical figures in reports.
Editing feature codes requires holding the key USR_OUTCOME.
By clicking on Create New button or on the pencil icon present on each feature code row in the list, a user can create or edit an already
present feature code.
190
Editing QueueMetrics settings
As told before, tag features can be linked with a specific outcome code set. To link a feature code with a specific outcome or set of
outcomes, a user should select the outcome from the dropdown, then click on the Add button. The list of already associated outcomes are
shown below the dropdown. To remove an outcome association, a user should select the proper outcome from the dropdown, then click on
the Del button.
Clicking on Save updates the feature code on QueueMetrics database.
21.8. Configuring Tag Codes
Some call centers require to report call set at the list level below campaign. This is frequently used for outbound campaings. The idea is
to add the concept of generic tag to calls, so that, if assigned to each calls, it could be used to create a new level of reporting, parallel to
the queue. When each call is associated to a single tag, the queue would be the physical medium for handling calls, while the tag could
bee freely set. Imagine, for example, to set up a special number for a Tv Ad, or a printed advertising, that makes it possible to discriminate
where the caller saw the Ad. Tags are set by the system (i.e. there is no way for QueueMetrics to add a tag on a specific call but is up
to the PBX/dialplan to add a tag signature in the queue log); for more information on that, please refer to this paragraph Section 24.18,
“Adding TAG information to calls”. Tags associated to a call will be shown by QueueMetrics and decoded following the tag list defined by
the administration page, as reported below.
191
Editing QueueMetrics settings
By clicking on Create New button or on the pencil icon present on each tag code row in the list, a user can create or edit an already present
tag description.
Tags definition/listing is available only for users holding the USR_CALLTAG security key.
21.9. Configuring pause codes
The agent’s time is defined in QueueMetrics as made up of different activities. The main activity for an agent will be "Available time", i.e.
the time when an agent is ready taking or placing calls. When an agent pauses out of "Available time", they may want to flag the reason for
the pausing, e.g. doing backend activities, lunch, etc. This way you can track agent activities punctually. If they don’t flag a pause, it will be
computed as simply "Pause" time.
Each pause code is written on the queue log while the pause in progress, i.e. after the agent goes on pause and before the agent stops
that pause. The pause code will usually be defined by a numeric sequence that the agent will either key in on their telephone terminal or
report through QueueMetrics itself through the Agent’s page. QueueMetrics will not consider how the sequence is entered, as long as it’s
present in the queue_log data it runs on.
For each pause code, it is possible to tell QueueMetrics whether that time is:
• billable or non-billable - whether the pause will be counted for client billing
• payable or non-payable - whether the pause will be counted for payroll generation
192
Editing QueueMetrics settings
All activities are optional and may be added or deleted at will. The following fields apply:
• A numeric code for that activity. The system will check that it will not be duplicated on the list (The code should be numeric so it may
optionally be keyed-in using the rep’s terminal. This is not a technical requirement anyway)
• A text label for the activity (e.g. "Lunch")
• A flag telling the system whether that activity is: Billable or Not Billable
• A flag telling the system whether that activity is: Payable or Not payable
• A flag showing the type of pause. A pause can be a standard pause, or a pause of the ACD made to produce outbound calls, or a call
wrap-up pause (As of QueueMetrics 1.7.0, this is partially implemented only in the AGAW sub system) or an administation type pause.
• An optional security key for that activity. This will be used only when displaying activity choices in the Agent’s page. The reporting engine
will report on all activities present in its analysis.
21.10. Configuring agent groups
An agent group is an attribute that is applied to an agent in order to keep track of their life-cycle. This is used as a filtering criterion in QM
and is developed in the QA monitoring subsystem.
The idea here is that you can have e.g. "New hires", "Regular agents", "Expert agents"; each agent group has a different icon, that is
displayed throughout QM whenever the agent name is displayed.
You can select different icons by clicking on them in the editor.
193
Editing QueueMetrics settings
you can add more icons that better suit your liking by uploading them to the /img/agent_groups folder in QueueMetrics.
21.11. Configuring skills
Skills are attributes that can be associated to a call and can be used to implement somethig useful like skill based routing on Asterisk
queues. QueueMetrics reports can be filtered by a set of specific skills through the custom report page. Skill codes can be associated to
labels through the skill configuration page available to all users holding the USR_SKILLS security key.
The list of available skills can be reach from the main page.
Clicking on the Create New button or the pencil icon on each skill reported in the table, is possible to create or edit a skill entry.
194
Editing QueueMetrics settings
21.12. Configuring known numbers
Known numbers are phone numbers that are known to QueueMetrics and can have properties associated to them. They are meant to be
used by the numberLookup API in order to implement strategies based on the calling number - see Section 24.22, “Using known numbers”
At the moment, QueueMetrics will use "known numbers" to:
• Earmark specific calls as BLACKLIST or VIP, where at the dialplan level a proper function is implemented to route thise numbers to
specific high priority / low priority queues
• Store a known description for the number that can be used to set a caller-id for the number in a format that will make the number "stand
out". It coud be the name of a client, or their CRM IDs
• Store a known agent affinity for the number, where at the dialplan level there is an attempt to route the call to a specific agent before
queuing the number on a "general purpouse" queue
In order to access this page, users must hold the security key USR_KNUMBERS.
When editing a record, you see a form like the following one:
195
Editing QueueMetrics settings
The editor will track:
• A number. This can be input freely, es "(555) 555-5555", and will be internally normalized to the sequence of DTMF digits it uses.
• A name. This will be used by the service "name"
• An action, currently belonging to the set:
• BLACKLIST
• VIP
• None (used in the case you just want affinity or name decoding)
• A free text descripton
• An agent id, to set the agent affinity for this number
• A record expiry date. When the record is expired, all associated attributes are inactive (action, name and affinity)
The editor will also display, in read-only mode:
• The total number of hits that were received for this number. A hit is a successful lookup.
• The time this number was last hit
Each number can only appear once (as per its normalized form) in the editor; attempts to have it listed multiple times will be
rejected.
21.13. Configuring QA forms
The set of current QA forms can be configured through the QA form editor. It shows the current set of defined forms and lets you performs
the usual operations (search, filter, sorting, paged listing…).
196
Editing QueueMetrics settings
The names of each section and the number of items that have been input for that form are shown on the front page. If a form has any
number of items input, it is considered "locked" and cannot be modified anymore, though you can create a different form with the same set
of items.
The form editor looks like the following page:
197
Editing QueueMetrics settings
You can enter:
• The form name
• The security key required (in addition to the basic one) to grade calls using this form
• The security key required (in addition to the basic one) to run reports on this form
• Whether the form allows new input or not; the total number of calls graded using this form is shown
• The names of the section. There can be up to five sections. Any section MUST have a name, and there must be at least one section.
• The threshold values for Call grading (the maximum for "Exceeds expectations" is fixed at 100).
• The labels associated to each level in the Call grading (defaults are "Issue", "Req.Impr.", "Meets exp.", "Exceeds exp."). Please note that
a short label, used on the report pages, could be also defined (defaults are "Issue", "Impr.", "Meet", "Exc.").
• A Queue visibility list - you can list a set of atomic queues for which this form will be displayed. Queues are separated by whitespaces.
The field accepts wildcards to match multiple queues and/or subqueues. If the field is left blank, then the form is displayed for all queues.
To edit the set of items that belong to a form, you should have no data reported for that form. If you have no data, the item editor icon
will show from the main form page.
The editor looks like the following page:
198
Editing QueueMetrics settings
To add a new element, just select an element on the top form and a section it should be added to.
On the main part of the page, you can edit the elements by changing them, moving them up or down and removing them.
The "Active if…" field allows to enter a dependent rule, as described within the following chapter: "Handling dependent questions".
The Extra Score checkbox allows to give extra scoring to a particular question, in order to highlight an agent’s higher performance within
a specific section, or to balance his/her averages. The question in the form will have two main characteristics: it can have a score above
the 100 standard value (up to a maximum of 120) and the score assigned to the question will not be calculated within the denominator part,
when totalling averages for the specific section and the overall QA form.
The "Non Scoring" checkbox, if checked, forces the engine to ignore the inserted question score when calculating the section and form
average. Questions flagged as "Non Scoring" are not classified as "under or over performing items" in the QA form. Non scoring questions
are aggregated on reports based on the number of times a particular score is found in the query period.
When only one extra score question is within a section, the average will show as zero, given that within the denominator
there are no values, but it is null.
21.13.1. Handling dependent questions
Since QueueMetrics 1.7.0, it is possible to have Dependent Questions, i.e. questions that are enabled or disabled according to values
input in a different question.
In order to enable this, a new input area is defined on the right side of each item. Here the administrator can insert a rule that associated
the question to a particular parent question. There are several restrictions in the rule definitions:
• A rule should be defined with the sequence LABEL, OPERATOR and VALUE where:
• LABEL is the short code associated to each item in the section
• OPERATOR is a mathematical operator in the subset: <, >, ⇐, >=, ==, !=
• VALUE is a numerical value in the interval 0 (included) to 100 (included)
• A rule cannot be composed by other rules
When the administrator saves the form, the server will parse each inserted rule and, if an invlalid rule is be found, an exception is raised
specifying the first incorrect rule found. The administrator must then modify the wrong rule before submitting the form definition again.
199
Editing QueueMetrics settings
For example, a few rules are defined in the picture above:
• The item NMYN is parent of two items: MYN and NMNUM. The MYN item is enabled only if the value inserted is equal to 0; the NMNUM
item is enabled only if the value associated to the NMYN question is equal to 100.
• The item NMMUL is related to the itemMNUM. This question is enabled only if the score given to the MNUM item is greater then 50.
• The question MMUL is a normal question and is always enabled.
A couple of rules govern the way values for dependent question are handled when the question is disabled:
• Dependent questions, when saved, receive a "N/A" value, so they behave like non-madatory items when you check the "N/A" box. The
value will be counted in the grading report statistics following the same rule.
• The "N/A" value works with the same rule even if the dependent question is a shortcut one: if it is disabled it is not considered a shortcut.
21.13.2. Configuring QA items
The set of items that are selectable as members of a form can be configured by the user by clicking on the "Edit items" button at the bottom
of the QA forms editor.
New items can be added and the description can be edited if needed.
The weight of an item is the number of times that an item must be counted in comparison to other items. All form level scores consider the
item’s weight.
200
Editing QueueMetrics settings
If you average an item with a score of 50 and one with a score of 100, each weighting one item, you have an average of
(50+100)/2 = 75. If you average an item with score 50 and weight 2 and one with score 100 and weight one, you get ((50 +
50)+100)/3 = 66!
A shortcut item is an item that, if failed, will fail the entire form. They are marked with a red icon when present.
If a shortcut item fails, the whole form will have an overall score of zero, no matter what other scores are. While averages at
the form level are affected by shortcuts, averages at the item level are not affected.
A session shortcut item is an item that, if failed, will fail the entire section. They are marked with a red icon when present.
If a session shortcut item fails, the whole section will have an overall score of zero, no matter what other scores are.
A mandatory field requires you to select a valid value; if it is not checked, the user can optionally leave those items blank. Mandatory fields
are marked with a green icon.
Different kinds of input can be accepted by the item - see below.
The Engagement code cannot be modified once input, and there can be no two items with the same engagement code.
Items cannot be deleted if they are in use by at least one form. You can see the set of forms that are using the chosen it at the bottom of
the editor’s page.
21.13.3. Item value type: Numeric
A numeric value type must be an integer number between 0 and 100, extremes included.
21.13.4. Item value type: Yes/No
A Yes/No value stores 0 when set to No and 100 if set to Yes.
21.13.5. Item value type: Combo
This lets you create a drop-down selector, asscociating each entry with a given value.
201
Editing QueueMetrics settings
You enter the list of values in "Multi value format" text box, with the format:
40:ToImprove|80:Satisfying|100:Good
Each option is made up of a numeric value plus the colon symbol ":" plus the text to be displayed. Multiple options are separated by the
pipe "|" character.
21.14. Defining agent performance rules
As explained above, in order to track performance you first have to express a set of business targets that express what is expected from
your agents and how much deviations from each rule are comparatively worth, expressed in review points. This is called a ruleset.
This can be done through the proper configuration page by users holding the key "QA_PERF_RULES"; they will see a new link from the
home page:
Selecting the link, a new page is shown listing rulesets already defined. In order to define a new ruleset, you press the "Create New"
button.
The "Create New" button opens a new page where an empty rule is shown, like in the picture below.
202
Editing QueueMetrics settings
Targets will not be displayed until you first save the ruleset.
The creator should assign to the new ruleset a name, a short description, and optionally a security key.
A rule is usually linked to a specific queue (or set of queues) and form. This is because we expect to have homogeneous statistic
distributions in the same queue and form items. This might not be true outside a specific form and/or queue. The user should select a
specific queue and form before pressing "Save".
21.14.1. Available targets
When editing a ruleset, you see it is actually built out of a number of targets. It is important to understand that there are basically two
different kinds of targets:
• "Aggregated" targets - identified by AVG - that are computed once per agent, and
• "Atomic" targets that are computed for each call handled by the agent
When computing the review score for an agent, first each call is checked against atomic targets and a first score is computed, then
averages for the dataset are taken, and they are computed against aggregated targets and an aggregate score is computed; the final score
is the sum of both scores.
You can use either type of target, or both as once, as you best see fit. Try and run some tests to make yourself familiar with
the ruleset.
203
Editing QueueMetrics settings
It is important to note that some targets are not available as atomic targets. Examples are the QCPH, Sales, Number of
calls, (Qualified) Conversion etc. that are obviously associated to a set of calls and make no sense in relation to a single
call.
21.14.2. Setting targets
For each possible target within the rule set, you can:
• Enable or Disable a specific target rule
• Insert an algebraic expression defining the rule for the "yellow" theshold
• Specify a score that the engine will assign to the target when matching the "yellow" expression
• Insert an algebraic expression defining the rule for the "red" level
• Specify a score that the engine will assign to the target when matching the "red" expression
The algebraic expressions that can be used to define a threshold are:
• simple mathematical expressions formed by an operator (in the set of "<", ">", "#", ">=") and a value.
• X << Y: defines the internal interval between the values X and Y (excluded)
• X ⇐⇐ Y: defines the internal interval between the values X and Y (included)
• X >> Y: defines the external interval outside the values X and Y (excluded)
• X >⇒= Y: defines the external interval outside the values X and Y (included)
Valid examples are:
• "< 10" is triggered by a number lower than 10
• ">= 40" is triggered by a number greater or equalling 40
• "40 << 80" is triggered by a number between 40 and 80
For not-averaged rules the user can access a wizard that simplifies definition of interval-based rules.
21.15. Dataset-based agent performance wizard
A rule set can be inferred from the measured properties of a given data set; this basically lets you express differences in terms of a
percentage of outliers expressed on the total number of calls.
In order to access the wizard, you click on the "pencil" icon:
In this modal dialog you define a start and end time period and the "yellow" and "red" percentage of calls the user wants to include in the
resulting rule, the type of interval (internal or external) and whether the interval extreme values should be included or not in the resulting
rule.
204
Editing QueueMetrics settings
Imagine you want to consider "yellow" the 10% of calls that are too long or too short and red the 5% of calls that are way
too long or way too short in relation to the average length. You would set the "yellow" slider to "90% external" (meaning you
want the external tails) and the "red" slider to "98% external".
The "Go compute" button runs an internal analysis that reports, in the lower right table present in the dialog, the minimum and maximum
values representing the interval fulfilling the inserted parameters and the number of calls analyzed. You can repeat the calculation until
satisfied, then press "Save" to insert the rule in the rule-set or press "Cancel" to forget it.
21.16. Configuring reports
Since version 1.6, QueueMetrics allows for the configuration of reports. This makes it easy to tailor specific reports to specific users,
instead of having all reports shown to all users. It also adds the fexibility to hide part of a report to users that do not have specific keys, and
to edit the titles and subtitles for each reports.
In order to understand reports, it must be understood that a QueueMetrics report is made of a number of screens (the "pages" that the
report is made of), each of which is in turn made of items (the actual tables containing data).
All elements (reports, screens and items) can be key-protected - so it is easy to make a full report, or just a part of it, visible to some users
only.
As both screens and items have a display order you may want to control, they all have an numeric attribute called Sort Order that orders
elements from the lower to the highest.
As QueueMetrics reports include an "All reports" page that in turn includes all elements in order, it is possible to control which elements are
visible in it at the screen and item level; this is useful because you usually do not want extremely large items (like call lists, that may span
over thousand lines) to appear in it.
One last word must be spent for titles; as QueueMetrics is an inherently multi-language application, titles may or may not be localized using
QueueMetrics facilities.
• If a title starts and ends with the "#" symbol, it is looked up in QueueMetrics internal localization resources, so it changes according to the
language the user has chosen. The string must be one of those defined in the localization files.
• In any other case, the string is displayed as-is.
21.16.1. Editing reports
In order to access the reports editor, from the homepage click on QueueMetrics settings → Edit reports.
There will usually be ony one report called "All reports" - this is an automatically-generated report that includes all available reports.
For each report, the number of associated screens is displayed.
Each report can be modified by clicking on the edit icon (the one that looks like a pencil) or the associated screens can be shown by
clicking on the report title.
As creating a full report takes a while, it is possible to create multiple copies of the "All reports" items and then doing minor
customizations by entering a new report name in the "Automatic report configuration" dialog. This is also handy when you
upgrade QueueMetrics and want to test-drive new reports that were not previously available.
205
Editing QueueMetrics settings
If you click on the edit icon, you will see the current report configuration:
• The title and subtitle can be chosen freely and will be shown to the users
• The type must be set to QM Report
• You can enter a visibility key to make this report accessible to some users only
If you click on the pie chart icon, you will access a table where you can assign one or more reports to each agent. No specific key
or property are required, but this feature is only available as of QueueMetrics version 12.10. An administrator can also assign the
maximum amount of time that an agent can have available, when viewing historical reports from the agent web page. The key
default.ssarMaxReportPeriod is defined within the configuration.properties file. If this key is not present within this file, then the default time
is 15 (days).
21.16.2. Editing screens
A report is made of a number of screens. They are the multiple selectable pages that are available when you run a report. As the space is
limited, each screen has a Short title as well as a full title.
You can see that the items are sorted accoring to their Sort index, just as they will be displayed in the main reports. You can also see the
number of asscoiated items for each screen and whether the screen will appear in the "All reports" page.
Each screen can be modified by clicking on the edit icon (the one that looks like a pencil) or the associated items can be shown by clicking
on the screen title.
If you click on the edit icon, you see the details, as shown here:
206
Editing QueueMetrics settings
• The Short name is the one displayed in the horizontal page menu, so it should be very short
• The Title is the one displayed at the top of the page
• The Visibility key lets you hide this screen and all its associated items from user sthat do not have the specified key
• The Sort order is an integer value that tells QueueMetrics how to position this element in respect to all other screens.
• The Visible in All reports toggle decides whether this screen and its associated elements are visible on the "All reports" page
Both the Short name and Title fields display a decoded, localized version of the string just below their input box. This is what
the end-user will actually see.
21.16.3. Editing items
When clicking on a screen title, you display the list of items that belong to that screen.
You can see the title for each item, the Data Object tht actually creates data and its parameters.
Each item can be modified by clicking on the edit icon (the one that looks like a pencil).
207
Editing QueueMetrics settings
• The Title field is the one displayed in bold on top of the table
• The optional Subtitle can be added as an explanation of the meaning of the graph.
• The Visibility key lets you hide this item from users that do not hold the given key.
• The Data Object is the routine that creates the requested table and/or graph. A list of available Data Objects is available here Chapter 6,
Report Details.
• The Parameters field (if present) will let you add additional parameters that control the behavior of the Data Object.
• The Sort order is an integer value that tells QueueMetrics how to position this element in respect to all other screens.
• The Visible in All reports toggle decides whether this item is visible on the "All reports" page
The Title field displays a decoded, localized version of the string just below their input box. This is what the end-user will
actually see.
You cannot have multiple copies of the same DataObject on the same page.
21.17. Report ExportConfiguration pages
Users holding the key USR_REPORTS_EXPORT_EDIT can edit the list of PDF and XLS export jobs.
208
Editing QueueMetrics settings
Each job is associated to a specific query period, queue and report set meaning that, each time the report is run, QueueMetrics calculates
the results based on the input parameters and exports the whole report set to the required format. The generated document is sent to
the recipients list specified for the job. Each job is identified by a numeric id generated by QueueMetrics and shown in the Id column. As
defined in the chapter Generate PDF and XLS reports and send them by e-mail Section 18.1, “Generate PDF and XLS reports and send
them by e-mail” this id has to be used to run the report by an external ROBOT profile.
The user can edit a specific job, by clicking on the pencil icon, or can run it immediately, by clicking on the blue button shown on the list.
The user is allowed to run the report only if holding the USR_REPORTS_EXPORT key.
Each time a user creates or edits a job, the next screen will be shown:
On this page the user is allowed to specify a title, needed to identify the job in the job list, and other relevant parameters like period, queue,
report name (an already defined report set), report type (XLS or PDF) and the orientation (valid only for PDF documents). Each reports
export job could be associated to optional visibility keys used to hide/show the job to a set of users. Finally, a list of e-mail recipients can be
added - if present, on generation, the resulting report will be sent to them.
21.18. Configuring IVR and DID/DNIS names
Users holding the keys USR_IVR and USR_DNIS can edit the list of known IVR and DNIS names.
This list is used to decode the display of known IVR selections and DNIS numbers. Both configuartion pages behave the same way.
209
Editing QueueMetrics settings
If you know that your Support IVR selection is 1-3-4, you could create an IVR entry of 134 that decodes to Support (1-3-4).
This surely makes the display easier to read.
Elements that are not listed in the editor are displayed with the string they are recorded with at the Asterisk level.
IVR entries are also used to decorate IVR menus in IVR path traversal analysis. You simply add the name of the IVR menu and the
decoded value.
21.19. Configuring CBTs (Computer Based Training)
Users holding the key USR_CBTS can edit the list of known CBT URLs and names.
This list is used to populate the selection of available CBTs and to define the common URLs will be used in the task detail for each CBT
sent. The URL can be used to point to any kind of material, as appropriate (e.g. PDFs, videos, interactive courses…). The URL may include
a [U] token field that will be substituted with the login of the agent filling in the CBT, so that an external CBT system may keep track of why
is filling it in or personalize the courseware.
If you modify the URL of an existing CBT on the list, all CBT URLs matching the same URL on the tasks tables, for all tasks
not completed, are updated as well. This means that you can create a post-hoc descriptive CBTs out of URLs that are
already used on the system.
Each CBT includes a read-only field that tracks the number of times the CBT was sent; this value is reported in the CBTs list. CBTs can be
set active or not, so it’s possible to put CBTs off-line when they become obsolete.
21.20. Configuring paged call lists
It is possible to view details of calls (answered, unanswered) in a paginated order, rather than as a long list of data on a single page,
allowing better readability when running a large result set.
To set this up, from the Home page you select \93Edit Reports\94 which leads to the \93Configure QueueMetrics reports\94 page (Cfg
Reports tab). Click on the \93All reports\94 link and you will be shown all current reports. At the bottom of the screen select \93Create New
\94.
Enter a Short Name such as \93New\94 and a Title such as \93New Blocks\94 - you can choose different Name/Title if necessary. Also, the
Visible in All Reports field should be set to \93Yes\94. Now Save it.
Go back and select \93New Blocks\94 which leads to the \93Report: All Reports >> New Blocks >> Items\94 screen. Select \93Create New
\94.
210
Editing QueueMetrics settings
Save it and select \93Back\94 - you will now see the newly-created item.
If we run a Report we will see a new tab called \93New\94, as shown below, where the calls are showing in pages, rather than as a listing
(note the buttons to go forward/back and that the page is 1 of 2 pages)
In the image above, on the bottom right of the paginated list we can see a small icon just before the "next page" buttons. this icon allows us
to add or remove columns within the displayed paginated listing. It is now possible to add the Music on Hold (MOH) columns "MOH events"
and "MOH duration" which display the number of events where a caller was put on Hold with music and the total duration of such events.
You can also add the columns "IVR duration/IVR path" which displays the time the caller spent within the IVR selections and the choices
the caller made while going through the process. Adding the "DNIS" column allows to display the number dialled to reach the queue.
211
Editing QueueMetrics settings
21.21. Configuring the new Real-time Agents Page
Configuring the new realtime page involves to set some configuration keys that are inherited from the old agent realtime page and a new
set of keys specifically designed to operate with the new realtime page. This chapter summarize the most relevant keys needed to properly
configure the new realtime page and the integrated softphone. For more details on each key, please refer to the Appendix D, System
preferences
Enable/Disable the hotdesking:
default.hotdesking=86400
A value different than zero enables the hotdesking.
Defines a custom CRM page that will be open on each new taken call:
# Asterisk Unique ID visibility and related callback URL associated to the icon
default.crmapp=http://server/app?agent=[A]&unique=[U]&server=[S]&queue=[Q]&tst=[T]&cid=[C
default.crmlabel=CRM Page
default.showAstClid=true
realtime.agent_autoopenurl=true
Defines two other optional custom backgrounds:
# Custom web pages for the realtime agent page
realtime.agent_web1_url=http://www.queuemetrics.com/?agent=[A]
realtime.agent_web1_label=QueueMetrics
realtime.agent_web2_url=http://www.loway.ch/?agent=[a]
realtime.agent_web2_label=Loway
If CRM and/or custom backgrounds are not needed, it’s possible to override the default background changing the key:
realtime.agent_background_url=http://serverurl/backgroundpage.htm
In order to use the integrated softphone, the steps required are: 1. Configure the SIP server and the WebRTC URL 2. Add, for each agent,
a SIP username, password and SIP Realm authentication.
Depending on our setup (normal or clustered mode), the SIP server and the WebRTC urls are set by changing the below configuration
keys. For a not clustered QueueMetrics install:
# Default keys for the sofphone definition
default.sipaddress=10.10.5.49
default.websocketurl=ws://10.10.5.49:8088/ws
default.rtcWebBreaker=true
For a clustered QueueMetrics install, be sure you’re setting the following keys for each server in your setup:
cluster.serverX.sipaddress=10.10.5.49
cluster.serverX.websocketurl=ws://10.10.5.49:8088/ws
cluster.serverX.rtcWebBreaker=true
where serverX is the name of each server defined in the cluster configuration key.
Then, for each agent, set the SIP username, password and SIP Realm authentication through the Agent Configuration Pages, as explained
in Section 21.4, “Configuring agents”
212
Editing QueueMetrics settings
The Logon Panel allows to pre-validate the agent code and the agent extension needed by the login/logout process. In order to validate
these codes, a two set of keys have to be set:
# The regexp to validate agent codes
realtime.agentRegexp=1\\d\\d
#A regexp to validate extension codes
realtime.extensionRegexp=\\d\\d\\d
The Logon Panel allows to mark as read only the agent code field. This could be accomplished by setting the following key:
default.lockedAgentPopupCode=true
The list of available queues for each agent is defined by the following key:
realtime.dynamicLoginQueues=all
Relevant values for this key are:
• assigned or registered: the list of available queues shows only the queues where the agent plays a defined role (i.e. is a main/spill/wrap
for these queues)
• all: the list of availabel queues shows all the defined queues, without taking care of the agent role (but filtered by visibility key)
Agents can insert pauses through the Pauses panel. Pauses without a specified pause codes can be rejected by setting the following key:
default.pausecoderequired=true
Agents can grade taken calls only if they hold the QA_TRACK key.
21.22. QueueMetrics configuration wizard
In order to save time and make sure that QM is always up-to-date with the underlying Asterisk configuration, it is possible to run a wizard
that will load the following data straight from Asterisk configuration files:
• Which queues are in use, and their configuration
• Which agents are being referenced, their name and how they belong to the various queues
It is also possible to automatically create users out of the defined agents, so that they can log-on to QueueMetrics with the very same
password they use to log-on to Asterisk.
In order for the wizard to be run, the user must hold the grants to administer users, edit queues, edit agents, and must hold the CONFIG
key too.
If the user holds the required keys, the label "Setup wizard" will be shown on the front page:
213
Editing QueueMetrics settings
By clicking on it, the administrator will be lead to the first step of the wizard.
At the top of this page is a dropdown menu that defines where asterisk configuration could be found. Actually the wizard is able to read
information from:
• File
• Single machine Asterisk Manager Interface
• Clustered machines through Asterisk Manager Interface
• Asterisk realtime database
• Asterisk queue log file
By selecting the "File" source, the three edit boxes will let the administrator able to specify the local paths for the agents.conf, queues.conf
and the users.conf file.
By selecting "Queue Log File" as source, the associated edit box will let the administrator able to specify the local path for the queue_log
file.
The users.conf file is optional and could integrate the information stored in the agents.conf file. The agents.conf file, instead,
is not required only if the users.conf is present.
If you don’t have the users.conf or the agents.conf file, you can leave in the edit boxes their default values and the system
will be able to skip it if not found.
For sources different than "File", or "Queue Log File", the wizard will use some configuration options to know how to reach the required
information. More details can be found in Section 21.24, “Configuring system preferences” and in Appendix D, System preferences.
When you have selected the source you want to be read, click on Next button. You will be redirected on the validation page. This page will
inform you if the provided sources were succesfully read or, in the worst case, it will show you a message reporting an explanation of the
error found.
214
Editing QueueMetrics settings
If the validation fails, clicking on Next button you’ll be forwarded back to the first step, otherwise, you’ll be redirected to the next step.
The wizard will scan the available agents and presents you a list of agents to be created or updated. By default, this wizard will try not
to modify an agent or a queue that is already present in QM, that is the found data will be shown but unchecked. Check on the items to
include/exclude them as needed.
If no agents will be selected, by clicking on Next button the wizard will skip the next step and will forward you directly to the queue selection
step. If at least one agent was selected, instead, when you click on Next button you’ll be redirected to the window shown below.
If the corresponding QM users, for selected agents only, are not present, they are created automatically by this mask.
Please note that if the wizard is not able to read the password associated to a specific user (because the password is not specified in the
configuration files or because the wizard is reading information from AMI or realtime, or the queue log file, where password for agents are
not shown) it will use the following rules:
• For each new user added, a default password will be forced to be equal to their agent code
• For each user to be updated (i.e. already present in the QueueMetrics database) a default password will be shown in the mask but it will
never used to overwrite the already present one.
215
Editing QueueMetrics settings
The queues will be created or updated as needed; existing queues will not usually be overwritten without explicit user permission.
A queue will be automatically checked to be updated if at least one of its agent member was selected to be updated and/or
added.
When updating a queue, the spilloff and queue members lists will be generated looking at the penalties associated to
the agents read from the sources. If an agent is already present in a member or spilloff list, but it was not selected to be
updated, he will not removed and/or moved from any list.
If you click to the Next button you’ll be redirected to the page above reported. This page will display a summary of the QueueMetrics
database updates that have been scheduled to be performed. Clicking on the Yes button, the scheduled actions will be run and you will
be redirected to the last page where a table listing the related operations results will be presented. Clicking on No button, instead, you’ll be
forwarded back to the first wizard step.
216
Editing QueueMetrics settings
The QueueMetrics database is now updated with the information found in the selected sources. You can go back to the home page clicking
on Next button.
21.23. Unattended QueueMetrics configuration and update
QueueMetrics could be updated and configured by means of external http queries made in a known format. This is really interesting for
setting up a cron job to be completed sometimes during the day. When QueueMetrics receives external http queries, it will perform all the
configuration wizard steps together (see Section 21.22, “QueueMetrics configuration wizard”) assuming default answers. This will result
in a background synchronization between your asterisk boxes and the QueueMetrics database. To be able to run periodic QueueMetrics
update, you need:
• A QueueMetrics user holding the CONFIG key
• A command line script able to perform http queries
The URL to be used to start the unattended configuration system has to be formatted as follow:
http://qmaddress/queuemetrics/autoconf_Robot.do?user=demoadmin&pass=demo \
&stype=0&agents=/etc/agenti.conf&queues=/etc/code.conf&users=/etc/users.conf
The meaning of specified parameters is below reported:
• user: the username to be responsible for the update process
• pass: the password associated to specified username
• stype: defines what type of source you want to use and it could assume the following values:
• 0: File. If no other parameters were specified, the wizard will read the files defined in the default configuration.
• 1: Single Machine Asterisk Manager Interface. The wizard will read information from the machine specified in callfile.dir key.
• 2: Clustered Machines Asterisk Manager Interface. The wizard will read information from the machines specified in the standard cluster
definition.
• 3: Asterisk realtime. The wizard will read information from the database specified in the configuration.
• 4: Asterisk queue log file. The wizard will read information from the provided queue log file.
The user, pass and stype are mandatory; the other parameters are optional and have no meaning when the requested source is different
from "file".
The other parameters are:
• agents: specifies the asterisk agents configuration file (and it’s read only when the "File" source is specified)
• queues: specifies the asterisk queues configuration file (and it’s read only when the "File" source is specified)
• users: specifies the asterisk users configuration file (and it’s read only when the "File" source is specified)
• qlog: specifies the asterisk queue log file (and it’s read only when the "Asterisk Queue Log" source is specified)
217
Editing QueueMetrics settings
When QueueMetrics terminates the procedure, it will answer with a result page where the term "SUCCESS", or "FAIL", will be present
reflecting the operation success status. In this page will be also present a list of the performed operation (and their result status). An
example page is reported below:
21.24. Configuring system preferences
System preferences can be edited by editing a text file called configuration.properties located in the WEB-INF directory of the QM webapp.
The absolute path on your system can be found by looking at the System path property on the Licence page.
Since QueueMetrics 15.10 system preferences can be edited through the "Explore system parameters" page under the Administrative tools
by users holding the EDIT_CFG security key.
This page lists the most usefull configuration options and allows an administrator to change their values through a set of gui elements.
Allowed values are already listed and default values are marked with an asterisk. Through the search box located on the top left side is
possible to limit the number of shown options to easily focus on the wanted options.
A complete list of preferences can be found in the chapter Appendix D, System preferences. Once a preferences value is changed, it is
enough for the user to log off and log on again; restarting the servlet container is not needed.
You can check the current set of system preferences from the Section 21.26, “Using the DbTest Diagnostic Tools” page.
21.25. Installing the AGAW runner
Once your copy of QueueMetrics is correctly installed, the Queue Runner can be run using a script that is available as WEB-INF/mysqlutils/agaw-runner/agaw-runner.sh under the QM directory.
218
Editing QueueMetrics settings
This file must be edited to set its running parameters, that are:
JAVA=/usr/local/queuemetrics/java/bin/java
Path to the java virtual machine. Please point to a SUN JDK version 1.4 or newer. The default path points to the default JDK that comes
with the automatic QueueMetrics installation.
VMOPTS=-server -Xmx256M -Xms256M
The options for the Virtual Machine. Should be okay for most servers.
USER=demoadmin
PASS=demo
The username and password of a user the transactions will be run under. This should be a regular user or an administrator with visibility to
all queues to be selected.
JDBC="jdbc:mysql://10.10.3.5/qmueuemetrics?zeroDateTimeBehavior=convertToNull&\
jdbcCompliantTruncation=false&user=queuemetrics&password=javadude"
The JDBC URL to connect to the same database as the main QueueMetrics instance (see your web.xml file).
QMPATH= /usr/local/queuemetrics/webapps/queuemetrics-1.5.0
The system path to the local QueueMetrics installation. You can find it on the local Licence page.
ITER=3
The number of iterations that will be run by the Java process before terminating and spawning a new Java process. This is done so that
there is no problem with potential memory leaks, as the JVM is periodically rebuilt. A higher ITER count means more iterations using the
same JVM and avoids the burden of reloading classes and libraries.
IDLE=2000
The idle time in milliseconds between one interaction and the other.
RUNLOG=false
RUNLOGDIR=/root/runlog
If RUNLOG is set to TRUE, a detailed run log will be created under the RUNLOGDIR. This directory must be writeable by the Java process
and MUST be cleaned periodically - enabling this feature causes a lot of information to be written. See Section 21.25.4, “Debugging with
Runlogs”.
QMARCH=$JARLIB/loway-tpf-155p.jar
QMJAR=$JARLIB/QueueMetrics-1.5.0.jar
REDRPC=$JARLIB/redstone-xmlrpc-1.0.jar
MYSQLJAR=$JARLIB/mysql-connector-java-3.1.10-bin.jar
These are the names of the Java classes bundles that contain the local version of QM and of its TPF architecture. These must match the
ones under WEB-INF/lib or you will get "Class not found" errors on startup. In a standard QueueMetrics release, QMARCH and QMJAR
items are correctly set by the build system to match the current JARs.
SERVLET=/usr/local/queuemetrics/tomcat/common/lib/servlet-api.jar
This points to the servlet API used by your Tomcat installation. The default path is okay for a standard QM installation.
Once you set everything up, you can simply set the script executable and start it to see its output.
chmod a+x agaw-runner.sh
./agaw.runner.sh
Please note that the script will loop indefinitely, so it must be stopped through a kill -9 command.
21.25.1. Installing the database clean-up jobs
The AGAW subsystem produces a great number of old / obsolete / informative log data that is meant to help diagnosing problems, but that
can end up filling your disks pointlessly.
There are currently two ways to run database purging jobs:
219
Editing QueueMetrics settings
• There is a button from the main AGAW screen, and
• Through a modular HTTP call, meant to be run through scheduled cron jobs
In order to specify parameters for this activity, you should add the following lines to your configuration.properties file:
# Oldest obsolete run to keep when running an optimization, in minutes
dbmaint.agaw_oldestRun=30
# Oldest obsolete log to keep when running an optimization, in minutes
dbmaint.agaw_oldestLog=30
# Oldest obsolete broadcast entries to keep when running an optimization, in minutes
dbmaint.agaw_oldestBroadcast=180
Once you set up the parameters above as preferred ( maybe starting with a couple of hours and then see if it is too much / too few) you add
the following call to an hourly cron job:
wget http://server/qm/qm_sys_optimize.do?O_L=user&O_P=pass&O_C=AGC
Where user and pass belong to one administrative user.
The O_C parameters takes one or more of the following parameters:
Parameter
Meaning
Warnings
AGC
Purge AWAG tables
Might block for a few seconds
AQL
Optimize queue_log table by
reordering data
Will block; run daily or weekly when
system not in use
OQL
Optimize queue_log table
Might block for a few seconds
OAG
Optimize AGAW tables
Might block for a few seconds
OTB
Optimize other QM tables
The calls to the qm_sys_optimize transaction are made to be human- and machine-readable, so you might want to run the first time in a
browser.
You might want to run an hourly cleanup job plus a nightly/weekly general cleanup and optimization job. They all will likely block the tables
they are optimizing for a perceivable time, so do not run them at peak time when users are actually running QM.
21.25.2. Installing the AGAW client facades
The client facades are installed with the main QueueMetrics app, so they will work if the main QM app is working. The only customization
must be made in a file named agaw.properties that resides under WEB-INF/
client.refresh=7000
The timeout (in milliseconds) that will lead the client to refresh information on the page. 0 means no refreshing, or user-driven refreshes.
The lower this value, the higher the load will be on the AGAW fa\E7ade server.
client.sparkurl=http://chat.myserver:9090/webchat/jivelive.jsp
This is an absolute link to the jivelive.jsp page (a part of Spark Fatspath) that should live on the same server for security reasons. If no URL
is passed, there is no "Chat now" section in the clients. To avoid cross-site scripting problems, this works best when both QM and FastPath
are installed on the same server.
[email protected]
The virtual user that will be used for Spark Fastpath "Chat Now" button.
As of version 1.5, there is only one available fa\E7ade that "mimics" the behavior of the XUL fa\E7ade and it is called Plain HTML. You can
access it at the address http://server:8080/queuemetrics/agaw/facades/plain_frame.jsp
Please note that accessing the fa\E7ade when logged in QueueMetrics is likely to cause unexpected session termination of the QM session
- if you must access it with QM open, use a separate browser.
21.25.3. Setting up the AGAW activation key
The default version of the AGAW system comes with a default activation key that will let you test the system with two agents only. You can
ask Loway for a time-limited, unlimited-agents demo activation key for the whole AGAW subsystem.
If you try to run the AGAW loader for more agents than the licensed ones, you get an error message on the system log.
220
Editing QueueMetrics settings
The AGAW activation key can be installed in the agaw.properties file.
# License key for the Agaw Runner
runner.activation=............................
The AGAW activation key will be picked up immediately when the Runner restarts, and licensing information will be printed on the standard
output.
21.25.4. Debugging with Runlogs
Runlogs are text files that contain the very details calculations for each run are based upon, so they make it possible to spot from where the
figures displayed in the AGAW browser come from.
In order to run this, it is necessary to:
• Enable this feature in the agaw-runner.sh script
• Create a cron job to delete the generated files, e.g. nightly or weekly, as the result is extremely verbose
• Make it possible for the administrative users to fetch the files remotely, e.g via a WinSCP client
When this feature is turned on, when administrative uses happen to find some incorrect data, they should:
• Take a screenshot of the incorrect data
• Write down the run-id
• Fetch the text file called agawrun_XXXXX.txt that is under the RUNLOGDIR directory, where XXXXX is the run-id
The run-id can be found as shown here:
21.26. Using the DbTest Diagnostic Tools
The DbTest page, available at the address http://127.0.0.1:8080/queuemetrics/dbtest , will not only let you update the database, but also
check a number of QueueMetrics subsystems. It is invaluable for debugging QueueMetrics installations where you suspect some problem
may be.
221
Editing QueueMetrics settings
It is possible to completely turn off the DbTester page when not needed by toggling the default.viewTechInfo system property.
As of QM release 12.10 it is possible to access this page directly from the QueueMetrics Home page by selecting the System diagnostic
tools link, which can be found within the available Administrative tools.
21.26.1. Checking the current system configuration
From this page, you can see:
• The current settings for all system configuration properties, as written in the configuration.properties file
• The current Java environment variables, usually defined t at the JVM level
• The current memory and CPU settings for QueueMetrics, and the current memory usage. Note that Java will usually try to use all
memory availble before doing a cleanup, so seeing most memory in use does not necessarily mean that QM needs more.
21.26.2. Checking an Asterisk Manager connection
It is possible to check an AMI connection to an Asterisk server.
As you can see, the AMI connections in your configuration.properties file are automatically read and can be configured at the touch of a
button. As an alternative, you can manually enter the configuration parameters and see what happens.
In case the connection (like in the example above) displays an error, the complete stack trace is easily available for inspection. In case
everything goes OK, QM will try to originate a call in order to check that the privileges are correct.
222
Editing QueueMetrics settings
If the connection is possible, QueueMetrics will try to:
• Download and display the queuemetrics diaplan, as displayed under "Configured Dialplan"
• Download and display the current queue configuration, as displayed under "Configured Queues". This shows the configuration as defined
in queues. conf plus the current agent membership (static and dynamic).
• Download and display the current agent configuration (this only applis to agents as defined in agents.conf)
For further information on the AMI connection, see Configuring the AMI connection Section 24.23, “Configuring the AMI connection” .
21.26.3. Live inspector of the QueueMetrics database
It is possible to display the live status of the queue_log table, to make it easy to see data as it is appended by Asterisk.
If you see "Partition null" in the graph, this means the queue_log table is empty.
The last 20 lines of the queue_log table for the given partition are displayed. In "Split mode" the last 10 lines of the queue_log table about
calls and the last 10 lines about agent status are displayed separately.
The display will reload automatically every 10 seconds.
It is possible also to search for a substring within a given partition, e.g. a uniqueid code, this may be very slow, and it usually requires a
complete table scan. Do not do this repeatedly on a busy production box!
The Partition graph displays the number of events per minute in the last hour or so.
21.26.4. RAM cache inspector
This page displays the current status of the different caching layers used within QueueMetrics.
223
Editing QueueMetrics settings
The log cache is an object cache that stores, for each partition, event objects already processsed. It must be turned on by setting
realtime.useRowCache=true. For each partition the number of cached objects it is displayed as "Rows". If you use hotdesking you should
see a number of objects in the "Hotd" section as well. All of your partitions should appear here.
the log cache will be used only if the storage type is SQL-based.
The SQL cache caches SQL results to some common queries. Yo can see the current cache size (it is usually quite small), the total
number of requests, how many of them were answered ("Cached fresh"), how many of them had the query repeated ("Cached stale") and
the overall cache efficiency. In a busy call center this should be around 70-90%.
The String cache counts the number of string instances that are currently cached. Values in the 100,000 - 1 million element range are not
uncommon.
All caches are designed to be emptied when working in order to reclaim memory, so you can safely click on "Clear caches" even while QM
is running.
21.27. System audit log inspector
QueueMetrics keeps track of a number of activities that happen on the system; for example, every time a user logs on or off, this fact and
the related IP address is added to the audit log.
Administrators who hold the key USR_SYSLOG can access the audit log from Home Page → View Audit Log.
The page displayed is very simple and only allows searching for a given time interval.
A number of different records are tracked throughout the system - see the Appendix Appendix F, Audit log records for complete details.
On a busy system with 50+ agents, this log may get large fast; as it does not get deleted automatically, you should keep
track of the arch_syslog table size and delete it when it is too large.
224
Chapter 22. Listening to calls using
Pluggable Modules (PM)
Since QueueMetrics 1.4.7, the retrieval of audio recordings uses a different paradigm called Pluggable Modules. This makes it feasible to
set up different modules to match the configuration of the existing system and to use them natively.
Pluggable modules are used in two areas:
• Listening to recorded (closed) calls, i.e retrieving recordings
• Listening to live calls, i.e.setting up a channel "spy" feature.
In order to control which module is called, two configuration properties are set:
• audio.server controls the module to do find recorded calls
• audio.liveserver controls the module to set up live call listening
Each configuration property is set to the complete name of a Java class that implements the required server. Such names must be
set exactly as described, or an exception will be raised. Each module can then have its own configuration properties to control its own
behaviour.
22.1. PMs to match Recorded Calls
These PMs are used to find audio recordings.
22.1.1. Plain old recordings: LocalFiles
Module name:
LocalFiles
Full Java Path:
it.loway.app.queuemetrics.callListen.listeners.LocalFiles
Properties used:
default.monitored_calls in a single-server
environment, or cluster.SERVER.monitored_calls in a
cluster
Available since:
1.4.7
This is the standard search method that comes with QueueMetrics. Basically, all directories under default.monitored_calls are explored
recursively, and all audio files matching the Asterisk ID of the main call that was queued are retrieved. Therefore the call files found can be
zero or more.
This PM is sub-optimal for very large call centres, where the cost of scanning through all recordings (maybe on remotely mounted disks)
could take a significant time. If you are in such an environment, see the LocalFilesByDay entry.
This PM is used by default if no other server is specified in the configuration.properties file.
22.1.2. Large storage with recordings: LocalFilesByDay
Module name:
LocalFilesByDay
Full Java Path:
it.loway.app.queuemetrics.callListen.listeners.LocalFilesByDay
Properties used:
default.monitored_calls in a single-server
environment, or cluster.SERVER.monitored_calls in a
cluster
audio.lookBack for how many hours before or after
midnight is a call considered a #borderline# case
(default 4).
Available since:
1.4.7
This PM works exactly like the LocalFiles one, but allows using placeholders in the file path; this way, you can set the default recordings
directory to handle only a subset of all recordings.
For example, if you set default.monitored_calls to /var/myrecordings/%YY-%MM/ when trying to listen to a call that was made on Jan 9,
2007 will expand to /var/myrecordings/2007-01/ therefore making the directory scanning much more manageable.
Valid placeholders include:
• %YY → the 4-digit year when the call was made
225
Listening to calls using
Pluggable Modules (PM)
• %MM → the 2-digit month when the call was made
• %DD → the 2-digit day of month when the call was made
• %SE → in a clustered environment, the server name (all lower case)
• %QU → the queue name (all lower case)
Though this is unlikely, it is possible that a call gets recorded on a given day and then gets queued on a different day, e.g. for calls that
happen around midnight. QM handles this case by double-checking all calls within a boundary of n hours from the midnight in both the days
that are divided by that midnight. This behaviour can be set using the audio.lookBack property.
Asterisk can easily adapt to recording files in a way that is compatible with this storage model, like e.g.:
. . .
exten
exten
. . .
.
=> 999,n,Set(MONITOR_FILENAME=/audio-nas/${STRFTIME(${EPOCH},,%Y-%m/%d)}/call-${UNI
=> 999,n,Queue(778,t,,)
.
Will store audio files as:
/audio-nas/2011-03/10/call-123456.7890.wav
The nice part is that Asterisk will automatically create missing directories, as needed.
22.1.3. Using an external server: ClassicXmlRpcRecordings
Module name:
ClassicXmlRpcRecordings
Full Java Path:
it.loway.app.queuemetrics.callListen.listeners.ClassicXmlRpcRecordings
Properties used:
default.audioRpcServer (non-clustered) or
cluster.SERVER.audioRpcServer: The address
of the XML-RPC server implementing the
QMAudio.findStoredFile interface.
Available since:
1.4.7
This is the standard XML-RPC implementation and makes it easy to create a completely custom scheme to handle recordings. The output
of this function must be a single URL that can either stream the audio file or launch a player to stream that call. This is completely userconfigurable.
The details of how to write an XML-RPC server for the QMAudio.findStoredFile interface can be found on the XML-RPC guide for
QueueMetrics. We ship a sample implementation of such a server in the xmlrpc_audio_server.php server that comes with QueueMetrics.
See also section Section 24.11, “Enabling XML-RPC call listening and streaming”.
22.1.4. External audio recorder: OrekaWeb
Module name:
OrekaWeb
Full Java Path:
it.loway.app.queuemetrics.callListen.listeners.OrekaWeb
Properties used:
* oreka.jdbcUrl points to the server where the
OrekaWeb database is stored. Firewalls and MySQL
user setup must allow a JDBC connection coming
from the QueueMetrics server.
* oreka.sipHeader is the name of the tag to be tracked
in the Oreka system. If missing, it’s X-Unique-ID.
* oreka.web is the URL of an OrekaWeb application QM uses Oreka’s applets for video playback.
* oreka.playersize lets you set the size of the player,
e.g. "1024x780"
* oreka.mode: set to "1" if running Oreka up to minor
build number 2494, to "2" if newer.
Available since:
1.5.1
This PM lets you offline all the audio recording to an Oreka system - see http://oreka.sourceforge.net/
This PM lets you playback audio (and optionally video) of recorder calls stored in Oreka. In order to listen to live calls, it is possible tp use
either some Asterisk-based method, e.g. ClassicQMListenerRT below, or an Oreka-based methos like OrekaWebRT below.
226
Listening to calls using
Pluggable Modules (PM)
It needs the JDBC URI to point to the Oreka database; the database must contain the following tables: orktag, orksegment, orktape,
orkservice, orktagtype.
In order to have QueueMetrics associate the Asterisk call-ids correctly, you must configure Asterisk and Oreka to store the
call-id of the main leg of the call, the one upon which the Queue() command is called.
Propagating the SIP header
As Oreka is a passive recording solution based on SIP, and the call’s UniqueId is used to match a call in QueueMetrics, it is necessary for
you to add the UniqueId information to the SIP headers.
If/how this can be done depends on the kind of channels you have as members of the queue.
If you have static or dynamic SIP phones as members of the queue, e.g.
[myQueue]
....
member => SIP/1234
member => SIP/1235
you can simply use the following piece of dialplan:
....
exten => s,n,SIPAddHeader(X-Unique-ID: ${UNIQUEID})
exten => s,n,Queue(myQueue|t|30)
....
If instead you have other types of channels as members of the queue, e.g.
[myQueue]
....
member => Agent/101
member => Local/102@agents
then you need to store the UniqueID in an inherited variable, e.g.
...
exten => 411,2,Set(__MASTERID=${UNIQUEID})
exten => 411,3,Queue(myQueue|t|30)
[agents]
exten => _XXX,1,SipAddHeader(X-Unique-ID: ${MASTERID})
exten => _XXX,2,Dial(SIP/${EXTEN}|300)
This makes it possible to use Oreka in all common usage scenarios.
Configuring event capture in Oreka
You need to modify OrkAudio’s config.xml, under the <VoIpPlugin> section:
<SipExtractFields>X-Unique-ID</SipExtractFields>
And restart OrkAudio.
Which version of Oreka do I need?
The minimal software you can use seems to be the commercial version (Orecx TR). This includes G729 Codec and Live Monitoring.
Video playback
Orecx is able to capture and store along with the audio recording of the call a screen capture of the agent’s workstation while the call was
made. The importance of such a feature is obvious.
If a video recording is present for a given call, then the audio file will be followed by the string "[vid]" to show that it’s a joint audio and video
recording.
In order to play it back, QM will not stream it through a browser but will open up the VNC player that ships with OrkWeb; therefore you must
configure the oreka.web property. The applet is not used in case of audio-only recordings.
227
Listening to calls using
Pluggable Modules (PM)
22.1.5. Advanced Oreka support: OrekaEncrypted
Module name:
OrekaEncrypted
Full Java Path:
it.loway.app.queuemetrics.callListen.listeners.OrekaEncrypted
Properties used:
* oreka.jdbcUrl points to the server where the
OrekaWeb database is stored. Firewalls and MySQL
user setup must allow a JDBC connection coming
from the QueueMetrics server.
* oreka.sipHeader is the name of the tag to be tracked
in the Oreka system. If missing, it’s X-Unique-ID.
* oreka.web is the URL of an OrekaWeb application QM uses Oreka’s applets for video playback.
* oreka.playersize lets you set the size of the player,
e.g. "1024x780"
* oreka.username and oreka.password: the account
used to access OrekaWeb
* oreka.mode: set to "1" if running Oreka up to minor
build number 2494, to "2" if newer.
Available since:
12.04
Requires:
OrkWeb 1.4-2178 or newer
This PM is an advanced version of the OrekaWeb module, and it offers the same functionalities plus a few additional ones:
• Support for encrypted Oreka calls: calls can be stored in an encrypted format and will be decrypyed dinamically by Oreka. The PM may
handle encrypted and unencrypted contents at the same time.
• Support for audio-only playback through the Oreka player (a new link will let you open the player as well as download the file as was
possible in earlier versions)
• Support for tags: call tags are passed to the Oreka player, and you can use the player to move back and forth between them
• QM acts as a proxy for all OrekaWeb contents
The same set-up instruction apply as per the OrekaWeb PM.
Secure access
The OrekaEncrypted PM has QM act as a secure proxy for all Oreka contents:
• The OrekaWeb server can be invisible to the user (e.g on a private network);
• There are no more limitation for cross-domain downloading
• There is a double security check; first, when a file is requested, the proxy checks that this file belongs to the list of audio files that the
current user just searched; then, QM will authenticate to OrkWeb and, if successful, will try and stream the file back to the client.
• For additional security, any audio/video file is streamed through a small content buffer that is constantly overwritten and that is
immediately cleaned after usage; it is never written to disk on the QM server.
If you turn on encryption and authenticated downloads on the Oreka system, and use HTTPS to connect to QM, the result is a very secure
audio server for your Asterisk system.
22.1.6. Using multiple PMs at once: MultiListener
Module name:
MultiListener
Full Java Path:
it.loway.app.queuemetrics.callListen.listeners.MultiListener
Properties used:
audio.multi lets you define a set of PMs to be queried
for files (enter their names, separated by pipe)
audio.multi.* specifies the properties of each listener.
Available since:
1.7.0
This PM lets you query multiple PMs in the order you specify to look for the call you are looking for. A common scenario may be the
following one:
• All calls are recorded to a local volume, e.g. /queues/audio. This is where files just recorded are held.
228
Listening to calls using
Pluggable Modules (PM)
• A nightly process compresses the files to MP3 and moves them to a large NAS device mounted under /mnt/nas, where they are stored
separated by day.
In order to retrieve calls, we want QM to first check in /queues/audio; if nothing is found, then we will look under /mnt/nas/2010-11-23. This
can be implemented with the following configuration:
# define the PM and the search order
audio.server=it.loway.app.queuemetrics.callListen.listeners.MultiListener
audio.multi=loc|nas
# first PM: local calls
audio.multi.loc=it.loway.app.queuemetrics.callListen.listeners.LocalFiles
audio.multi.loc.default.monitored_calls=/queues/audio
# second PM: NAS storage
audio.multi.nas=it.loway.app.queuemetrics.callListen.listeners.LocalFilesByDay
audio.multi.nas.default.monitored_calls=/mnt/nas/%YY-%MM-%DD
What we do here is the following:
• We first define a MultiListener and tell it via the audio.multi property to actually query a PM called "loc" first and one called "nas" if
nothing is found. You can have as many PMs as you need and you canset their names as you best see fit.
• We specify the PM to be used for "loc" in the audio.multi.loc property. Properties to be set for it are appended to the
audio.multi.PMNAME. hierarchy, as we do in this example to set the default.monitored_calls property.
• As you can see, you can have multiple PMs of the same type as well as different, and ecah can have their own configuration properties.
22.1.7. Pluggable Listener for Enswitch Platform Integration
Module name:
Enswitch
Full Java Path:
it.loway.app.queuemetrics.callListen.listeners.thirdparty.Enswitch
Properties used:
enswitch.serverclass is the full qualified name of
an external class code implementing the interface
specified on next paragraph. We expect to have
an external implementation resulting in a .class
files (IntegrationExample.java in this example)
stored in a suitable jar and/or classpath available
to QueueMetrics. enswitch.server used to provide
authentication on the remote server. enswitch.user
used to provide authentication on the remote server.
enswitch.password used to provide authentication on
the remote server.
Available since:
12.5.4-418
Exposed Interface
QueueMetrics expects to have in his classpath an implementation of the following interface:
public interface EnswitchRecording {
public String[][] getUrls(String host, String username, String password, String c
}
The getUrls should return a matrix containing the list of URLs associated to the specified callID. Each row in the matrix specifies:
• The URL at column 0
• The name (usually shown as clickable link by QueueMetrics) at column 1
22.2. PMs to match Live Calls
These PMs are used to listen to live calls.
22.2.1. Live calls through QueueMetrics: ClassicQMListenerRT
Module name:
ClassicQMListenerRT
Full Java Path:
it.loway.app.queuemetrics.callListen.RTlisteners.ClassicQMListenerRT
229
Listening to calls using
Pluggable Modules (PM)
Module name:
ClassicQMListenerRT
Properties used:
For listening to inbound calls:
callfile.monitoring.channel,
callfile.monitoring.extension,
callfile.monitoring.context;
For listening to outbound calls:
callfile.outmonitoring.channel,
callfile.outmonitoring.extension,
callfile.outmonitoring.context;
In a single-server environment: callfile.dir (points to
a local call-file directory or a manager interface port);
In a clustered environment:
cluster.SERVER.manager (points to each Asterisk
server#s manager interface port)
Available since:
1.4.7
This is the standard QM behaviour: when listening to inbound or outbound calls, a popup appears and asks for a local extension. That local
extension is connected to the live channel so that the local user can listen to the ongoing call.
In order for this to work, the dial-plan on each Asterisk server must implement the correct logic - an example is given in the [queuemetrics]
context that comes with QueueMetrics.
This PM is used by default if no other server is specified in the configuration.properties file.
22.2.2. Live calls through an external module: ClassicXmlRpcListenerRT
Module name:
ClassicXmlRpcListenerRT
Full Java Path:
it.loway.app.queuemetrics.callListen.RTlisteners.ClassicXmlRpcListenerRT
Properties used:
default.audioRpcServer (non-clustered) or
cluster.SERVER.audioRpcServer: The address
of the XML-RPC server implementing the
QMAudio.listenOngoingCalls interface.
Available since:
1.4.7
This is the standard XML-RPC implementation and makes it easy to create a completely custom scheme to handle live monitoring. The
output of this function must be a single URL that will launch a player to stream that call. This is completely user-configurable.
The details of how to write an XML-RPC server for the QMAudio. listenOngoingCalls interface can be found on the XML-RPC guide for
QueueMetrics. We ship a sample implementation of such a server in the xmlrpc_audio_server.php server that comes with QueueMetrics.
See also section Section 24.11, “Enabling XML-RPC call listening and streaming”
22.2.3. Live calls through Oreka: OrekaWebRT
Module name:
OrekaWebRT
Full Java Path:
it.loway.app.queuemetrics.callListen.RTlisteners.OrekaWebRT
Properties used:
oreka.rtserver is the master property that tells QM if
Oreka is clustered or not
oreka.web is the URL of an OrekaWeb application QM uses Oreka’s applets for playback.
oreka.rtserver.xxx is used for clustered configurations.
Available since:
1.5.2
This PM lets your supervisors monitor agents using a web-based interface provided by Oreka. The supervisors will simply click on a live
call and it will be streamed to them through their browser (note: a window will open and will close immediately before the popup opens. This
is expected behaviour).
In order for this PM to work, your system configuration must matche these criteria:
• You should be using Callback agents, where the agent extension is correctly filled in at logon time
• Pop-up windows should be openable by QM - this feature is disabled by default in most modern browsers.
• You should also select a way for this PM to choose on which Oreka server the call must be listened on.
Do not forget to set the oreka.web property in any case in order to download the playback applet.
230
Listening to calls using
Pluggable Modules (PM)
Using only one Oreka server
If you are deploying only one Oreka server, you should set the address of the live listening port by setting oreka.rtserver to fixed and then
entering the live streaming port as follows:
oreka.rtserver=fixed
oreka.rtserver.address=http://hostname:59120/?type=stream&localparty=#AGENTEXT#
This will work even on a clustered system, as long as there is only one Oreka server. Note how the agent extension is expanded in the
string (see below for the full list of expansion tokens).
Using a cluster of Oreka servers
If you have a set of Oreka servers (likely because you have a cluster of Asterisk servers), you can associate a separate Oreka server to
each box in the cluster. You do so by setting oreka.rtserver to cluster and then entering the live streaming port for each member of the
cluster, as follows:
oreka.rtserver=cluster
oreka.rtserver.aleph=http://ork_aleph:59120/?type=stream&localparty=#AGENTEXT#
oreka.rtserver.beth=http://ork_beth:59120/?type=stream&localparty=#AGENTEXT#
In this example, all calls processed on server "aleph" will be searched on server "ork_aleph", while all calls processed on server "beth" will
be processed on server "ork_beth".
Using multiple Oreka servers with UniqueID
If you have a set of Oreka servers that are not linked one-by-one to a set of Asterisk boxes, you can associate a separate Oreka server to
each call in the cluster, by prepending a digit to the call’s UniqueID that will be used to know on which server each call is being handled.
You do so by setting oreka.rtserver to chandigit and then entering the live streaming port for each member of the cluster, as follows:
oreka.rtserver=chandigit
oreka.rtserver.1=http://ork_aleph:59120/?type=stream&localparty=#AGENTEXT#
oreka.rtserver.2=http://ork_beth:59120/?type=stream&localparty=#AGENTEXT#
In this example, all calls which UniqueID starts wilth "1" will be handled by the "ork_aleph" server, and all calls which UniqueID start with "2"
will be queries on the "ork_beth" server.
Expanded properties
The following properties are expanded in the Oreka live listening URL:
• AGENTEXT is the numeric extension an agent is logged on from
• AGENTCODE is the code of the agent
231
Chapter 23. Exporting call sets from
QueueMetrics
There is a need to make it possible for external parties to review the call processing as done on QueueMetrics or do an external QA
monitoring on them; and similarly, there is an opportunity for a QueueMetrics to do the same thing for external third-parties.
In order to make this possible, we need to have a way for QueueMetrics to import/export both call records (with associated audio/video
recordings where present) and related QA data.
23.1. Exporting calls - an overview
The main problems that arise from exporting calls are:
• Selecting the set of calls that have to be exported, and
• Retrieving all audio calls for export
We need to be able to select freely a number of calls for export, given one or more export criteria; we want to be able to review the results
before they are final, and we want to exclude specific calls when reviewing.
The retrieval of audio causes a similar problem; first, audio retrieval was not really made for batch access, so seek times for individual files
may be in the order of one per seconds; secondarily, those files may well require a large disk space when preparing the batch.
The call export feature works in batches, that is, at any given time there are a set of batches that an administrator creates and that are to
be exported. Each of them has a name and a status.
This is the life-cycle of a batch:
• An administrator creates a batch for a given data export needed and gives it a meaningful name, e.g. "Client X week 02/10". The batch is
now in state Open.
• Users holding the correct key will be able to add calls to the batch, that is, when they run a report in QM, on the "Taken calls" page they
see a button that invites them to add the selected set of calls to the open batches. They can repeat this process as many times as it is
needed. If the same call is added multiple times to the batch, it only appears once.
• When the batch is ready, the administrator closes it. When the state is Closed, it is not possible anymore to add calls to that batch.
• When the batch is Open or Closed, it is possible for the administrators to see the list of calls in the batch and to listen to their audio/video
attachments. Individual calls may be flagged as "Do not send" - those calls will appear in the batch but will not be show in the outgoing
records.
• When the batch is finalized, the administrator will flag it as "Ready to send". Batches that are "Ready to send" are actually being built by
QM - it may take a while to create them and download the audio files required.
• When the batch is finished processing, it will appear as "Sent".
• A batch can be deleted at any time by the administrator, unless it is in status "Ready To Send".
The graph provides a visual representation of the whole process:
232
Exporting call sets from QueueMetrics
The process of building a batch may take a while - therefore there is a transaction that simply keeps displaying a page in a browser that
shows a progress bar while the project is being exported.
23.2. Exporting calls in practice
In order to export calls, an administrator must first create a batch. To do this, they go to the Home Page → Import/Export calls:
From here you select List Export Jobs.
You can then create a new job.
When configuring the job, you have to specify:
233
Exporting call sets from QueueMetrics
• A name for the job. This will be the name of the folder that will be created including the call details and the audio files.
• A security key so that only some agents can add calls to this job.
• An export folder - it can be the same for all jobs, and be on the server QM is on. It should be writable by the java process that runs QM,.
• An implementor, that is, a data format for Manifest file of the job. See below for more details.
• If the implementor requires them, you can specify a set of parameters.
These properties can be changed through the lifetime of the job.
From now on, users accessing the Detail of Taken Calls will see a gadget by the end of the page like the one shown here:
This basically lets you add all the calls above to the export job you select. If the export gadget should not be visible, you have to add it
manually to the current report (its code is OD02 - see Block OD02 Section 6.2.2, “OD02 - Add to export job” ).
After you add sone calls to a job, the import transaction will confirm the add through a popup screen that displays the number of calls
imported and the number of calls rejected (because they were already a member of this job). Only jobs in state Open will be availble for
adding calls.
You can now see a list of calls from the Export Jobs page:
You can search calls within the current job and toggle their inclusion in the exported list by clicking on the reload icon next to each call.
When the job is ready for shipment, the administrator first has to Close it and then to Export it. This will take a while. Audio files will be
retrieved through the curremtly configured Pluggable Module for audio records and will be saved in the job folder.
23.3. Output format
Thought the actual attributes used are based on the Implementor module used, the following are common attributes.
Batch attributes
• Name
• Disk path (must be accessible to Java)
• Created by, on date
• Closed by, on date
• Sent by, on date
234
Exporting call sets from QueueMetrics
• Video (yes/no)
• QA (yes/no)
Each call in the batch has the following attributes:
• Type: "T" taken "L" lost (initially we will only have Taken calls)
• Cluster-ID
• Server-ID
• Entered at
• Wait time
• Talk time
• Caller
• Agent
• Queue
• Call status
• Call status type (e.g Sale)
• N. of audio pieces
• Names of the audio pieces, comma-separated ( a single call may have multiple recordings)
Batch disk format
A call batch appears on disk as a folder under the system call batch folder. The folder is created if not present (it must be in a Java-writable
location). When the batch is in status "Ready to send", the audio files are copied to this folder; at the end of it all, a manifest file that
includes the details is written. Each downloaded audio file is renamed in order to be unique and coherent, typical file names may be:
0000123-1.wav
0000123-2.mov
Both files are about the 123rd call, the first one being an audio recording and the second one a video recording.
When the batch is in status "Sent" QM no longer cares about the disk representation - it can be moved, sent as FTP, compressed and
encrypted, whatever.
Manifest file format
The manifest file format should be chosen by the sysadmin - it is implemented as an abstract class for ease of change.
• It will be called Manifest.xml
• It will include a set of <call> entries including all data as per the previous section "Batch attributes"
23.4. Available implementors
HTTP file transfer
This is the basic implementor and produces an XML file.
HTTP MP3 file transfer
This implementor does two things:
• produces a basic manifest
• retrieves QA valuation data if present
• if audio files are in MP3, will insert or set ID3v2 tags so that the title of the MP3 contains information about the call.
The following ID3 tags are created:
• Call details
• caller id
• queue
235
Exporting call sets from QueueMetrics
• dnis
• call lenght
• start time
• lenght
• agent
• Call status
• Date of Grading
• Time of Grading
• Grader ID and/or Name
• Overall Grade
• Graders Comment
this implementor DOES NOT transcode files to MP3 - they must already be in MP3 format or you should provide an external
batch script to do the conversion. More details are provided in the following paragraph.
23.5. MP3 conversions on the fly
QueueMetrics lets you able to perform an external batch script call in order to convert call files to different format like, for example, wav files
in mp3s. This feature is applied only for export jobs implemented with the "HTTP MP3 File Transfer" object. No external calls will be made
for "HTTP File Transfer" enabled export jobs.
Assuming to have this type of export job parameters: Job name: MyJob Export folder (on server): /var/spool Implementor: HTTP MP3 File
Transfer
the work flow followed by QueueMetrics, for HTTP MP3 File Transfer enabled jobs, will be like depicted below.
For each call in the job and for each file associated to a specific call:
1. The file will be stored on server folder /var/spool/MyJob folder
2. A new temporary folder will be created on /var/spool/MyJob folder
3. An external bash script will be called. The script will receive, as parameters:
• The full file name of the file to be converted
• The full name of the temporary folder created
• The name of the job as defined in the job definition page
• The parameters string as defined in the job definition page
4. The script should convert the file in the preferred format and should place the result in the provided temporary folder. QueueMetrics will
wait for the conversion termination
5. QueueMetrics will move (not copy) the full conversion result it will find in the temporary folder to the original destination folder (in this
case /var/spool/MyJob). Please note that there should be more than one file resulting in the conversion (like, for example, a preview
quality and a hi-res quality .mp3 files) and QueueMetrics will copy all of that.
6. The temporary directory will be removed by QueueMetrics
7. QueueMetrics will publish in the manifest all the files found in the temporary folder. These files will be associated to the specific call and
the number of chunks published in the manifest will reflect this.
When all files in the job are properly downloaded and converted, QueueMetrics will add all relevant QA information only to files with name
ending with .mp3
Please note that:
1. The external script to be called by QueueMetrics should be specified in the configuration.properties files through the key
"export.conversionCommand". It should be executable by TomCat. If no key was defined, the HTTP MP3 File Transfer will skip all
actions specified in the 2, 3, 4, 5, 6 steps above described (i.e. it will simply download the files and apply QA informations to eventually
present .mp3 files)
2. If the external script is not present in the server and/or QueueMetrics is not able to run it, this will be signaled in the <errors> field
present in the manifest (one for each call). In this case QueueMetrics will publish in the manifest the original file name.
236
Exporting call sets from QueueMetrics
3. QueueMetrics will not delete the original file from the /var/spool/MyJob folder. If you need to have it deleted, your conversion script
should do it.
4. QueueMetrics will not publish the original file name in the manifest, unless if exceptions were raised in the conversion/move process. If
you need to have the original file published in the manifest, your script should move (not copy) it to the temporary folder.
5. If some exception is raised when moving files or calling the external bash script, QueueMetrics will publish the original file name in the
manifest.
6. If the conversion script generates a (set) of filename with name(s) already present in the /var/spool/MyJob folder, QueueMetrics will
rename it (them) prepending the name(s) with a random 5 digit number followed by an underscore sign. The new name(s) will be
published in the manifest
To summarize the overall process, a simple example of working environment is provided:
In the configuration.properties is the key:
export.conversionCommand=/usr/local/apache-tomcat-5.5.25/webapps/ROOT/testbatch
and in the /usr/local/apache-tomcat-5.5.25 is an executable testbatch script:
[root@qmmachine ROOT]# ls -la testbatch
-rwxr-xr-x 1 root root 87 Mar 10 05:17 testbatch
In this simple example, the batch script copies the original file in the temporary folder (with a not unique name in this example)
#!/bin/bash
# $1 is the
# $2 is the
# $3 is the
# $4 is the
source file
output directory
job name
parameter field defined in the job definition page
cp $1 $2/testresult
The resulting working folder will contain something like:
....
-rw-r--r--rw-r--r--rw-r--r--rw-r--r--rw-r--r-....
1
1
1
1
1
root
root
root
root
root
root
root
root
root
root
408516
50110
884372
4740
419784
Mar
Mar
Mar
Mar
Mar
10
10
10
10
10
05:18
05:18
05:18
05:19
05:19
And the manifest something like:
....
<call>
<files>testresult,2071_testresult</files>
<errors></errors>
<chunks>2</chunks>
<uniqueid>3033212900899824</uniqueid>
<videocall>true</videocall>
<callid>4006</callid>
....
237
17619_testresult
18542_testresult
18795_testresult
20110304_084640-99.wav
20110304_084640.wav-99-1.avi
Chapter 24. Configuring Asterisk for
QueueMetrics
QueueMetrics is designed to analyze queue_log data provided by any Asterisk installation; the following guidelines will help you to make
the most out of it.
24.1. Configuring queues to report exit status
In the following example:
• all calls are monitored, i.e. saved to disk;
• if after 60 seconds on the queue the call is unanswered, the call is routed to voicemail and this event is reported correctly by QM;
• there are two levels of agents: agents 302 and 303 will answer the queue (level 1); only if none of them is available the call is routed to
agent 301 (level 2). If nobody is available, the queue keeps trying until timeout is reached.
• Agents can transfer the call to other extensions by pressing the "#" key;
• Agents terminate the current call by pressing the "*" key.
Extensions.conf
[q-my-sample]
; ...queue description.....
exten => s,1,SetVar(MONITOR_FILENAME=/var/spool/asterisk/QSAMPLE-${UNIQUEID})
exten => s,2,Queue(q-sample|nt|||60)
exten => s,3,Playback(voicemail-invitation)
exten => s,4,VoiceMail,s2001
Queues.conf
[q-sample]
music = default
announce = q-sample-announce
strategy = roundrobin
timeout = 60
retry = 5
maxlen = 0
announce-frequency = 0
announce-holdtime = no
monitor-format = wav
monitor-join = yes
queue-youarenext = silence
queue-thankyou = q-sample-thankyou
member=>Agent/302,0
member=>Agent/303,0
member=>Agent/301,1
Make sure that you do not forget the explicit timeout when calling the Queue() command from extensions.conf, or queue timeouts
will not be logged by Asterisk and therefore not reported by QM. A patch that corrects this Asterisk behaviour can be found at http://
bugs.digium.com/view.php?id=5422 .
24.2. Configuring URLs to be launched by the agent real-time
page
The URL should be embedded in the Queue() command as prescribed by Asterisk:
exten => s,7, Queue(myqueue|nt|http://mysite/app?uid=${UNIQUEID}&clid=${CALLERID}||60)
This command launches the queue "myqueue" and launches the webapp located http://site/app passing the following parametrs:
1. uid is the Asterisk internal unique call id
238
Configuring Asterisk for QueueMetrics
2. clid is the Caller*ID for the current call
The URL will appear on a clickable link on the Agent’s page.
If you set the property realtime.agent_autoopenurl to true, whenever the Agent’s page is reloaded, the most recent unopened URL is
launched automatically.
24.3. Listening to recorded calls using QM
• Make sure it is legal
This is not strictly a QM issue, but before attempting to record all calls on a queue, you should consult a lawyer to make sure it is legal in
your country. It would be probably fair enough to tell your operators their calls are being recorded and to add a voice message telling the
customers their call will be recorded.
• Tell Asterisk to record all calls
To record all calls add something like this to extensions.conf:
exten => s,1,SetVar(MONITOR_FILENAME=/var/spool/asterisk
/q/QSAMPLE-${UNIQUEID})
exten => s,2,Queue(q-sample|nt|||60)
This way all sound files are stored under /var/spool/asterisk/q/ with the name of the queue (QSAMPLE) followed by the call id.
• Tell QueueMetrics where to look for the calls
You should set up the WEB-INF/configuration.property file in QM like this:
default.monitored_calls=/var/spool/asterisk/q/
When looking for the recording of a call, QM will explore all files contained in /var/spool/asterisk/q/ and any directories below for a file
name containing the right call ID. It might find more than one file name and will display all of them. It is possible that sometimes Asterisk
fails at mixing together the two files (Asterisk records separate files for the caller and the agent, and then tries to mix them together at the
end of the call) so you will find two files named -in and -out instead. The search behaviour can be customized -see Chapter 22, Listening
to calls using Pluggable Modules (PM).
• Tell QueueMetrics you have the right to listen to the calls
Any user willing to listen to calls must hold the key CALLMONITOR. This is to make sure that only authorized personnel can listen to
recorded calls. If you do not have this key, no sound files will be shown.
• Make sure QueueMetrics has the right to read saved calls
You should make sure that the process running QM (i.e. the servlet container, might be Tomcat, Jetty, or something else depending on
your setup) has the rights to access the files where recorded calls are stored.<br> If using a separate web server, it should not be able to
access those files directly, as QM will pipe out files only after enforcing security checks.
• Debug tip: see which files QM sees
There is a hidden transaction in QM made to debug call listening. To launch it, logon as an administrator and type the transaction
"qm_show_files.do" in the URL bar instead of the page name. You will be lead to a page showing the filenames QM can read from the
hard disk, whether the current user has the CALLMONITOR key and the search path as defined in default.monitored_calls.
24.4. Using AddQueueMember for dynamic agents
AddQueueMember is a command that lets you add dynamic agents to a queue. Its main advantage is that you can add channels, i.e.
terminals, so you’ll have most of the advantages of agents without the performance and stability problems that the agents module may cost
in very large systems.
Its disadvantage is that it does not log the agent login/logoff to the queue_log, and so programs that analyze the queue log data like
QueueMetrics will not see agents logging on and off. This is a major organizational problem in a real-world call center, where tracking agent
logons and logoffs is vital to the smooth running of the operations.
The answer is to add a fake queue_log data for each logon and logoff. For QM, it is important to avoid multiple logoff lines and to compute
online permanence with logoffs.
To do the adding, you dial 422XX, where XX is your local extension; the same happens with 423XX to be logged off.
; Add Member - 422
exten => _422XX,1,Answer
exten => _422XX,2,AddQueueMember(my-queue,SIP/${EXTEN:3})
exten => _422XX,3,System( echo "${EPOCH}|${UNIQUEID}|NONE|SIP/${EXTEN:3}|\
AGENTLOGIN|-" >> /var/log/asterisk/queue_log )
exten => _422XX,4,Set(DB(dynlogin/log_Agent-${EXTEN:3})=${EPOCH})
exten => _422XX,5,Hangup
239
Configuring Asterisk for QueueMetrics
; Remove
exten =>
exten =>
exten =>
exten =>
exten =>
exten =>
Member - 423
_423XX,1,Answer
_423XX,2,RemoveQueueMember(my-queue,SIP/${EXTEN:3})
_423XX,3,Set(ORGEPOCH=${DB(dynlogin/log_Agent-${EXTEN:3})})
_423XX,4,Set(RV=$[${EPOCH} - ${ORGEPOCH}])
_423XX,5,GotoIf($["${RV}" = "0"]?8:6)
_423XX,6,System( echo "${EPOCH}|${UNIQUEID}|NONE|SIP/${EXTEN:3}|\
AGENTLOGOFF|-|${RV}" >> /var/log/asterisk/queue_log )
exten => _423XX,7,Set(ORGEPOCH=${DB_DELETE(dynlogin/log_Agent-${EXTEN:3})})
exten => _423XX,8,Hangup
With this setup, we verified that the queue_log can be analyzed by QueueMetrics and the dynamic agent shows up fine (albeit with the
name of a terminal, like SIP/23, instead of the usual Agent/23 string, but you can modify it in QM itself).
This setup might even be used in a call center where agents are not actually used but queues connect straight to terminals to "fake" agent
logon/logoff, in order to have such data available for reporting.
24.5. Defining outbound queues (campaigns)
Standard Asterisk queues are, by definition, inbound queues; they accept a number of incoming calls, let them wait in line and distribute
them to various agents based on the queue logic.
To make it possible to analyze outbound calls with QM, we added the concept of a "campaign" or "outbound queue", that is a set of calls
made by different agents that are working for the same purpouse. Of course there is no such thing as an outbound queue in Asterisk,
so we have to run a special piece of dialplan or an AGI script to produce the same information on queue_log for outbound calls as it is
automatically produced for inbound queues.
As this only regards the actual Dial(…) statement that Asterisk runs, it is possible to have different sources of numbers to be dialled by
agents on outbound queues; they might enter the number on their keypad, or use the telephone, launch them from the Agent’s page or
maybe use a predictive dialler for the task. QueueMetrics does not care, as long as the correct events are logged.
24.5.1. Placing outbound calls
If you run Asterisk 1.4 or newer and want to place outbound calls, you use an example script supplied within the
extensions_queuemetrics.conf; it should be imported by the main Asterisk configuration.
After this, if you place a call directed to Local/XXXYYYYYYY@queuedial, where XXX is the code for the campaign and YYYYYY…. the
number to be dialled, a call will be created and logged as Agent/ZZZ, where ZZZ is the caller-id of the extension placing the call.
You may want to tweak the following supplied piece of dialplan to adapt it to your needs:
[queuedial]
exten => _XXX.,1,Set(QDIALER_QUEUE=q-${EXTEN:0:3})
exten => _XXX.,n,Set(QDIALER_NUMBER=${EXTEN:3})
exten => _XXX.,n,Set(QDIALER_AGENT=Agent/${CALLERID(num)})
exten => _XXX.,n,Set(QDIALER_CHANNEL=SIP/${QDIALER_NUMBER})
exten => _XXX.,n,Set(QueueName=${QDIALER_QUEUE})
exten => _XXX.,n,MixMonitor(Q-${QDIALER_QUEUE}-${UNIQUEID}.WAV|b|)
;exten => _XXX.,n,Set(CALLERID(all)="1234567890" ) ; Uncomment and change this if you ne
exten => _XXX.,n,Goto(qm-queuedial,s,1)
You can/should modify the following variable definitions:
• QDIALER_QUEUE is taken from the first three digits. If you have ony one campaign system-wide, you may want to hardcode this value
so the user needs not input it.
• QDIALER_AGENT is the Agent code that the call will be logged under. The simplest approach is just to use the extension’s caller-id,
under the hypotesis that Agent/123 works at SIP/123. You may also look up under Asterisk who is the agent working at a given extension
- an example is given in the [queuedial-loggedon] context in the same file.
• QDIALER_CHANNEL is the channel that you have to dial to call out. Will likely be something
• You can comment out the MixMonitor line if you don’t need call recordings.
Please note that:
• The outbound queue should not be defined in Asterisk, but must be in QueueMetrics.
• When running a QueueMetrics analysis, some values are their own mirrors: like, the Caller*ID of an incoming call is the number dialled of
an outbound queue, while the Agent field is the caller.
240
Configuring Asterisk for QueueMetrics
• It is possible to do live listening of outgoing calls (see Section 24.6, “Enabling ACD call attempts recording on Asterisk 1.0 and 1.2”).
• It’s possible to specify your caller ID uncommenting the line where the Set function is called and, obviously, changing the caller ID
information to properly set it as required. The same modification is needed for the extensions 28 definition present in the same file.
24.5.2. Placing outbound calls through the AGI script
This section applies only if you run a version of Asterisk 1.0 or 1.2; for 1.4 or newer, please use the dialplan logic supplied in the file
extensions_queuemetrics.conf.
The AGI script to be used instead of the Dial(…) command is available in the standard QM distribution and can be used in the following
way:
exten => xxx,1,DeadAGI(queueDial.agi|Number|DialString|QueueName|Agent)
The following parameter have to be passed by dialplan logic:
• Number: the number you are trying to dial. Needed for correct logging only.
• DialString: the actual Asterisk dial string, like SIP/34, or maybe IAX2/usr:[email protected]/8885551234. If you need additional
parameters in the Dial() command, modify the AGI script manually.
• QueueName: the outbound queue to be used for accounting. Must be defined in QueueMetrics and must not exist in Asterisk!
• Agent: the agent placing the call, e.g. Agent/123
A working example might be the following:
exten => 426,1,DeadAGI(queueDial.agi|34|SIP/34|queue-out-1|Agent/101)
The terminal SIP/34 is dialled and the resulting events are logged as if generated by Agent/101 working on queue-out-1.
Please note:
• The outbound queue should not be defined in Asterisk, but must be in QueueMetrics.
• When running a QueueMetrics analysis, some values are their own mirrors: like, the Caller*ID of an incoming call is the number dialled of
an outbound queue.
• When monitoring calls in real-time, it is impossible to distinguish calls waiting to be answered from calls in conversation. This is an
Asterisk limitation, as the generated events are not provided in real-time. Those values are anyway correct in the reports.
• Extensive debugging output is available at /var/log/asterisk/agi-log.txt
• It is possible to do live listening of outgoing calls (see Section 24.6, “Enabling ACD call attempts recording on Asterisk 1.0 and 1.2”).
24.6. Enabling ACD call attempts recording on Asterisk 1.0 and
1.2
To get the AGENTATTEMPT code to work, it is necessary to patch the Asterisk module called app_queue.c in order to track down the
required information. In order to perform this task, you must be confident with general Unix project patching and recompiling. It is advisable
that Asterisk be shut down before applying the patch.
In order to apply the patch, just copy the file app_queue_agentattempt.patch found under WEB-INF/README/ to the apps/ directory of your
Asterisk project, and then issue the following statement:
patch -p0 < app_queue_agentattempt.patch
As long as you see no errors, the patching process worked successfully. It’s now time to rebuild the app by issuing a general make
statement from the main Asterisk directory.
Restart Asterisk and check that the queue system is still working fine.
To see if the patch was correct, try dialling a queue and see that Asterisk writes AGENTATTEMPT records to the queue_log file.
QueueMetrics starts to analyze AGENTATTEMPT verbs when the configuration key default.ignoreRingNoAnswer is set to true.
24.7. Enabling ACD call attempts recording on Asterisk 1.4
Asterisk 1.4 is natively able to produce the RINGNOANSWER log entry that servers the same purpose of AGENTATTEMPT, so no
patching is necessary. In this case QueueMetrics reports in the realtime page the last agent that had not picked up the phone when ringing.
QueueMetrics starts to analyze RINGNOANSWER verbs when the configuration key default.ignoreRingNoAnswer is set to false.
241
Configuring Asterisk for QueueMetrics
Is possible to have the AGENTATTEMPT information in a not patched Asterisk 1.4 with some modifications in the dialplan. This option is
limited to people not using the hotdesking feature. For more information on that, please refer to the QueueMetrics advanced configuration
manual.
24.8. Listening to live calls: Unattended Call Monitoring
In order to implement this feature, QueueMetrics follows the following steps:
• It will try to dial the channel defined in the property callfile.monitoring.channel by passing the local extension. This should make your local
phone ring.
• Once the call is picked-up, it will try to dial 11@queuemetrics (if the call is inbound) or 14@queuemetrics (if the call is outbound) in order
to start the ChanSpy() monitoring and will pass along all required variables to match the requested call.
To enable unattended audio monitoring for inbound calls, you’ll have to edit the Asterisk dial-plan in order to include the [queuemetrics]
context.
• Make sure that the queuemetrics context exists and that the extensions 10, 11 and 14 are defined for it. See Appendix C, The
[queuemetrics] context
• Make sure that the channel defined in the property callfile.monitoring.channel is set to Local/$EM@from-internal [mailto:EM@frominternal]/n (in this example, your telephone would be known by Asterisk as something like 105@from-intenal).
• Make sure that the extension/context are set to 11/queuemetrics ( the unattended audio monitoring endpoint).
• Make sure that the callfile.dir property points to a valid callfile directory, and that will be writable by QueueMetrics. As a (now preferred)
alternative you may enter a Monitor URI in the format tcp:user:pass@server; in this case QM will not attempt to generate a call-file but
will use the Manager command to create an equivalent call instead.
• Make sure the callfile.monitoring.enabled configuration property is set to true
• Make sure your users hold the MON_AUDIO key
• Important: make sure that each agent will have their local extension set in QueueMetrics; usually entering "-" will be enough. If this is not
set, the icon will not appear.
• Now, when you click on the icon, a callfile will be generated and call snooping will start.
To enable unattended call monitoring for outgoing calls as well, you’ll have to set the piece of dial-plan referenced by the
callfile.outmonitoring… properties.
Outgoing calls placed though queueDial.agi will usually be listened to by attaching to the local SIP/XXX or Local/XXX channel of the calling
agent and not to the standard Agent/XXX channel used for inbound, so a different piece of dial-plan will be used. Note that in order for
QueueMetrics to reference the outgoing calls, you must tell it that queue direction is Outgoing.
See also Appendix C, The [queuemetrics] context for an example of implementing Asterisk code for inbound and outbound call monitoring.
It is possible to use different PMs to handle different live audio - see Chapter 22, Listening to calls using Pluggable Modules (PM).
if you pass an empty variable to the ChanSpy() command, it will let the user listen to any channels on the system. This may
be a major security issue. So if you edit the supplied dialplan to match your configuration, make sure that you add a check
in case a computed channel to listen on might be empty!
24.9. Enabling VNC Monitoring
To enable VNC monitoring you will first need a VNC server that is running on each client’s machine and that will serve the current layout.
You will also have to create a web page with a VNC client that may accept a VNC URL and show a VNC client (there are a number of
Java-based VNC clients that can be displayed as an applet).
Configure the VNC URL as something like: http://myserver/vncpage.php?ip=192.168.3.17
Where the PHP page will connect the VNC applet to the server located on address 192.168.3.17
Make sure that your users hold the MON_VNC key in order to be able to access this feature.
As an alternative, we have some clients that use a simpler setup with each machine having their own copy of UltraVNC - http://
ultravnc.sourceforge.net/ - and each machine running a web server with the locally-configured Java viewer. The VNC url is then the
address of the local machine; when a person connects to it, s/he is asked for a password and then the screen is displayed through a Java
applet. They report this setup to be very simple and working very well.
24.10. Enabling Agent’s page actions
In order to enable actions on the Agent’s page:
242
Configuring Asterisk for QueueMetrics
• Check that all actions are enabled in the properties, this means that callfile.actionname.enabled=true
• Check that a Manager API is configured correctly for the server
• Check that the dialplan on the server contains the appropriate commands for this action. A sample [queuemetrics] context you can
include easily within a standard dialplan using call-back agents is provided as a reference.
As of QM release 12.10 it is possible to set input validation for both the agent code and the extension. As an example, by setting the key
realtime.agentRegexp=1\\d\\d you are defining that the agent code must start with a one and cannot be more than 3 digits, while by setting
the key realtime.extensionRegexp=\\d\\d\\d\\0 you define that the agent extension must be four digits and must end with a zero. Please
note that the backslash in the regexp has to be written as \\ in the configuration.properties file.
24.11. Enabling XML-RPC call listening and streaming
It is possible to run remote audio monitoring of both completed and ongoing calls using third party monitoring tools, for example OrecX. As
QueueMetrics has no way of knowing the internal details of such applications, we made it possible to call an external XML-RPC server (we
offer a stub written in PHP, but it can be written in any language and reside on any server, as long as it uses an XML-RPC library) that will
basically pass back to QM the URLs required to perform the required task.
In order to enable this, we first tell QueueMetrics to use the XML-RPC Pluggable Modules for both call listening and streaming:
audio.server=it.loway.app.queuemetrics.callListen.listeners.ClassicXmlRpcRecordings
audio.liveserver=it.loway.app.queuemetrics.callListen.RTlisteners.ClassicXmlRpcListenerRT
The XML-RPC server will be set by setting its URL in a configuration property, like for example:
default.audioRpcServer=http://127.0.0.1/xmlrpc/xmlrpc_audio_server.php
The server must implements three XML-RPC calls called:
• QMAudio.findStoredFile
This function is used to find and play back a stored audio file, by returning the URL of a player that will play it or the audio file itself. This
function has in input the following parameters:
• $ServerID: ignore for now
• $AsteriskID: The Asterisk call-id, as written in the second field of queue_log
• $QMUserID: the ID of the current QM user
• $QMUserName: the name of the current QM user
and it must return the following values:
• $FILE_FOUND : If the file was found or not (maybe it was not recorded)
• $FILE_LISTEN_URL : an URL to open up a player for this call
• $FILE_LENGTH : size of the audio file (displayed as returned)
• $FILE_ENCODING : encoding of the audio file (eg mp3)
• $FILE_DURATION : duration of the audio file
In case multiple values are to be returned (because e.g. the call is split into multiple recordings) then the following format must be used:
• $FILE_FOUND : true
• $FILE_LISTEN_URL : "MULTI:http://url1 http://url2 http://url3"
• $FILE_LENGTH : "100k 50k 120k"
• $FILE_ENCODING : "mp3 mp3 mp3"
• $FILE_DURATION : "1:00 0:30 1:20"
As you can see, the listen URL starts with the string "MULTI:" and has multiple values separated with space. The other parameters also
hold multiple values separated by space.
• QMAudio.listenOngoingCall
This function is used to query for an ongoing inbound call. If found, QM will launch a new popup to open the player which URL is
returned. This function has in input the following parameters:
• $ServerID: ignore for now
• $AsteriskID: The asterisk call-id, as written in the second field of queue_log
• $Agent: the name of the agent being monitored e.g. "agent/101"
243
Configuring Asterisk for QueueMetrics
• $QMUserID: the ID of the current QM user
• $QMUserName: the name of the current QM user
and it must return the following values:
• $CALL_FOUND: If the call was found or not
• $CALL_LISTEN_URL : the URL of the player
• $CALL_POPUP_WIDTH, $CALL_POPUP_HEIGHT: width and height of the popup being opened. Currently a double popup is opened.
• QMAudio.listenOngoingCallOutgoing
This function is used to query for an ongoing outgoing call. If found, QM will launch a new popup to open the player which URL is
returned. The parameters are the same as for QMAudio.listenOngoingCall.
To make implementer’s life easier, we provide a simple XML-RPC stub server under WEB-INF/mysql-utils/xml-rpc that can be used
as a starting point: no need to handle the XML-RPC stuff, just change the results of the two supplied functions and data goes back to
QueueMetrics.
24.12. Enabling call outcomes
A call tracking code is a code to be input by a user telling the status of a call, be it inbound or outbound. This status code is a string (though
we suggest to use numeric status codes, in order to make it easy to input them using a telephone keypad) and may be input either when
the call is ongoing or after a short while from its end.
The queue_log entry looks like the following one:
1234|1231.1|NONE|Agent/1234|CALLSTATUS|21
This will set the CALLSTATUS to "21" for the call which Call-ID is "1231.1" it may be an open call or it may be terminated by no longer than
30 minutes.
If it is not possible to force the Call-ID, a second version of the verb is available:
1234|2222.3|NONE|Agent/1234|CALLSTATUS|21|1231.1
This has exactly the same meaning; the second Call-ID passed as a parameter will override the original one.
If you prefer, you may log the queue name instead of "NONE" field shown above; in any case QM will ignore this piece of information.
The following rules apply:
• A CALLSTATUS row must be set after the call is started or it’s terminated; in any other case it’s simply discarded
• There may be multiple CALLSTATUS rows for the same Call-ID; in this case, the last one overrides pervious codes.
• The CALLSTATUS must be passed within 30 minutes from the end of a call.
• CALLSTATUS for a non-existent Call-ID will be discarded
• Even if a queue reset is detected, CALLSTATUS for existing Call-ID are applied
The agent may either be a fill "Agent/xxx" string or the valid name of an Asterisk channel. It is acceptable to use a generic channel name
instead of the specific one, i.e. "SIP/123" and "SIP/123-abcd" are equivalent.
The sample [queuemetrics] context that comes with QueueMetrics can be used as a starting point to output such data.
24.12.1. Keeping the UNIQUEID of the call when setting status code
One of our clients has successfully implemented Call Outcomes by using AEL.
In the Hangup-Extension, use:
if("${MEMBERINTERFACE}" != "" && "SIP/${CALLERID(ani)}" != "${MEMBERINTERFACE}" ) {
// to be able to record QueueMetrics call outcome later
Set(GLOBAL(queue_last_call_${MEMBERINTERFACE:4})=${UNIQUEID});
}
The outcome is recorded like this:
_#XX = > {
// ${user_name} contains the extension number of the agent
Answer();
244
Configuring Asterisk for QueueMetrics
if ("${queue_last_call_${user_name}}" != "") {
QueueLog(NONE,${queue_last_call_${user_name}},SIP/${user_name},CALLSTATUS,$
Set(GLOBAL(queue_last_call_${user_name})=);
Playback(beep);
} else {
Playback(beeperr);
}
Hangup();
}
24.13. Enabling call features
A call feature code is a code to be input by a user telling the sub-status of a call, be it inbound or outbound. This feature code is a string
and may be input either when the call is ongoing or after a short while from its end. Several call feature codes can be associated to a single
call; QueueMetrics will count all the associated feature code. A feature code may have an optional free text associated with it.
The queue_log entry looks like the following one:
1234|1231.1|NONE|Agent/1234|INFO|FTR|36
This will set the feature code to "36" for the call which Call-ID is "1231.1" it may be an open call or it may be terminated by no longer than
30 minutes.
A second version of the verb is available:
1234|1231.1|NONE|Agent/1234|INFO|FTR|41|Hello there
This has exactly the same meaning but the feature code contains a free text associated with it.
Feature codes can be removed from a call by mean of a trace added in the queue log:
1234|1231.1|NONE|Agent/1234|INFO|NOFTR|36
This will remove the feature code "36" to the call with Call-ID is "1231.1". If no feature code "36" have been already associated with the call,
QueueMetrics simply discards the trace.
The following rules apply: * Features should be entered while the call is ongoing or within 30 minutes of its closure. The loopback period is
the same as for setting the outcome. * Features have a code and an optional textual value. The text should be printable ASCII7 and cannot
contain pipe or special, non-printable characters. Though we enforce no limit on this, we suggest using no more than 40 characters. * If
multiple features with the same code are applied for the same call, the last one wins (sets the text of it) * In order to remove a feature, a
special verb NOFTR is passes * If successive lines set the feature after a NOFTR, the feature is set and so on.
The sample [queuemetrics] context that comes with QueueMetrics can be used as a starting point to output such data.
24.14. Enabling pause codes
A pause reason code is a code to be input by a user telling the reason why a pause was started. It should be ideally input together with the
decision to go on pause, though QueueMetrics will accept the code and will attach to the correct pause even if the pause is resumed, as
long as no other pause is started. The reason code is a string - though we suggest to use numeric status codes, in order to make it easy to
input it using a standard telephone keypad.
The format is the following one:
1234|1231.1|NONE|Agent/1234|PAUSEREASON|21
This will set the pause reason to "21" for the pause that is either going on or has just finished. If the code is input after over 30 minutes from
the end of the last pause, it is discarded.
The following rules apply:
• A PAUSEREASON row must be set after the agent’s pause is started or it’s terminated; in any other case it’s simply discarded
• There may be multiple PAUSEREASON rows for the same pause; in this case, the last one overrides pervious codes.
• The PAUSEREASON must be passed within 30 minutes from the end of a pause; otherwise it will be silently discarded.
• PAUSEREASON for a non-existent agent pause will be discarded.
• If a pause extends over multiple call sessions, the PAUSEREASON will be correctly set only for sessions terminating after the
PAUSEREASON has been set.
• Even if a queue reset is detected, PAUSEREASON for existing pause are applied
245
Configuring Asterisk for QueueMetrics
• The agent may either be a fill "Agent/xxx" string or the valid name of an Asterisk channel. It is acceptable to use a generic channel name
instead of the specific one, i.e. "SIP/123" and "SIP/123-abcd" are equivalent.
The sample [queuemetrics] context that comes with QueueMetrics can be used as a starting point to output such data.
Since Asterisk 1.6, it is possible to pass a pause reason code to the native Pause application. QueueMetrics will handle this
correctly, and allows mixing the two methods as you best see fit.
24.15. Tracking required skills
Skills can be specified at any time before of after the call enters the queue but the suggested way is to have them immediately after the
ENTERQUEUE verb as in:
1167335958|1167335958.530054|cpc|NONE|ENTERQUEUE||01909723335
1167335958|1167335958.530054|cpc|NONE|INFO|REQSKILL|DE|90
1167335958|1167335958.530054|cpc|NONE|INFO|REQSKILL|NET|70
1167335958|1167335958.530054|cpc|Agent/101|CONNECT|41|Agent/101
1167335958|1167335958.530054|cpc|Agent/101|COMPLETECALLER|41|23
In the example above, the call is queued on a queue called cpc with required skills DE>=90 and NET>70, so it could be a request for
someone servicing internet support in German. Basically you just add an event for each required skill, and the level at which it is required.
We do not need this information on connected/failed calls, as we assume that the routing is always correct.
The following rules apply:
• Rules are read as a label (the rule) and a number. If the number is invalid, it is read as zero and no exception is raised
• The label can be any valid ASCII7 string, punctuation and spaces
• For a skill to be added, it must have a non-empty label and a skill level > 0
• If a skill is repeated multiple times, the last value wins. In the call details, the full sequence of events is displayed
• It is not possible to remove a skill from a call
24.16. Closing ongoing calls
It sometimes happens that Asterisk will not log the call termination records for a call; as QM is based on the logged events, a call missing
the call closure log will linger on forever in the realtime screen (or at least the maximum time allowed by the …) and will appear as Ongoing
or Not answered yet in the historical reports.
Since version 1.4.5 of QueueMetrics, it is possible to manually close a call from either the historical reports or the real-time screen. In order
for this to work:
• You must be running with MySQL storage or clustered storage
• Your user must own key CLOSECALLS
When this is done, open calls on the reports will show a red scissor icon:
And the same will happen for the real-time screen:
By clicking on that icon, a popup will appear that will ask for the length the call should be closed to. This length refers to the wait duration if
the call is not answered and the conversation time if the call is answered. It is possible to change that from the default 5 seconds by setting
a configuration property.
If the call has already been closed in the meantime, or you’re doing this operation twice, QM will report that the call has already been
closed.
246
Configuring Asterisk for QueueMetrics
if you do this on calls that are still ongoing, you will risk having duplicate data on the report. So don’t use this feature unless
you know what you are doing. The required security key must be manually assigned only to trusted users.
24.17. Tracking DNIS and IVR information
In order to track IVR information, it would be advisable to follow the newer logging format defined in Section 9.2,
“Implementing IVR tracking”.
In order to keep track of DNIS and IVR information that relates to each call, you have to write special records on the queue_log file that
QueueMetrics parses.
This is very easy to do, e.g. imagine you have a piece of dialplan where you are going to call queue q-sample and you have the DNIS code
in the MYDNIS dialplan variable, and the sequence of keys pressed as MYIVR:
exten
exten
exten
exten
exten
=>
=>
=>
=>
=>
s,n,........
s,n,QueueLog(q-sample,${UNIQUEID},NONE,INFO,DID|${MYDNIS})
s,n,QueueLog(q-sample,${UNIQUEID},NONE,INFO,IVR|${MYIVR})
s,n,Queue(q-sample|nt|||60)
s,n,........
There is no predefined format for DNIS and IVR information; QueueMetrics just handles it as free-form text strings. It can be optionally
decoded by creating values in the IVR and DNIS configuration pages.
You can output only one record, or both, or none, depending on what you need.
24.18. Adding TAG information to calls
Some call centers require to report call set at the list level below campaign. This is frequently used for outbound campaings.
QueueMetrics searches TAG information on the queue log file. To enable Asterisk to place a TAG signature in the queue log a dialplan
modification is needed. Below is an example on how this could be done, assuming you have the TAG code in the MYTAG dialplan variable:
exten
exten
exten
exten
=>
=>
=>
=>
s,n,........
s,n,QueueLog(q-sample,${UNIQUEID},NONE,INFO,TAG|${MYTAG})
s,n,Queue(q-sample|nt|||60)
s,n,........
You can assign only one TAG for each call. If more than one TAG are assigned to a single call, QueueMetrics will discards all TAGs except
the latest found in the queue log file.
24.19. Enabling Hotdesking in the agent page
Since the demise of AgentCallBackLogin, it has been hard to do "hotdesking" in Asterisk - that is, having agents that work on queues
because of their competences and not because they are sitting at a given extension.
With QueueMetrics 1.6.1, hotdesking is very easy to implement and it has no downsides, because:
• it is completely transparent to Asterisk
• you can emulate the single-sign-on behavior of AgentCallBack and still have the flexibility of adding/removing members as needed on a
queue by queue basis.
• call recordings, agent monitoring and all other functionalities are unaffected
Requirements:
• QueueMetrics 1.6.1 or newer
• MySQL storage model
• Asterisk 1.4 or 1.6
24.19.1. How it works
Set the following properties within the configuration.properties file, as follows:
default.queue_log_file=sql:P001
<-- change as needed
callfile.dir=tcp:admin:[email protected] <-- change as needed
247
Configuring Asterisk for QueueMetrics
default.rewriteLocalChannels=true
callfile.agentlogin.enabled=false
callfile.agentlogoff.enabled=false
default.hotdesking=86400
Make sure that extensions_queuemetrics.conf is loaded in the Asterisk dialplan (you need to use the extensions_queuemetrics file that
comes with QM 1.6.1 or newer).
This setup means that we access the queue_log file through the database, connect to Asterisk over AMI to send commands, rewrite agent
codes, do not use Agentcallback-style agents and enable hotdesking.
Now we use a piece of dialplan like this one when we associate an agent to a queue:
Imagine we have AGENTCODE set to 200 (the agent’s login code) and AGENT_EXT set to 123 (thi sis the SIP extension code):
....
exten => 35,3,QueueLog(NONE,${UNIQUEID},Agent/${AGENTCODE},HOTDESK,SIP/${AGENT_EXT})
exten => 35,4,AddQueueMember(myqueue,SIP/${AGENT_EXT})
....
This logs on Agent/200 to queue "myqueue", tracking him as SIP/123. Note that from the point of view of Asterisk, we only see that
extension 123 is made a member of the queue.
When you logoff, pause, unpause agents, you always work at the SIP level (the actual extension that is linked to the queue) so there is no
need to change anything.
If you use the QueueMetrics Agent’s page, you can do logon/logoffs/pauses from the buttons by the top of the page; this lets you add an
agent to all queues at once, like you used to do with AgentCallBackLogins, and still retain the flexibility to change that at runtime.
24.19.2. Example hotdesking configuration
In the following sections, we sumamrize the changes that have to be made to an existing system to enable hotdesking.
24.19.3. Changes to configuration.properties
Add/change the default.hotdesking property to 86400. This property enables hotdesking and lets the parse "look back" up to 1 day (change
as needed).
default.hotdesking=86400
Add/change the sections below:
callfile.agentpause_ht.enabled=true
callfile.agentpause_ht.channel=Local/32@queuemetrics/n
callfile.agentpause_ht.extension=10
callfile.agentpause_ht.context=queuemetrics
callfile.agentunpause_ht.enabled=true
callfile.agentunpause_ht.channel=Local/33@queuemetrics/n
callfile.agentunpause_ht.extension=10
callfile.agentunpause_ht.context=queuemetrics
callfile.agentaddmember_ht.enabled=true
callfile.agentaddmember_ht.channel=Local/35@queuemetrics/n
callfile.agentaddmember_ht.extension=10
callfile.agentaddmember_ht.context=queuemetrics
callfile.agentremovemember_ht.enabled=true
callfile.agentremovemember_ht.channel=Local/37@queuemetrics/n
callfile.agentremovemember_ht.extension=10
callfile.agentremovemember_ht.context=queuemetrics
This code specifies the Asterisk extensions that QueueMetrics will call for each button present in the agent live page when hotdesking is
enabled.
Change the realtime.agent_button_x.channel key to the value Local/[EM]@from-internal
This last option is needed only if you use custom agents buttons to dial out extensions and should be repeated for each dial-enabled
button. In the code below, a valid example for the button 4 is reported:
248
Configuring Asterisk for QueueMetrics
realtime.agent_button_4.enabled=true
realtime.agent_button_4.caption=Secretary
realtime.agent_button_4.url=
realtime.agent_button_4.channel=Local/[EM]@from-internal
realtime.agent_button_4.ext=200@queuedial
if you use a channel like Local/123@from-internal as the hotsedking extension, remember to tun off local channel rewriting
first, or it will not work.
24.19.4. Changes to extensions_queuemetrics.conf
Here should be defined the Asterisk extensions used by QueueMetrics to perform actions triggered from the agent live page.
Add to this file the code reported below:
; extension 32: agent pause with hotdesking (with pause code)
exten => 32,1,Answer
exten => 32,2,NoOp( "QM: Pausing Agent/${AGENTCODE} at extension SIP/${QM_AGENT_LOGEXT} \
with pause reason '${PAUSEREASON}' made by '${QM_LOGIN}' " )
exten => 32,3,PauseQueueMember(,SIP/${QM_AGENT_LOGEXT})
exten => 32,4,System( echo "${EPOCH}|${UNIQUEID}|NONE|Agent/${AGENTCODE}|PAUSEREASON|${PA
>> /var/log/asterisk/queue_log )
exten => 32,5,Hangup
; extension 33: agent unpause with hotdesking
exten => 33,1,Answer
exten => 33,2,NoOp( "QM: Unpausing Agent/${AGENTCODE} at extension SIP/${QM_AGENT_LOGEXT}
made by '${QM_LOGIN}' " )
exten => 33,3,UnpauseQueueMember(,SIP/${QM_AGENT_LOGEXT})
exten => 33,4,Hangup
; extension 35: agent addqueuemember with hotdesking (for asterisk v1.4+)
exten => 35,1,Answer
exten => 35,2,NoOp( "QM: AddQueueMember (asterisk v1.4+) Agent/${AGENTCODE} at extension
SIP/${QM_AGENT_LOGEXT} on queue ${QUEUENAME} made by '${QM_LOGIN}' with prioritylabel
'${QM_AGENT_PRIOLBL}' and prioritynum '${QM_AGENT_PRIONUM}'" )
exten => 35,3,Macro(queuelog,${EPOCH},${UNIQUEID},NONE,Agent/${AGENTCODE},\
HOTDESK,SIP/${QM_AGENT_LOGEXT})
exten => 35,4,AddQueueMember(${QUEUENAME},SIP/${QM_AGENT_LOGEXT})
exten => 35,5,Hangup
; extension 37: agent removequeuemember with hotdesking (for asterisk v1.4+)
exten => 37,1,Answer
exten => 37,2,NoOp( "QM: RemoveQueueMember (asterisk v1.4+) Agent/${AGENTCODE} at extensi
SIP/${QM_AGENT_LOGEXT} on queue ${QUEUENAME} made by '${QM_LOGIN}'" )
exten => 37,3,RemoveQueueMember(${QUEUENAME},SIP/${QM_AGENT_LOGEXT})
exten => 37,4,Hangup
Please note that the extensions_queuemetrics.conf file that ships with 1.6.1 already has these changes embedded.
In order to have the hotdesking working a complete QueueMetrics restart and Asterisk reload should be performed.
24.20. Running Asterisk 1.8 with QueueMetrics
QueueMetrics is compatible with Asterisk 1.8 but you need to properly set it. The first requirement is related to a strange behavior found
in Asterisk 1.8.0 and 1.8.1 that prevents Asterisk to properly log all queue activity until a a reload command is issued from the CLI. To fix
this problem we had to change the code in the logger.c file found in the main subfolder present in the asterisk sources, near the line 396, in
order to have something similar to what is listed below:
if (qlog)
fclose(qlog);
249
Configuring Asterisk for QueueMetrics
{
char tmp[4096];
snprintf(tmp, sizeof(tmp), "%s/%s", ast_config_AST_LOG_DIR, queue_log_nam
qlog = fopen(tmp, "a");
}
Then we had to rebuild asterisk and to reinstall it.
The next step is to replace the extensions_queuemetrics.conf file with the specific version for Asterisk 1.8. To do this, you need to copy the
extensions_queuemetrics_18.conf replacing the one present into the asterisk configuration folder then reload the dialplan from the CLI. The
extensions_queuemetrics_18.conf is targeted to Asterisk 1.8 with hotdesking enabled.
This applies ONLY to some earlier versions of Asterisk 1.8
24.21. Handling Agents priorities on queues
Starting from QueueMetrics 1.6.3 is possible to define priorities when logging agents in a specific queue. The priority associated to each
agent is dependent on how the agent was configured in the queue (main, spill or wrap).
• QM_AGENT_PRIOLBL is set to "U" when the queue is not assigned to the agent, "M" when the queue is a normal working queue for the
agent (Main), "W" when the agent is set as Wrap for the queue, "S" when the agent is set as Spill for the queue.
• QM_AGENT_PRIONUM is set to 0 when the queue is not assigned to the agent or the queue is a normal working queue for the agent; 1
when the agent is set as Wrap for the queue, 2 when the agent is set as Spill for the queue.
24.22. Using known numbers
In QueueMetrics, it is posible to keep track of a set of "known numbers" through a specific editor as described in Section 21.12,
“Configuring known numbers”
For each number, we track:
• An action to be done
• A name and description
• An optional expiry date
• The number of times the rule was hit, and the last time it was hit
• An optional "agent affinity" attribute
A webservice - built to be easy to query from the Asterisk dialplan or through JSON - lets the user query whether the number exists and
what to do with it.
Possible actions include:
• Blacklist: the number is to be hung up, or moved to a low priority queue
• VIP: the number is to be moved to a VIP queue, or its queue priority is to be made higher
• Agent affinity: if a number has "affinity" with some agent, then the agent should be tried first (by using a personal queue, or reaching
them though a direct channel and "faking" agent records so that they appear as if the call was processed on a queue)
• Caller name / CRM ID: the caller-id is rewritten so that a proper name can be associated with the call.
Those actions are to be implemented at the Asterisk dialplan level.
The webservice is meant to be easy to interoperate with a standard Asterisk CURL call.
exten => s,1,Set(res=${CURL(http://my.qm:8080/queuemetrics/numberLookup.do?number=$(CALLE
The page returns a response as text/plain that will be embedded in the dialplan variable res. The response is based on the following table:
Table 24.1. Possible API modes
Mode
Sample response
Notes
action
UNKNOWN
The response UNKNOWN means that
the number is not listed; the response
blank means that it is listed but no action
is required. The number of hits and last hit
counters are updated.
BLACKLIST
VIP
250
Configuring Asterisk for QueueMetrics
Mode
Sample response
Notes
<blank>
affinity
Agent/106
The number has a known affinity for
Agent/106. If no known affinity, returns
blank.
'' <blank>
name
John Doe
An URL-encoded name for this number, or
blank if no name set / unknown number.
The name will be stripped of non-Ascii7
characters.
<blank>
json
{ 'action': 'vip',
'name': 'John Doe',
'affinity': 'Agent/101\' }
hash
action=vip&name=John Doe&affinity=
In this mode, a JSON object is returned with
the information shown. This way you can
query all the parameters at once, or you
can use a JSON library for querying. The
response is returned as application/json.
In this mode, the returned string is encoded
as an Asterisk hash (see below). This way,
all the results can be read at once.
Notes
• It is important to make sure that the HTTP error case is handled at the dialplan level, in case QM was unavailable at the time of the call.
• It is also important to set a quick connection timeout through CURLOPT(<option>) to make sure that if QM does not answer quickly, the
default case is handled.
The trivial format used in the response makes it possible to use the service using the command-line curl, or by using a trivial scripting
language.
The "user" parameter is mandatory and requires a valid QueueMetrics username and password, separated by a ":". This is needed
because the API will be publicly exposed. The user must hold the security key PBXAPI
In order to avoid security risks, the user should be custom-made and assigned to a class that only contains the key PBXAPI. This way the
user will be able to log on to QM but will have no actual grants but logging off.
Asterisk hashes
When querying an Asterisk hash, the result is built as a string so that you can do:
Set(HASH(numinfo)=${CURL(myurl)})
to load the results from QM, and then parameter e.g. action can be read as:
${HASH(numinfo,action)}
In order to avoid issues when returning data from QueueMetrics in the HASH format:
• Data is returned as UTF8
• All special characters in the returned strings will be replaced by and underscore. Those being:
• non printable (CR, LF, etc.)
• having a possible meaning in the Asterisk dialplan or in the querystring-like hash format being non ASCII7
When querying each response separately, the response is instead UTF8.
24.23. Configuring the AMI connection
QueueMetrics bases its reports on data generated from the Asterisk queue_log file; still, it sometimes needs to send commands to Asterisk
in order to performs some actions, e.g. log on agents, or listen to live calls.
In order to perform such commands, two things are required:
• A working AMI connection should be present
• The extensions_queuemetrics.conf file should be included in the PBX’s dialplan
For historical reasons, the default way QueueMetrics used to send commands was to generate Asterisk call files; now this method is
obsolete and the correct one is to set-up an AMI connection.
In order to set up an AMI conenction, you have to set the following property like e.g.:
callfile.dir=tcp:admin:[email protected]
251
Configuring Asterisk for QueueMetrics
The AMI URL is in the following format: tcp:username:password@server:port
• username: This is the AMI username
• password: This is the chosen "secret"
• server: This is the IP address of the server, or 127.0.0.1 if the same server.
• port: This part is optional; if not present will default to 5038.
All three fields are mandatory. The password is sent over a clear-text TCP connection, so make sure to protect it using e.g. a VPN tunnel if
it is to traverse public networks.
Username and password should be made only of letters and digits; no other character should be used.
The configuration above should be matched by the configuration in Asterisk’s own manager.conf file, that should look like the following one:
[general]
enabled = yes
port = 5038
bindaddr = 0.0.0.0
webenabled = no
[admin]
secret = amp111
deny = 0.0.0.0/0.0.0.0
permit = 127.0.0.1/255.255.255.0
read = system,call,log,verbose,command,agent,user,originate
write = system,call,log,verbose,command,agent,user,originate
In order to make testing easier, QueueMetrics includes a test tool that checks whether the current connection is working or not; see
Checking an Asterisk Manager connection Section 21.26.2, “Checking an Asterisk Manager connection” for details.
24.24. Listening to encrypted recordings
QueueMetrics allows to listen to recordings that are stored in an encrypted format. This works by invoking a custom-supplied filter that will
decrypt the recording on-the-fly before QM streams it back to the user.
This is possible only for recordings that are read from disk and streamed by QM; it does not work for recordings that are
streamed by a third-party player (e.g. Oreka), which will usually implement its own encryption scheme.
24.24.1. What is a filter
In order to decrypt a call, QueueMetrics uses a filter, i.e. a program (usually a script) that, given the filename that it needs to decrypt, will
output the decrypted file to STDOUT. This way the decrypted file is never saved on disk.
Encrypting and decrypting recordings on-the-fly can impose a severe load on your QueueMetrics server, as encryption is
usually CPU-intensive.
A sample filter may look like the following script:
PASSW=myPassword
echo $PASSW | gpg --passphrase-fd 0 --batch --decrypt $1
As the filter is not dependent on any specific encryption technology (public key, symmetric keys, etc) QueueMetrics is able to adapt to
whatever technology suits you best.
Please note that the called script does not receive a password - it must be able to run the decryption internally. Most encryption
technologies have the concept of "secure password stores", so that you can avoid storing the password in a plain-text format.
24.24.2. Setting up a filter
In order for QM to decrypt a file, it must match two conditions:
252
Configuring Asterisk for QueueMetrics
• It must end in .crypt, as appended to the natural extension of the file (e.g. the encrypted version of a file named 'audio.mp3' must be
called 'audio.mp3.crypt')
• The configuration property 'audio.decrypt' must point to the decryption filter, as in the example below.
The script to be run must be readable and executable by the QueueMetrics process, as in:
audio.decrypt=/encryptionTools/decryptGPG.sh
When an encrypted file is found by QueueMetrics, it is displayed with a "lock" icon. By clicking on it, the file is decrypted on the server and
streamed back in an unencrypted format.
If a file is not encrypted, QueueMetrics will stream it back without attempting any decryption.
24.24.3. Encrypting calls
As Asterisk does not currently offer any facility for storing encrypted recordings, audio files must be encrypted on a periodical basis.
• Every so often, a process runs and checks for unencrypted recordings in the audio destination directories
• Every file found is first encrypted, and if the encrypted file was actually created, then its unencrypted version is removed.
We offer a sample encryption routine in the files 'encryptAllGPG.sh' and 'encryptGPG.sh' that can be used as an example to deploy your
own script.
The sample encryption and decryption scripts are available under the 'WEB-INF/mysql-utils/audio-encryption' folder in QM.
They are meant as a reference blueprint only and may not be suitable for the required Corporate security standards.
24.25. The QueueMetrics watchdog page
QueueMetrics has a watchdog page - that is, if you request a page called: '/sysup.jsp', you get an answer that is a valid JSON object of the
format:
{
"state" : "QMUP",
"ramFreeMb" : 118,
"ramTotalMb" : 152,
"ramMaxMb" : 1818,
"generatedOn" : "Tue Nov 05 16:44:30 CET 2013",
"version" : "13.12.01 build 607"
}
If the page contains the string QMUP, this means that QueueMetrics is working and able to talk to the database.
The other information on memory usage can be used to be stored in a long-term tracking system (e.g. Nagios, Zabbix, Pandora….) in order
to make it possible to understand if there are memory issues.
We offer a sample watchdog script that checks whether QM is running or not and restarts it - you can find it at 'WEB-INF/mysql-utils/restart/
watchdogQm.pl'.
253
Chapter 25. For more information…
To know more about QueueMetrics in your specific setting or inquire about commercial licences, please feel free to contact Loway.
The latest version of QueueMetrics can be found on the home page located at the address http://queuemetrics.com [http://
queuemetrics.com/]
A number of how-to’s and recipes about QueueMetrics are available on AstRecipes, see http://www.astrecipes.net [http://
www.astrecipes.net/]
There is a QueueMetrics users forum for mutual support, troubleshooting and ideas at http://forum.queuemetrics.com [http://
forum.queuemetrics.com/]
254
Appendix A. Default users
The following users come pre-configured in the default database.
Login
Password
Enabled by default?
Explanation
demoadmin
demo
Yes
The sample admin user
demouser
demo
Yes
The sample CC manager
demovisitor
demo
No
A sample visitor
demosupervisor
demo
No
A sample supervisor
robot
robot
No
A sample robot
webqloader
qloader
No
Access point for
wqloaderd
Agent/101
999
Ye
A sample agent
Agent/102
998
Yes
Another sample agent
Make sure you change their default passwords before letting users access QM!
Please note that some users re present but NOT ENABLED by default with the default database schema supplied with QM. You need to
enable the manually if you need them.
255
Appendix B. Security keys
The following security keys are defined:
KEY
MEANING
USER
Must be held by any valid user
USRADMIN
User can edit other users and classes
USR_AGENT
User can edit agents
USR_QUEUE
User can edit queues
USR_LOCATION
User can edit locations
USR_OUTCOME
User can edit call outcomes and call features
USR_CALLTAG
User can edit call tags
USR_PCODE
User can edit pause codes
USR_MYSQL
User can see the MySQL database page
USR_QAEDIT
User can edit the set of Quality Assessment metrics
USR_AGROUPS
User can edit agent groups
USR_IVR
User can edit the list of known IVR selections
USR_DNIS
User can edit the list of known DID/DNIS
USR_CBTS
User can edit the list of known CBTs
USR_SKILLS
User can edit agent skills
REALTIME
User can see real-time stats
RTLIVE
User can access the Live stats
QUEUE_AN
User can run reports
AGREP
User can filter reports by agent
AGENT
User is an agent and sees agent page
CALLMONITOR
The user can listen to a recorded call
CALLMONITOR_ADDTAGS
The user can add markers to recorded calls
CALLMONITOR_DELTAGS
The user can delete markers from recorded calls
MON_AUDIO
The user can monitor a real-time call
MON_VNC
The user can monitor an agent’s screen via VNC
ROBOT
User may launch ROBOT transactions.
CHPASSWD
User can change his own access password
SUPERVISOR
User is a supervisor and can run the supervisor’s
report
QA_TRACK
User can enter Quality Assessment data
QA_REPORT
User can run Quality Assessment reports
QA_REMOVE
User can delete Quality Assessment data
QA_REPLACE
Together with QA_REMOVE, user can edit an already
submitted Quality Assessment data
CLOSECALLS
This user can close ongoing calls from the Real-time
or the historical stats page.
AGAW
This user can access AGAW facades (for agents).
AGAW_ADM
This user can access the AGAW administration
screens
AGAW_REP
This user can access the AGAW supervisor screen
BRO_MSG
This user can send broadcast messages to agents
MON_IM
This user can start an IM chat to an agent
CONFIG
This user can start the auto configuration wizard
(attended and unattended mode)
USR_AGROUPS
This user can edit custom agent groups
PAYROLL
This user is allowed to check the payroll page
256
Security keys
KEY
MEANING
PAYROLL_REMOVENOTE
This user is allowed to remove a note in the payroll
page
QLOG_EDIT
This user is allowed to edit the queue_log records
QLOG_LNGR
This user is allowed to edit session data by making it
longer (they must hold QLOG_EDIT as well)
USR_REPORTS
Edit QueueMetrics reports
USR_REPORTS_EXPORT_EDIT
Edit PDF and XML export jobs
USR_REPORTS_EXPORT
This user is allowed to export whole reports in PDF
and XLS
USR_KNUMBERS
User can view and edit known numbers
TASKS
User can see/edit tasks he sent and he received
TASKS_VIEWALL
User can see all tasks present in the database
BATCH_ADM
Audio export - Creates and closes batches
BATCH_ADD
Audio export - This user can add calls to an open
batch
BATCH_VIEW
Audio export - This user can see batches
BATCH_DEL
Audio export - This user can remove calls from a
batch.
QA_PERF_TRACK
Can run Agent Performance Tracking
QA_PERF_RULES
Can define rulesets for Agent Performance Tracking
QA_CALREP
Access to Grader calibration reports
TASKS
User can see their tasks
TASKS_REP
User can access the tab showing Task Statistics
TASKS_VIEWALL
User can see other people’s tasks
TASK_PUSH_TC
User can access to the Training and Coaching page
for sending CBTs and Coaching tasks
USR_SYSLOG
User can view the system’s audit log
KEYUPDATE
User can install a new QueueMetrics activation key
QA_GRADER
Allows access to the Grader’s page and related
statistics
QUEUE_LST
Allows direct access to the call list (skipping the
Reports page)
VISITOR
Grants access to a partial set of statistics and
features such as the Remote Monitoring page.
The VISITORS class holds this key (plus USER
MON_VNC MON_AUDIO).
RT_ADDMEMBER
User can add agents to a queue from the realtime
page
RT_REMOVEMEMBER
User can remove agents from a queue from the
realtime page
RT_PAUSEAGENT
User can pause agents from the realtime page
RT_UNPAUSEAGENT
User can unpause agents from the realtime page
RT_SENDTEXTAGENT
User can send a SMS to the agent’s phone from the
realtime agent (Asterisk 10+ only)
RT_HANGUPCALL
User can hangup a live call from the realtime page
RT_TRANSFERCALL
User can transfer a call to a specific extension from
the realtime page
EDIT_CFG
User can edit the local configuration.properties file
SSAREPORT
Enable Self Service reporting for an Agent
NEWAGENTPAGE
Turns on the new experimental Agent page
SQUERY_ADD
Users can save reports as homepage links
SQUERY_FORALL
User can save public reports
PBXAPI
User can call PBX-level services
257
Appendix C. The [queuemetrics] context
QueueMetrics is able to trigger a number of advanced functionalities, like audio monitoring, clients logging in, going on pause, etc. right
from the Asterisk dialplan.
You can check the current dialplan of a working Asterisk system from the Section 21.26, “Using the DbTest Diagnostic
Tools” page.
In order to make this portable and easy to understand, we suggest to create a special context named queuemetrics in your dialplan where
QueueMetrics will trigger functions through a callfile. An example file that is ready-to-use for most call centres can be found under WEBINF/mysql-utils/extensions-examples - see the included README file for more details.
Whenever an action is invoked by a logged-on user, the following variables are set at the channel level:
• QM_LOGIN is the login of the current Qm user asking for the action to be performed
• QM_CLASS is the current class the requesting user is in.
This makes it possible to perform addirtional security checks or auditing at the Asterisk level, but is not used by the supplied dialplan.
We therefore define a number of functions in the terms of extension relative to the context queuemetrics, as follows:
• 10: Dummy extension
Used only because a call-file requires two end-points in any case. Define as:
exten => 10,1,Answer
exten => 10,2,Wait(10)
exten => 10,3,Hangup
• 11: Remote monitoring
This extension makes unattended monitoring of inbound traffic possible through the command ChanSpy(). The variables
QM_AGENT_CODE, QM_EXT_MONITOR, QM_AGENT_EXT are set, as well as QM_CALLERID, QM_QUEUE and QM_QUEUE_URL.
The following example explains how the feature works:
exten
exten
exten
exten
exten
exten
exten
=>
=>
=>
=>
=>
=>
=>
11,1,Answer
11,2,NoOp( "QM_AGENT_CODE: ${QM_AGENT_CODE}" )
11,3,NoOp( "QM_EXT_MONITOR: ${QM_EXT_MONITOR}" )
11,4,NoOp( "QM_AGENT_EXT: ${QM_AGENT_EXT}" )
11,5,NoOp( "QM_LOGIN: ${QM_LOGIN}" )
11,6,ChanSpy(${QM_AGENT_CODE})
11,7,Hangup
this may have important security implications - see Section 24.8, “Listening to live calls: Unattended Call Monitoring”.
• 12: Call status code
This extension logs a calls status code. The variables CALLSTATUS, CALLID, QM_LOGIN and AGENTCODE are defined. The following
example explains how the feature works:
exten => 12,1,Answer
exten => 12,2,NoOp( "QM: Setting call status '${CALLSTATUS}' \
on call '${CALLID}' for agent '${AGENTCODE}' made by '${QM_LOGIN}'" )
exten => 12,3,System( echo "${EPOCH}|${CALLID}|NONE|Agent/${AGENTCODE} \
|CALLSTATUS|${CALLSTATUS}" >> /var/log/asterisk/queue_log )
exten => 12,4,Hangup
• 14: Remote monitoring of outgoing calls
This extension makes unattended monitoring of outbound traffic possible through the command ChanSpy(). The variables
QM_AGENT_CODE, QM_EXT_MONITOR and QM_AGENT_EXT are set, as well as QM_CALLERID, QM_QUEUE and
QM_QUEUE_URL. The following example explains how the feature works:
; 14:
exten
exten
exten
exten
Remote monitoring of outgoing calls - like SIP/callednumber
=> 14,1,Answer
=> 14,2,NoOp( "QM_AGENT_CODE: ${QM_AGENT_CODE}" )
=> 14,3,NoOp( "QM_EXT_MONITOR: ${QM_EXT_MONITOR}" )
=> 14,4,NoOp( "QM_AGENT_EXT: ${QM_AGENT_EXT}" )
258
The [queuemetrics] context
exten => 14,5,NoOp( "QM_CALLERID: ${QM_CALLERID}" )
exten => 14,6,ChanSpy(SIP/${QM_CALLERID}|q)
exten => 14,7,Hangup
Please note that you should set the channels SIP/xxxx to the names of your local outgoing channel or the name of the local SIP leg of
the call.
this may have important security implications - see Section 24.8, “Listening to live calls: Unattended Call Monitoring”.
• 16 and 17: Add/Remove call feature codes
This extension pair adds or removes a call feature code. The variables FEATCODE, CALLID, AGENTCODE, QM_LOGIN and
FEATTEXT are defined. The following example explains how the feature works:
; extension 16: set call status code
exten => 16,1,Answer
exten => 16,2,NoOp( "QM: Setting call feature '${FEATCODE}' on call '${CALLID}' for age
exten => 16,3,System( echo "${EPOCH}|${CALLID}|NONE|Agent/${AGENTCODE}|INFO|FTR|${FEATC
exten => 16,4,Hangup
; extension 17: unset call status code
exten => 17,1,Answer
exten => 17,2,NoOp( "QM: Removing call feature '${FEATCODE}' on call '${CALLID}' for ag
exten => 17,3,System( echo "${EPOCH}|${CALLID}|NONE|Agent/${AGENTCODE}|INFO|NOFTR|${FEA
exten => 17,4,Hangup
• 20: Agent login
This extension logs in a call-back agent. The variables AGENTCODE and AGENT_EXT are defined. Please note that for this to work
properly, there must be no password set on the Asterisk agent. The following example explains how the feature works:
exten => 20,1,Answer
exten => 20,2,NoOp( "QM: Logging on Agent/${AGENTCODE} to \
extension ${AGENT_EXT}@sip made by '${QM_LOGIN}'" )
exten => 20,3,AgentCallBackLogin(${AGENTCODE}||${AGENT_EXT}@sip)
exten => 20,4,Hangup
• 21: Agent logoff
This extension logs off an agent. The variable AGENTCODE is defined. The following example explains how the feature works:
exten => 21,1,Answer
exten => 21,2,NoOp( "QM: Logging off Agent/${AGENTCODE} \
made by '${QM_LOGIN}'")
exten => 21,3,System(asterisk -rx "agent logoff Agent/${AGENTCODE}")
exten => 21,4,Hangup
• 22: Agent pause (with pause code)
This extension pauses an agent and sets the pause code. The variables AGENTCODE and PAUSEREASON are defined. The following
example explains how the feature works:
exten => 22,1,Answer
exten => 22,2,NoOp( "QM: Pausing Agent/${AGENTCODE} with pause \
reason '${PAUSEREASON}' made by '${QM_LOGIN}'" )
exten => 22,3,PauseQueueMember(|Agent/${AGENTCODE})
exten => 22,4,System( echo "${EPOCH}|${UNIQUEID}|NONE|Agent/${AGENTCODE} \
|PAUSEREASON|${PAUSEREASON}" >> /var/log/asterisk/queue_log )
exten => 22,5,Hangup
• 23: Agent unpause
This extension unpauses an agent. The variable AGENTCODEis defined. The following example explains how the feature works:
exten
exten
exten
exten
=>
=>
=>
=>
23,1,Answer
23,2,NoOp( "QM: Unpausing Agent/${AGENTCODE} made by '${QM_LOGIN}' " )
23,3,UnpauseQueueMember(|Agent/${AGENTCODE})
23,4,Hangup
259
The [queuemetrics] context
• 24 and 25: Agent AddQueueMember
These extensions (targeted to asterisk 1.2 the first, for asterisk 1.4 the second) dynamically add an agent to the specified queue.
The variable AGENTCODE and QUEUENAME is defined. Only for the extension 25, the variables QM_AGENT_PRIOLBL and
QM_AGENT_PRIONUM are set with the information related to agent priority in the queue: QM_AGENT_PRIOLBL could have the values
U, M, W, S, respectively for agents not assigned in the queue, assigned as main, assigned as wrap, assigned as spill in the queue. The
variable QM_AGENT_PRIONUM has the value 0 for agent not assigned in the queue or assigned as main in the queue, 1 for agents
assigned as wrap, 2 for agents assigned as spill in the queue. The following example explains how the feature works:
exten => 24,1,Answer
exten => 24,2,NoOp( "QM: AddQueueMember (v1.2) Agent/${AGENTCODE} \
on queue ${QUEUENAME} made by '${QM_LOGIN}'" )
exten => 24,3,System( echo "${EPOCH}|${UNIQUEID}|${QUEUENAME} \
|Local/${AGENTCODE}@from-internal|ADDMEMBER|" >> /var/log/asterisk/queue_log )
exten => 24,4,Hangup
exten => 25,1,Answer
exten => 25,2,NoOp( "QM: AddQueueMember (v1.4+) Agent/${AGENTCODE} \
on queue ${QUEUENAME} made by '${QM_LOGIN}' \
with prioritylabel '${QM_AGENT_PRIOLBL}' and prioritynum '${QM_AGENT_PRIONUM}'" )
exten => 25,3,AddQueueMember(${QUEUENAME}|Local/${AGENTCODE}@from-internal)
exten => 25,4,Hangup
• 26 and 27: Agent RemoveMember
These extensions (targeted to asterisk 1.2 the first, for asterisk 1.4 the second) dynamically remove an agent to the specified queue. The
variable AGENTCODE and QUEUENAME is defined. The following example explains how the feature works:
exten => 26,1,Answer
exten => 26,2,NoOp( "QM: RemoveQueueMember (v1.2) Agent/${AGENTCODE} \
on queue ${QUEUENAME} made by '${QM_LOGIN}'" )
exten => 26,3,System( echo "${EPOCH}|${UNIQUEID}|${QUEUENAME} \
|Local/${AGENTCODE}@from-internal|REMOVEMEMBER|" \
>> /var/log/asterisk/queue_log )
exten => 26,4,Hangup
exten => 27,1,Answer
exten => 27,2,NoOp( "QM: RemoveQueueMember (v1.4+) Agent/${AGENTCODE} \
on queue ${QUEUENAME} made by '${QM_LOGIN}'" )
exten => 27,3,RemoveQueueMember(${QUEUENAME}|Local/${AGENTCODE}@from-internal)
exten => 27,4,Hangup
• 28: Agent custom dial
This extension lets able the agent to dial extensions through outbound queues from the agent’s live page. The variable AGENTCODE,
EXTTODIAL, and OUTQUEUE is defined. Is possible to force a specific caller ID uncommenting the queue where the Set function is
called and, obviously, changing the caller ID information to your needs. The following example explains how the feature works:
exten => 28,1,Answer
exten => 28,n,NoOp( "QM: Agent Custom Dial. Dialing ${EXTTODIAL} \
on queue ${OUTQUEUE} made by '${QM_LOGIN}'" )
exten => 28,n,Set(QDIALER_QUEUE=${OUTQUEUE})
exten => 28,n,Set(QDIALER_NUMBER=${EXTTODIAL})
exten => 28,n,Set(QDIALER_AGENT=Agent/${AGENTCODE})
exten => 28,n,Set(QDIALER_CHANNEL=SIP/${QDIALER_NUMBER})
exten => 28,n,Set(QueueName=${QDIALER_QUEUE})
exten => 28,n,MixMonitor(Q-${QDIALER_QUEUE}-${UNIQUEID}.WAV|b|)
;exten => 28,n,Set(CALLERID(all)="1234567890" ) ; Uncomment and change this if you nee
exten => 28,n,Goto(qm-queuedial,s,1)
exten => 28,n,Hangup
• 29: Send SMS to agent’s phones
This extension allows the users holding the proper key to send a short message to the agent’s phone from the realtime page. This
feature is supported by Asterisk revision 10 and later versions and is disabled by default. Please note that this feature should be
supported by the agent’s phone.
exten => 29,1,NoOp( "QM: Send Text from Live Page. Sending text to ${EXTTODIAL} made by
exten => 29,n,Set(MESSAGE(body)=From: ${QM_LOGIN} - ${MESSAGEBODY})
260
The [queuemetrics] context
exten => 29,n,MessageSend(sip:${EXTTODIAL})
exten => 29,n,Hangup
• 30: Hangup a live call
This extension allows the users holding the proper key to send an hangup message to the PBX in order to hangup a live call from the
realtime page.
exten => 30,1,NoOp( "QM: Call Hangup made by ${QM_LOGIN} for callID: ${CALLID} with age
exten => 30,n,ChannelRedirect(${CALLID},queuemetrics,10,3)
exten => 30,n,Hangup
• 31: Redirect a live call
This extension allows the users holind the proper key to send a transfer event to the PBX from the realtime page. This forces the live call
to be transferred to a specified extension.
exten => 31,1,NoOp( " QM: Call redirect ,ade by ${QM_LOGIN} for callID: ${CALLID} to ex
exten => 31,n,ChannelRedirect(${CALLID},from-internal,${REDIR_EXT},1)
exten => 31,n,Hangup
When using AddQueueMember/RemoveQueueMember to dynamically login/out to a queue is mandatory to match the
agent code with their extension; eg. Agent/303 must be sitting at extension 303.
When using AddQueueMember/RemoveQueueMember to dynamically login/out to a queue the agent pause/unpause
dialplan given must be changed to fit the current agent channels; eg. if Agent/303 is added to the queue
In order to trigger these functions, QueueMetrics need to be able to access the Asterisk callfile spool, as defined by the callfile.dir property..
If your Asterisk system is remote, you’ll have to arrange a periodic file transfer or use a disk share in order to make the above features
work.
As an alternative, QueueMetrics may connect to a working Asterisk server over the Manager interface. See the description of the callfile.dir
property for more information.
261
Appendix D. System preferences
QM stores system-wide preferences in a text file called configuration.properties under WEB-INF. The absolute path of that file can be found
by looking at the directory called System path on the Licence page in QM.
All properties are case-sensitive.
You can check the current set of system preferences from the Section 21.26, “Using the DbTest Diagnostic Tools” page.
Defaults
Property name
Description
default.queue
Internal ID (ex. 7, 49….) of the default queue, leave
blank for no default queue.
default.queue_log_file
Default queue log file.
default.monitored_calls
The top level directory where monitored calls are
held. All its subdirectories are explored recursively.
Do NOT forget to add an ending slash.
default.webloaderpbx
Enable or disable the web qloader feedback actions
generation. Please refer to the WQLoader USER
MANUAL for further information.
default.areacode_digits
How many digits to consider as a default area code
default.start_hour
Preset start and end hours and number of days for
the custom report.
default.end_hour
default.days
liveclock.enable
If live clock is enabled, the system clock is
synchronized with Asterisk server system clock.
default.max_realtime_age
How old a call can be included in real-time report
default.showQueueComposition
If true, show the details of the queues composing the
aggregate queue; if flase, show only the aggregate
queue’s name
default.useXmlExcel
True: Generate the Excel file as an XML file
(mandatory for UTF charsets); false: generate as an
ISO-8859 CSV file
default.hourly_slot
How long in minutes is an hourly slot for hourly
breakdown. Default 60 minutes (1hr). If set to e.g. 15,
calls will be broken down by 15 minute intervals.
default.useRawAgentSessions
If true, show all agent sessions. If false, show only
agent sessions with at least one call handled.
Defaults to false.
default.closeDuration
The default duration of a call that is manually closed.
This is the wait time for calls that have not been
answered and the talk time for calls that have been
answered.
default.crmapp
If present and not empty it will enable the CRM
integration column on the answered/unanswered
call details tables. The key could be populated with
an URL where some tokens will be expanded by
the QM engine. Valid tokens are [A] (expanded
with agent code); [U] (expanded with the asterisk
unique ID associated to the call); [S] (expanded with
server name); [Q] (expanded with queue code); [T]
(expanded with call timestamp); [C] (expanded with
Caller ID); [D] (expanded with DNIS); [I] (expanded
with IVR path); [O] (expanded with outcome code); [P]
(expanded with call position in queue); [M] (expanded
with attempts). One example could be: http://server/
app?agent=[A]&unique=[U]
default.crmlabel
If present, used by the Realtime agent page to identify
the CRM page on the dropdown menu
262
System preferences
Property name
Description
default.websocketurl
The websocket URL used by the Realtime Agent
page softphone. It shold be in the followin form: ws://
IPServer:Port/path
default.sipaddress
The SIP server name or IP, used by the Realtime
Agent page softphone.
default.rtcWebBreaker
rtcWebBreaker flag used by the Realtime Agent page
softphone. The RTCWeb Breaker is used to enable
audio and video transcoding when the endpoints do
not support the same codecs or the remote server
is not RTCWeb-compliant. Valid values are "true" or
"false". If not present, the default value is "true".
default.showAstClid
If present and set to true it will enable the asterisk
unique ID column on the answered/unanswered call
details tables.
default.showSecondsOnTotalCalls
If present and set to true, the summary report call
time figures will be shown in hhmmss format instead
of hours format
default.disablebackhistory
If set to true, disable the history back navigation
button in browsers
default.secondsServiceLevel
The default SLA that Traffic Distribution graphs will
use (see DD08). Default: 20 seconds
default.shortCallsLimit
The default Short Call limit that Traffic Distribution
graphs will use (see DD08). Default: 5 seconds
default.jobmanifest_language
The language used when generating a manifest file
for exported jobs. Tipically it affects the ID3 tags
stored in mp3 recorded call files (since QM1.6.2)
default.pausecoderequired
If true, agents are required to provide a valid pause
reason when entering a pause from the agent page.
Default value is false
default.noncontig.days
Which days to include in Custom Reports noncontiguous time - (1: Sun 2:Mon) e.g. 23456 means
MON to FRI
default.noncontig.period1.start
Start and end times (as HH:MM:SS or HH:MM) for
non-contiguous time reports
default.noncontig.period1.end
See above
default.noncontig.period2.start
See above
default.noncontig.period2.end
See above
default.decimalDigits
Number of digits to display for floating-point numbers
- defaults to 1
default.tasks.pingURL
If present and enabled, this property allows to specify
a URL that is to be queried by the QueueMetrics
server every time a task is completed/disputed by a
person. All task information is sent to this URL. One
example could be: http://server/index.html
default.searchQA_byCallDate
Defines if the QA reports should be calculated by call
date or by filling form date
default.timeZoneOffset
Defines The default time zone offset. Valid values are
between -24 and 24 hours (default = 0)
default.ssarMaxReportPeriod
Defines the maximum reporting period for a Self
Service agent report. Default set to 15 days
default.export.orientation
Default page orientation for PDF whole report export
buttons (value: portrait or landscape)
default.displayHomePageNews
Enable/Disable the QueueMetrics news block present
on the home page
default.disable_directlogin_to_agentpage
If set to true, users holding AGENT and
NEWAGENTPAGE keys are not directed to the Icon
page when logging on QueueMetrics (since QM
14.10.5)
default.wombat.agent_recall_enabled
Enable/Disable the access to the Recall Scheduler
panel in the Icon agent page. (since QM 15.02.4)
263
System preferences
SMTP settings
All the settings for your SMTP host. Used by QueueMetrics to send reports by e-mail.
Property name
Description
default.smtphost
SMTP server host name or IP address
default.smtpport
SMTP server host port
default.smtpfrom
Sender E-mail address used by QueueMetrics
default.smtpuser
Optional username needed to authenticate to the
SMTP host
default.smtpassword
Optional password needed to authenticate to the
SMTP host
default.smtpssl
Use SSL when sending mail (value: true or false)
default.smtpDebug
SMTP transaction are reported on catalina.out (value:
true or false)
Call SLA
It is possible to have a different definition for the inital part of the SLA, having e.g. SLA computed every 5 seconds up to 30 seconds and
every 10 seconds up to 60.
Property name
Description
sla.max_initial_delay
The max initial delay and interval that will be shown in
the SLA graphs
sla.initial_interval
sla.max_monitored_delay
The max delay and interval that will be shown in the
SLA graph graphs
sla.interval
Parser
The following properties control how QueueMetrics interprets data read from Asterisk. Depending on the version of Asterisk you are using,
they may have to be set differently from the system defaults in order to get a correct picture of what is going on.
Property name
Description
default.permanentCallbackAgents
If call-back agents should be considered still logged
on after a system reload; the current version of
Asterisk will do this automatically. Default: true
default.considerIncompletetEntities
If incomplete entities (calls or agent sessions that are
in progress at the moment that are in progress at the
moment the analysis is being run) should be counted
in the reports or not. Default: true
default.rewriteLocalChannels
Rewrites queue_log entries in the form Local/
xxx@context to Agent/xxx . Default: false.
default.rewriteLocalWithQueue
If true, extension Local/123@ext on queue Q1 is read
as Agent/Q1-123 . Default false.
default.joinMultiStintCalls
If true, multi-stint calls in the current analysis set are
joined by default
default.useEndingChannelName
If true, the last reference to an agent is used as its
name (in case they are different)
default.stripChannelNames
If true, anything after the "-" sign is deleted (ie.
SIP/203-abcd is read as SIP/203). If false, the agent
channel name is loaded as in the queue_log file.
Default: true.
default.ignoreQueueStarts
If false, agents are logged on and calls closed on
QUEUESTART records. Otherwise they will be
ignored. Default false.
default.alwaysLogonUnpaused
If set to true, when an agent logs on, he will always be
unpaused. Default false.
default.ignoreRingNoAnswer
If true, the analyzer will ignore the RINGNOANSWER
verbs in the queue log in favour of AGENTATTEMPT
verbs.
default.subqueueModeEnabled
If set to true, all activities on subqueues are reported
in the parent queue
264
System preferences
Property name
Description
default.exitOnAgentDumpSysCompat
If true, AGENTDUMP and SYSCOMPAT verbs
considered call closure records. If false, they are
counted as failed attempts.
default.maxOngoingWaitTime
If set > 0, calls having more than the number of
seconds of wait time are skipped. Defaults to 0 (all
calls counted).
default.maxOngoingTalkTime
If set > 0, calls having more than the number of
seconds of talk time are skipped. Defaults to 0 (all
calls counted).
System administration
The following parameters affect how QueueMetrics interacts with the host system it is running on.
Property name
Description
script.reboot
The command to restart Tomcat. Must be set if this is
wanted.
Layout
Property name
Description
layout.logo
Your company logo (full or relative path) - shall
be resized to be an image 200 x 72. The variable
$WEBAPP refers to the local webapp, as an
alternative use the full http://.. URL.
layout.splash
HTML string displayed on the login page.
default.noLicenseWarning
Set to true to disable license expiration notifications
on the Home Page.
default.language
The default language. Must be one of the installed
language packs. Default: en
default.country
The default country for the Locale. Must be one of the
installed language packs. Default: US
default.viewTechInfo
Is it possible to see Tech Info on the licence page and
run DBTest?
url.qm
The URL of the webapp QM is running under, if not
detected correctly.
url.rss
The URL of the webapp QM is running under - used
for RSS access. Like http://1.2.3.4:8080/qm
default.displayHomePageNews
Whether the news block on the home page should
appear or not
Database Access
The following properties define the fields used by the table in MySQL storage. See Chapter 20, Monitoring clusters with QueueMetrics for
complete information.
Property name
Description
sqlPreset.i.table
Sets the table name for preset i
sqlPreset.i.f_time_id
The time columns.
sqlPreset.i.use_timestamp
True: time is a Unix timestamp; False: time is an SQL
date-time
sqlPreset.i.f_call_id
sqlPreset.i.f_queue
sqlPreset.i.f_agent
sqlPreset.i.f_verb
sqlPreset.i.f_partition
May be left blank for partition-less schemas
sqlPreset.i.f_data1
sqlPreset.i.f_data2
sqlPreset.i.f_data3
sqlPreset.i.f_data4
265
System preferences
Property name
Description
sqlPreset.i.f_data5
sqlPreset.i.f_incr
The order-preserving index column. May be left blank,
but this may lead to incorrect results.
Realtime Page
Property name
Description
realtime.calls_invisible
Is the calls panel in the realtime page invisible by
default? 0 false, 1 true
realtime.agents_invisible
Is the agents panel in the realtime page invisible by
default? 0 false, 1 true
realtime.aggr_by_queue_invisible
Is the aggregated by queue panel in the realtime page
invisible by default? 0 false, 1 true
realtime.aggr_by_tag_invisible
Is the aggregated by tag panel in the realtime page
invisible by default? 0 false, 1 true
realtime.agent_and_outcome_invisible
Is the aggregated by agent and outcome panel in the
realtime page invisible by default? 0 false, 1 true
realtime.members_only
Are not the only agents to be shown on the realtime
page those who are "known" for the queue? 0 false, 1
true
realtime.refresh_time
In how many seconds is the realtime page to refresh?
realtime.use_sql_now
0: analyze all available data; 1: analyze all data which
timestamp is lower than the current NOW() function.
Do not change.
realtime.startHour
The starting hour of the day, in order to compute
realtime report. It can be either a fixed hour (e.g. 3:
from 3:00 AM) or a sliding window if prefixes with S
(e.g. s3: the last three hours). Default value is 0 (from
midnight). A useful value is also -24 (yesterday’s
midnight).
realtime.all_subqueues
Enable default showing of all subqueues if set to 1
realtime.waitAlarmOnLiveCalls
Decide whether to check for alarms on the wait time
of ongoing conversations.
realtime.hideExportButtons
If true, hide export buttons on the Real-time page.
Defaults to false.
realtime.absolutePauseTimes
If true, the start of the current pause is shown as an
absolute hour; if false, it is shown as the time passed
since.
realtime.calls_invisible.buttonEnabled
Decide which buttons o the real-time page can be
toggled by the user. Buttons not enabled are set to
their default value.
realtime.agents_invisible.buttonEnabled
realtime.members_only.buttonEnabled
realtime.all_subqueues.buttonEnabled
realtime.aggr_by_queue_invisible.buttonEnabled
realtime.aggr_by_tag_invisible.buttonEnabled
realtime.agent_and_outcome_invisible.buttonEnabled
realtime.assignedLocationsOnly
If true, the user will not be able to monitor without
a given location. See page Section 7.7, “Using
Locations” for more details.
realtime.useRowCache
Cache result objects for the Real-time and Agents
page when using SQL or cluster storage. Set to true
to enable. Defaults to false.
realtime.show_incorrect_queue_sets
If true, queues the agent is working on and he’s a
member of are displayed in black; queues the agent is
working on but he’s not a member of are displayed in
brown; any queues the agent is a known member of
but he’s not currently logged on to are displayed as a
tooltip to the gray "Down Arrow" symbol. Default false.
266
System preferences
Property name
Description
realtime.preventLoggedAgentInfoChanges
If true, or missing, the agent cannot change their code
and extension if logged on at least one queue
Agent’s Realtime Page
Property name
Description
realtime.max_bytes_agent
When the real-time page for an agent is computed,
the queue_log is NOT read in its entirety but only the
last n bytes. In database storage mode, the number of
seconds, starting from now and counting backwards,
that will be queried for agent events.
realtime.agent_autoopenurl
When the real-time page for an agent shows a new
call in the call list, and if the call detail contains an
URL, this URL will be open in a new browser window.
realtime.agent_button_X.enabled
Enable or disable a custom button in the realtime
page. X shall be an integer between 1 and 4.
realtime.agent_button_X.caption
This is the label associated to a button.
realtime.agent_button_X.url
Defines the URL that will be opened when the button
is pressed. The tokens [A] and [U] are expanded
by QueueMetrics with, respectively, the Agent’s ID
and the most recent call Asterisk Call Unique ID
as displayed in the call list. If no calls are present,
Unspecified will be used instead.
realtime.agent_button_X.channel
Defines the first leg to be used in a dial command
issued to the Asterisk server when the agent presses
the button. E.g. Local/\104@from-internal .
realtime.agent_button_X.ext
Defines the second leg to be used in a dial command
issued to the Asterisk server when the agent presses
the button. E.g. 200@ext-queue .
realtime.agent.show_agaw
Enable or disable the AGAW subset information table
present in the agent’s realtime page.
realtime.dynamicLoginQueues
In the standard Agent Realtime page defines what
queues should be listed in the dropdown when agents
log-in/out throug the Add Member/Remove Member
button. The key should be filled with three optional
values as reported below: all: The dropdown will
show the "All assigned" option followed by the queues
assigned to the agent (in QueueMetrics queues
configuration) and queues where the agent was not
assigned but it’s free to log in dynamically registered:
The dropdown will show the "All assigned" option
followed by the queues assigned to the agent (in
QueueMetrics queues configuration) assigned: The
dropdown will show only the "All assigned" option.
In this situation the Add Member/Remove Member
buttons behave like the "old" Log on and Log off
pushbuttons. In the the new Icon panel based Agent
Realtime page, the meaning of these settings is
slightly different because the login panel is different:
all: The login panel shows all the queues visible by
the agent in the available queue list and the agent is
able to login on any of the queue registered: The login
panel shows only the queues assigned to the agent
and the agent could login/out on a single queue or on
all queues assigned: The login panel shows only the
queues assigned to the agent and the agent could
login/out only on all queues only (in this situation the
login panel behave like the "old" Log on and Log off
pushbuttons)
realtime.agentRegexp
Sets allowed agent codes (e.g. set as "2\\d\\d" to
allow agents like "2XX" but not "3XX" or "2X")
realtime.extensionRegexp
Sets allowed extension codes. Any other code will be
rejected. (e.g. set as "3\\d\\d" to allow extensions like
"3XX")
default.lockedAgentPopupCode
If true, the agent cannot change their code in the
login/logoff/pause pop-ups. Defaults to false.
267
System preferences
Property name
Description
realtime.useActivePolling
Whether to have the client poll the server "behind the
scenes" and reload the page when a call is detected.
See Section 8.4, “Auto-refreshing the agent’s page:
Active Polling”
realtime.ajaxPollingDelay
The interval between each successive client poll. The
expected delay for calls is one half of this value.
realtime.all_includes_current_logins
If true, when logging off from ALL queues, any queue
the agent is currently logged on will be disconnected.
Default false.
realtime.agent_background_url
Default background web page for the realtime agent
page. Normally used if no CRM and other background
are used. If empty, the standard QueueMetrics
background applies.
realtime.agent_web1_url
An URL used as first backgound in the Realtime
Agent page. The key could be populated with an
URL where some tokens will be expanded by the QM
engine. Valid tokens are [A] (expanded with agent
code). See also default.crmapp and default.crmlabel.
realtime.agent_web1_label
If present, used by the Realtime Agent page to
identify this specific background on the dropdown
menu
realtime.agent_web2_url
An URL used as second backgound in the Realtime
Agent page. The key could be populated with an
URL where some tokens will be expanded by the QM
engine. Valid tokens are [A] (expanded with agent
code). See also default.crmapp and default.crmlabel.
realtime.agent_web2_label
If present, used by the Realtime Agent page to
identify this specific background on the dropdown
menu
realtime.agent_webpanel1_url
An URL to be presented into the custom web panel in
the Realtime Agent page. This URL does not support
token expansion.
realtime.agent_webpanel1_label
If present, used by the Realtime Agent page to enable
and identify the custom web panel on the dropdown
menu
realtime.assertExtensionNotInUse
Before logging an agent in (in hotdesking mode)
makes sure the extension is not in use. This option
runs an analysis behind the scenes, so use it
sparingly as will increase server load.
realtime.agentPausedOnLogin
When an agent logs in, if she is currently not
working on any queues, pause them with the
"autopauseCodeLogin" code. If the agent is currently
working on some queues and paused, and adds new
queues to their set, a pause is forced to make sure
the Asterisk state is consistent on all queues. This
option runs an analysis behind the scenes, so use it
sparingly as will increase server load.
realtime.autopauseCodeLogin
The pause code to use for autopauses on login
Asterisk Interaction
Property name
Description
callfile.dir
The call-file directory Asterisk uses to generate calls
based on .call files. Must be writable by the Java
process. Default _/var/spool/asterisk/outgoing As an
alternative, you may enter a Manager interface URI
here, in the format _tcp:user:password@server If
you do, QM will not generate call-files but will use the
manger interface to generate calls. The same field
is used by the asterisk configuration wizard when
"Single Machine AMI" was selected as source.
callfile.monitoring.enabled
If unattended audio monitoring is enabled on this
system. Default true.
callfile.monitoring.channel
The channel, and extension@context
[mailto:extension@context] that will be called
268
System preferences
Property name
Description
to implement the unattended audio monitoring
functionality. Do not forget the trailing /n in the
channel. A number of variables act as placeholders
to be substituted by the actual data Asterisk is using:
$AG: the current agent; $AE: the agent’s extension;
$EM: the monitoring extension; See Section 24.8,
“Listening to live calls: Unattended Call Monitoring” for
further information.
callfile.monitoring.extension
callfile.monitoring.context
callfile.agentpause.enabled
This function is used to start a pause from the Agent’s
page and to set its Pause Code - see the sample dial
plan provided.
callfile.agentpause.channel
callfile.agentpause.extension
callfile.agentpause.context
callfile.agentunpause.enabled
This function is used to end a pause from the Agent’s
page - see the sample dial plan provided.
callfile.agentunpause.channel
callfile.agentunpause.extension
callfile.agentunpause.context
callfile.agentlogin.enabled
This function is used to log in an agent from the
Agent’s page - see the sample dial plan provided.
callfile.agentlogin.channel
callfile.agentlogin.extension
callfile.agentlogin.context
callfile.agentlogoff.enabled
This function is used to log off an agent from the
Agent’s page - see the sample dial plan provided.
callfile.agentlogoff.channel
callfile.agentlogoff.extension
callfile.agentlogoff.context
callfile.calloutcome.enabled
This function is used to set the call outcome code
from the Agent’s page - see the sample dial plan
provided.
callfile.calloutcome.channel
callfile.calloutcome.extension
callfile.calloutcome.context
callfile.addfeature.enabled
This function, together with
callfile.removefeature.enabled, is used to add a call
feature from the Agent’s page - see the sample dial
plan provided.
callfile.addfeature.channel
callfile.addfeature.extension
callfile.addfeature.extension
callfile.removefeature.enabled
This function, together with
callfile.addfeature.enabled, is used to remove a call
feature from the Agent’s page - see the sample dial
plan provided.
callfile.removefeature.channel
callfile.removefeature.extension
callfile.removefeature.context
callfile.agentdial.enabled
This function is not implemented yet.
callfile.agentdial.channel
This function is not implemented yet.
callfile.agentdial.extension
269
System preferences
Property name
Description
callfile.agentdial.context
callfile.outmonitoring.enabled
This function lets you monitor outgoing calls using
a different piece of dial-plan, as outgoing channel
names might be different from incoming ones.
callfile.outmonitoring.channel
callfile.outmonitoring.extension
callfile.outmonitoring.context
callfile.agentaddmember.enabled
This function is used to dynamically add an agent
to a specific queue from the Agent’s page - see the
sample dial plan provided.
callfile.agentaddmember.channel
callfile.agentaddmember.extension
callfile.agentaddmember.context
callfile.agentremovemember.enabled
This function is used to dynamically remove an agent
from a specific queue from the Agent’s page - see the
sample dial plan provided.
callfile.agentremovemember.channel
callfile.agentremovemember.extension
callfile.agentremovemember.context
callfile.customdial.enabled
This function lets able an agent to dial through one
outbound specific queue - see the sample dial plan
provided.
callfile.customdial.channel
callfile.customdial.extension
callfile.customdial.context
WombatDialer integration (since QM 15.02.4)
Property name
Description
wombat.url
URL where the Wombat Dialer can be reached
wombat.username
Username needed to access to some WombatDialer
services
wombat.password
Password for accessing some WombatDialer services
default.wombat.agent_recall_enabled
Enable/Disable the access to the Recall Scheduler
panel in the Icon agent page.
Real-Time Sounds
Property name
Description
sound.yellowAlarm
Sound to be played if a yellow alarm is triggered. Can
be either an absolute URL or a relative path
sound.redAlarm
Sound to be played if a red alarm is triggered. Can be
either an absolute URL or a relative path
Cluster configuration
Property name
Description
cluster.servers
A set of servers, which names must be used for
subsequent properties
cluster.servername.manager
The manager API for this server, in the format
tcp:user:pass@server. This field is also used by the
asterisk autoconfiguration wizard when "Cluster AMI"
source was selected.
cluster.servername.queuelog
The queue log partition to use, in the format sql:P001
cluster.servername.monitored_calls
The directory where monitored calls for this server
can be found. If it starts with "http", an XML-RPC
server to query this information
270
System preferences
Property name
Description
cluster.servername.callfilesdir
The directory in which callfiles must be generated for
this sever. Usually leave blank.
cluster.servername.audioRpcServer
The URL of an XML-RPC server to be used for audio
monitoring
cluster.servername.agentSecurityKey
The key with which this cluster entry must be
protected on the Agent’s page
cluster.servername.websocketurl
The websocket URL used by the Realtime Agent
page softphone for the selected server. It shold be in
the followin form: ws://IPServer:Port/path
cluster.servername.sipaddress
The SIP server name or IP, used by the Realtime
Agent page softphone for the selected server
cluster.servername.rtcWebBreaker
rtcWebBreaker flag used by the Realtime Agent
page softphone for the selected server. The
RTCWeb Breaker is used to enable audio and video
transcoding when the endpoints do not support the
same codecs or the remote server is not RTCWebcompliant. Valid values are "true" or "false". If not
present, the default value is "true".
Audio Monitoring
Property name
Description
audio.server
The PM to use for listening to recorded calls.
audio.liveserver
The PM to use for listening to live calls.
default.audioRpcServer
The URL of an external XML-RPC server for both
listening of recorded calls and live call monitoring.
audio.lookBack
How many hours to check for midnight crossing. Used
by the LocalFilesByDay PM.
audio.decrypt
The streaming decryption filter for encrypted
recordings.
audio.html5player
Plays audio in the browser using an HTML5 audio
player. Defaults to false.
Misc
Property name
Description
manager.dump
By setting this property to true, the dialog between
Asterisk and QM used to show the Live! Page is
dumped to the Catalina.out log file. This makes it
possible to send it over to Loway for debugging
purpouses.
default.skip_task_on_qagrading
If not present or set to false, a new task will be sent
to the graded agent each time a new qa form will be
completed. If present and set to true, no tasks will be
sent.
export.conversionCommand
If present, this specify the batch script (full) name to
be called by the MP3 HTTP Transfer implementor for
export tasks.
AGAW configuration
Property name
Description
dbmaint.agaw_oldestRun
Oldest obsolete run to keep when running a database
optimization, in minutes
dbmaint.agaw_oldestLog
Oldest obsolete log to keep when running an
optimization, in minutes
dbmaint.agaw_oldestBroadcast
Oldest obsolete broadcast entries to keep when
running an optimization, in minutes
Autoconfiguration Wizard
Property name
Description
default.autoconf.source
Defines the default source that will be selected in
the dropdown list on the wizard configuration page.
271
System preferences
Property name
Description
It could assume the following values: file for File
sources; ami for Single Machine AMI; amic for
Clustered Machines AMI; rtdb for Asterisk Realtime
Database; quef for Asterisk Queue Log file
default.autoconf.fileagents
Defines the default agents file definition will be shown
in the configuration wizard page and will be read by
the configuration wizard unattended mode
default.autoconf.filequeues
Defines the default queues file definition will be shown
in the configuration wizard page and will be read by
the configuration wizard unattended mode
default.autoconf.fileusers
Defines the default users file definition will be shown
in the configuration wizard page and will be read by
the configuration wizard unattended mode
default.autoconf.filequeuelog
Defines the default queue log file will be shown in
the configuration wizard page and will be read by the
configuration wizard unattended mode
default.autoconf.realtimedrv
Defines the database technology used by asterisk
to read/write the realtime database (as Java
Driver package) For MySQL the default value is
com.mysql.jdbc.Driver
default.autoconf.realtimeuri
Defines the realtime database location and
authentication parameters in jdbc format.
Obsolete parameters
Property name
Description
default.showLostCallsWhenFiltering
If true, lost calls are shown when running a report in
filter mode. This is usually false, as all lost calls would
be shown even if you run a report for a single agent.
Removed in version 1.5.1
272
Appendix E. Icons used by QueueMetrics
The following icons are used in QueueMetrics:
Icon
Meaning
Listen to this call
VNC monitoring of this agent
Close this ongoing call
This agent is associated to the queues stored in
Asterisk’s internal database
Show multiple stints for this call
Show call detail
Inbound call
Outbound call
Edit
Delete
Edit the set of agents that work on this queue
Export to Excel
Export to CSV
Export to XML
Print this page in printer-friendly mode
Log-off this user
See information on the current user
Yes, this feature is enabled
No, this feature is disabled
Reload the user’s query configuration as when he
logged in
Edit / Show a Quality Assessment record
Send broadcast message to all agents
Send broadcast message to all agents belonging to
this supervisor
Accepts relative percentages (e.g. 10%)
URL associated to a call
273
Appendix F. Audit log records
The following details are logged for all events:
• Date and time of the event
• User-id that is requesting/causing the event; if this is not applicable, a 0 may be logged instead.
• Container session ID - useful for tracking multiple activities done on the same user session and for further cross-matching with system
logs.
• An action and zero or more parameters, as detailed below.
The audit table should be secured as needed by the system administrator by revoking the DELETE grants from it by the QueueMetrics
database users.
F.1. Action class: User lifecycle (10XX)
F.1.1. Action: user logon - successful
• Action-id: 1001
• Text1: The full login, as a string, of the user logging on
• Text2: The IP address (dotted quad) of the user’s workstation
F.1.2. Action: user logoff
• Action-id: 1002
• Text1: The full login, as a string, of the user logging off
• Text2: The IP address (dotted quad) of the user’s workstation
This event tracks only manual logoffs. Other causes of disconnection (e.g.. the user closes his browser, session timeouts,
etc) are not tracked. Therefore you cannot count on having a logoff event for each logon event.
F.1.3. Action: user logon - unsuccessful
• Action-id: 1003
• Text1: The full login, as a string, of the user that tried to log on
• Text2: The IP address (dotted quad) of the user’s workstation
• Text3: The error message displayed
F.1.4. Action: password change
• Action-id: 1004
• Text1: The full login, as a string, of the user logging on
• Text2: The IP address (dotted quad) of the user’s workstation
F.2. Action class: Key management (11XX)
F.2.1. Action: key changed
• Action-id: 1101
• Text1: The full login, as a string, of the user logging on
• Text2: The IP address (dotted quad) of the user’s workstation
• Text3: The new key that was installed
F.2.2. Action: key accessed via XML-RPC
• Action-id: 1102
274
Audit log records
• Text1: The full login, as a string, of the user logging on
• Text2: The IP address (dotted quad) of the user’s workstation
• Text3: The key that was passed (it may be blank if it was just a query)
F.2.3. Action: AGAW key changed
• Action-id: 1103
• Text1: The full login, as a string, of the user logged on
• Text2: The IP address (dotted quad) of the user’s workstation
• Text3: The new key that was installed
F.2.4. Action: AGAW key accessed via XML-RPC
• Action-id: 1104
• Text1: The full login, as a string, of the user logging on
• Text2: The IP address (dotted quad) of the user’s workstation
• Text3: The key that was passed (it may be blank if it was just a query)
F.2.5. Action: AGAW restarted
This action is logged only when the AGAW runner is restarted from the web GUI.
• Action-id: 1105
• Text1: The full login, as a string, of the user logging on
• Text2: The IP address (dotted quad) of the user’s workstation
F.3. Action class: QueueLog editing (20XX)
F.3.1. Action: QueueLog edited
• Action-id: 2001
• Text1: The full login, as a string, of the user logging on
• Text2: The IP address (dotted quad) of the user’s workstation
• Text3: The new statement
• Text4: The SQL rollback statement.
This event is triggered by a change to the queue_log made by the Payroll module. A rollback SQL statement is supplied in case it is
needed to revert the changes.
F.4. Action class: QA editing (21XX)
F.4.1. Action: QA form deleted
• Action-id: 2101
• Text1: The full login, as a string, of the user logging on
• Text2: The IP address (dotted quad) of the user’s workstation
• Text3: The rollback SQL statement
F.4.2. Action: Deletion of a comment
• Action-id: 2102
• Text1: The full login, as a string, of the user logging on
• Text2: The IP address (dotted quad) of the user’s workstation
• Text3: Which comment was deleted
275
Audit log records
F.4.3. Action: Deletion of all comments
• Action-id: 2103
• Text1: The full login, as a string, of the user logging on
• Text2: The IP address (dotted quad) of the user’s workstation
• Text3: Which call was involved
F.5. Action class: Realtime agent management (23XX)
F.5.1. Action: Realtime Agent Logon
• Action-id: 2301
• Text1: The full login, as a string, of the user logging on
• Text2: The IP address (dotted quad) of the user’s workstation
• Text3: AgentCode: XXX AgentExtension: XXX
F.5.2. Action: Realtime Agent Logoff
• Action-id: 2302
• Text1: The full login, as a string, of the user logging on
• Text2: The IP address (dotted quad) of the user’s workstation
• Text3: AgentCode: XXX AgentExtension: XXX
F.5.3. Action: Realtime Agent Pause
• Action-id: 2303
• Text1: The full login, as a string, of the user logging on
• Text2: The IP address (dotted quad) of the user’s workstation
• Text3: AgentCode: XXX AgentExtension: XXX
F.5.4. Action: Realtime Agent Unpause
• Action-id: 2304
• Text1: The full login, as a string, of the user logging on
• Text2: The IP address (dotted quad) of the user’s workstation
• Text3: AgentCode: XXX AgentExtension: XXX
F.5.5. Action: Realtime Agent SMS
• Action-id: 2305
• Text1: The full login, as a string, of the user logging on
• Text2: The IP address (dotted quad) of the user’s workstation
• Text3: AgentCode: XXX AgentExtension: XXX
F.6. Action class: Realtime call management (24XX)
F.6.1. Action: Call soft hangup
• Action-id: 2401
• Text1: The full login, as a string, of the user logging on
• Text2: The IP address (dotted quad) of the user’s workstation
• Text3: AgentCode: XXX AgentExtension: XXX UniqueID: XXXXXXXXXX
276
Audit log records
F.6.2. Action: Call transfer
• Action-id: 2402
• Text1: The full login, as a string, of the user logging on
• Text2: The IP address (dotted quad) of the user’s workstation
• Text3: AgentCode: XXX AgentExtension: XXX UniqueID: XXXXXXXXXX
F.6.3. Action: Call closure
• Action-id: 2403
• Text1: The full login, as a string, of the user logging on
• Text2: The IP address (dotted quad) of the user’s workstation
• Text3: UniqueID: XXXXXXXXXX
277
Appendix G. Glossary
AGAW: The Agent Awareness subsystem of QueueMetrics.
ARA: The Asterisk Realtime Architecture.
Agent: a person working at the monitored call center and answering to calls. Asterisk offers a way for agents not to be bound by physical
telephone terminals but to log on to tell the system they are available.
Aggregate queue: see → Composite queue.
Atomic queue: a queue that matches one-to-one to an underlying Asterisk queue.
Call analyst: a person whose job is to grade agent’s calls through the QA system. This may be a specific job or an agent.
Call-back agent: an agent that will not stay on-line, but which telephone will be rung by Asterisk when a call comes in for him.
Caller: a person calling the Asterisk system
Call-file: a function in Asterisk, where by writing a specially-crafted file, it is possible to interact with the dial-plan. With a modern version of
Asterisk, it is generally better to use the Manager interface.
Campaign: a set of outbound calls placed for a given purpouse.
Composite queue: A virtual queue made of more than one atomic queue. Useful for reporting all center activity at once.
DNIS (Dialed Number Identification Service) is a service that tracks which telephone number was dialed by a customer (e.g in case of
multiple incoming numbers).
Engagement code: an acronym that represents a grading items for the QA forms.
Grader: see → Call Analyst.
Invisible queue: a queue that is defined in QueueMetrics but cannot be chosen from the front page. Useful for queue → wildcard
matching.
IVR (Interactive voice response) is a dialog system that allows Asterisk to detect keypad inputs and address the caller to the correct
queue or department.
Jabber: see → XMPP.
Manager interface: a TCP/IP Asterisk interface, where a process with the right credentials can connect to a remote Asterisk server over
the network and control or query its behaviour. Must be enabled manually by the Asterisk administrator.
Monitoring: in Asterisk terminology, the act of recording to disk.
Outbound queue: see → Campaign.
Queue: the call distribution object that let Asterisk keep callers waiting and distributes them in the correct order to available agents. Each
caller is processed on a first-come-first-server basis.
Subqueue: an artifact of QueueMetrics qloaderd that lets you see different calls processed by the same physical Asterisk queue "as
if" they were processed on multiple subqueues. Often used e.g. to tag calls to clients or products without creating hundreds of physical
queues in Asterisk.
VNC: a technology that can display the screen of another computer on your own screen through a TCP/IP connection. A number of free
and commercial VNC implementations exist.
Wildcard matching: a technique to group together all queues that have a name sharing similar characteristics. See Section 21.3.2, “Using
wildcards in queue names” for details.
XMPP (eXtensible Messaging and Presence Protocol): An open instant messaging protocol. Used for off-band communication in the
AGAW subsystem.
278