1
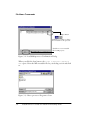
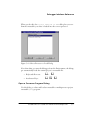
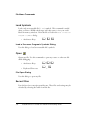
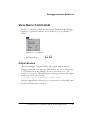
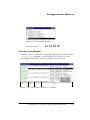
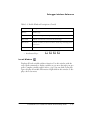
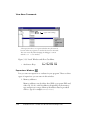
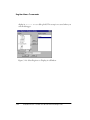
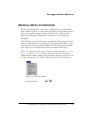
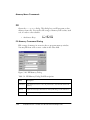
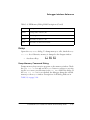
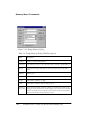
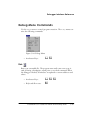
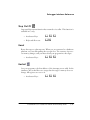
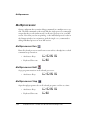
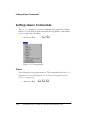
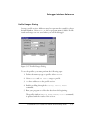
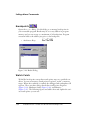
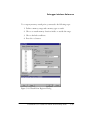
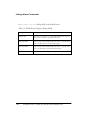
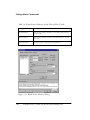
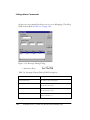
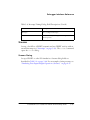
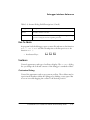
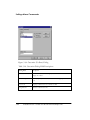
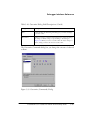
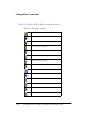
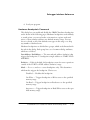
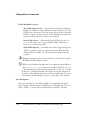
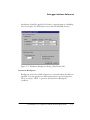
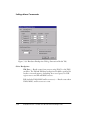
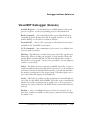
5 DEBUGGER INTERFACE
REFERENCE
Figure 5-0.
Table 5-0.
Listing 5-0.
Overview
The VisualDSP Debugger provides a simulation and test environment for
the programs that you develop using the VisualDSP Environment. After
you build an executable program for your project, you use the debugger to
test and debug it. The Environment and the Debugger are integrated so
you can move back and forth quickly between the two when debugging
your project.
The screen shots and examples in this manual were created using example
programs based on Analog Device’s ADSP-21xxx SHARC processors and
are shown for reference only. Menu and dialog selections as well as data
that appears in windows changes depending on the processor you are
using.
The VisualDSP Debugger is the front end for all of the available Targets
and Platforms. Because the debugger is dynamic, when you attach to a different Target, the menu commands and some window displays change.
Furthermore, when you choose a different Platform or processor, other
menus, primarily the Registers and Memory menus, also change.
This section provides reference information on all VisualDSP commands,
dialogs and options that are unique to the debugger. Descriptions of standard Windows 95 commands such as File, Open, or Window, Tile, are
omitted from this manual, but are available through the debugger’s Help
VisualDSP User’s Guide for ADSP-21xxx Family DSPs
5-1
Overview
menu. This section also provides lists of all keyboard short cuts and toolbar icons. The reference is organized as follows:
• “File Menu Commands” on page 5-3
• “Session Menu Commands” on page 5-8
• “Debug Menu Commands” on page 5-29
• “Settings Menu Commands” on page 5-34
• “Register Menu Commands” on page 5-21
• “Memory Menu Commands” on page 5-23
This section uses the ADSP-21000 Simulator as the debug target but does
not describe processor-specific memory or registers. For information on
these, see the Processor’s user manual. For information on debugger
menus and commands specific to emulation, see “Emulation Setup &
Test” in Chapter 6.
5-2
VisualDSP User’s Guide for ADSP-21xxx Family DSPs
Debugger Interface Reference
File Menu Commands
The debugger File menu lets you access and load files and exit the
debugger.
Figure 5-1. File Menu
Load
Loads an executable or multiprocessor (MP) project executable file (.dxe)
into the debugger. You may invoke this command at any time during a
debug session. Select the file to load in the Open a Processor Program
dialog.
When you load an MP project, the Load Multiprocessor Confirmation
dialog opens (Figure 5-2 on page 5-4). From this dialog, you can confirm
that the correct program is loaded into the correct processor, or, by clicking the Scan button you can scan any MP executable to load into the
processors in your MP project.
VisualDSP User’s Guide for ADSP-21xxx Family DSPs
5-3
File Menu Commands
Ellipse Button
Click here to confirm or change
the executable for this processor
Click here to scan executable
files for MP projects
Figure 5-2. Load Multiprocessor Confirmation Dialog
When you click the Scan button, the Select a processor Program to
Scan opens. Select the MP executable file for your debug session and click
OK.
Figure 5-3. Select a processor Program to Scan
5-4
VisualDSP User’s Guide for ADSP-21xxx Family DSPs
Debugger Interface Reference
When you do this, the Select a Processor to Load dialog lets you confirm the executable you select is loaded into the correct processor.
Figure 5-4. Select a Processor to Load Dialog
Note that when you start the debugger from the Environment, the debugger automatically loads the current project’s executable file.
• Keyboard Short cut:
C+ l
• Accelerator Keys:
A f l
Open a Processor Program Dialog
Use this dialog to select and load an executable or multiprocessor project
executable (.dxe) program.
VisualDSP User’s Guide for ADSP-21xxx Family DSPs
5-5
File Menu Commands
Load Symbols
Loads only an executable file's (.dxe) symbols. This command is useful
when you have a ROM-coded target and only want to view your codes’
labels in memory windows. Select the file to load in the Load a Processor
Program's Symbols dialog.
• Accelerator Keys:
A f s
Load a Processor Program's Symbols Dialog
Use this dialog to load an executable file's symbols.
Open
Opens any file. Use this command to open any source or other text file
while debugging.
• Accelerator Keys:
A f o
• Keyboard Short cut:
C
+
o
File Open Dialog
Use this dialog to open any file.
Recent Files
Lists the last four source/program/layouts. These files and settings may be
reloaded by selecting the name from this list.
5-6
VisualDSP User’s Guide for ADSP-21xxx Family DSPs
Debugger Interface Reference
Save/Load Layout
Saves the screen layout of the current debug session. Use these commands
to save and restore the Windows setup of the current session. This command does not load the DSP program. You must reload the executable file
to continue debugging.
VisualDSP User’s Guide for ADSP-21xxx Family DSPs
5-7
Session Menu Commands
Session Menu Commands
The Session menu lets you manage multiple debugging sessions. You can
start a new session, select between current sessions, and clear or delete sessions. You may have as many sessions open as your system’s memory can
handle. Sessions are saved on exit. For more information, see “Defining
Debugger Sessions” in Chapter 4.
The Sessions menu has the following commands:
Figure 5-5. Session Menu
• Accelerator Keys:
5-8
A s
VisualDSP User’s Guide for ADSP-21xxx Family DSPs
Debugger Interface Reference
New Session
Starts a new debug session. Use the Target
attributes.
Selection
dialog to set session
Figure 5-6. Target Selection Dialog
• Accelerator Keys:
A s n
Select Session
Select a debug session from the list of currently active sessions.
• Accelerator Keys:
A s s
VisualDSP User’s Guide for ADSP-21xxx Family DSPs
5-9
Session Menu Commands
Session List
Provides commands that let you manage your debug sessions. In this dialog you can delete, delete all, activate previous sessions, and view and edit
multiprocessor sessions.
Figure 5-7. Session List Dialog
• Accelerator Keys:
5-10
A s c
VisualDSP User’s Guide for ADSP-21xxx Family DSPs
Debugger Interface Reference
View Menu Commands
Use the View menu to control the information displayed in the debugger
windows, to open new windows, and to find text or go to a memory
address.
Figure 5-8. View Menu
• Accelerator Keys:
A v
Output Window
Opens the debugger’s output window. The output window displays
debugger status and error messages. This window also acts as an interface
to Tcl, which runs in the debugger. For more information, see “Tcl
Scripting” on page A-1. All status and error messages written to the output
window are saved to the text file
C:\Program Files\VisualDSP\Data\VisualDSP_log.txt.
This file is appended for all sessions so you may want to occasionally open
this file and delete parts or all of it.
VisualDSP User’s Guide for ADSP-21xxx Family DSPs
5-11
View Menu Commands
The output window has a short cut menu which controls its properties:
Fixes the window to
the bottom of the GUI
Closes the window
Clears all of the text
in the window
Lets you move the window
around the GUI
Figure 5-9. Output Window Short Cut Menu
• Accelerator Keys:
A v o
Debug Windows
Provides access to the following windows.
Disassembly Window
Opens a window that displays your code in disassembled form. The disassembly window displays a letter denoting the instruction pipeline
operation being executed. These letters are located at the left of the disassembly window and are as follows:
5-12
•
A
= Abort
•
>
= Execute
•
D
= Decode
•
F
= Fetch
VisualDSP User’s Guide for ADSP-21xxx Family DSPs
Debugger Interface Reference
Figure 5-10. Disassembly Window
• Accelerator Keys:
A v d d
Execution Trace Window
Displays a history of processor activity during program execution. Use the
Settings, Trace command to enable program trace and to set a trace
depth. Right click in this window to display a short cut menu.
1
2
3
4
Figure 5-11. Trace Window and Short Cut Menu
VisualDSP User’s Guide for ADSP-21xxx Family DSPs
5-13
View Menu Commands
The Execution
Trace
window displays the following information:
1. The buffer depth (instruction lines) you set in the Trace
Depth dialog.
Buffer
2. The cycle count.
3. Instructions executed such as memory fetches, program memory
writes, and data/memory transfers.
Profile Window
Displays the results of the profile session that you set up from the Settings, Profile menu command. The window fields are described in
Table 5-1.
Figure 5-12. Profile Window
Table 5-1. Profile Window Descriptions
Window Field
Description
Start Addr
Starting address of this profile range (in hexadecimal value or symbol
name).
End Addr
Ending address of this profile range (in hexadecimal value or symbol
name).
5-14
VisualDSP User’s Guide for ADSP-21xxx Family DSPs
Debugger Interface Reference
Table 5-1. Profile Window Descriptions (Cont’d)
Window Field
Description
Memory
Memory type
Exec%
Percent of time spent executing the current range
Exec Count
Number of instructions executed in the current range
Read Count
Number of memory locations read in the current range, including instruction fetches
Write Count
Number of locations written to in the current range
• Accelerator Keys:
A v d p
Locals Window
Displays all local variables within a function. Use this window with the
step or halt commands to display variables as you move through your program. Complex variables appear with a + sign. You can click on the plus
sign to display all variable information. Right click in this window to display a short cut menu.
VisualDSP User’s Guide for ADSP-21xxx Family DSPs
5-15
View Menu Commands
register value warning*
*The expression relies on a register value that may be incorrect
because of the way registers are saved and restored on the stack.
This is an issue only when changing the debugger’s context
with the Call Stack window.
Figure 5-13. Locals Window and Short Cut Menu
• Accelerator Keys:
A v d l
Expressions Window
Lets you enter an expression to evaluate in your program. There are three
types of expressions you can enter in this window:
1. Memory addresses
Memory addresses can be either data (DM) or program (PM) and,
either 16, 32, 48, or 64-bit addresses depending on the memory
type and processor target. Memory identifiers must be preceded
with a $ sign (for example $dm16(0x2000))
5-16
VisualDSP User’s Guide for ADSP-21xxx Family DSPs
Debugger Interface Reference
2. Register expressions
All register names must be preceded by a $ sign (for example, $r0).
3. C statements using standard C arithmetic and logical operators.
Right click in this window to display a short cut menu.
C expression
Logical C expression
register
memory
register value warning*
*The expression relies on a register value that may be incorrect
because of the way registers are saved and restored on the stack.
This is an issue only when changing the debugger’s context
with the Call Stack window.
Figure 5-14. Expressions Window and Short Cut Menu
• Accelerator Keys:
A v d e
VisualDSP User’s Guide for ADSP-21xxx Family DSPs
5-17
View Menu Commands
Call Stack Window
Lets you double click on a stack location and have the debugger move the
call stack back to that previous debug context. This window only functions with C code.
Figure 5-15. Call Stack Window
• Accelerator Keys:
A v d c
Source Window
Opens the executable file’s source file.
Find
Search for a specific text line in the active source, disassembly or memory
window. Use the Find Text dialog to specify the text for the search.
5-18
• Keyboard Short cut
C+ f
• Accelerator Keys:
A v f
VisualDSP User’s Guide for ADSP-21xxx Family DSPs
Debugger Interface Reference
Find Text Dialog
Finds a text string in an active memory, source, or disassembly window.
Character strings in the disassembly or source windows are case sensitive.
If you enter incorrect search parameters or the search item was not found,
a prompt appears in the output window and asks if you want to continue
searching. The prompt also provides the location where the search
stopped.
Figure 5-16. Find Text dialog
Find Again
Repeat the previous find command. Use the keyboard short cut # to
continue searching.
• Accelerator Keys:
A v a
• Keyboard Short cut:
#
Go To Address
Go to a specific DSP memory address in an active window. Enter the
address in the Go To address dialog. You can enter an address in
VisualDSP User’s Guide for ADSP-21xxx Family DSPs
5-19
View Menu Commands
hexidecimal or integer (the debugger appends the 0x prefix). This command is also available in many debugger windows via menu short cuts.
• Accelerator Keys:
A v g
• Keyboard Short cut:
C+ g
Go to address Dialog
Enter the absolute DSP memory address or browse symbols in active window. Addresses are hexadecimal and must include the 0x prefix. Use the
Browse button to locate and select symbols.
Enter an address,
line number, or symbol name
Browse through symbols
in an active window
Figure 5-17. Go To Address Dialog
5-20
VisualDSP User’s Guide for ADSP-21xxx Family DSPs
Debugger Interface Reference
Register Menu Commands
Because the debugger lets you connect to different targets and simulate
many different processors, some menus and dialogs are dynamic; they display options and commands unique to that processor. Register and
memory menus change depending on the processor or target being
debugged.
The following sections describe the commands that always appear in these
menus; for descriptions of specific processor memory and registers, refer
to that processor’s chip manual and data sheet. For descriptions of hardware targets, see the documentation that accompanies that target.
The Register menu provides access to all processor registers. You can
view and modify the register values during a debug session without effecting the source code. For more information, see “Register Window
Operations” in Chapter 4.
Custom
Use the Custom command to customize a register window. This is done in
the Select Registers to Display in a Window dialog. Only registers
specific to the target processor are available. The custom display is not
saved on exit from the debugger.
• Accelerator Keys:
A r 1
Select Registers to Display in a Window Dialog
In the dialog, click on the register you wish to monitor and then press Add
to select a register to display or click on Remove to delete a displayed register. After you complete your register selections, type in a name for the
VisualDSP User’s Guide for ADSP-21xxx Family DSPs
5-21
Register Menu Commands
display in Title of
exit the debugger.
Window
dialog field. This setup is not saved when you
Figure 5-18. Select Registers to Display in a Window
5-22
VisualDSP User’s Guide for ADSP-21xxx Family DSPs
Debugger Interface Reference
Memory Menu Commands
Because the debugger lets you connect to different targets and simulate
many different processors, some menus and dialogs are dynamic; they display options and commands unique to that processor. Register and
memory menus change depending on the processor or target being
debugged.
The following sections describe the commands that always appear in these
menus; for descriptions of specific processor memory and registers, refer
to that processor’s chip manual and data sheet. For descriptions of hardware targets, see the documentation that accompanies that target.
The Memory menu provides access to memory windows and the Fill, Dump,
Memory Map and Plot Memory dialogs. You can use these commands to
modify memory during a debug session without effecting you source code.
For more information, see “Memory Window Operations” in Chapter 4.
Figure 5-19. Memory Menu
• Accelerator Keys:
A m
VisualDSP User’s Guide for ADSP-21xxx Family DSPs
5-23
Memory Menu Commands
Fill
Opens the Fill Memory dialog. This dialog lets you fill program or data
memory from a file. You can also fill a range of memory with a value, such
as 0, in order to clear a buffer.
• Accelerator Keys:
A m f
Fill Memory Command Dialog
Fills a range of memory in an active data or program memory window.
You may fill from a file or enter a value in the value field.
Figure 5-20. Fill Memory Dialog
Table 5-2. Fill Memory Dialog Field Descriptions
Field
Description
File Name
Use the Browse button to select the path and data (.dat) file from which to fill
memory.
Browse
Opens the Select Input File name For memory Fill dialog. See File name above.
Value
Fills memory with a single value (not from a file).
5-24
VisualDSP User’s Guide for ADSP-21xxx Family DSPs
Debugger Interface Reference
Table 5-2. Fill Memory Dialog Field Descriptions (Cont’d)
Field
Description
Address
Starting address of memory fill.
Memory
Memory type to fill.
Count
The number of addresses to fill.
Stride
The number of addresses between fills.
Dump
Opens the Dump Memory dialog. To dump memory to a file, check the Dump
to a File box. Otherwise, memory is dumped to the Output window.
•
Accelerator Keys:
A m d
Dump Memory Command Dialog
Dumps memory from an active program or data memory window. Check
the Dump to a File box and use the Browse button to navigate to an existing file or to enter a new file name in the File Name field in the dialog. If
the Dump to a File box is not checked, the debugger dumps the selected
memory to the Output window. Descriptions of the dialog fields are in
Table 5-3 on page 5-26.
VisualDSP User’s Guide for ADSP-21xxx Family DSPs
5-25
Memory Menu Commands
Figure 5-21. Dump Memory Dialog
Table 5-3. Dump Memory Dialog Field Descriptions
Field
Description
Address
Address to start removing memory.
File Name
Use the Browse button to select the path and data (.dat) file to dump memory to.
Browse
Opens the Select Input File name For memory Dump dialog. See File name
above.
Memory
Memory type.
Format
The number format of the memory.
Count
The number of addresses to dump.
Stride
The number of addresses between dump locations.
Write Format to File
Controls the data format is written to the file (see Format above). This lets the
debugger read the data back into the file using the correct format. If you uncheck
this box, the format is not be written to the file. All of the data is then written to
the file in ASCII with one memory item on a line.
5-26
VisualDSP User’s Guide for ADSP-21xxx Family DSPs
Debugger Interface Reference
Plot
Opens the Plot Configuration dialog from which you can graphically
plot a range of memory.
•
Accelerator Keys:
A m d
Plot Configuration Dialog
Sets up the parameters of the memory plot you want to generate. Descriptions of the dialog fields are in Table 5-4.
Figure 5-22. Plot Configuration Dialog
Table 5-4. Plot Memory Dialog Field Descriptions
Field
Description
Address
Memory address to start plotting from.
Stride
The number of addresses between plotted addresses. Unlike the Dump command
which uses absolute address, the stride field in the plot works with two variables;
word length and data type.
Data
Data type that the plotted memory represents.
VisualDSP User’s Guide for ADSP-21xxx Family DSPs
5-27
Memory Menu Commands
Table 5-4. Plot Memory Dialog Field Descriptions (Cont’d)
Field
Description
Count
The number of addresses to plot.
Memory
Memory type to plot.
Format
Format of DSP transformation applied to the converted memory.
Memory Map
Displays the memory map of the processor you selected.
Figure 5-23. Memory Map Dialog
• Accelerator Keys:
5-28
A m m
VisualDSP User’s Guide for ADSP-21xxx Family DSPs
Debugger Interface Reference
Debug Menu Commands
Use the Debug menu to control program execution. The Debug menu contains the following commands:
Figure 5-24. Debug Menu
• Accelerator Keys:
A d
Run
Runs your executable file. The program runs until some event stops it,
such as hitting a breakpoint, watch point or user halt command. When
the debugger is halted, all windows are updated to current addresses and
values.
• Accelerator Keys:
A d r
• Keyboard Short cuts:
%
VisualDSP User’s Guide for ADSP-21xxx Family DSPs
5-29
Debug Menu Commands
Halt
Stops program execution. All windows are updated after the program
actually halts. Register values that have changed are highlighted and the
status bar displays the address where your program has halted.
• Accelerator Keys:
A d h
Run To Cursor
Runs your program to the line where you left your cursor.
• Accelerator Keys:
A d c
Step Over
Steps one source line. If the source line calls any function, these functions
are executed in their entirety. This function is available in C only.
• Accelerator Keys:
A d o
• Keyboard Short cut:
)
Step Into
Step through your program one source or assembly code line at a time. As
you step, instructions are executed and windows updated.
5-30
• Accelerator Keys:
A d s
• Keyboard Short cut:
_
VisualDSP User’s Guide for ADSP-21xxx Family DSPs
Debugger Interface Reference
Step Out Of
Steps until the current function has returned to its caller. This function is
available in C only.
• Accelerator Keys
A d f
• Keyboard Short cut:
A_
Reset
Resets the target to a known state. When you are connected to a hardware
platform, reset acts like pulling the reset pin low. The contents of processor memory changes, and you must reload your program into the target.
• Accelerator Keys:
A d e
Restart
Sets your program to the first address of the interrupt vector table. In the
simulator, this works like reset, except that the target's memory does not
change. All registers are reset to 0.
• Accelerator Keys:
A d a
VisualDSP User’s Guide for ADSP-21xxx Family DSPs
5-31
Multiprocessor
Multiprocessor
Opens a submenu that contains debug commands in a multiprocessor system. The MP commands work exactly like the single processor commands
except that they work synchronously on all active processors in your MP
session. Note that you can use pinning, or the individual processor tabs in
the Output window, in conjunction with the single Debug commands to
debug individual processors in an MP session.
Multiprocessor Run
Runs all selected processors until some event such as a breakpoint or a halt
command stops execution.
• Accelerator Keys:
A d m r
• Keyboard Short cut:
A%
Multiprocessor Halt
Stops program execution in all selected processors.
• Accelerator Keys:
A d m h
Multiprocessor Step
Steps through program code on all selected programs one line at a time.
5-32
• Accelerator Keys:
A d m s
• Keyboard Short cut:
A_
VisualDSP User’s Guide for ADSP-21xxx Family DSPs
Debugger Interface Reference
Multiprocessor Restart
Resets and reloads the programs in all selected processors and runs to main
(if selected) from the first address of the interrupt vector table.
• Accelerator Keys:
A d m e
Multiprocessor Reset
Resets all processor registers to a known state. This command does not
affect processor memory; you do not need to reload the programs after
using this command.
• Accelerator Keys:
A d m a
VisualDSP User’s Guide for ADSP-21xxx Family DSPs
5-33
Settings Menu Commands
Settings Menu Commands
The Settings menu lets you access commands that analyze the runtime
behavior of your DSP program and enable I/O capabilities, and simulate
source to target data streaming.
• Accelerator Keys:
A t
Figure 5-25. Settings Menu
Trace
Trace instructions in program memory. This command invokes the Trace
sub menu. For more information, see “Following Program Execution
(Trace)” on page 4-16.
• Accelerator Keys
5-34
A t t
VisualDSP User’s Guide for ADSP-21xxx Family DSPs
Debugger Interface Reference
Set Trace Depth
• Invokes the Trace Buffer Depth dialog. Set depth of trace (number
of instructions) in the Custom Depth field. Use the default value of
0 to set maximum depth (limited by your system’s virtual memory).
Select Maximum Trace Depth to choose a maximum trace.
Figure 5-26. Trace Buffer Depth Dialog
• Accelerator Keys:
A t t d
Clear Trace
Clears the trace you set up.
• Accelerator Keys:
A t t c
Enable Trace
The debugger’s default setting is Trace
Enable Trace to use this feature.
• Accelerator Keys:
disabled,
so you must select
A t t e
Profile
Profiles your DSP executable program’s runtime behavior. This function
helps you find areas of code that may be optimized for better performance.
VisualDSP User’s Guide for ADSP-21xxx Family DSPs
5-35
Settings Menu Commands
The Profile command invokes the Profile menu. For more information,
see “Optimizing Code Operation (Profile)” on page 4-19.
A t p
• Accelerator Keys:
Add/Remove Profile Ranges
Invokes the Profile
page 5-37.
Ranges
dialog. For an example, see Figure 5-27 on
A t p
• Accelerator Keys:
Reset Profile Information
Clears the profile information from the last profile session, so you can
rerun the session.
• Accelerator Keys:
A t p r
Enable Profiling
You must select Enable
• Accelerator Keys:
5-36
Profiling
to use the Profile feature.
A t p e
VisualDSP User’s Guide for ADSP-21xxx Family DSPs
Debugger Interface Reference
Profile Ranges Dialog
Sets up a profile session. Addresses may be represented as symbols or hexadecimal numbers. Select Browse to choose program memory labels. Profile
results and ranges are not saved when you exit the debugger.
Figure 5-27. Profile Ranges Dialog
To use the profiler, you must perform the following steps:
1. Define the memory type to profile: either PM or DM.
2. Select a Start and End
3.
Add
address
range to profile.
these addresses to the profile session.
4. Enable profiling through the Settings,
command.
Profile, Enable
5. Run your program to collect the data from the beginning.
The profile window (see View, Debug Windows,
is updated with the results of the session.
Profile
command)
VisualDSP User’s Guide for ADSP-21xxx Family DSPs
5-37
Settings Menu Commands
Breakpoints
Opens the Breaks dialog. Use this dialog as to manage break points in
your executable program. Breaks may be set at any address in program
memory and you can set up to a maximum of 28 breakpoints. Program
execution halts at the address just prior to the breakpoint.
• Accelerator Keys:
A t b
Figure 5-28. Breaks Dialog
Watch Points
Works like break points except that watch points trap on a specified condition. You can set memory watch points in registers, stacks, or memory
ranges. When the condition is reached, the debugger halts and updates all
registers. There are three dialogs that define watch points, Registers
(Figure 5-29), Hardware Stacks (Figure 5-30), and Memory
(Figure 5-31). The following figures and tables show and explain the various watch points you can use.
5-38
VisualDSP User’s Guide for ADSP-21xxx Family DSPs
Debugger Interface Reference
To set up any memory watch point, you must do the following steps:
1. Define a memory range and a memory type to watch.
2. Choose to watch memory locations inside or outside the range.
3. Choose the halt conditions.
4. Press the Add button.
Figure 5-29. Watch Point Registers Dialog
VisualDSP User’s Guide for ADSP-21xxx Family DSPs
5-39
Settings Menu Commands
Watch Points, Register
dialog fields are described below:
Table 5-5. Watch Points, Register Dialog Fields
Dialog Field
Description
Register List
The scroll list provides access to all available ADSP-21xxx registers.
Click on the + symbol to expand the register list.
Watch For Read
Halt the target when undefined value, any value, or a specific value
from a specified register is read from the register.
Watch For Write
Halt the target when undefined value, any value, or a specific value
from a specified register is written from the register.
Add, Edit, Delete
Use these buttons to manage the watch points list.
5-40
VisualDSP User’s Guide for ADSP-21xxx Family DSPs
Debugger Interface Reference
Figure 5-30. Watch Points Hardware Stacks Dialog
Watch Points, Hardware Stacks
dialog fields are described in Table 5-6.
Table 5-6. Watch Points, Hardware Stacks Dialog Fields
Dialog Field
Description
Watch For Pop
Halt the target when undefined memory, any value, or a specific
value is popped from a specified stack.
Watch For Push
Halt the target when undefined memory, any value, or a specific
value is pushed onto the specified stack.
VisualDSP User’s Guide for ADSP-21xxx Family DSPs
5-41
Settings Menu Commands
Table 5-6. Watch Points, Hardware Stacks Dialog Fields (Cont’d)
Dialog Field
Description
Read Underflow
Halt the target when an underflow occurs while reading from the
specified stack.
Write Overflow
Halt the target when an overflow occurs while writing to the specified stack.
Add, Edit, Delete
Use these buttons to manage the watch points list.
Figure 5-31. Watch Points, Memory Dialog
5-42
VisualDSP User’s Guide for ADSP-21xxx Family DSPs
Debugger Interface Reference
The Watch
Points, Memory
dialog fields are described in Table 5-7.
Table 5-7. Watch Points, Memory Dialog Fields
Dialog Field
Description
Watch For
Select the memory type (either DM or PM) from the list. Select the
memory range in the From Address and To Address fields. Allowable
memory range is shown in the Address Limits field.
Inclusive
Watch memory locations including end points.
Exclusive
Watch memory locations excluding end points.
Watch For Read
Halt the target when undefined memory, any value or a specific value is
read from the specified memory range.
Watch For Write
Halt the target when undefined memory, any value or a specific value is
written to the specified memory range.
Add, Edit, Delete
Use these buttons to manage the watch points list.
• Accelerator Keys:
A t w
Interrupts
Simulate external interrupts in your program. When you use interrupts
with watch points and streams, your program simulates real world operation of your DSP system.
• Accelerator Keys:
A t i
Interrupt Timing Dialog
Selects the timing of the interrupt you want to generate in the External
Interrupts field. For complete information on external interrupt pins, see
VisualDSP User’s Guide for ADSP-21xxx Family DSPs
5-43
Settings Menu Commands
the processor user manual for the processor you are debugging. The dialog
fields are described in Table 5-8 on page 5-44.
Figure 5-32. Interrupt Timing Dialog
• Accelerator Keys:
A t i
Table 5-8. Interrupt Timing Dialog Field Descriptions
Field
Description
External Interrupts
The name of the periodic signal.
Min Cycles
Minimum interval between occurrences of interrupt signals in instruction cycles.
Max Cycles
Maximum interval between occurrences of interrupt signals in instruction cycles.
Offset Cycles
Number of instruction cycles before first interrupt is
generated (default = 0).
5-44
VisualDSP User’s Guide for ADSP-21xxx Family DSPs
Debugger Interface Reference
Table 5-8. Interrupt Timing Dialog Field Descriptions (Cont’d)
Field
Description
Interrupts:
List of configured interrupts.
Add, Remove, Remove All
These buttons let you manage the interrupts listed in the
Interrupts field.
Streams
Sets up a Serial Port (SPORT) transmit and test SPORT activity with an
external interrupt (see “Interrupts” on page 5-43). The Streams command
opens the Streams dialog.
Streams Dialog
Set up a SPORT or other I/O simulation. Streams dialog fields are
described in Table 5-9 on page 5-46. For an example of using streams, see
“Simulating Data Input/Output Operations (Streams)” on page 4-27.
VisualDSP User’s Guide for ADSP-21xxx Family DSPs
5-45
Settings Menu Commands
Figure 5-33. Streams Dialog
• Accelerator Keys:
A t s
Table 5-9. Streams Dialog Field Descriptions
Dialog Field
Description
Source
Select the source of the data stream, (a debug target or file).
Device
List of streamable devices in selected debug target.
Address
Address of memory-mapped I/O port. See Mem Type below.
Mem Type
Type of memory mapped I/O port. This field is only valid if the device
selected is a memory-mapped I/O port.
File/Browse
Invokes the Open a Source File dialog from which you can open a data
(.dat) file.
5-46
VisualDSP User’s Guide for ADSP-21xxx Family DSPs
Debugger Interface Reference
Table 5-9. Streams Dialog Field Descriptions (Cont’d)
Dialog Field
Description
Format
A number format for the data.
Circular
If checked, and end of file is reached while debugger is running, the debugger starts reading data from the beginning of the file.
Run To Main
At program load, the debugger opens a source file and runs to the function
Main (). Run To Main acts like a breakpoint at the line previous to the
function Main ().
• Accelerator Keys:
A t r
Toolbars
Controls appearance, and type of toolbar to display. The Customize dialog
lets you change the look and contents of the debugger’s standard toolbars.
Customize Dialog
Control the appearance and set up a custom toolbar. The toolbars may be
repositioned anywhere within the debugger by clicking on any space that
is not an icon and dragging the toolbar to the desired position.
VisualDSP User’s Guide for ADSP-21xxx Family DSPs
5-47
Settings Menu Commands
Figure 5-34. Customize (Toolbars) Dialog
Table 5-10. Customize Dialog Field Descriptions
Dialog Field
Description
Toolbars:
The list of all toolbars including any custom toolbars. Check a box to
display the toolbar.
Show Tooltips
When you place your cursor over a toolbar icon, a popup describes that
icon.
Cool Look
Displays toolbar buttons as a seamless toolbar.
Large Buttons
Increases toolbar button size.
5-48
VisualDSP User’s Guide for ADSP-21xxx Family DSPs
Debugger Interface Reference
Table 5-10. Customize Dialog Field Descriptions (Cont’d)
Dialog Field
Description
New...
Opens the New Toolbar dialog. This dialog lets you name and design
your new toolbar.
Reset/Delete
When you change a standard toolbar display, Reset applies the change.
To change to default settings, set up the dialog to the settings in
Figure 5-34. When you select a custom toolbar this button changes to
delete, letting you delete the selected custom toolbar.
The Customize Commands dialog lets you change the contents of selected
toolbars
Figure 5-35. Customize (Commands) Dialog
VisualDSP User’s Guide for ADSP-21xxx Family DSPs
5-49
Settings Menu Commands
Table 5-11 is the list of all toolbar icons and their actions.
Table 5-11. Debugger Toolbar
Open a new file
Find text
Repeat find text
Go to an address in memory
Context help
Start or continue current program
Restart the current program
Halt the program (processor)
Toggle break point
Clear all current breaks
Step into an instruction or line
Step over
Step out of a function or loop
Run to cursor
5-50
VisualDSP User’s Guide for ADSP-21xxx Family DSPs
Debugger Interface Reference
Table 5-11. Debugger Toolbar (Cont’d)
Open the Expressions window
Open a locals window
Open the call stack window
Open a disassembly window
• Accelerator Keys:
A v t
Short Cuts
Lets you add new or modify existing debugger short cuts. If the keyboard
short cut that you choose is already assigned, the menu command is displayed in the Assign Short cut dialog. You can override that key
assignment or remove assigned short cuts by selecting a short cut from the
Assigned Short cuts list and pressing the remove button.
Show Target Halted Message Box
The Target Halted message is displayed whenever your target halts. This
command turns on/off this message.
Load Sim Loader
Opens a submenu which contains the following commands. For more
information, see “Loader Dialog Options” in Chapter 3.
VisualDSP User’s Guide for ADSP-21xxx Family DSPs
5-51
Settings Menu Commands
Boot from Host
Sets your DSP system to boot from a simulated host processor. To do this,
you must set the correct options in the IDE loader dialog. An example can
be found in “Simulating Processor Booting” on page 4-32.
Boot from PROM
Sets your DSP system to boot from a simulated PROM. To do this, you
must set the correct options in the IDE loader dialog. An example can be
found in “Simulating Processor Booting” on page 4-32.
Enable Stdio Support
The debugger supports several standard primitive I/O functions such as
open, read, write, and limited printf. If you turn this selection off, your
program does not output results to the Output window or a file. For more
information, see the C Compiler and Library Manual for ADSP-21xxx
Family DSPs.
• Accelerator Keys
A t s
Emulator Commands
The following commands appear in the Settings menu when the Debug
Target you select (see Figure 5-6 on page 5-9) is an ADSP-21000 JTAG
Emulator.
5-52
VisualDSP User’s Guide for ADSP-21xxx Family DSPs
Debugger Interface Reference
Target Options Command
Opens the Target
Table 5-12.
Options
dialog. The dialog fields are described in
Figure 5-36. Target Options Dialog
Table 5-12. Target Options Dialog Field Descriptions
Dialog Field
Description
Stop I/O DMA
Disable I/O DMA while the emulator has control of the DSP.
Stop External
Port (EP) Bus
Access
Disable EP Bus access while the emulator has control of the DSP.
VisualDSP User’s Guide for ADSP-21xxx Family DSPs
5-53
Settings Menu Commands
Table 5-12. Target Options Dialog Field Descriptions (Cont’d)
Dialog Field
Description
On Emulator
Exit
When you exit the emulator/DSP session, this field determines the state the
DSP is left in when the software releases control. Choices are as follows:
Reset before
loading
executable
•
Reset DSP and Run
•
Run from current PC This halts the DSP (if necessary) and then
resumes DSP operation at the current PC.
Resets the DSP and starts program execution at
the reset vector (0x80005-21065L,
0x200005-2106x).
When you load a DSP executable file with the File, Load command, this
check box controls whether or not the DSP is reset prior to the load. Use this
option when the DSP registers must not be changed to their reset condition
when a file load occurs.
For example, when external program memory accesses that require the
SYSCON and WAIT (plus the IOCTL and SDRDIV for the
ADSP-21065L) registers to be correct before a load begins. In this case, you
should 1) reset the chip, 2) modify the registers to enable external memory
access, 3) make sure this flag is not checked, 4) load the program, and 5) run
the program.
To use external memory or to load programs into external memory, the
SYSCON and WAIT registers must be set. To do this:
1. Start the debugger (Do NOT load a program).
2. From the Settings menu, select Target
Options.
3. In the Target Options dialog (Figure 5-36 on page 5-53), uncheck
the Reset before Loading Executable check box.
4. From the Debug menu, select Reset.
5. From the Register menu, open the SYSCON (plus the IOCTL
and SDRDIV for the ADSP-21065L) registers and change the
SYSCON MSIZE bits and the WAIT register bits appropriately.
5-54
VisualDSP User’s Guide for ADSP-21xxx Family DSPs
Debugger Interface Reference
6. Load your program.
Hardware Breakpoints Command
This dialog lets you enable and disable the SHARC hardware breakpoints
and is shown in the following pages. Hardware breakpoints work similarly
to watch points; you can set breaks on instructions, register reads and
writes, or data transfers within a user defined memory range. You can
choose to break on all of the defined event types in the range or to skip
any number of defined event.
Hardware breakpoints are divided into groups, which are delineated with
the tabs in the dialog. Each group has a set of common dialog attributes,
which are as follows:
Start Address, End Address — The start and end address (inclusive) that
triggers the breakpoint. To breakpoint a single address set START=END
ADDRESS.
Exclusive — If this is checked, the breakpoint occurs for access operations
outside of the START to END address (inclusive) range.
Mode — For Data and Other access breakpoints only. This determines
which modes triggers the breakpoint. Choices are:
Disabled — Disables this breakpoint.
On Write — Triggers breakpoint on Write access to the specified
memory range.
On Read — Triggers breakpoint on Read access to the specified
memory range.
Any access — Triggers breakpoint on Read/Write access to the specified memory range.
VisualDSP User’s Guide for ADSP-21xxx Family DSPs
5-55
Settings Menu Commands
Global Breakpoint Options
Skip N Breakpoint Events — Counts down each time a hardware
breakpoint condition occurs. When the count reaches zero (0), the
DSP processes the break. This counter may also be used to count the
number of times a break operation occurs. Breakpoints within the
group are OR’ed together to create this condition.
Restore Skip Count — When checked, the ICE restores the Skip
to the value it was on program RESTART. Otherwise, it
leaves it set to the current value.
Count
AND All Breakpoints — Normally each of the Group interrupts are
“OR'd” together to create a composite interrupt. With this flag
checked the DSP “ANDs” the selected breaks within the group
together.
! Hardware breakpoints do not assert until two (2) instruction cycles
AFTER the break condition occurs.
" When you use hardware breakpoints, do not place breaks at addresses
where a JUMP, CALL, or IDLE instruction would be illegal. Do not try
to place breakpoints in the last few instructions of a DO LOOP or in the
delay slots of a delayed branch. The delay slots are the instructions
between a delay branch instruction and the actual branch. For more
information on theseilleagle locations, see the chip’s user manual.
Data Breakpoints
Accesses from DAG1 or the DM() modifier are trapped by this breakpoint. Specify 2 address ranges for DM Data access breakpoints. These are
always “OR’d” to generate the Data Breakpoint condition. The data
5-56
VisualDSP User’s Guide for ADSP-21xxx Family DSPs
Debugger Interface Reference
breakpoints should be specified for breaks to internal memory (including
short word space) for IOP register access and EP and MMS accesses.
Figure 5-37. Hardware Breakpoints Dialog (Data Breaks Tab)
Instruction Breakpoints
Breakpoint occurs after a DSP instruction is executed within the addresses
specified. You may specify four different Instruction access breakpoints.
These are always “OR’d” to generate the Instruction Breakpoint
condition.
VisualDSP User’s Guide for ADSP-21xxx Family DSPs
5-57
Settings Menu Commands
Figure 5-38. Hardware Breakpoints Dialog (Instruction Breaks Tab)
Other Breakpoints
PM Data — Break occurs from accesses using DAG2 or the PM()
modifier. The PM and DM data breakpoints should be specified for
breaks to internal memory (including short word space) for IOP
register access and EP and MMS accesses.
I/O (includes DMA, MMS and host accesses) — Break occurs when
DMA, MMS, and host accesses occur.
5-58
VisualDSP User’s Guide for ADSP-21xxx Family DSPs
Debugger Interface Reference
External Port (includes core or master mode DMA accesses) —Break
occurs at external port or master mode DMA core accesses.
Figure 5-39. Hardware Breakpoints Dialog (Other Breaks Tab)
VisualDSP User’s Guide for ADSP-21xxx Family DSPs
5-59
Settings Menu Commands
All of the valid hardware breakpoints accessed through the Hardware
dialog are summarized in Table 5-13 where:
Breakpoints
RAM = Internal Random Access Memory;
Ext. = External Memory;
IOP = Input/Output registers.
Table 5-13. Valid Hardware Breakpoints
Access Type
Breakpoint
Type
Core
DMA
RAM
Ext.
IOP
DM Data
2 pins
✓
✓
✓
PM Data
1 pin
✓
✓
✓
Ext.
✓
I/O
1 pin
✓
External Port
1pin
Instruction
4 pins
1
RAM
Slave (MMS or Host)
✓
✓
IOP
RAM
Ext.
IOP
✓1
✓
✓
Note: Direct slave access of internal RAM is not available on the ADSP-21065L.
Context Help
Gets help on some portion of the VisualDSP Debugger. When you choose
the Toolbar's Context Help icon, the mouse pointer changes to an arrow
and question mark. Click anywhere in the application window, such as
another Toolbar icon. The Help topic is shown for the item you clicked.
• Keyboard Short cut:
5-60
S+!
VisualDSP User’s Guide for ADSP-21xxx Family DSPs
Debugger Interface Reference
VisualDSP Debugger Glossary
Available Registers — for information on available primary and second
processor registers, see the corresponding processor documentation.
Breaks Command — this command provides a user defined halt in an
executable program. Break points may be toggled (turned on or off) by
double clicking on a location in a memory window.
Executable File — this is a file or program is a file that has been written
and built in the VisualDSP environment.
Go To Command — this command moves the cursor to an address location in a memory window.
Librarian—The librarian is a utility that groups object files together into
library files. When you link your program, you can specify a library file
and the linker automatically link any file in the library that contains a
label used in your program. Source code is provided so you can adapt the
routines to your needs.
Linker—The linker processes separately assembled object files to create a
single executable program. It assigns memory locations to code and data in
accordance with a user-defined architecture file, a text file that describes
the memory configuration of the target system. The linker inputs one or
more object files and outputs an executable file.
Loader—The loader is a utility tool that transforms an executable file into
a boot file. For the ADSP-21xxx SHARC, the loader creates a small kernel
which is booted into internal memory at chip reset so that a program of
arbitrary size can be loaded into the ADSP-21xxx’s internal and external
memory.
Platform — this is an individual target you select. For instance, if you
have three emulators installed on your system, a platform selection might
be emulator two.
VisualDSP User’s Guide for ADSP-21xxx Family DSPs
5-61
VisualDSP Debugger Glossary
Plot Command — this command graphically plot a range of memory.
Processor — this is an individual chip contained on a specific platform
within a target.
Restart Command — this command sets your program to the first address
of the interrupt vector table. Unlike a reset, you do not need to reload
memory.
Reset Command — this command resets the processor to a known state,
clearing processor memory.
Right Click— this action opens a short cut menu in the window you have
right clicked. The short cut menus provide access to many features such as
search and changing number formats.
Simulator — the simulator executes an ADSP-21xxx executable program
in software in the same way that an ADSP-21xxx processor would in hardware. The simulator also simulates the memory and I/O devices specified
in the architecture file. The user interface lets you interactively observe
and alter the data in the processor and in memory. The simulator reads
executable files and an architecture file.
Stepping — these commands move through your source or assembly code
in various ways, letting you observe instruction execution.
Symbols — this is the label for a section, subroutine, variable, data buffer,
constant, or port name. For more information on symbols see the reference section of the related build tool documentation.
Target— this is the selected software driver that you want to use for
debugging. Options include simulators or emulators. You can have several
targets installed on your system.
5-62
VisualDSP User’s Guide for ADSP-21xxx Family DSPs